Comparing biologic persistence and healthcare costs in rheumatoid arthritis patients initiating subcutaneous biologics
Abstract
Aim: Comparing biologic persistence and healthcare costs between rheumatoid arthritis (RA) patients initiating first- or second-line subcutaneous abatacept, adalimumab, or etanercept. Materials & methods: Retrospective, observational cohort study, which included adults with RA who initiated either of the three treatments between 29 July 2011 and 1 July 2015. Total healthcare costs were measured during baseline and follow-up. Biologic persistence was compared using multivariable Cox proportional hazards regression. Results: Subcutaneous abatacept-treated patients had numerically lowest adjusted hazards of nonpersistence and increase from baseline in total healthcare costs. Sensitivity analyses measuring outcomes over an alternative follow-up definition produced consistent results. Conclusion: Abatacept-treated RA patients appeared to have the poorest health status yet often had the lowest increase from baseline in healthcare costs and longest duration of biologic persistence.
First draft submitted: 8 February 2017; Accepted for publication: 20 June 2017; Published online: 9 August 2017
Rheumatoid arthritis (RA) is a chronic, progressive autoimmune disease that affects approximately 1% of the US population [1]. Depending on the activity and prognosis of disease, pharmacological treatment of RA involves the use of conventional disease modifying antirheumatic drugs (DMARDs) or biologic agents, medication classes which are often used in combination with one another [2].
Presently, there are numerous biologics approved by the US FDA for the treatment of RA, including antitumor necrosis factor-α (anti-TNF) biologics (adalimumab, certolizumab, etanercept, golimumab, infliximab) and non-TNF biologics (abatacept, anakinra, rituximab, tocilizumab). Among the biologics that are available in the US, abatacept – a selective T-cell costimulation modulator – was the first to become available in both intravenous and subcutaneous routes of administration, with the latter route of administration being approved on 29 July 2011. Although anti-TNF biologics have historically been the preferred choice for first-line biologic treatment of RA, abatacept may be used in first-line as well as later line treatment of moderately to severely active RA in adults; it may also be used as monotherapy or concomitantly with DMARDs other than TNF antagonists [3].
Real-world (observational), comparative effectiveness data on patient outcomes such as medication persistence and healthcare costs are increasingly being used by US payers to inform decisions related to the insurance coverage of therapies [4,5]. To-date, however, no observational studies have been published in which the subcutaneous formulation of abatacept has been compared with another biologic agent with respect to biologic persistence or healthcare costs. Because subcutaneous abatacept is self-administered and covered under a prescription insurance benefit while intravenous abatacept is administered in a physician's office and covered under a medical insurance benefit, factors which may affect both biologic persistence and healthcare costs, prior studies in which intravenous abatacept has been examined may not be generalizable to the newer subcutaneous formulation of abatacept. Thus, the objective of this retrospective, observational cohort study was to compare biologic persistence and healthcare costs between RA patients initiating first- or second-line subcutaneous abatacept or one of the two most commonly used subcutaneous anti-TNF-α agents, adalimumab and etanercept.
Materials & methods
Data source
This study used US administrative claims data extracted from the Truven Health MarketScan® Commercial Claims and Encounters (Commercial) and Medicare Supplemental and Coordination of Benefits (Medicare Supplemental) databases. These databases comprise enrollment information, demographic information and inpatient medical, outpatient medical and outpatient pharmacy claims data. The Commercial database includes information for individuals who are age 65 years or younger. The Medicare supplemental database includes information for individuals who are Medicare-eligible, primarily age 65 years or older, and have a supplemental insurance paid for by their current or former employer. The data are collected from over 25 US health plans and 300 large self-insured US employers. On an annual basis during the study period, the databases contained data for over 40 million unique covered lives.
The study databases satisfy the conditions set forth in Sections 164.514 (a)-(b)1ii of the Health Insurance Portability and Accountability Act of 1996 privacy rule regarding the determination and documentation of statistically deidentified data. Because this study used only deidentified patient records and does not involve the collection, use or transmittal of individually identifiable data, Institutional Review Board approval to conduct this study was not necessary.
Patient eligibility criteria
In order to be eligible for the study, patients had to meet all of the following criteria: fill at least one outpatient prescription claim for subcutaneous abatacept, adalimumab or etanercept between 29 July 2011 (approval date of subcutaneous abatacept) and 1 July 2015 (allowing for at least 3 months of follow-up until the study end date of 30 September 2015) – the date of the first observed prescription claim for one of the subcutaneous biologics of interest was designated the ‘index date’ and the drug to which the first observed prescription claim corresponded was designated the ‘index biologic’; have continuous enrollment for 12 months before (designated ‘baseline period’) and at least 3 months after the index date; have no exposure to the index biologic during the baseline period; be at least 18 years of age as of the index date; have at least one nondiagnostic (i.e., excluding claims for services such as radiology or laboratory, which may represent a physician attempt to rule out a medical condition) medical claim with an International Classification of Diseases, 9th Revision, Clinical Modification (ICD-9-CM) diagnosis code for RA (714.0×) incurred during the baseline period. Patients were classified into the ‘first-line sample’ if they had no claims for any biologic agent before to the index date. Patients were classified into the ‘second-line sample’ if they had claims for only one biologic before to the index date and there was at least a 12-month period of continuous enrollment before to initiation of the prior biologic. Patients classified into the first-line sample, who later switched to a second-line biologic could also contribute second-line-specific data to the second-line sample. Patients who filled one prescription for intravenous abatacept before filling subsequent prescriptions for subcutaneous abatacept were considered as initiating subcutaneous abatacept, allowing for an intravenous loading dose. In these cases, the index date was set to the date of the first intravenous infusion of abatacept. For this analysis, patients were not allowed to initiate subcutaneous abatacept and subsequently change route of administration to intravenous abatacept.
Measurement of biologic persistence
Biologic persistence was defined as the period extending from the index date until the first occurrence of switch to another biologic or censoring at disenrollment from health insurance or 30 September 2015. For patients who initiated subcutaneous abatacept and subsequently changed their route of administration to intravenous abatacept, their biologic persistence was censored at the time of changing their route of administration.
Measurement of healthcare costs
This study focused on total (all-cause) healthcare costs, which included the gross covered payments for all medical and pharmacy healthcare services or products (i.e., the amount eligible for payment after applying pricing guidelines such as fee schedules and discounts, but including deductibles, copayments and coordination of benefits). Healthcare costs were measured from the payment field on adjudicated medical and pharmacy insurance claims within the database. Healthcare costs were measured during the baseline period and separately during the period of biologic persistence (follow-up). Because the follow-up could differ across patients, healthcare costs were normalized to PPPM units. Healthcare costs were expressed in 2015 constant dollars, adjusted using the Medical Care component of the Consumer Price Index [6].
Measurement of covariates
Covariates were measured to describe the study cohorts and to adjust the statistical comparisons between the subcutaneous biologics through multivariable models, as described in greater detail below. Covariates included patient demographics measured as of the index date listed in Table 1 (age group: 18–34 as reference category, 35–44, 45–54, 55–64, 65–74, 75+; sex: female as reference category; geographic region: northeast as reference category, north central, south, west, unknown; health plan type: comprehensive as reference category, exclusive provider organization, health maintenance organization, point of service, preferred provider organization, consumer-directed/high-deductible health plan, unknown; urban city-urban as reference category, rural, unknown; and Medicare eligibility: no as reference category); and clinical characteristics measured throughout the baseline period, listed in Table 2. Clinical characteristics included baseline use of conventional DMARDs (hydroxychloroquine, leflunomide, methotrexate, minocycline, sulfasalazine, azathioprine, cyclosporine, gold sodium thiomalate) and other pain/inflammation medications (glucocorticoids, nonsteroidal anti-inflammatory drugs, other analgesics), measures of baseline healthcare utilization and costs (any inpatient admission, any emergency department visit, specialist office visits, rheumatologist visits, any wheelchair, walker or cane purchase), specified comorbidities (infections, hospitalized infections, bronchiolitis, chronic obstructive pulmonary disease/asthma, diabetes, dyslipidemia, hypertension, alternative indication for biologic treatment, extraarticular disease) and previously-validated indices of general health status (Charlson Comorbidity Index, count of unique national drug codes and three-digit ICD-9 codes) and RA severity (Claims-based Index for Rhematoid Arthritis Severity) [7–9]. Missing cost estimates were set to $0, and missing demographic information was set to ‘unknown’ status for each demographic characteristic measured. Patients with missing values for other covariates were not included in multivariate models.
| Subcutaneous treatment | First-line sample | Second-line sample | ||||
|---|---|---|---|---|---|---|
| Abatacept | Adalimumab | Etanercept | Abatacept | Adalimumab | Etanercept | |
| Sample, n | 684 | 7989 | 8970 | 932 | 2486 | 1710 |
| Age in years, mean (SD) | 54.2 (12.2) | 51.3 (11.9) | 52.0 (12.2) | 54.9 (11.9) | 52.6 (12.0) | 51.7 (11.8) |
| Female, % | 85.1 | 75.4 | 76.2 | 78.4 | 79.2 | 79.5 |
| Geographic residence, % | ||||||
| Northeast | 21.8 | 15.9 | 17.7 | 16.2 | 17.6 | 15.3 |
| North Central | 17.4 | 21.5 | 21.2 | 23.2 | 22.1 | 22.0 |
| South | 38.5 | 45.3 | 40.2 | 43.6 | 39.6 | 46.2 |
| West | 21.6 | 16.0 | 19.1 | 16.6 | 19.9 | 16.1 |
| Unknown | 0.7 | 1.2 | 1.8 | 0.4 | 0.8 | 0.4 |
| Health plan type, % | ||||||
| Comprehensive | 8.2 | 6.0 | 7.0 | 12.0 | 9.3 | 7.5 |
| EPO | 0.6 | 0.9 | 1.0 | 0.8 | 1.2 | 0.9 |
| HMO | 9.1 | 10.3 | 12.0 | 9.0 | 11.1 | 11.2 |
| POS | 6.6 | 7.8 | 6.5 | 7.7 | 8.4 | 7.2 |
| PPO | 64.0 | 62.8 | 61.0 | 58.3 | 56.9 | 60.6 |
| POS with capitation | 0.6 | 0.4 | 0.5 | 0.2 | 0.4 | 0.4 |
| CDHP | 4.7 | 6.1 | 6.1 | 7.7 | 7.2 | 6.7 |
| HDHP | 3.1 | 3.4 | 3.2 | 2.4 | 3.2 | 2.9 |
| Unknown | 3.2 | 2.4 | 2.7 | 1.9 | 2.4 | 2.5 |
| Urbanicity, % | ||||||
| Urban | 86.0 | 80.7 | 81.6 | 83.9 | 83.9 | 82.6 |
| Rural | 13.3 | 18.2 | 16.8 | 15.8 | 15.5 | 17.1 |
| Unknown | 0.7 | 1.0 | 1.6 | 0.3 | 0.6 | 0.4 |
| Eligible for Medicare, % | 18.7 | 11.9 | 13.8 | 20.4 | 14.3 | 11.3 |
CDHP: Consumer-directed health plan; EPO: Exclusive provider organization; HDHP: High-deductible health plan; HMO: Health maintenance organization; POS: Point of service; PPO: Preferred provider organization; SD: Standard deviation.
| Subcutaneous treatment | First-line sample | Second-line sample | ||||
|---|---|---|---|---|---|---|
| Abatacept | Adalimumab | Etanercept | Abatacept | Adalimumab | Etanercept | |
| Sample, n | 684 | 7989 | 8970 | 932 | 2486 | 1710 |
| CIRAS, mean (SD) | 6.1 (1.8) | 6.6 (1.7) | 6.6 (1.8) | 5.9 (1.7) | 6.2 (1.8) | 6.4 (1.7) |
| Common conventional DMARDs, % | ||||||
| Hydroxychloroquine | 39.8 | 29.9 | 32.2 | 27.4 | 26.3 | 26.0 |
| Leflunomide | 20.2 | 13.8 | 14.1 | 18.7 | 16.2 | 18.1 |
| Methotrexate | 58.3 | 73.1 | 70.7 | 59.2 | 60.2 | 66.2 |
| Minocycline | 2.5 | 1.3 | 1.5 | 1.4 | 1.5 | 1.7 |
| Sulfasalazine | 13.3 | 12.1 | 12.7 | 9.0 | 10.8 | 10.8 |
| Number of different agents, mean (SD) | 1.3 (0.9) | 1.3 (0.8) | 1.3 (0.8) | 1.2 (0.8) | 1.1 (0.8) | 1.2 (0.8) |
| Rare conventional DMARDs, % | ||||||
| Azathioprine | 3.5 | 1.9 | 1.5 | 3.0 | 2.5 | 1.6 |
| Cyclosporine | 0.4 | 0.1 | 0.1 | 0.2 | 0.2 | 0.2 |
| Gold sodium thiomalate | 0.0 | 0.0 | 0.0 | 0.0 | 0.0 | 0.0 |
| Number of different agents | 0.0 (0.2) | 0.0 (0.1) | 0.0 (0.1) | 0.0 (0.2) | 0.0 (0.2) | 0.0 (0.1) |
| Other pain/inflammation medications, % | ||||||
| Glucocorticoids | 83.3 | 82.8 | 82.4 | 84.3 | 83.4 | 84.2 |
| NSAIDs | 51.0 | 57.5 | 56.3 | 47.5 | 50.0 | 52.5 |
| Other analgesics | 62.9 | 58.9 | 59.0 | 67.4 | 62.9 | 64.4 |
| Number of different agents | 2.0 (0.9) | 2.0 (0.9) | 2.0 (0.9) | 2.0 (0.8) | 2.0 (0.9) | 2.0 (0.9) |
| Charlson comorbidity index, Mean (SD) | 1.9 (1.4) | 1.5 (1.0) | 1.6 (1.1) | 1.7 (1.2) | 1.5 (1.1) | 1.5 (1.1) |
| Count of 3-digit ICD-9-CM diagnoses, mean (SD) | 18.6 (11.6) | 15.8 (9.5) | 16.1 (9.6) | 17.1 (10.3) | 16.2 (9.5) | 15.7 (9.4) |
| Count of NDCs, mean (SD) | 18.5 (11.0) | 15.8 (9.6) | 16.0 (9.7) | 19.2 (10.4) | 18.0 (9.9) | 17.8 (9.9) |
| Inpatient admission, % | 18.1 | 11.0 | 11.5 | 15.5 | 11.1 | 11.1 |
| Emergency department visit, % | 32.0 | 28.0 | 27.7 | 29.3 | 28.0 | 29.5 |
| Count of specialist office visits, mean (SD) | 1.0 (0.7) | 0.8 (0.6) | 0.8 (0.6) | 0.9 (1.2) | 0.9 (1.2) | 0.9 (1.3) |
| Count of rheumatologist visits, mean (SD) | 0.8 (1.2) | 0.8 (1.1) | 0.8 (1.1) | 1.1 (1.3) | 0.8 (1.2) | 0.9 (1.3) |
| Infection diagnosis, % | 56.7 | 47.7 | 48.4 | 55.2 | 50.8 | 52.7 |
| Hospitalized infection, % | 6.3 | 3.3 | 3.8 | 6.2 | 3.7 | 3.6 |
| Bronchiolitis diagnosis, % | 13.6 | 9.3 | 9.3 | 12.1 | 9.7 | 8.9 |
| COPD/asthma diagnosis, % | 15.9 | 10.8 | 12.1 | 13.4 | 12.2 | 12.2 |
| Diabetes diagnosis, % | 15.1 | 13.2 | 12.9 | 17.3 | 12.1 | 12.2 |
| Dyslipidemia diagnosis, % | 27.5 | 26.5 | 27.2 | 27.7 | 25.5 | 25.1 |
| Hypertension diagnosis, % | 40.8 | 35.8 | 35.1 | 40.3 | 37.4 | 36.0 |
| Extraarticular disease† diagnosis, % | 14.0 | 8.3 | 8.9 | 10.2 | 9.7 | 9.3 |
| Purchase of wheelchair, walker, or cane, % | 2.0 | 1.6 | 1.9 | 2.7 | 1.8 | 1.7 |
| Any alternative indication for biologic treatment, %‡ | 6.7 | 14.4 | 10.0 | 4.6 | 14.1 | 13.0 |
†Felty's syndrome, rheumatoid lung, rheumatoid nodules, Sjögren's syndrome or retinal vasculitis.
‡Ankylosing spondylitis, chronic lymphocytic leukemia, Crohn's disease, juvenile idiopathic arthritis, non-Hodgkin's lymphoma, plaque psoriasis, psoriatic arthritis, ulcerative colitis, polyarteritis nodosa, Wegener's granulomatosis.
CIRAS: Claims-based Rheumatoid Arthritis Severity Score; COPD: Chronic obstructive pulmonary disease; DMARD: Disease-modifying antirheumatic drug; ICD-9-CM: International Classification of Diseases, 9th Revision, Clinical Modification; NDC: National Drug Code; NSAID: Nonsteroidal antirheumatic drug; SD: Standard deviation.
Statistical analyses
Bivariate analyses were used to display summary statistics for the variable distributions, stratified by index biologic. Categorical variables were summarized by providing the proportion of patients in each of a given variable's categories. Continuous variables were summarized by providing the mean and standard deviation of a given variable's distribution.
The biologic persistence outcomes were compared across the subcutaneous biologics using multivariable Cox proportional hazards regression, adjusting for all measured patient demographics and clinical characteristics listed in Tables 1 & 2 [10]. Visual inspection of Kaplan–Meier survival curves was used to assess whether the models’ independent variables met the proportionality assumption of the Cox proportional hazards modeling approach [11].
Changes in healthcare costs from baseline to follow-up were compared across the subcutaneous biologics using a difference-in-difference analysis [12]. Difference-in-difference analysis is particularly useful when there are large baseline differences between comparators with respect to outcome measures of interest, as this method controls time-invariant patient-specific observed and unobserved confounding [13]. To implement the difference-in-difference analysis, a two-period repeated measures panel dataset was constructed with the first panel capturing PPPM total healthcare costs measured throughout the baseline period (baseline costs) and the second panel capturing PPPM total healthcare costs measured throughout the follow-up period (follow-up costs). The difference-in-difference analysis takes the change in PPPM total healthcare costs from baseline to follow-up within each subcutaneous biologic cohort (within-cohort change in costs) and then calculates the difference between the within-cohort change in costs for two comparators: difference-in-difference estimate = ([comparator follow-up costs – comparator baseline costs] – [abatacept follow-up costs – abatacept baseline costs]). To estimate and test the statistical significance of the difference-in-difference estimate, generalized estimating equations were applied to the two-period repeated measures panel dataset using an independent covariance structure, log link and gamma error distribution [14].
Adjusted predicted difference-in-difference cost estimates were obtained using R statistical software. All other analyses were performed using SAS™ Version 9.2 (NC, USA). p values <0.05 were set at the threshold for statistical significance.
Sensitivity analyses
A two-part sensitivity analysis was conducted to test an alternative assumption regarding the definition of biologic persistence. In the first part of the sensitivity analysis, biologic persistence was redefined to include a gap in a day's supply of biologic therapy ≥200% of the longest retreatment interval for the initiated biologic as an event counting as nonpersistence, in addition to the aforementioned first occurrence of switch to another biologic, or censoring at disenrollment from health insurance or 30 September 2015. In the second part of the sensitivity analysis, PPPM total healthcare costs were measured over the redefined biologic persistence period. The same statistical analyses that were conducted for the primary analyses were used for the sensitivity analysis.
Results
Patient characteristics
The study sample included 17,643 patients initiating first-line biologic treatment and 5128 patients initiating second-line biologic treatment. Table 1 displays patients’ demographic characteristics. In both the first- and second-line samples, abatacept-treated patients had the highest mean age. Table 2 displays patients’ clinical characteristics. With few exceptions, and in both the first- and second-line samples, abatacept-treated patients had the highest proportions of individuals with baseline use of conventional DMARDs and other pain/inflammation medications, highest proportions of individuals with baseline comorbidities, highest values for measures of baseline healthcare utilization and values for the indices of general health status (e.g., unique 3-digit ICD-9-CM codes) that were indicative of the poorest health. In the first- and second-line samples, respectively, 2.8 and 1.9% of abatacept-treated patients initiated through an intravenous loading dose (data not shown). These patients were subsequently included in the subcutaneous abatacept cohort.
Biologic persistence
Table 3 displays summary statistics for the unadjusted analyses of biologic persistence. Over an average duration of time from biologic initiation until nonpersistence or censoring ranging from approximately 13 to 16 months, abatacept-treated patients had the numerically lowest unadjusted incidence rates of nonpersistence in both the first- and second-line samples.
| Subcutaneous treatment | First-line sample | Second-line sample | ||||
|---|---|---|---|---|---|---|
| Abatacept | Adalimumab | Etanercept | Abatacept | Adalimumab | Etanercept | |
| Sample, n | 684 | 7989 | 8970 | 932 | 2488 | 1710 |
| Days persistent with initiated biologic | ||||||
| Mean (SD) | 450 (324) | 460 (349) | 478 (358) | 430 (338) | 394 (339) | 392 (341) |
| Median | 371 | 344 | 364 | 333 | 277 | 278 |
| Reason for end of persistence, % | ||||||
| Switch (nonpersistent) | 24.6 | 25.7 | 27.6 | 29.3 | 40.1 | 38.9 |
| Censoring† | 75.4 | 74.3 | 72.4 | 70.7 | 59.9 | 61.1 |
| Incidence rate of nonpersistence‡ | 2.0 | 2.0 | 2.1 | 2.5 | 3.7 | 3.6 |
†Disenrollment from health insurance, reaching study end date of 30 September 2015 or change in route of administration (abatacept only).
‡Per 10 person-years of observation.
Figure 1 displays the multivariable Cox proportional hazards regression-adjusted results for the primary analysis of biologic persistence. In the first-line sample, abatacept-treated patients had the numerically lowest hazards of nonpersistence, however, the results were not statistically significant. Adalimumab-treated patients had an 8% greater hazard of nonpersistence when compared with abatacept-treated patients and etanercept-treated patients had a 13% greater hazard of nonpersistence when compared with abatacept-treated patients. In the second-line sample, abatacept-treated patients had the numerically lowest hazards of nonpersistence, with differences being statistically significant in both comparisons. Adalimumab-treated patients had a 51% greater hazard of nonpersistence when compared with abatacept-treated patients and etanercept-treated patients had a 47% greater hazard of nonpersistence when compared with abatacept-treated patients.
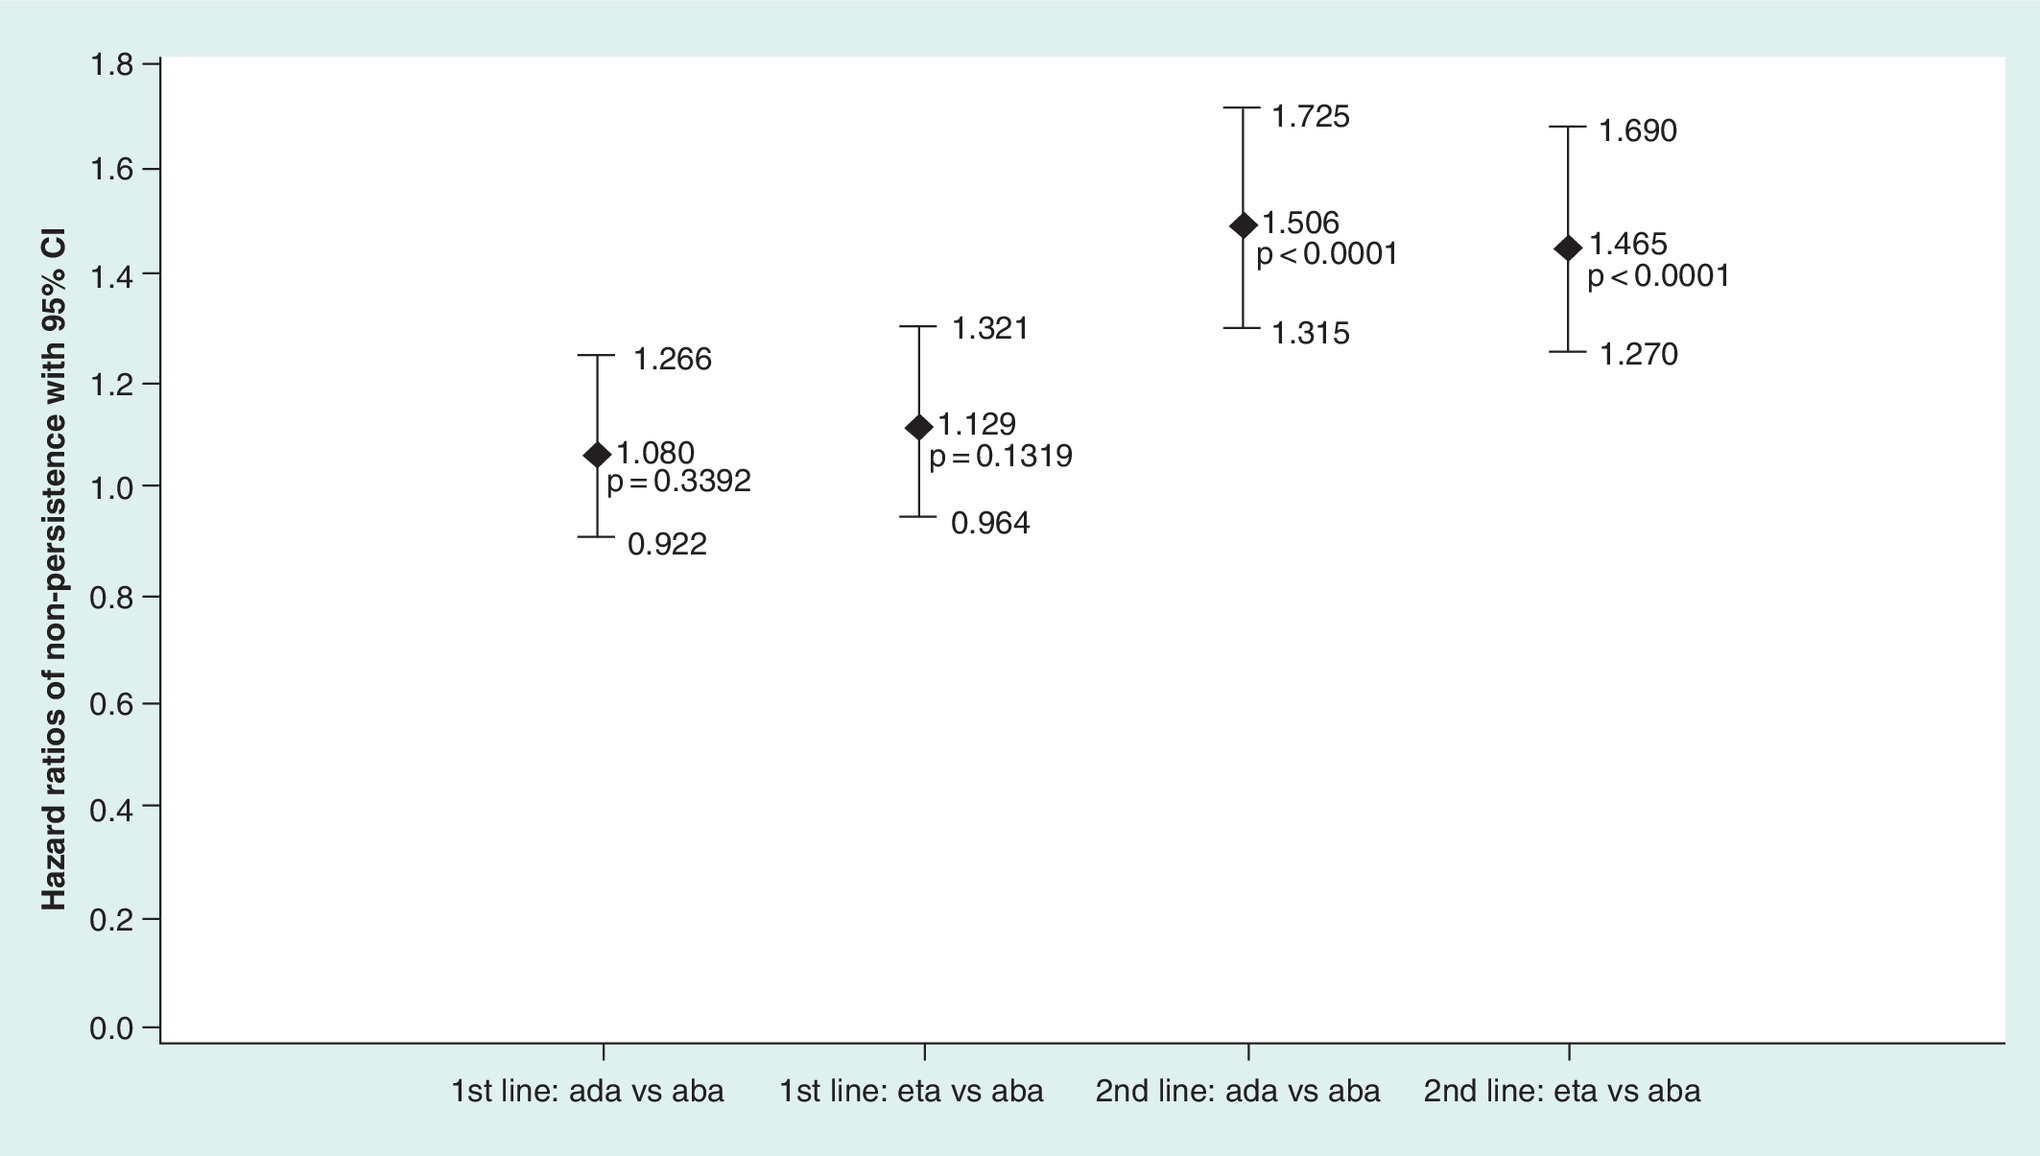
Figure 1. Multivariable Cox proportional hazards regression-adjusted† results for the primary analysis of biologic persistence.
In the sensitivity analyses wherein patients were considered to be nonpersistent if they experienced a gap in therapy ≥200% of the longest labeled retreatment interval for the initiated biologic, the results were consistent with the primary analysis in direction and statistical significance, but with an attenuation of the magnitude of differences between abatacept and adalimumab in both the first- and second-line settings and an attenuation of the magnitude of differences between SC abatacept and etanercept in the first-line setting but not the second-line setting: first-line adalimumab hazard ratio HR: 0.958; 95% CI: 0.870–1.056; p = 0.3914; first-line etanercept HR: 1.295; 95% CI: 1.176–1.425; p < 0.0001; second-line adalimumab HR: 1.177; 95% CI: 1.071–1.294; p = 0.0007; second-line etanercept HR: 1.611; 95% CI: 1.459–1.779; p < 0.0001.
Healthcare costs
Tables 4 & 5 display summary statistics for the unadjusted analyses of healthcare costs for the first- and second-line samples, respectively. In the first-line sample, abatacept-treated patients had baseline PPPM total healthcare costs that were approximately 83% higher than those of adalimumab-treated or etanercept-treated patients (e.g., $2281 abatacept/$1245 adalimumab). Although abatacept-treated patients had the highest overall costs, when considering the change in PPPM total healthcare costs from baseline to follow-up, however, abatacept-treated patients had the numerically lowest increases. In the second-line sample, the patterns of baseline PPPM total healthcare costs and changes in PPPM total healthcare costs from baseline to follow-up were similar to those observed in the first-line sample, but with smaller differences at baseline.
| Subcutaneous treatment | First-line sample for healthcare cost analysis | ||
|---|---|---|---|
| Abatacept | Adalimumab | Etanercept | |
| Sample, n | 660 | 7970 | 8937 |
| Increase in PPPM total healthcare costs from baseline to follow-up†, mean (95% CI) | $1814 ($1478–2151) | $2248 ($2183–2313) | $2141 ($2069–2213) |
| Baseline PPPM total healthcare costs, mean (95% CI) | $2281 ($2010–2552) | $1245 ($1199–1292) | $1281 ($1234–1328) |
| Follow-up PPPM total healthcare costs, mean (95% CI) | $4096 ($3772–4420) | $3493 ($3431–3556) | $3422 ($3350–3494) |
†Follow-up PPPM total healthcare costs minus baseline PPPM total healthcare costs.
PPPM: Per-patient-per-month.
| Subcutaneous treatment | Second-line sample for healthcare cost analysis† | ||
|---|---|---|---|
| Abatacept | Adalimumab | Etanercept | |
| Sample, n | 888 | 2432 | 1663 |
| Increase in PPPM total healthcare costs from baseline to follow-up‡, mean (95% CI) | $1026 ($793–1258) | $1382 ($1231–1532) | $1190 ($1033–1348) |
| Baseline PPPM total healthcare costs, mean (95% CI) | $2740 ($2582–2898) | $2527 ($2446–2608) | $2399 ($2306–2492) |
| Follow-up PPPM total healthcare costs, mean (95% CI) | $3766 ($3541–3991) | $3909 ($3755–4063) | $3589 ($3425–3753) |
†Patients with follow-up <30 days excluded from analysis.
‡Follow-up PPPM total healthcare costs minus baseline PPPM total healthcare costs.
PPPM: Per-patient-per-month.
Figure 2 displays the multivariable difference-in-difference regression-adjusted results for the primary analysis. In the first-line sample, when compared with abatacept-treated patients, adalimumab-treated patients had increases in PPPM total healthcare costs from baseline to follow-up that were $1020 higher (p < 0.0001) and etanercept-treated patients had increases that were $885 higher (p < 0.0001). In the second-line sample, when compared with abatacept-treated patients, adalimumab-treated patients had increases in PPPM total healthcare costs from baseline to follow-up that were $129 higher (p = 0.004) and etanercept-treated patients had increases that were higher $91 but only just reached statistical significance (p = 0.049).
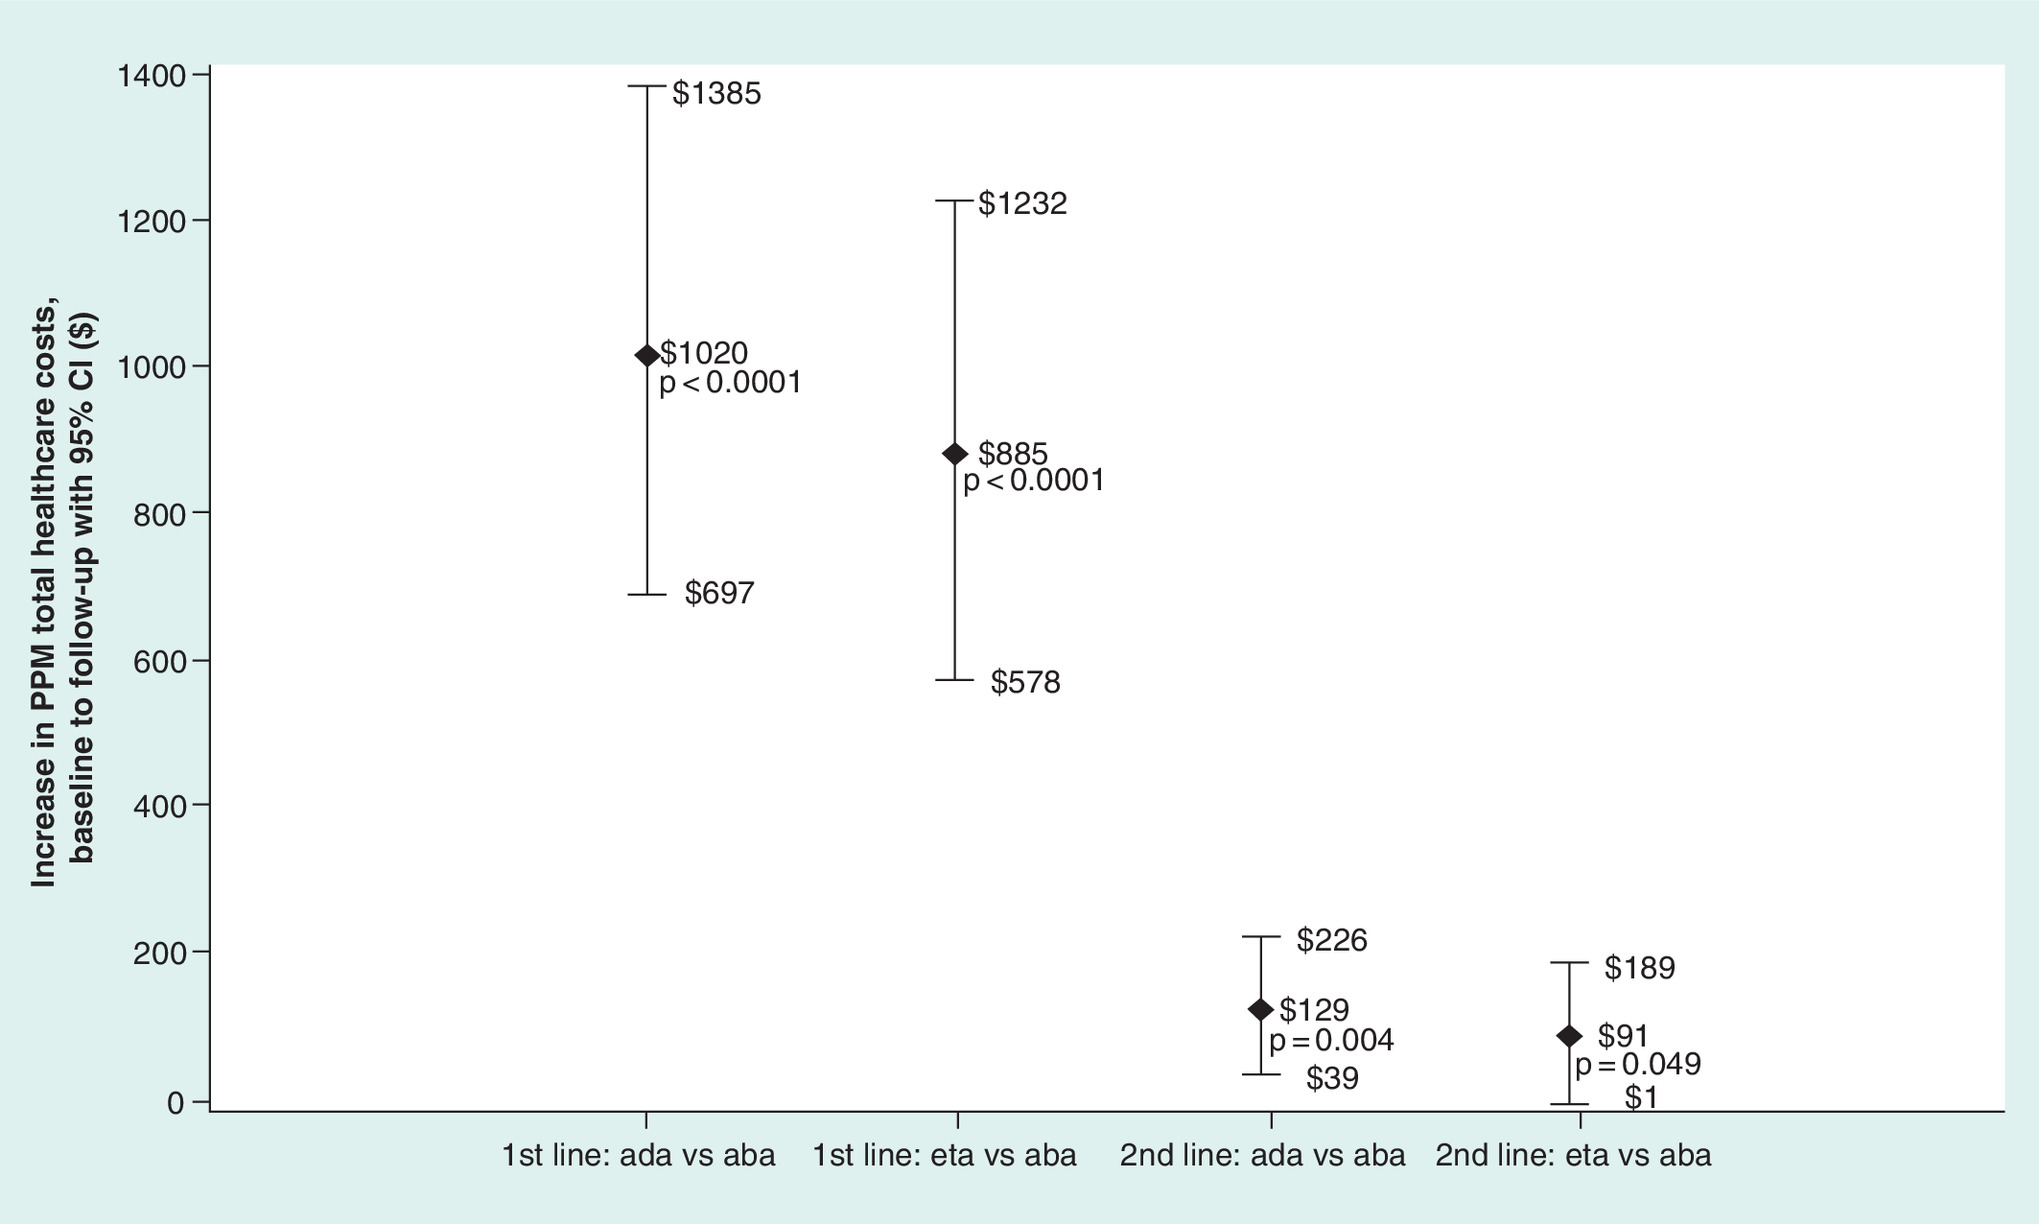
Figure 2. Multivariable regression-adjusted† results for the primary analysis.
Estimates >$0 indicate greater increases in healthcare costs for comparator versus abatacept.
†The multivariable models were adjusted through the difference-in-difference method.
PPPM: Per-patient-per-month.
In the sensitivity analyses wherein the follow-up period ended at a gap in therapy ≥200% of the longest labeled retreatment interval for the initiated biologic, the results were largely consistent with the primary analysis, but with cost differences between abatacept and its comparators being greater and with the difference between abatacept and etanercept in the second-line setting being statistically significant: first-line adalimumab $1204 higher, 95% CI: $806–1657; p < 0.001; first-line etanercept $1044 higher, 95% CI: $667–1473; p = 0.0002; second-line adalimumab $148 higher, 95% CI: $106–193; p = 0.0043; second-line etanercept $98 higher, 95% CI: $49–149; p = 0.0487.
Discussion
Based on a review of the literature, we believe that this is the first study to include subcutaneous abatacept in a real-world comparison on biologic persistence and healthcare costs. Comparing subcutaneous abatacept to the two most commonly used subcutaneous anti-TNF agents, adalimumab and etanercept, we found that patients initiating abatacept appeared to have the poorest health status yet often had had the lowest increase from baseline in healthcare costs and longest duration of biologic persistence. These results were consistent in sensitivity analyses. Although subcutaneous abatacept patients the lowest increase in total healthcare costs, they also had higher healthcare costs overall. However, this is likely related to their poorer health status.
The finding that abatacept-treated patients had similar or lower adjusted hazards of nonpersistence is significant when considering clinical recommendations and published evidence regarding the reasons for which individuals tend to switch or discontinue therapies. According to the 2012 ACR recommendations on RA management, when biologic-treated patients experience toxicity, treatment failure or lack of efficacy, a switch to another biologic therapy should be considered [2]. Using the US Consortium of Rheumatology Researchers of North America (CORRONA) database, Strand et al. (2013) studied 6209 biologic-treated RA patients and reported in a conference presentation that over 55% of individuals who discontinued or switched therapy within the first year of treatment did so due to loss of efficacy or safety concerns [15]. Using medical charts, Elkin et al. (2013) studied 176 US RA patients and reported in a conference presentation that over 86.3% of individuals who discontinued an anti-TNF as their first biologic and went on to receive a second biologic did so due to failure to maintain response, lack of initial efficacy or safety/tolerance [16]. Long-term trends in TNF use suggest that first-line therapy discontinuation (and subsequent switching to other biologic agents) has increased over calendar time, however [17]. This may lend itself to the notion that observed differences in outcomes among current patients may be related to exposure to a multitude of biologics as opposed to a single agent.
Although there are no data to which the subcutaneous abatacept findings can be compared, several prior analyses have been conducted in which adalimumab and etanercept were included. The present study found that, numerically, adalimumab-treated and etanercept-treated patients had relatively similar PPPM total healthcare costs for the baseline, follow-up, and with respect to the increase from baseline to follow-up. Prior studies have generally reported that etanercept has been associated with costs that are comparatively lower than those of adalimumab [18–22]. However, these studies used designs that differed substantially from the present study in that they often required fixed follow-up of 12 months (as opposed to examining costs over a variable-length of follow-up) and primarily reported costs specific to the biologic treatment itself as opposed to total healthcare costs. Abatacept-treated patients appeared to have the poorest health status and had substantially higher baseline healthcare costs, which suggests that it is preferentially prescribed to individuals who may have more complicated health state. We used a difference-in-difference technique to adjust for time-invariant confounding and found that increases in PPPM total healthcare costs were often the lowest for abatacept. Any future studies in which subcutaneous abatacept is compared with other subcutaneous biologics should take these baseline imbalances into account.
This study was subject to limitations. First, codes on administrative claims data are recorded by healthcare practitioners to support reimbursement, and may be incorrectly entered or omitted, which can result in measurement error. This may be especially relevant with regards to misclassification of a patient as having and being treated with anti-TNF agents for rheumatoid arthritis, as a patient's identification as having and being treated for this disease was made on the basis of evidence of such a diagnosis on a single medical claim. Second, administrative claims data do not contain clinical measures of RA disease severity that would be useful to control for potential confounding. However, our inability to directly adjust for RA severity likely biased the study results toward finding a negative result for abatacept, given that the various measures of general health status were indicative of poorer health status for abatacept-treated patients. Third, this study was unable to describe the results in the context of the subcutaneous drugs’ effectiveness in managing patients’ disease. Fourth, many potential confounding variables were included in multivariate models, potentially inducing overadjustment. Because a difference-in-difference modeling approach was used, however, and there were known large baseline differences observed between comparators with respect to outcome measures of interest, the covariate list was intentionally comprehensive in order to adjust for any potential factors that may have contributed to large observed differences in comparator groups. Finally, these results are based upon US individuals with commercial or Medicare supplemental insurance and are not generalizable to other countries or the subcomponents of the US RA population which are uninsured or covered by military or Medicaid insurance.
Conclusion
In this study of RA patients initiating first- or second-line subcutaneous abatacept, adalimumab, or etanercept, patients initiating subcutaneous abatacept appeared to have the poorest health status yet often had had the lowest increase from baseline in healthcare costs and longest duration of biologic persistence.
For patients with rheumatoid arthritis, pharmacological treatment involves the use of conventional disease modifying antirheumatic drugs or biologic agents, medication classes which are often used in combination with one another.
The numerous biologics approved by the US FDA for the treatment of rheumatoid arthritis (RA), include anti-TNF biologics (adalimumab, certolizumab, etanercept, golimumab, infliximab) and non-TNF biologics (abatacept, anakinra, rituximab, tocilizumab).
As subcutaneous abatacept is self-administered and covered under a prescription insurance benefit while intravenous abatacept is administered in a physician's office and covered under a medical insurance benefit, factors which may affect both biologic persistence and healthcare costs.
This study aimed to compare biologic persistence and healthcare costs between RA patients initiating first- or second-line subcutaneous abatacept or one of the two most commonly used subcutaneous anti-TNF-α agents, adalimumab and etanercept.
Adult RA patients included for study had initiated subcutaneous abatacept, adalimumab or etanercept between 29 July 2011 and 1 July 2015, and were continuously enrolled for 12 months before and ≥3 months after index.
Patient characteristics were measured at baseline. Total healthcare costs (medical + pharmacy) were measured during baseline and follow-up on a per-patient-per-month basis. Biologic persistence and changes in healthcare costs from baseline to follow-up were compared using multivariable regression models.
Subcutaneous abatacept-treated patients had the numerically lowest adjusted hazards of nonpersistence and numerically lowest adjusted increase from baseline in total per-patient-per-month healthcare costs. Sensitivity analyses measuring outcomes over an alternative follow-up definition produced consistent results.
The results suggest that abatacept-treated patients appeared to have the poorest health status and had substantially higher baseline healthcare costs, which suggests that it is preferentially prescribed to individuals who may have more complicated health state.
Financial & competing interests disclosure
This study was sponsored by Bristol-Myers Squibb. D McMorrow, R Fowler and D Smith are employees of Truven Health Analytics. Truven Health Analytics was paid by Bristol-Myers Squibb to conduct the study. The authors acknowledge the editorial assistance of Anna Vlahiotis of Truven Health Analytics and Kwanza Price of Bristol-Myers Squibb. A Nadkarni is an employee of Bristol-Myers Squibb. The authors have no other relevant affiliations or financial involvement with any organization or entity with a financial interest in or financial conflict with the subject matter or materials discussed in the manuscript apart from those disclosed.
No writing assistance was utilized in the production of this manuscript.
Ethical conduct of research
The authors state that they have obtained appropriate institutional review board approval or have followed the principles outlined in the Declaration of Helsinki for all human or animal experimental investigations. In addition, for investigations involving human subjects, informed consent has been obtained from the participants involved.
References
1.
Silman AJ, Hochberg MC. Epidemiology of the Rheumatic Diseases (2nd Edition). Oxford University Press, NY, USA (2001).
2.
Singh JA, Furst DE, Bharat A et al. 2012 update of the 2008 American College of Rheumatology recommendations for the use of disease-modifying antirheumatic drugs and biologic agents in the treatment of rheumatoid arthritis. Arthritis Care Res. 64(5), 625–639 (2012).
3.
Orencia®, package insert. Bristol Myers-Squibb, NJ, USA (2012).
4.
Deloitte Life Sciences. What payers want: viewing payers as customers (2009). www.deloitte.com/assets/Dcom-UnitedStates/Local%20Assets/Documents/us_lshc_WhatPayersWant_091109.pdf.
5.
Managed Care. Payers step in with ‘real-world’ comparative effectiveness research (2011). www.managedcaremag.com/archives/1106/1106.cer.html.
6.
Consumer price index detailed report tables annual average (2012). www.bls.gov/cpi/cpid12av.pdf.
7.
Fowler R, Johnston SS. Comparative performance of risk adjustment measures in a sample of commercially-insured patients under age 65 – two simple measures outperform current standards (podium presentation). Value Health 13(3), A4.t (2010).
8.
Deyo RA, Cherkin DC, Ciol MA. Adapting a clinical comorbidity index for use with ICD-9-CM administrative databases. J. Clin. Epidemiol. 45, 613–619 (1992).
9.
Ting G, Schneeweiss S, Scranton R et al. Development of a health care utilisation data-based index for rheumatoid arthritis severity: a preliminary study. Arthritis Res. Ther. 10, R95 (2008).
10.
Cox DR. Regression models and life tables. J. R. Stat. Soc. B. 34, 187–220 (1972).
11.
Hosmer DW, Lemeshow S, May S. Applied Survival Analysis: Regression Modeling of Time to Event Data (2nd Edition). Wiley, NJ, USA (2008).
12.
Shadish WR, Cook TD, Campbell DT. Experimental and Quasi-Experimental Designs for Generalized Causal Inference (2nd Edition). Cengage Learning, KY, USA (2001).
13.
Wooldridge JM. Econometric Analysis of Cross Section and Panel Data (2nd Edition). Massachusetts Institute of Technology, MA, USA (2002).
14.
Hardin JW, Hilbe JM. Generalized Estimating Equations. Chapman & Hall/CRC, FL, USA (2003).
15.
Strand V, Williams S, Miller PSJ et al. Discontinuation of biologic therapy in rheumatoid arthritis (RA): analysis from the Consortium of Rheumatology Researchers of North America (CORRONA) database [Abstract no. OP0064]. Ann. Rheum. Dis. 72, A71–A72 (2013).
16.
Elkin E, Bergman MJ, Kamath T et al. Reasons for discontinuation of biologic agents in rheumatoid arthritis patients. ACR/ARHP 2013 Annual Meeting. Abstract 1468, CA, USA, 25–30 October 2013.
17.
Simard JF, Arkema EV, Sundström A et al. Ten years with biologics: to whom do data on effectiveness and safety apply? Rheumatology (Oxford) 50(1), 204–213 (2011).
18.
Carter CT, Changolkar AK, Scott McKenzie R. Adalimumab, etanercept, and infliximab utilization patterns and drug costs among rheumatoid arthritis patients. J. Med. Econ. 15(2), 332–339 (2012).
19.
Schabert VF, Watson C, Joseph GJ et al. Costs of tumor necrosis factor blockers per treated patient using real-world drug data in a managed care population. J. Manag. Care Pharm. 19(8), 621–630 (2013).
20.
Bonafede MM, Gandra SR, Watson C et al. Cost per treated patient for etanercept, adalimumab, and infliximab across adult indications: a claims analysis. Adv. Ther. 29(3), 234–248 (2012).
21.
Ollendorf DA, Klingman D, Hazard E, Ray S. Differences in annual medication costs and rates of dosage increase between tumor necrosis factor-antagonist therapies for rheumatoid arthritis in a managed care population. Clin. Ther. 31(4), 825–835 (2009).
22.
Harrison DJ, Huang X, Globe D. Dosing patterns and costs of tumor necrosis factor inhibitor use for rheumatoid arthritis. Am. J. Health Syst. Pharm. 67(15), 1281–1287 (2010).
Information & Authors
Information
Published In
Copyright
© 2017 Future Medicine Ltd.
History
Published online: 9 August 2017
Keywords:
Topics
Authors
Metrics & Citations
Metrics
Article Usage
Article usage data only available from February 2023. Historical article usage data, showing the number of article downloads, is available upon request.
Citations
How to Cite
Comparing biologic persistence and healthcare costs in rheumatoid arthritis patients initiating subcutaneous biologics. (2017) Journal of Comparative Effectiveness Research. DOI: 10.2217/cer-2017-0010
Export citation
Select the citation format you wish to export for this article or chapter.