Evaluation of steroid toxicity using the Glucocorticoid Toxicity Index-Metabolic Domains instrument in adults with myasthenia gravis: a real-world study in the USA
Publication: Journal of Comparative Effectiveness Research
Abstract
Aim: The Glucocorticoid Toxicity Index-Metabolic Domains (GTI-MD) has been utilized to assess steroid toxicity in clinical trials and practice but has not been applied previously to large datasets. The GTI-MD was used to investigate steroid toxicity in patients with myasthenia gravis (MG) using a large real-world dataset. Materials & methods: Steroid toxicity was assessed in adults with MG (≥2 diagnoses occurring between ≥30 and ≤730 days apart) using Optum® electronic health records. Patients were categorized into steroid-initiator (MG-SI) or steroid-naive (MG-SN) cohorts. The GTI-MD algorithm assessed changes in steroid toxicity during follow-up using vital signs and simple laboratory tests pertaining to toxicity in the body mass index, blood pressure, glucose tolerance and lipid metabolism domains. Changes in steroid toxicity were reported as cumulative worsening scores (CWS) and aggregate improvement scores (AIS). Results: A total of 682 (MG-SI:377; MG-SN: 305) patients with MG were included. The potential for steroid toxicity at index date, as assessed by the GT-SNAPSHOT scores, was comparable between the cohorts at baseline (92.0 ± 31.1 vs 88.8 ± 32.8; p = 0.117). At follow-up, the MG-SI cohort had higher CWS scores than the MG-SN cohort (22.6 ± 22.8 vs 18.7 ± 21.2; p = 0.023) and were more likely to exceed the 10-point minimum clinically important difference (68% vs 59%; p = 0.016) and the 20-point threshold (44% vs 36%; p = 0.030). Patients with multiple steroid exposures had higher CWS (25.7 ± 24.8 vs 19.2 ± 19.9; p = 0.006) and AIS (9.6 ± 34.7 vs -0.3 ± 33.7; p = 0.005) values than one-time steroid users. Patients who received ≥20 mg/day of steroids (prednisone-equivalent) at index had higher CWS values (25.0 ± 23.0 vs 19.9 ± 22.3; p = 0.033) and AIS values (8.3 ± 32.9 vs 1.1 ± 35.9; p = 0.044) compared with those who received <20 mg/day of steroids. Conclusion: The GTI-MD is a valuable and sensitive method for unmasking steroid toxicity in MG using large datasets to gather real-world evidence.
Plain language summary: Using routine medical data to understand the side effects of steroids in people with myasthenia gravis
What is this article about?
This study looked at how steroids, commonly used medications, can cause side effects in people with myasthenia gravis, a rare muscle-weakening condition. The researchers used a simplified tool called the Glucocorticoid Toxicity Index-Metabolic Domains (GTI-MD), which focuses on common health measures like body weight, blood pressure, blood sugar and cholesterol, to track these side effects using real-world health records.
What were the results?
The study included over 600 people with myasthenia gravis, comparing those who began steroid treatment with those who did not. People who used steroids showed greater increases in negative health effects over time, especially in body weight. Those who took higher doses or had multiple courses of steroids experienced more side effects. The simplified GTI-MD tool was sensitive enough to detect these changes using routine health data.
What do the results mean? Why is this important?
Steroid side effects can be serious and may go unnoticed without proper monitoring. This study shows that it is possible to track steroid toxicity using everyday medical data, helping doctors spot problems early and adjust treatments to reduce harm. The findings also suggest that people starting strong or repeated steroid treatments may need closer follow-up to manage risks. This approach could be used in other diseases where steroids are commonly prescribed.
Myasthenia gravis (MG) is a chronic, rare, antibody-mediated neuromuscular autoimmune disorder characterized by peripheral motor weakness and disability in the voluntary muscles [1–3]. The global prevalence of MG varies across studies and has been reported to be within a range of 12–37/100,000 population [2–7]. Recent analyses have reported that MG affects 32–37/100,000 population and that the prevalence increases steadily with age [2,7].
Since the 1960s, steroids have been utilized in the management of MG due to their immunosuppressive and anti-inflammatory properties [8]. However, the clinical benefits of steroid therapy in immune-mediated diseases are tempered by a high incidence of drug-related adverse events (AEs) that occur in both the short- and long-term. These AEs lead to patient dissatisfaction, decrease the quality of life by imposing a substantial burden of toxicity and increase the healthcare cost across healthcare systems [9].
As in any rare disease, understanding the impact of steroids on patients with MG can be challenging. First, the relative rarity of this condition complicates the identification of a sufficiently large patient cohort for study. Second, until recently, there were few viable alternatives to steroids for treating MG, resulting in the adverse effects of these drugs being perceived as ‘necessary evils’ – the cost of achieving adequate disease control. Third, the lack of validated methods to measure steroid toxicity, a complex phenomenon, has hindered assessment [10]. Finally, advancements in large data science have only recently reached a stage where they can be applied to the study of rare diseases such as MG.
Glucocorticoid toxicity (GT) can be measured in children and adults using the STOX® suite of validated clinical outcome assessment of steroid toxicity. The core algorithm of this suite is the Glucocorticoid Toxicity Index (GTI), complemented by the GT-SNAPSHOT at baseline [11,12]. The GTI measures changes in steroid toxicity (both worsening and improvement) over time through the assessment of nine health domains (BMI, blood pressure, glucose tolerance, lipid metabolism, bone mineral density, glucocorticoid myopathy, skin toxicity, neuropsychiatric effects and infection) [11,12]. An abridged version of the GTI known as the GTI-Metabolic Domains (GTI-MD) examines only the four metabolic domains of the GTI (BMI, blood pressure, glucose tolerance and lipid metabolism). The advantage of focusing upon these four domains is that the data comprising the GTI-MD are collected routinely during medical visits, because they are limited to information included in the vital signs and simple blood tests (the hemoglobin A1c and low-density lipoprotein measurements). All of these measures are easy to incorporate into clinical care [9].
The GTI-MD measures the change in steroid toxicity between two timepoints [13]. The GTI-MD algorithm calculates two scores from the same data. First, the cumulative worsening score (CWS) assesses the total change in steroid toxicity that has occurred since baseline, whether that toxicity is transient or persistent. The CWS is therefore a running total of all toxicities that have occurred, even if some are short-lived rather than permanent and resolve during follow-up. Thus, the CWS value can only remain stable or increase over time.
Second, the aggregate improvement score (AIS) allows for the possibility that, under some circumstances, steroid toxicity may improve. Thus, it measures both improvement and worsening of steroid toxicity. While new toxicities are added to the AIS [9], toxicities that resolve or improve are subtracted from the score. Whereas an increasing AIS value indicates worsening steroid toxicity, a decreasing AIS value indicates improvement in steroid toxicity. Decreasing steroid toxicity of one group compared with another (i.e., a lower or negative AIS value) would be expected only in the setting of decreasing steroid use in one group. Given the design of this study, with neither group receiving less steroids during the follow-up period, we anticipated that the CWS value would be more useful in differentiating the two study cohorts with regard to steroid toxicity.
A post hoc analysis of the ADVOCATE trial, a Phase III randomized trial comparing avacopan with a tapering schedule of prednisone in patients with ANCA-associated vasculitis, showed that the GTI-MD correlates highly with GTI and can be used in clinical studies [9,14,15]. To date, however, the GTI-MD has not been used for quantifying steroid toxicities in immune-mediated diseases using real-world healthcare data. We hypothesized that the GTI-MD could be applied to real-world data to understand steroid toxicity further in the interest of guiding clinicians to monitor steroid use, screen for emerging steroid toxicity, mitigate AEs that increase patient burden, and reduce the healthcare costs associated with toxicity. We therefore aimed to measure steroid toxicity in patients with MG by applying the GTI-MD for the first time using electronic health records (EHR) data in the US.
The objective of this study was to assess the feasibility of evaluating the impact of steroid use on steroid toxicity in patients with MG using GTI-MD by investigating differential steroid toxicity in the two cohorts (MG-SI vs MG-SN) and understanding the impact of treatment intensity and baseline dose within subgroups of the MG-SI cohort. To gauge the impact of both treatment intensity and baseline dose, the differences in the CWS and AIS values between subgroups of the MG-SI cohort were evaluated according to whether or not the patients underwent multiple steroid courses (versus a single course). The same differences were also analyzed with regard to the strength of the initial steroid dose (≥20 or <20 mg/day of prednisone equivalent at index). Given the challenges of addressing steroid dosing using EHR data, strength and frequency were used as proxies to classify steroid intensity.
Materials & methods
Study description & data source
This retrospective, real-world study used de-identified and anonymized health information derived from EHR in the US-based Optum® Market Clarity database. To accomplish the study, a four-way collaboration among argenx, the study sponsor; Steritas, the inventor of the GTI-MD; ZS Associates, the analysis team; and Optum was required. The data employed were collected over the 10-year period between January 2013 and December 2022. Optum EHR aggregates de-identified and anonymized information on demographics (age, sex, region, insurance), clinical data (diagnoses and procedures, prescribed and administered medications, allergies, immunizations, vital signs, safety) and laboratory results, covering more than 115 million unique patients in the US [16,17]. The dataset included patients who had a diagnosis for MG and the laboratory values for the domains required for the GTI-MD algorithm. Data were de-identified in compliance with the Health Insurance Portability and Accountability Act of 1996. Based on the nature of the analysis (secondary database), neither ethics committee approval nor institutional review board approval was required.
Study population
The inclusion criteria were adults (aged ≥18 years) with a diagnosis of MG (at least 2 MG diagnosis records [ICD-10 CM G70.0], dated ≥30 to ≤730 days apart between January 2014 and September 2021; no steroid usage during the baseline (1-year pre-index); complete data as required for the GTI-MD algorithm within 14-day periods of both the baseline and the follow-up period. These data include the BMI, BP, glucose levels, lipid levels (Figure 1A). Potentially eligible patients were then divided into two cohorts based on steroid use (steroid initiators [MG-SI; intervention] and steroid-naive [MG-SN; control]). The GT-SNAPSHOT, another clinical outcome assessment in the STOX Suite, is a one-time score of existing steroid toxicity across multiple domains. The SNAPSHOT considers a broad range of potential steroid toxicity domains, even if a patient has not received a steroid course before. The SNAPSHOT was used to ensure that the steroid toxicities and the potential for steroid toxicity at index were approximately equal between groups [9]. Patients with evidence of bariatric surgery post-index or who had incomplete steroid prescription information were excluded.
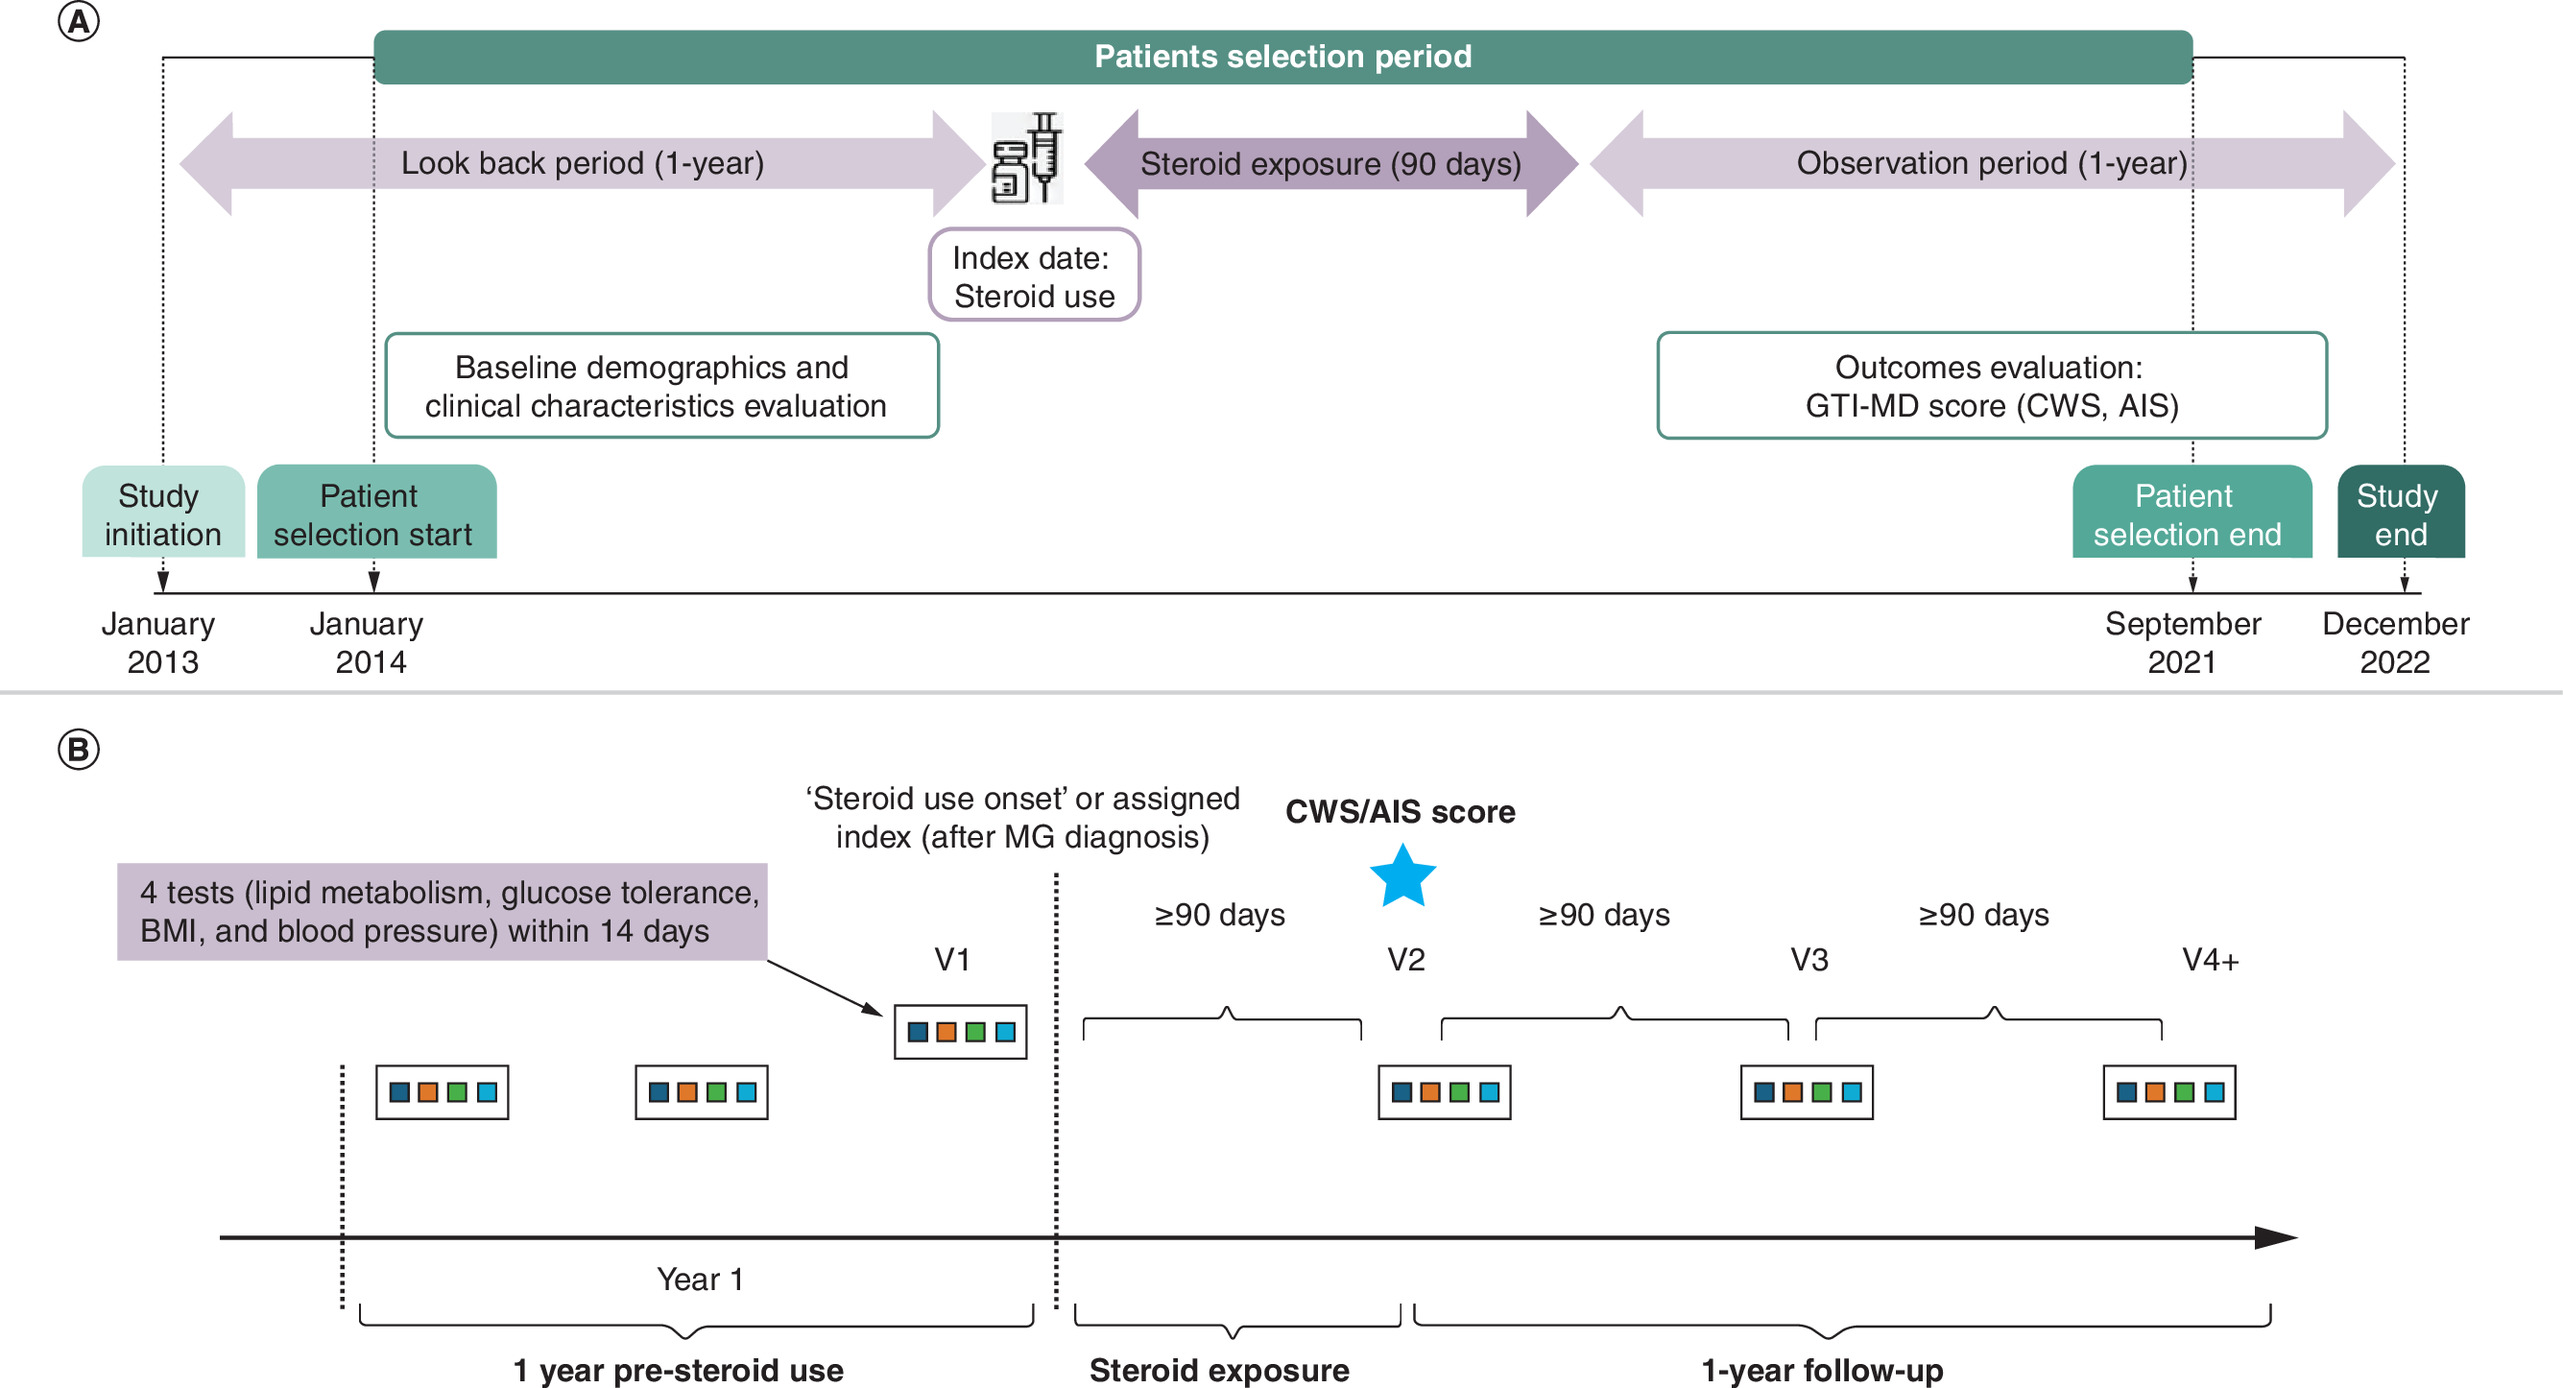
Figure 1. How the study tracked patients before and after starting steroid treatment.
(A) Overall timeline. (B) Methodology to calculate GTI-MD. GTI-MD was calculated as a change in steroid toxicity between two time points. GTI-MD was determined by lab values for the 4 metabolic domains (BMI, BP, lipid metabolism, glucose tolerance) and any dose changes in medications (hypertensive medications, glucose lowering and lipid lowering). Lab assessments were required to be within a 14-day window. Data on medication dose increase, decrease or no change at time of lab assessments were included in the algorithm. Each set of assessments were required to be minimum 90-days apart or from steroid initiation to ensure sensitivity of changes to lab value.
AIS: Aggregate improvement score; BP: Blood pressure; CWS: Cumulative worsening score; GTI-MD: Glucocorticoid Toxicity Index-Metabolic Domains; MG: Myasthenia gravis; V: Visit.
Index dates were defined as the date of first steroid use for the MG-SI cohort. MG-SN patients were selected using exact matching to MG-SI patients on sex and birth year. The MG-SN patients were assigned the same index date as the matched MG-SI patients. Steroid users were identified using National Drug Code (NDC) and procedure codes for oral and IV steroid use. The follow-up period was 90 to 455 days (∼1 year) post-steroid use. Patients were further classified according to the frequency of steroid courses (multiple vs one-time users) and the strength of the steroid dose (≥20 mg and <20 mg dose at index). Multiple steroid users were the patients who had ≥1 record of steroid use in the follow-up period.
Variables & assessment
The patients' baseline demographics and clinical characteristics (age, sex, region, insurance type, CCI and comorbidities), vital signs, laboratory values relevant to the GTI-MD (BMI, BP, glucose levels, lipid levels) were obtained, and steroid doses were obtained from the Optum dataset, as were data required for the GT-SNAPSHOT™ (a baseline assessment of steroid toxicity) [18]. Patient age and insurance type at the index date, CCI and comorbidities during the 1-year pre-index, steroid dose at index, steroid frequency in follow-up, and GT-SNAPSHOT score were recorded. The definition of the terminologies used are presented in the Supplementary Appendix (Supplementary Table 1). The limits of GTI-MD domains chosen to exclude unreliable data were 15–50 kg/m2 for the BMI domain; 40–250/30–150 mmHg for blood pressure measurements; 3–20% for values of glycated hemoglobin (hemoglobin A1c); and low 20–400 mg/dl for low-density lipoprotein.
The methodology to calculate CWS and AIS using GTI-MD is presented in Figure 1B. GTI-MD calculated the change in steroid toxicity between two time points using lab values of the four metabolic domains (BMI, BP, lipid metabolism and glucose tolerance) within a 14-day window. Changes in the doses of medications (hypertensive medications, glucose-lowering and lipid-lowering) at the time of laboratory assessments were also considered in GTI-MD scoring according to whether treatment for a given domain was increased, decreased or unchanged during the period of interest. Each set of assessments was required to be a minimum of 90 days apart to ensure sensitivity of changes to the lab value.
Analysis
Descriptive analyses were used to summarize the patients' baseline characteristics and GTI-MD scores, stratified by treatment cohorts (MG-SI and MG-SN). Subgroup analyses of the GTI-MD scores were conducted based on whether patients had multiple or single courses of steroids, as well as the strength of steroid treatments at the index date. Chi-square tests were used to assess the relationship between categorical variables. Student t tests were used to analyze continuous variables. Statistical significance was defined as p < 0.05 a priori. The minimal clinically important difference (MCID) for both of the GTI-MD scores is ≥10 points [9,13]. This 10-point estimate, derived from a distribution analysis of the scores of cases used in the validation of the full GTI, also corresponds to the smallest number of points given for changes in any GTI-MD domain (i.e., minor worsening in lipid metabolism is associated with a score of ≥10 points). In addition to the 10-point MCID threshold, we also evaluated thresholds of ≥20 and ≥30 for the two cohorts and for subgroups within the MG-SI cohort.
Multivariable logistic and linear regression were conducted, with the dependent variable defined as CWS (as binary outcome of ‘worsening’ or ‘not worsening’) and AIS (as a continuous outcome), respectively. In both models, the key exposure was steroid-treatment intensity, represented as a 4-level categorical variable combining steroid frequency (one-time vs multiple courses during follow-up) and index dose strength (<20 mg/day vs ≥20 mg/day prednisone-equivalent), with MG-SN as the reference category. Both adjusted models included the following covariates a priori: age, sex, region, insurance type, CCI, baseline GT-SNAPSHOT, time from baseline assessment to index and time from index to follow-up assessment. An interaction term between time-from-index-to-assessment and steroid-exposure category was evaluated for AIS; because no interaction was observed, only the main effects are presented.
Results
Study disposition & patient characteristics
Of 27,157 patients identified with MG, 682 eligible patients (MG-SI, n = 377; MG-SN, n = 305) entered this analysis after application of the inclusion and exclusion criteria (Figure 2). Further stratifications by steroid frequency in the MG-SI cohort identified 196 as multiple users and 181 as one-time users. Moreover, based on the steroid dose at index, 195 patients in the MG-SI cohort received ≧20 mg/day (prednisone-equivalent) and 182 received ≤20 mg/day at index.
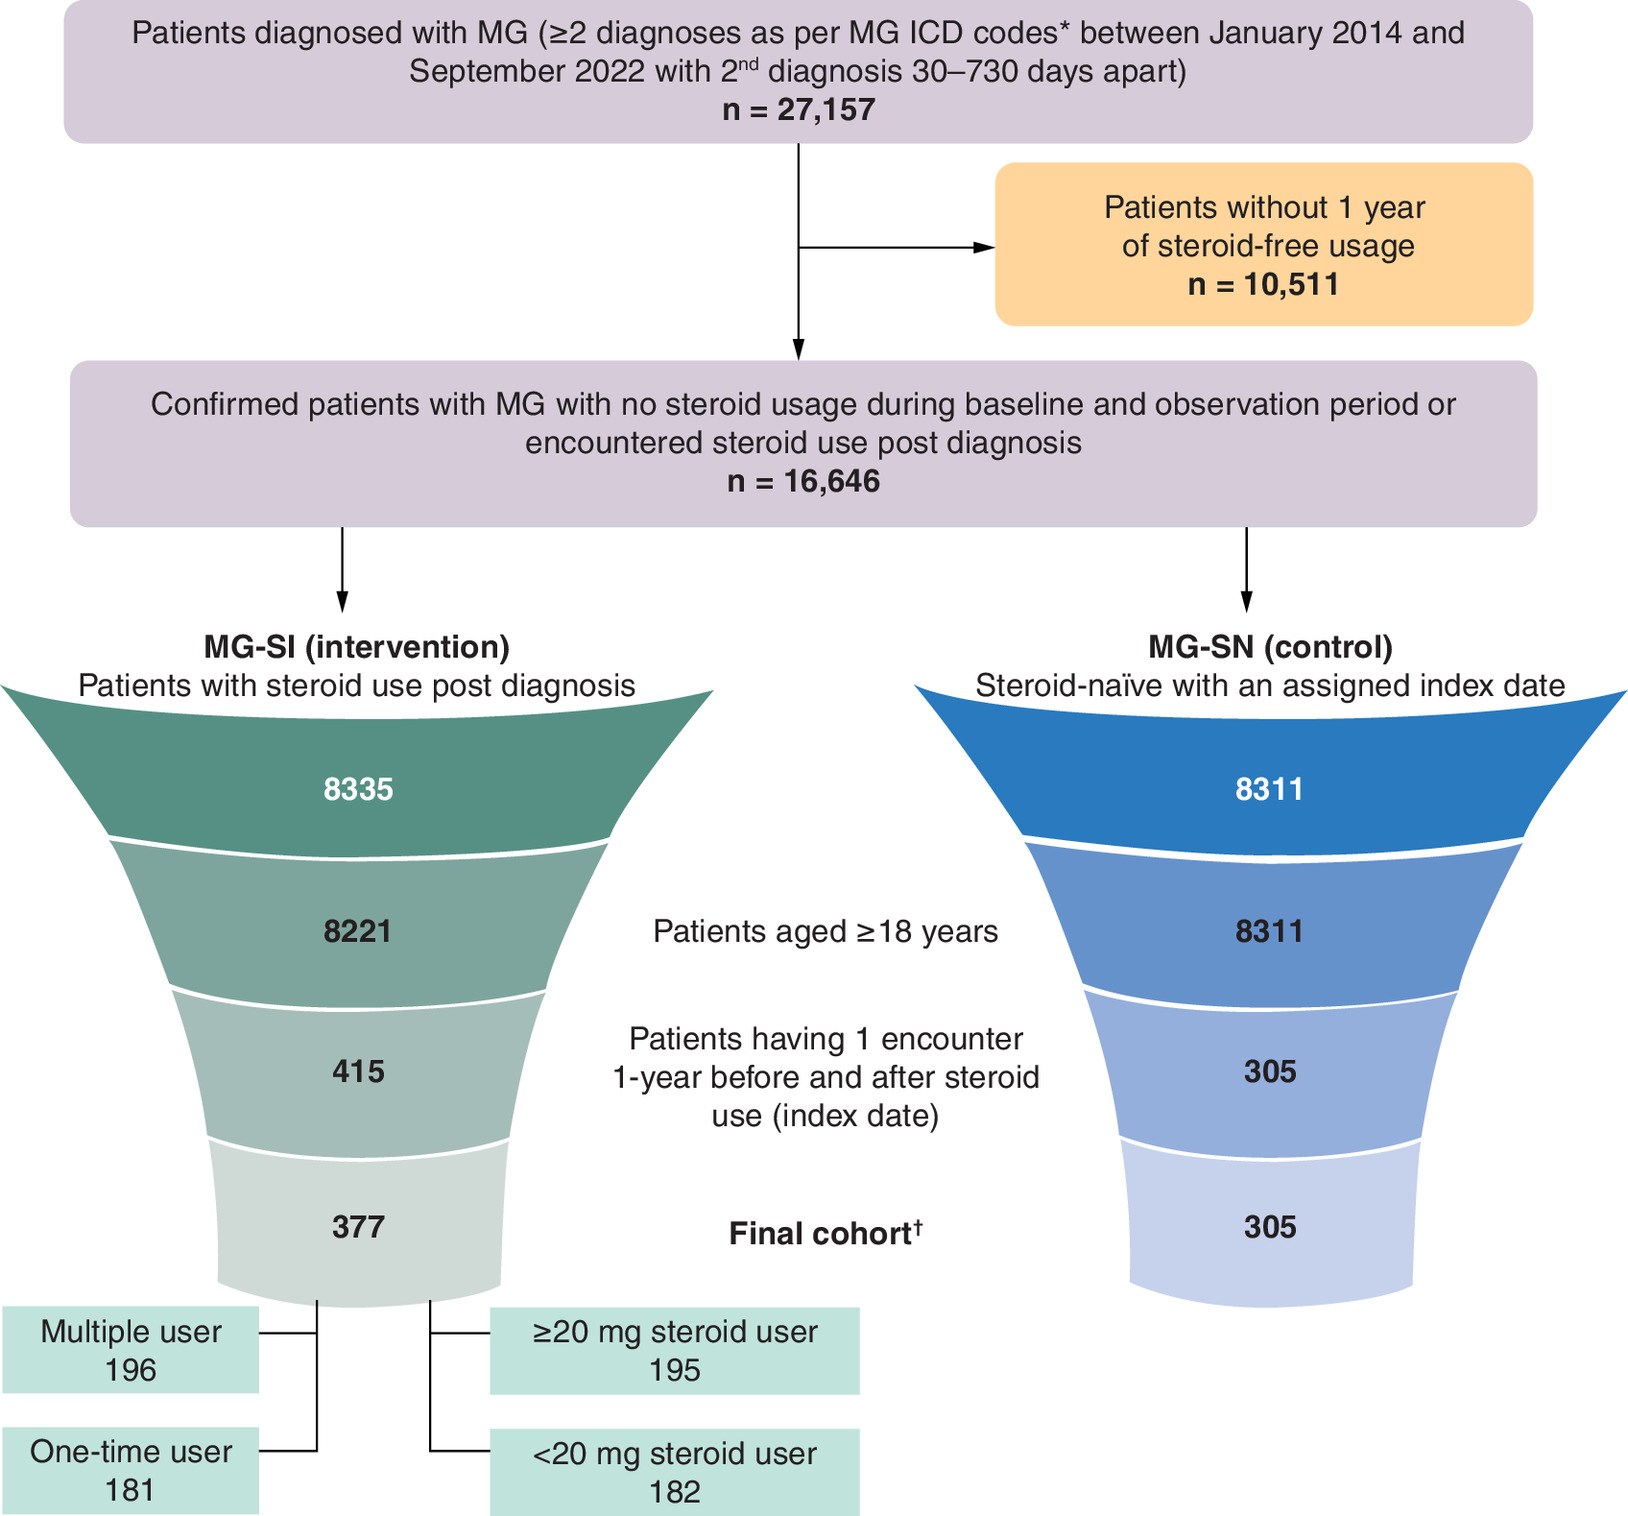
Figure 2. Patient flow as per the inclusion and exclusion criteria.
*ICD codes.
†Excludes patients with evidence of bariatric surgery or incomplete steroid prescription information.
ICD: International Classification of Diseases; MG: Myasthenia gravis; SI: Steroid initiators; SN: Steroid-naive.
Baseline demographics and patient characteristics are summarized in Table 1. The overall mean ± SD age at index was 70.0 ± 9.8 years (MG-SI vs MG-SN, 68.7 ± 10.3 vs 71.5 ± 9.0 years; p < 0.001). There was a male predominance (62%) in both cohorts overall (57% MG-SI vs 67% MG-SN; p = 0.005). The majority (29%) of patients had Medicare insurance (33% vs 24%; p < 0.001) and the largest subgroup (43%) was from the Midwest region (47% MG-SI vs 39% MG-SN; p = 0.043).
| Baseline characteristics | All patients (n = 682) | MG-SI (n = 377) | MG-SN (n = 305) | p-value† |
|---|---|---|---|---|
| Age at index, years, mean ± SD | 70.0 ± 9.8 | 68.7 ± 10.3 | 71.5 ± 9.0 | <0.001 |
| Gender, n (%) | ||||
| Female | 262 (38) | 161 (43) | 101 (33) | 0.005 |
| Male | 420 (62) | 216 (57) | 204 (67) | |
| Region, n (%) | ||||
| Midwest | 296 (43) | 176 (47) | 120 (39) | 0.043 |
| South | 168 (25) | 94 (25) | 74 (24) | |
| West | 85 (12) | 41 (11) | 44 (14) | |
| Northeast/other/unknown | 133 (19) | 66 (17) | 67 (22) | |
| Insurance type at index, n (%) | ||||
| Commercial | 162 (24) | 104 (28) | 58 (19) | <0.001 |
| Medicare | 200 (29) | 126 (33) | 74 (24) | |
| Multiple | 191 (28) | 107 (28) | 84 (28) | |
| Medicaid/other/unknown | 129 (18) | 40 (11) | 89 (29) | |
| CCI, mean ± SD | 2.4 ± 2.1 | 2.6 ± 2.2 | 2.2 ± 1.9 | 0.003 |
| CCI category, n (%) | ||||
| 0 | 91 (13) | 45 (11) | 46 (15) | |
| 1–2 | 322 (47) | 179 (46) | 143 (47) | |
| 3–4 | 167 (24) | 91 (26) | 76 (25) | |
| ≥5 | 102 (15) | 62 (18) | 40 (13) | |
| GT-SNAPSHOT score, mean ± SD | 90.6 ± 31.9 | 92.0 ± 31.1 | 88.8 ± 32.8 | 0.117 |
| BMI category at baseline, n (%)‡ | ||||
| 18.5-<25 (normal) | 86 (13) | 37 (10) | 49 (16) | 0.081 |
| 25-<30 (overweight) | 211 (31) | 123 (33) | 88 (29) | |
| ≥30 (obese) | 384 (56) | 217 (58) | 167 (55) | |
| HbA1c category at baseline, n (%)‡ | ||||
| >6.5% (diabetes) | 317 (46) | 175 (46) | 142 (47) | 0.617 |
| 5.7%-<6.5% (prediabetes) | 222 (33) | 118 (31) | 104 (34) | |
| <5.7% (normal) | 143 (21) | 84 (22) | 59 (19) | |
| Hypoglycemic drugs, n (%)§ | 383 (56) | 212 (56) | 171 (56) | 0.703 |
| Systolic/diastolic blood pressure, mean ± SD mmHg‡ | 129/74 ± 16/10 | 129/74 ± 17/10 | 128/73 ± 15/10 | |
| Antihypertensives, n (%)§ | 505 (74) | 280 (74) | 225 (74) | 0.681 |
| LDL, mean ± SD, mg/dl‡ | 88.3 ± 34.0 | 90.1 ± 34.3 | 86.2 ± 33.5 | |
| Lipid-lowering medication use, n (%)§ | 419 (61) | 234 (62) | 185 (61) | 0.005 |
| Non-MG hospitalizations, n (%) | 57 (8) | 39 (10) | 18 (6) | 0.005 |
| Non-MG ER visits, n (%) | 79 (12) | 50 (13) | 29 (10) | 0.055 |
| Time between index to set of lab assessments in follow-up, mean ± SD | ||||
| First set (visit 2) | 237 ± 96 | 236 ± 95 | 237 ± 96 | 0.880 |
| Last set (visit n) | 292 ± 97 | 299 ± 94 | 284 ± 101 | 0.060 |
| Common MG comorbidities, n (%) | ||||
| Diabetes | 554 (81) | 307 (81) | 247 (81) | 0.635 |
| GERD | 171 (25) | 111 (29) | 60 (20) | 0.090 |
| Hyperlipidemia | 568 (83) | 327 (87) | 241 (79) | 0.006 |
| Hypertension | 526 (77) | 292 (77) | 234 (77) | 0.857 |
| Thyroid | 163 (24) | 94 (25) | 69 (23) | 0.397 |
| Sleep disorder | 151 (22) | 102 (27) | 49 (16) | 0.001 |
†
Compared between MG-SI and MG-SN cohort.
‡
Test values of the encounter closest to the index date in the presteroid period has been considered.
§
Medication capture has been checked for until the encounter date closest to Index date in the pre-period.
CCI: Charlson Comorbidity Index; ER: Emergency room; GERD: Gastroesophageal reflux disease; HbA1c: Glycated hemoglobin; LDL: Low-density lipoprotein; MG: Myasthenia gravis; SI: Steroid initiators; SN: Steroid-naive.
The prevalence of co-morbidities relevant to the GTI-MD was high in the study population at baseline (Table 1). As examples, 56% of the study population were obese, and 56, 74 and 61% were receiving medications for glucose control, hypertension and hyperlipidemia, respectively. Patients in the MG-SI cohort had higher CCI scores (2.6 ± 2.2 vs 2.2 ± 1.9; p = 0.003), but GT-SNAPSHOT scores were not significantly different between the groups at baseline (92.0 ± 31.1 vs 88.8 ± 32.8; p = 0.117). Patients in the MG-SI cohort had a higher number of historical non-MG hospitalizations (10% vs 6%; p = 0.005) as well as comorbidities such as hyperlipidemia (87% vs 79%, p = 0.006) and sleep disorder (27% vs 16%; p = 0.001).
Overall GTI-MD score & domain
During the follow-up, the overall mean CWS value ± SD was 20.8 ± 22.2. Patients in the MG-SI cohort had a higher mean CWS value than the MG-SN cohort (22.6 ± 22.8 vs 18.7 ± 21.2; p = 0.023). All four GTI-MD domains favored the MG-SI cohort directionally in terms of worsening steroid toxicity, but only the BMI domain was statistically significant (10% vs 6%; p = 0.029; Table 2). The overall mean AIS value ± SD, 3.5 ± 34.4, was numerically higher in the MG-SI cohort than the MG-SN cohort (4.9 ± 34.5 vs 1.9 ± 34.3; p = 0.267).
| GTI-MD score or domain | All patients (N = 682) | MG-SI (n = 377) | MG-SN (n = 305) | p-value |
|---|---|---|---|---|
| CWS | 0.023 | |||
| Mean ± SD | 20.8 ± 22.2 | 22.6 ± 22.8 | 18.7 ± 21.2 | |
| Range | 0–95 | 0–95 | 0–93 | |
| AIS | 0.267 | |||
| Mean ± SD | 3.5 ± 34.4 | 4.9 ± 34.5 | 1.9 ± 34.3 | |
| Range | -119–93 | -119–93 | -107–93 | |
| Blood pressure, n (%) | 0.972 | |||
| Worsening | 186 (27) | 104 (28) | 82 (27) | |
| Improvement | 166 (24) | 92 (24) | 74 (24) | |
| No change | 330 (48) | 181 (48) | 149 (49) | |
| Body mass index, n (%) | 0.029 | |||
| Worsening | 56 (8) | 37 (10) | 19 (6) | |
| Improvement | 80 (12) | 52 (14) | 28 (9) | |
| No change | 546 (80) | 288 (76) | 258 (85) | |
| Glucose tolerance, n (%) | 0.373 | |||
| Worsening | 172 (25) | 103 (27) | 69 (23) | |
| Improvement | 110 (16) | 59 (16) | 51 (17) | |
| No change | 400 (59) | 215 (57) | 185 (61) | |
| Lipid metabolism, n (%) | 0.068 | |||
| Worsening | 219 (32) | 134 (36) | 85 (28) | |
| Improvement | 210 (31) | 115 (31) | 95 (31) | |
| No change | 253 (37) | 128 (34) | 125 (41) | |
AIS: Aggregate improvement score; CWS: Cumulative worsening score; GTI-MD: Glucocorticoid Toxicity Index-Metabolic Domain; MG: Myasthenia gravis; SI: Steroid initiators; SN: Steroid-naive.
The MG-SI cohort had a significantly greater proportion of patients with a CWS score that exceeded the MCID threshold of 10 points (68% vs 59%; p = 0.016) and >20 (44% vs 36%; p = 0.030). No significant differences were observed for the AIS score between the cohorts (Figure 3).
![Bar charts comparing two patient groups (myasthenia gravis steroid initiator [MG-SI] and steroid-naive [MG-SN]) on how many achieved meaningful improvement in cumulative worsening score (CWS) and aggregate improvement score (AIS) scores at different point thresholds. The MG-SI cohort has significantly greater proportions than MG-SN for CWS, while there are no significant differences between the two groups for AIS.](/cms/10.57264/cer-2025-0141/asset/d1217508-219e-475a-87fe-ccf4c818f7f9/assets/images/large/figure3.jpg)
Figure 3. Summary of minimal clinically important difference in cumulative worsening score and aggregate improvement score scores in myasthenia gravis-steroid initiator and myasthenia gravis-steroid-naive cohorts.
AIS: Aggregate improvement score; CWS: Cumulative worsening score; MCID: Minimal clinically important difference; MG: Myasthenia gravis; SI: Steroid initiator; SN: Steroid-naive.
GTI-MD score & domain as per frequency of steroid courses & strength of steroid dose at index
In the MG-SI cohort, multiple users had significantly higher CWS values (25.7 ± 24.8 vs 19.2 ± 19.9; p = 0.006) and AIS (9.6 ± 34.7 vs -0.3 ± 33.7; p = 0.005) than one-time steroid users (Table 3). In addition, patients who used ≥20 mg of prednisone-equivalent steroids at index had higher CWS (25.0 ± 23.0 vs 19.9 ± 22.3; p = 0.033) and AIS (8.3 ± 32.9 vs 1.1 ± 35.9; p = 0.044) values than those who received <20 mg of steroids (Table 3).
| GTI-MD score or domain | Multiple users (n = 196) | One-time users (n = 181) | p-value |
|---|---|---|---|
| CWS | 0.006 | ||
| mean ± SD | 25.7 ± 24.8 | 19.2 ± 19.9 | |
| range | 0–95 | 0–81 | |
| AIS | 0.005 | ||
| mean ± SD | 9.6 ± 34.7 | -0.3 ± 33.7 | |
| range | -119–93 | -93–81 | |
| GTI-MD score or domain | ≥20 mg steroid at index (n = 195) | <20 mg steroid at index (n = 182) | p-value |
| CWS | 0.033 | ||
| mean ± SD | 25.0 ± 23.0 | 19.9 ± 22.3 | |
| range | 0–95 | 0–93 | |
| AIS | 0.044 | ||
| mean ± SD | 8.3 ± 32.9 | 1.1 ± 35.9 | |
| range | -73–82 | -119–93 |
AIS: Aggregate improvement score; CWS: Cumulative worsening score; GTI-MD: Glucocorticoid Toxicity Index-Metabolic Domain; MG: Myasthenia gravis; SI: Steroid initiator; SN: Steroid-naive.
Multivariable regression analyses
In multivariable analyses, patients with multiple steroid courses and a high-strength (≥20 mg/day prednisone-equivalent) index prescription had significantly higher odds of CWS worsening compared with SN patients (adjusted odds ratio [OR] 2.18; 95% CI: 1.30–3.64; p < 0.01). Patients with one-time high-strength steroid exposure showed a borderline association (OR 1.71; 95% CI: 0.99–2.94; p = 0.05), while other steroid-exposure categories were not significantly different from steroid-naive patients (Table 4).
| Predictor | CWS Adjusted OR (95% CI) | p-value | AIS Adjusted β (95% CI) | p-value |
|---|---|---|---|---|
| Steroid exposure category (vs steroid-naive) | ||||
| One-time user, low strength at index | 1.04 (0.64, 1.70) | 0.87 | -6.77 (-14.74, 1.21) | 0.10 |
| One-time user, high strength at index | 1.71 (0.99, 2.94) | 0.05 | 2.01 (-6.33, 10.35) | 0.64 |
| Multiple user, low strength at index | 1.16 (0.69, 1.95) | 0.58 | 5.97 (-2.45, 14.39) | 0.17 |
| Multiple user, high strength at index | 2.18 (1.30, 3.64) | <0.01 | 10.21 (2.60, 17.83) | 0.01 |
| Sex | ||||
| Male (vs female) | 1.03 (0.73, 1.45) | 0.86 | -1.09 (-6.49, 4.31) | 0.69 |
| Region (vs Midwest) | ||||
| Northeast | 0.88 (0.55, 1.40) | 0.59 | 3.90 (-3.48, 11.28) | 0.30 |
| South | 0.82 (0.54, 1.22) | 0.33 | -0.92 (-7.42, 5.58) | 0.78 |
| West | 0.92 (0.54, 1.58) | 0.77 | 1.88 (-6.70, 10.46) | 0.67 |
| Other/Unknown | 1.23 (0.41, 3.70) | 0.71 | -2.72 (-19.38, 13.94) | 0.75 |
| Insurance (vs commercial) | ||||
| Medicaid | 0.89 (0.20, 3.97) | 0.88 | 3.65 (-20.52, 27.83) | 0.77 |
| Medicare | 0.56 (0.34, 0.91) | 0.02 | -6.05 (-13.74, 1.64) | 0.12 |
| Multiple | 0.80 (0.48, 1.31) | 0.37 | -4.88 (-12.60, 2.85) | 0.22 |
| Unknown | 0.62 (0.36, 1.06) | 0.08 | -7.25 (-15.89, 1.40) | 0.10 |
| Age (per year) | 1.00 (0.98, 1.02) | 0.71 | 0.06 (-0.25, 0.36) | 0.72 |
| Charlson Comorbidity Index (per 1 unit) | 1.02 (0.94, 1.11) | 0.70 | -0.72 (-2.04, 0.60) | 0.28 |
| Time from index to V2 (per day) | 1.00 (1.00, 1.00) | 0.36 | -0.05 (-0.08, -0.02) | <0.01 |
| Time from V1 to index (per day) | 1.00 (1.00, 1.00) | 0.62 | -0.01 (-0.04, 0.02) | 0.57 |
| Baseline GT-SNAPSHOT (per 1 point) | 1.00 (0.99, 1.00) | 0.08 | -0.18 (-0.26, -0.09) | <0.01 |
AIS: Aggregate improvement score; CCI: Charlson Comorbidity Index; CI: Confidence interval; CWS: Cumulative worsening score; GTI-MD: Glucocorticoid Toxicity Index–Metabolic Domains; OR: Odds ratio; V1: Baseline assessment; V2: First follow-up assessment.
For AIS, the multiple/high-strength group had an adjusted mean AIS 10.21 points higher than SN patients (95% CI: 2.60–17.83; p = 0.01) at the first follow-up assessment. No evidence of interaction between steroid-exposure category and time from index to V2 was observed for AIS, indicating that the association between steroid-exposure category and AIS did not differ over time (Table 4).
Discussion
Steroids have served as the primary treatment for various inflammatory diseases. Unfortunately, substantial toxicities associated with GC use remain central to the patient experience in many inflammatory conditions. The toxicities associated with the long-term use of steroids have potential clinical and economic impact in real life [19,20]. Despite the widespread occurrence of steroid toxicity, accurate measurement of this complex phenomenon has been challenging in clinical trials, clinical practice and large datasets because of the lack of a practical and reliable method for quantifying changes in GC toxicity over time.
The full GTI was developed as a clinical trial tool to allow researchers to measure steroid toxicity prospectively and the instrument has been employed in clinical trials in more than thirty different disease indications to date [13]. The requirement of the full GTI to measure data across nine domains limits its applicability in real-world datasets, where such detailed information is recorded inconsistently. Although broad implementation of the full GTI in clinical practice has therefore been limited thus far, opportunities to integrate the instrument into clinical practice are being explored [14,15].
This study is the first to apply the GTI-MD, an abridged version of the GTI, to a large real-world dataset. The GTI-MD has previously demonstrated a strong correlation with the full GTI across multiple disease states, including ANCA-associated vasculitis, pemphigus vulgaris and steroid-dependent asthma, in both clinical trials and routine clinical practice [13,18]. In this study, the GTI-MD was utilized to investigate steroid toxicity in MG, an autoimmune neurological disorder where steroids have been a primary treatment for decades.
This study employed a novel approach to assess the impact of GC toxicity by validating the GTI-MD in EHR. This provides a scalable opportunity to automate the evaluation of steroid toxicity based on existing data collected in routine clinical practice. Use of GTI-MD can potentially reduce the burden from clinicians to collect and enter data leading, contributing to broader usage and of the GTI-MD in clinical practice. The findings confirm that the GTI-MD is a practical and sensitive tool for exploring steroid toxicity in retrospective datasets, supporting the generation of real-world evidence from clinical practice.
Patients in the MG-SI cohort had significantly higher cumulative steroid toxicity as measured by the CWS, despite the high prevalence of baseline comorbidities reflected in the GTI-MD across the study population. All four individual GTI-MD domains favored the MG-SI cohort in terms of worsening steroid toxicity. Patients in the MG-SI cohort were also more likely to exceed the MCID for steroid toxicity not only at the 10-point threshold, but also at the 20-point threshold. Thus, at a threshold twice the MCID for the GTI-MD, patients in the MG-SI cohort were still more likely to experience adverse effects associated with steroid toxicity than were their MG-SN counterparts.
Although differences in the AIS values were nonsignificant between the MG-SI and MG-SN cohorts, this outcome is attributable to the study design. The AIS calculates the net burden of toxicities over time by capturing both the emergence and resolution of toxicities. Within the MG-SI cohort, approximately 70% of patients were either one-time steroid users or had <20 mg strength at index. It is likely that many of these patients experienced resolution of toxicities during the follow-up period, resulting in a minimal net AIS change and no difference in the AIS values overall between the cohorts. Notably, despite the nonsignificant AIS difference, AIS was sensitive to higher-intensity steroid exposure within MG-SI: it was significantly higher among multiple users and among patients initiated at ≥20 mg/day prednisone-equivalent. This supports AIS as a useful indicator of net or ongoing toxicity in patients with sustained/high-dose exposure and highlights these subgroups as priorities for closer monitoring.
The findings within the MG-SI subgroups provided valuable insights. Both patients with multiple steroid exposures and those starting with ≥20 mg of prednisone-equivalent doses exhibited significantly greater steroid toxicity, as evidenced by elevated CWS and AIS values. These patient subgroups are likely to be at a higher risk for developing toxicities beyond the domains measured by the GTI-MD (e.g., infections, osteoporosis, and glaucoma) and thus should be closely monitored by their clinicians. The study findings therefore demonstrate the feasibility of using the GTI-MD measure to detect differences in steroid toxicities among patient subgroups in EHR data, supporting clinicians in the proactive identification of patients at risk for steroid toxicity who might benefit from additional monitoring and risk modification.
This study has significant strengths, particularly with regard to its innovative approach to the assessment of steroid toxicity in a rare disease. The study confirms the feasibility of implementing the GTI-MD, developed first and foremost for use as an outcome measure in clinical trials, in clinical practice through use use of real-world data that are collected routinely. The approach outlined in this study opens opportunities for additional investigations into steroid toxicity in other disease areas. Moreover, the GTI-MD offers the possibility of measuring the predicting the likelihood of other clinical outcomes associated with steroid use such as infections, osteoporotic fractures, hospitalizations, ER visits and other medical and economic costs. These need to be explored in future studies.
Our study also has limitations. First, the Optum EHR dataset had incomplete information on steroid dosage and duration, and this posed challenges in steroid use classification. We adjusted for this limitation be selecting measures of steroid exposure that were measurable readily within the Optum EHR dataset (i.e., multiple steroid courses vs a single course and initial steroid dose greater or less than 20 mg/day of prednisone-equivalent). Second, as if often true with real-world data, not all patients had complete lab data captured in the database as required by GTI-MD algorithm. To mitigate this, we relaxed the criteria window required to maximize patient sample size. Even so, the 682 patients included in this study far exceed in size any Phase III clinical trial performed to date in MG, and all 682 patients included had complete GTI-MD data. Third, the EHR data may not capture the complete clinical history of patients, and therefore prior steroid exposure before the 1-year baseline period cannot be excluded with certainty. Fourth, the high prevalence of diabetes, hyperlipidemia and hypertension in both cohorts within our study population is consistent with the published literature on patients with MG – likely because of the significant impact of steroids in this population [21]. It is possible that differences in the cohorts' GTI-MD scores would have been more pronounced if the inclusion criteria had been broadened to permit larger numbers of patients, including younger patients with fewer metabolic co-morbidities at baseline. Finally, because this work focused upon an MG population from the US, the findings may not be generalizable to the global population.
Overall this work has significant implications by illustrating the power of using the GTI-MD in HEOR studies of large data sets to study steroid toxicity in rare disease. Extensions of this study and modifications of its approach might be used to evaluate the correlation between steroid toxicity as assessed by the GTI-MD and other important toxicities such as hospitalization for infection, osteoporosis, bone fracture, cataracts and cardiovascular events such as atrial fibrillation and myocardial infarction. The approach employed here can be extrapolated to other disease populations for which steroids are an important part of the treatment regimen. Application of the GTI-MD tool, now employed both in real-world experience and clinical trials, can support the evidence needed to assess the true value of ‘steroid-sparing’ and ‘steroid-toxicity sparing’ medications through studies capitalizing upon information in large datasets.
Summary points
•
The study applied the Glucocorticoid Toxicity Index–Metabolic Domains (GTI-MD) to a large real-world dataset to assess steroid toxicity in patients with myasthenia gravis (MG).
•
A total of 682 patients with MG were analyzed, split into two groups: those who started steroid treatment (MG-SI) and those who did not (MG-SN).
•
Baseline risk for steroid toxicity was similar between both groups, allowing for meaningful comparison.
•
Patients who initiated steroid therapy showed significantly higher cumulative steroid toxicity scores compared with steroid-naive patients.
•
Individuals exposed to multiple steroid courses or higher starting doses (≥20 mg/day prednisone-equivalent) had significantly higher toxicity scores.
•
Among the four GTI-MD domains, BMI showed the most significant worsening in steroid-treated patients.
•
The study confirmed the feasibility of using GTI-MD with routine electronic health record data to detect and monitor steroid toxicity.
•
GTI-MD proved to be a practical, scalable tool for real-world evidence generation in rare diseases like MG.
•
These findings support proactive monitoring and risk stratification for patients receiving steroids, particularly those with more intense or repeated exposure.
Author contributions
G Phillips, C Qi, D Gelinas, R Kulkarni and JH Stone contributed to study conception and design; M Stone, A Chamberas, D Amirthaganesan, R Kulkarni and A Whangbo contributed to acquisition of data and data analysis. G Phillips, C Qi, D Gelinas, R Kulkarni, A Whangbo and JH Stone contributed to the interpretation of data and writing-original draft. All authors contributed to the writing, review and editing and approved the final draft of the manuscript before submission.
Acknowledgments
The authors thank Rabi Panigrahy, PhD for providing writing assistance, and Ahmed Elgebaly, MD (SIRO Clinpharm Pvt. Ltd, UK) and Sangita Patil, PhD, CMPP (SIRO Clinpharm Pvt. Ltd, India) for additional editorial support.
Financial disclosure
This study was funded by argenx BVBA (Ghent, Belgium).
Competing interests disclosure
G Phillips and C Qi are employees of argenx. D Gelinas was an employee of argenx at the time of the study. M Stone is an employee of Steritas. Anthony Chamberas is a consultant to Steritas. R Kulkarni and A Whangbo are employees of ZS Associates. D Amirthaganesan was an employee of ZS Associates at the time of the study. JH Stone co-founded Steritas and is the chair of the Scientific Advisory Board. The authors have no other competing interests or relevant affiliations with any organization or entity with the subject matter or materials discussed in the manuscript apart from those disclosed.
Writing disclosure
Medical writing assistance was provided by Rabi Panigrahy, PhD, and additional editorial support was provided by Ahmed Elgebaly, MD (SIRO Clinpharm Pvt. Ltd, UK) and Sangita Patil, PhD, CMPP (SIRO Clinpharm Pvt. Ltd, India).
Ethical conduct of research
Given the retrospective nature of the study and the reliance on electronic health records, formal ethical approval was not sought. We confirmed that all processes adhered to the principles of the Declaration of Helsinki. All data were de-identified and complied with relevant privacy regulations, including the Health Insurance Portability and Accountability Act (HIPAA) in the U.S. Patient anonymity was strictly maintained throughout the analysis, and no identifiable personal information was accessed or disclosed at any stage of the study.
Open access
This work is licensed under the Attribution-NonCommercial-NoDerivatives 4.0 Unported License. To view a copy of this license, visit https://creativecommons.org/licenses/by-nc-nd/4.0/
Supplementary Material
File (supplementary data.docx)
- Download
- 24.66 KB
References
Papers of special note have been highlighted as: • of interest; •• of considerable interest
1.
DeHart-McCoyle M, Patel S, Du X. New and emerging treatments for myasthenia gravis. BMJ Med. 2(1), e000241 (2023).
2.
Ye Y, Murdock DJ, Chen C, Liedtke W, Knox CA. Epidemiology of myasthenia gravis in the United States. Front. Neurol. 15, 1339167 (2024).
3.
Salari N, Fatahi B, Bartina Y et al. Global prevalence of myasthenia gravis and the effectiveness of common drugs in its treatment: a systematic review and meta-analysis. J. Transl. Med. 19(1), 516 (2021).
4.
Antonini G, Habetswallner F, Inghilleri M et al. Real world study on prevalence, treatment and economic burden of myasthenia gravis in Italy. Heliyon 9(6), e16367 (2023).
5.
Santos E, Coutinho E, Moreira I et al. Epidemiology of myasthenia gravis in northern Portugal: frequency estimates and clinical epidemiological distribution of cases. Muscle Nerve 54(3), 413–421 (2016).
6.
Breiner A, Widdifield J, Katzberg HD, Barnett C, Bril V, Tu K. Epidemiology of myasthenia gravis in Ontario, Canada. Neuromusc. Disord. 26(1), 41–46 (2016).
7.
Rodrigues E, Umeh E, Aishwarya, Navaratnarajah N, Cole A, Moy K. Incidence and prevalence of myasthenia gravis in the united states: a claims-based analysis. Muscle Nerve 69(2), 166–171 (2024).
8.
Alhaidar MK, Abumurad S, Soliven B, Rezania K. Current treatment of myasthenia gravis. J. Clin. Med. 11(6), 1597 (2022).
9.
Patel NJ, Jayne DR, Merkel PA et al. The glucocorticoid toxicity index-metabolic domains, an abridged version of the glucocorticoid toxicity index: post-hoc analysis of data from the advocate trial. Lancet Rheumatol. 5(7), e413–e421 (2023).
• Validates the Glucocorticoid Toxicity Index–Metabolic Domains (GTI-MD) as a robust surrogate for the full GTI, supporting its use in clinical trials and real-world studies to quantify steroid toxicity.
10.
Habib AA, Narayanaswami P. Would glucocorticoids be approved for clinical use if discovered today? Muscle Nerve 70(1), 9–11 (2024).
•• Offers a critical reflection on the modern risk-benefit profile of steroids, aligning with the study’s motivation for evaluating toxicity.
11.
Miloslavsky EM, Naden RP, Bijlsma JW et al. Development of a Glucocorticoid Toxicity Index (GTI) using multicriteria decision analysis. Ann. Rheumatic Dis. 76(3), 543–546 (2017).
• Describes the development of the GTI using a rigorous decision-analysis framework, forming the methodological foundation of this study.
12.
Liang Y, Zeng FA, Sheriff T et al. Evaluation of the toxicity of glucocorticoids in patients with autoimmune blistering disease using the glucocorticoid toxicity index: a cohort study. JAAD Int. 6, 68–76 (2022).
13.
Stone JH, McDowell PJ, Jayne DRW et al. The Glucocorticoid Toxicity Index: measuring change in glucocorticoid toxicity over time. Semin. Arthritis Rheum. 55, 152010 (2022).
•• Provides the definitive framework for the development and application of the GTI, including cumulative worsening scores and aggregate improvement scores metrics used in the present study.
14.
Bahap-Kara M, Sariyildiz E, Zengin HY, Karadag O, Bayraktar-Ekincioglu A. Prospective assessment of glucocorticoid toxicity in rheumatology practice: a focus on the glucocorticoid toxicity index. Rheumatology (Oxford) 64(3), 1010–1018 (2024).
• Demonstrates practical application of the GTI in routine rheumatology care, highlighting real-world feasibility.
15.
McDowell PJ, Stone JH, Heaney LG. The role of quantification of glucocorticoid-associated toxicity in severe asthma. J. Cell Immunol. 3(1), 31–35 (2021).
16.
Choi YC, Zhang D, Tyczynski JE. Comparison between health insurance claims and electronic health records (EHRs) for metastatic non-small-cell lung cancer (NSCLC) patient characteristics and treatment patterns: a retrospective cohort study. Drugs Real World Outcomes 8(4), 577–587 (2021).
17.
Optum EHR data. Gain visibility across therapeutic areas and the continuum of care. https://www.optum.com/en/business/life-sciences/real-world-data/ehr-data.html
18.
Jayne DRW, Merkel PA, Schall TJ, Bekker P. Avacopan for the treatment of anca-associated vasculitis. N. Engl. J. Med. 384(7), 599–609 (2021).
19.
Rice JB, White AG, Johnson M et al. Healthcare resource use and cost associated with varying dosages of extended corticosteroid exposure in a us population. J. Med. Econ. 21(9), 846–852 (2018).
• Highlights the substantial healthcare burden and costs linked to prolonged corticosteroid exposure, reinforcing the need for toxicity monitoring tools.
20.
Kabadi S, Yeaw J, Bacani A et al. Healthcare resource utilization and costs associated with long-term corticosteroid exposure in patients with systemic lupus erythematosus. Lupus 27(11), 1799–1809 (2018).
21.
Park H-S, Kim K, Yu MH et al. Risk of fracture in patients with myasthenia gravis: a nationwide cohort study in Korea. J. Bone Mineral Res. 39(6), 688–696 (2024).
Information & Authors
Information
Published In
Copyright
© 2026 The authors. This work is licensed under the Attribution-NonCommercial-NoDerivatives 4.0 Unported License
History
Received: 8 September 2025
Accepted: 24 March 2026
Published online: 8 May 2026
Keywords:
Topics
Authors
Metrics & Citations
Metrics
Article Usage
Article usage data only available from February 2023. Historical article usage data, showing the number of article downloads, is available upon request.
Citations
How to Cite
Evaluation of steroid toxicity using the Glucocorticoid Toxicity Index-Metabolic Domains instrument in adults with myasthenia gravis: a real-world study in the USA. (2026) Journal of Comparative Effectiveness Research. DOI: 10.57264/cer-2025-0141
Export citation
Select the citation format you wish to export for this article or chapter.