Evaluation of the treatment patterns among commercially insured patients with nonvalvular atrial fibrillation prescribed an oral anticoagulant by race/ethnicity
Publication: Journal of Comparative Effectiveness Research
Abstract
Aim: Despite evidence of racial/ethnicity health inequities in oral anticoagulant initiation and clinical outcomes for nonvalvular atrial fibrillation, little is known about disparities in treatment patterns, particularly discontinuation and switching. Materials & methods: This retrospective study utilized Komodo Healthcare Map data (1 July 2018 to 30 June 2023) to examine treatment patterns in patients with nonvalvular atrial fibrillation initiating direct oral anticoagulants (DOACs: apixaban, rivaroxaban, dabigatran) versus warfarin, stratified by self-reported race/ethnicity (White, Black and Hispanic) in the USA. Inverse probability of treatment weighting balanced baseline covariates and Cox model computed adjusted hazard ratio (aHR) and 95% confidence interval (CI) for apixaban-warfarin and DOAC-warfarin comparisons in the overall cohort and by race/ethnicity. Results: In the apixaban-warfarin cohort, apixaban patients were 24% less likely to discontinue treatment (aHR: 0.76, 95% CI: 0.75–0.77) and 79% less likely to switch to another oral anticoagulant (aHR: 0.21, 95% CI: 0.20–0.22) versus warfarin. By race/ethnicity, a higher proportion of Black patients discontinued than White and Hispanic (68, 60 and 63%, respectively). Almost 5% of apixaban patients switched to another oral anticoagulant versus 31% on warfarin. Among warfarin switchers, 77% initiated apixaban (80% in White; 76% Black; 76% in Hispanic patients). The DOAC-warfarin cohort followed similar trends. Conclusion: Overall, apixaban/DOACs were associated with more favorable treatment patterns than warfarin. However, racial/ethnicity differences were observed. Given the potential impact of oral anticoagulant discontinuation on clinical outcomes, further research is needed to better understand factors contributing to higher discontinuation and switch rates, particularly among Black and Hispanic patients.
Plain language summary
What is this article about?
This study looks at how people with a heart condition called nonvalvular atrial fibrillation take blood-thinning medicines. It compares a newer class of medications, direct oral anticoagulants that include apixaban, rivaroxaban and dabigatran, to an older medication called warfarin. The focus is on different racial and ethnic groups, including White, Black and Hispanic patients in the US, using data from July 2018 to June 2023.
Understanding how people take their medicines is important because stopping or switching medication can lead to worse health outcomes. To our knowledge, this is the first study to report on how often people stop or switch between these medicines, specifically comparing trends across different racial and ethnic groups.
What were the results?
The study found that people who took apixaban were 24% less likely to stop their anticoagulant medication and 79% less likely to switch to a different medicine compared with those taking warfarin. However, Black patients were more likely to stop their medication (68%) than White (60%) or Hispanic (63%) patients.
What do the results of the study mean?
This means that apixaban may help patients take their medication longer compared with warfarin. But it also shows that Black patients tend to stop taking their medications more often than other groups. These findings are important in highlighting racial and ethnic differences in medication treatment persistence, which could impact health outcomes. Addressing these disparities may improve the effectiveness of anticoagulant medication therapy, especially for Black and Hispanic patients. Further research is needed to understand the reasons for these differences and to improve treatment continuity across all groups.
Atrial fibrillation (AF) is the most common cardiac arrhythmia disorder in the US, with its prevalence projected to exceed 12 million by 2030 as the population ages and underlying risk factors increase [1–5]. Nonvalvular atrial fibrillation (NVAF) is the most common type of AF and accounts for more than half of all AF cases [6]. NVAF significantly increases the risk of ischemic stroke – by fivefold – making stroke prevention a critical focus of its treatment [6,7].
Anticoagulation therapy plays a crucial role in reducing stroke risk for patients with NVAF. Historically, vitamin K antagonists, such as warfarin, were the primary treatment option for stroke prophylaxis. However, direct oral anticoagulants (DOACs), such as apixaban, dabigatran and rivaroxaban, have become established as first-line treatments due to their numerous advantages. DOACs offer ease of administration, rapid onset of action, fewer drug-drug interactions and reduced monitoring requirements, while demonstrating equal or superior efficacy compared with warfarin [5,8–14]. Studies have demonstrated that switching from vitamin K antagonists to DOACs is associated with significant improvements in patient-reported satisfaction and a reduction in adverse events, ultimately enhancing quality of life [15–17].
Previous literature has also explored discontinuation and switching among patients with NVAF who initiated oral anticoagulants. For example, Baker et al. reported discontinuation rates of 52.8, 60.3 and 62.9% for apixaban, rivaroxaban and dabigatran, respectively, with corresponding switch rates of 3.6, 6.3 and 11.1% [18]. Willey et al. found that 72.7% of patients discontinued oral anticoagulants, with nearly 25% discontinuing within 3 months and 55% within 12 months of initiation [19], further supporting the high prevalence of treatment discontinuation reported in NVAF populations.
Research indicates that lower rates of treatment discontinuation and switching are associated with reduced treatment interruptions, increased adherence and improved clinical outcomes [20–22]. Numerous studies have shown that discontinuation of oral anticoagulants is linked to a heightened risk of adverse events, including stroke, bleeding and all-cause mortality [23,24]. In a study of oral anticoagulant treated patients with NVAF using ORBIT-AF II Registry data by Jackson et al., the adjusted discontinuation rates for warfarin versus DOACs were 7.9% versus 9.6% and 12.7% versus 15.3% at 6 and 12 months, respectively, and the discontinuation of OACs was associated with an increased absolute risk of all-cause mortality and CV death [25].
Additionally, patients with AF often face significant challenges in maintaining health-related quality of life [26]. Therefore, therapies that foster favorable treatment patterns – characterized by consistent adherence and minimal discontinuation – are crucial for improving patient outcomes.
Despite treatment guidelines advocating for DOAC use and DOAC utilization outpacing that of warfarin, research has demonstrated racial disparities in treatment patterns among patients with NVAF in the US [15,27,28]. Black patients with AF experience have higher rates of stroke and mortality compared with White patients [29], however, studies have shown that White patients are more likely to receive treatment with an oral anticoagulant [30,31]. In a study conducted in England, Black and other ethnic minority patients were 22 and 24% less likely to receive oral anticoagulation, respectively, compared with White patients [32].
While existing literature highlights the presence of racial health inequities in the initiation of oral anticoagulant treatment and clinical outcomes, there is little evidence characterizing NVAF treatment patterns among racial groups after initiation of treatment, specifically regarding discontinuation and switching of therapy. To address this knowledge gap and enhance understanding of oral anticoagulant treatment patterns among different race/ethnicity groups, this study aims to characterize the variation in treatment patterns among patients with NVAF who were prescribed DOACs or warfarin in the US. To our knowledge, this study is the first to report on discontinuation and switching trends for DOACs and warfarin across different race/ethnicity groups.
Materials & methods
Data source
This study was a retrospective cohort analysis using data from the Komodo Healthcare Map Database to evaluate the treatment patterns among insured patients with NVAF who were prescribed oral anticoagulants. At the time of the study, Komodo data encompassed over 65 billion de-identified clinical, pharmacy and laboratory encounters for more than 320 million patients enrolled in US healthcare plans, including commercial, Medicare Advantage and Medicaid managed care plans, since 2012. Among these patients, over 140 million have closed claims from more than 150 payers [33]. The data provides Census-level representation across diverse patient populations, including hospital networks, physician networks, healthcare claim processing companies, pharmacies and health insurers. This study utilized closed claims, which are healthcare encounters obtained directly from the payer, providing a comprehensive view of the patient journey. This includes complete medical and/or prescription benefit information, insurance eligibility and insurer-reported costs. Additionally, mortality data were included to capture death information. The mortality data were licensed and integrated into the Komodo data through de-identified patient identification numbers.
As this study was based on secondary, de-identified data that complies with the Health Insurance Portability and Accountability Act, Institutional Review Board approval was not required. The data that support the findings of this study are available from the corresponding author upon reasonable request.
Study design
The study period spanned from 1 July 2018, through 30 June 2023 (Figure 1). Patients were included if they had at least one prescription claim for a DOAC (apixaban, rivaroxaban or dabigatran) or warfarin during the identification period from 1 January 2019 to 31 December 2022. The date of the first prescription claims for either a DOAC or warfarin during this period was designated as the index date.
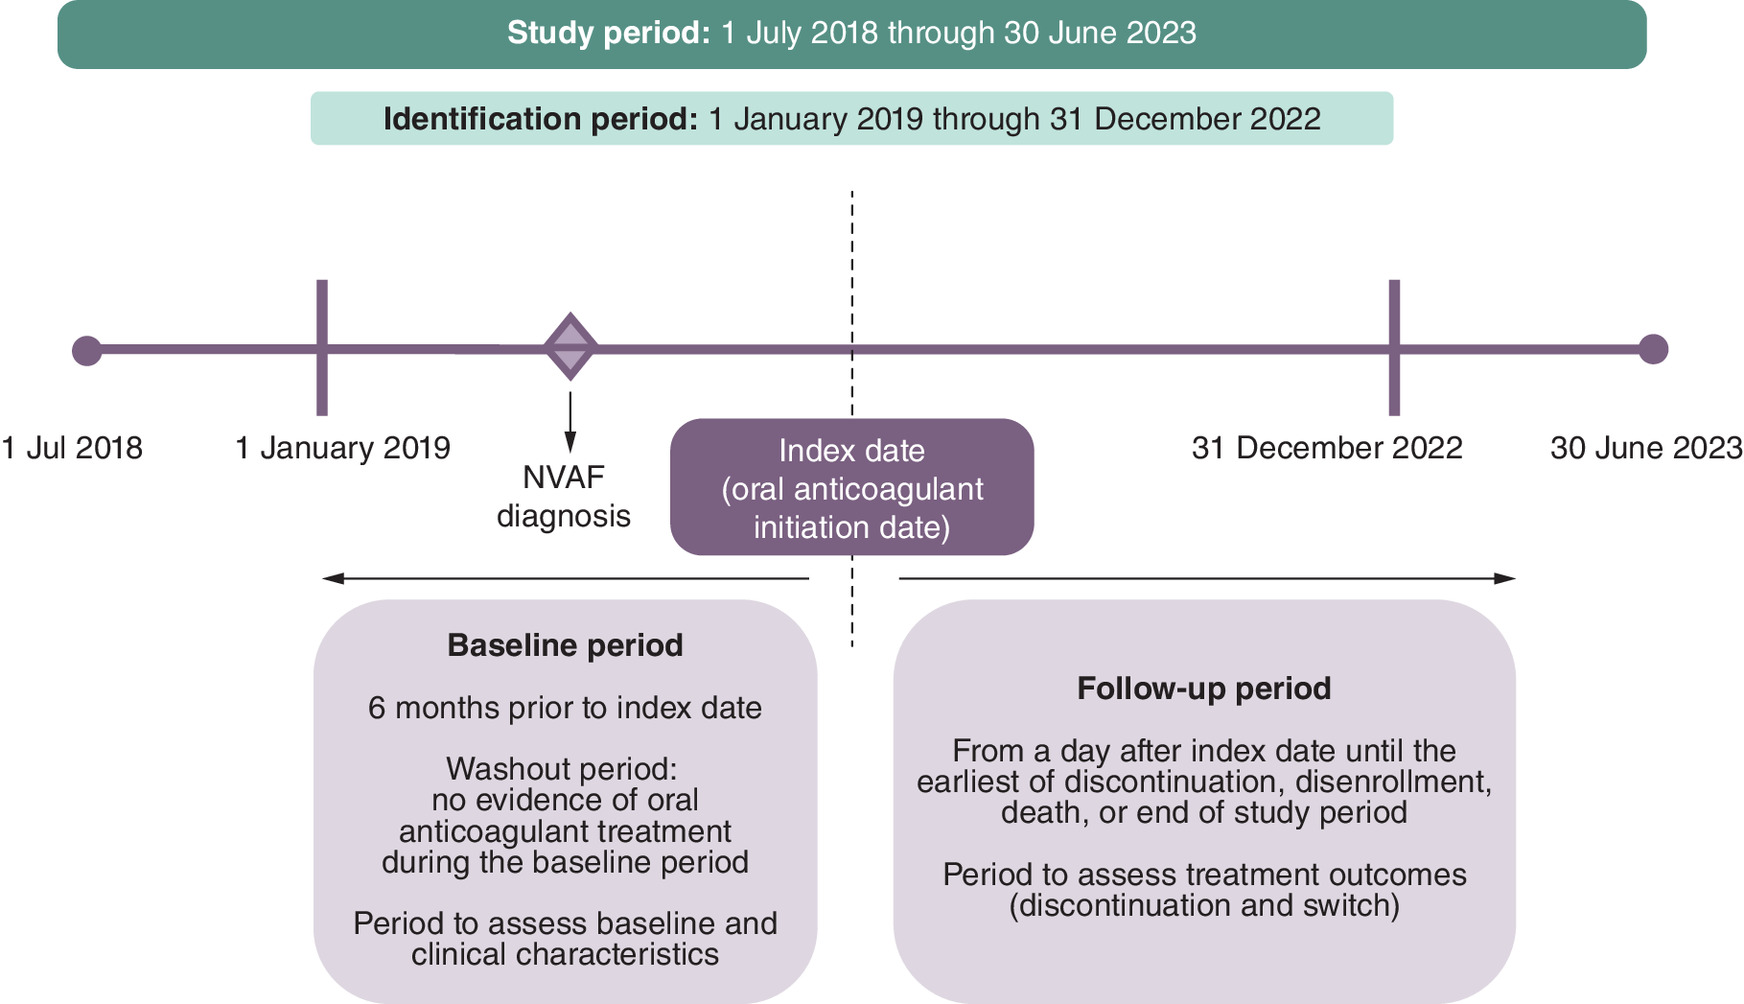
Figure 1. Study design.
NVAF: Nonvalvular atrial fibrillation.
Patients were required to have at least one inpatient or two outpatient claims (separated by at least 7 days) that were mutually exclusive with a diagnosis of AF (ICD-10-CM codes I480–I482 and I4891) prior to the index date during the study period. Patients were also required to be ≥18 years of age on index date and have continuous health plan enrollment for at least 6 months prior to the index date, on the index date, and for 6 months following the index date. The baseline period was defined as the 6 months prior to the index date, while the follow-up period extended from the day after the index date until the earliest of the following: discontinuation of index DOAC or warfarin, disenrollment, death or the end of the study period. Patients with evidence of valvular heart disease, VTE, transient AF, heart valve replacement/transplant or cardiac surgery during the baseline period, and, without evidence of hip or knee replacement surgery were excluded to avoid confounding due to differing anticoagulation indications. The detailed selection criteria are represented in Figure 2.
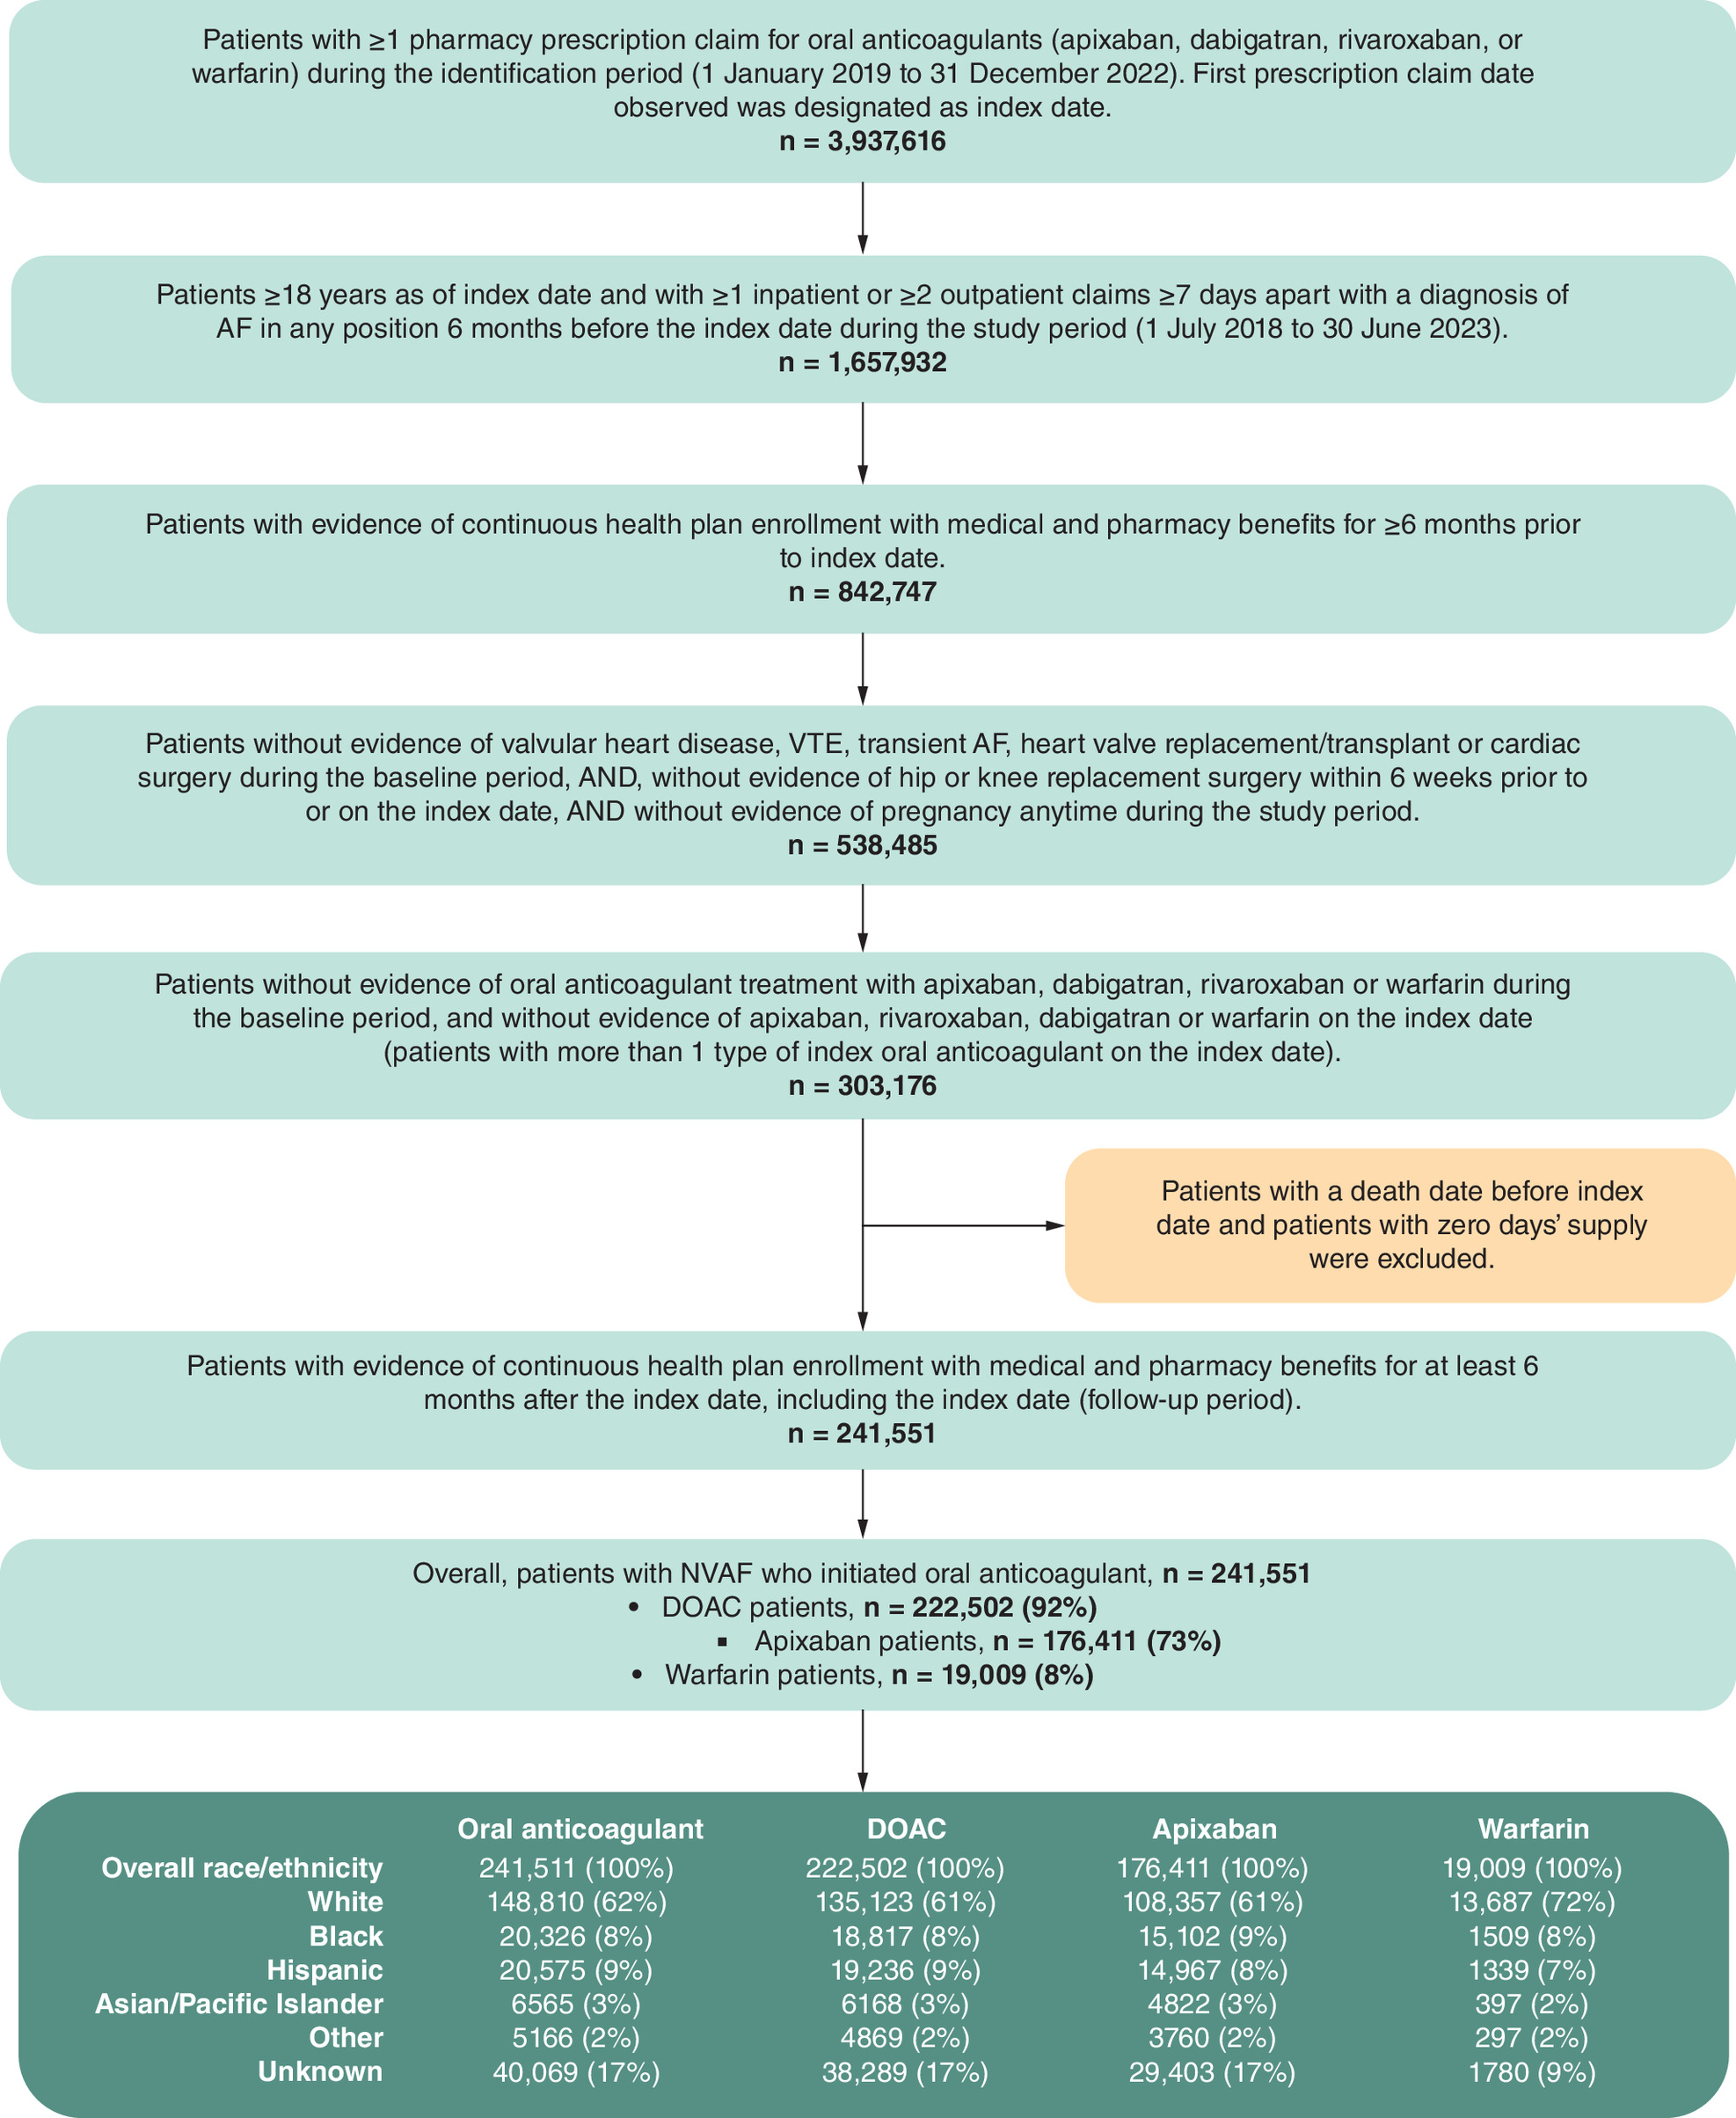
Figure 2. Patient selection.
AF: Atrial fibrillation; DOAC: Direct oral anticoagulant; NVAF: Nonvalvular atrial fibrillation; VTE: Venous thromboembolism.
Study cohorts
Outcomes were compared between patients receiving apixaban to those receiving warfarin (apixaban-warfarin cohort), as well as between patients receiving DOACs (apixaban, dabigatran or rivaroxaban) to those receiving warfarin (DOAC-warfarin cohort). Since a considerable proportion of patients on DOACs were treated with apixaban, the apixaban-warfarin cohort was analyzed to gain insights into the treatment patterns. This comparison was conducted for the overall patient cohort and among, non-Hispanic White (White), non-Hispanic Black (Black) and Hispanic patients. Patients were assigned to treatment groups based on the treatment they received on the index date, with those in the apixaban treatment group being a subset of the patients included in the DOAC treatment group.
Study variables & outcomes
Demographic variables, including age, sex, US geographic region and index year were measured on the index date. Clinical characteristics were measured during the baseline period (6 months prior to index date) and included the Charlson Comorbidity Index (CCI) score, risk of stroke measured by the CHA2DS2-VASc (congestive heart failure, hypertension, age ≥75 years, diabetes mellitus, prior stroke or transient ischemic attack or thromboembolism, vascular disease, aged 65–74 years, sex category) score, risk of bleeding measured by HAS-BLED (hypertension, abnormal renal and liver function, stroke, bleeding, labile international normalized ratios [INR], elderly, drugs or alcohol use) score, AF diagnosis setting, AF diagnosis type, baseline comorbidities and baseline medications. Since INR values were not available in the database, a modified version of HAS-BLED without the INR component was utilized.
The primary outcomes were time to discontinuation (TTD), time to switch (TTS) and various switching patterns, which were assessed among patients who discontinued the index treatment. The weighted incidence rate for treatment outcomes was calculated for all cohorts per 100 person-years. The numerator was the number of patients who discontinued/switched, and the denominator was the total time at risk (person-years).
Discontinuation was defined as a gap of 60 days or more without a prescription for the indexed oral anticoagulant after the last day of supply from the most recently filled prescription [34,35]. The discontinuation date was then recorded as the 60th day following the last day of the prescription supply for the indexed anticoagulant. TTD was measured in days and calculated from the day after the index date to the date of discontinuation of the index oral anticoagulant treatment. The discontinuation events did not include switches, and the switching patterns were observed among patients who discontinued the index oral anticoagulant. A treatment switch was defined as the first prescription for a different oral anticoagulant other than the index medication following the discontinuation date and before the study end. TTS was also reported in days, defined as the day after the index date to the date of a new oral anticoagulant prescription. Among patients who switched, the proportion of patients who switched to other oral anticoagulants was recorded. Additionally, time to treatment initiation was measured as the number of days from the first documented NVAF diagnosis to the index date.
A sensitivity analysis was conducted to examine the proportion of discontinued patients and TTD using a gap of 30 days or more following the last day of supply from the most recently filled prescription.
Statistical analysis
Descriptive statistics were used to analyze the baseline characteristics and study outcomes for DOAC-warfarin and apixaban-warfarin cohorts in the overall population and White, Black and Hispanic subpopulations. For continuous variables, mean, standard deviation (SD) and median were reported. For categorical variables, counts and proportions were reported. Student’s t-test or Wilcoxon rank sum test for continuous variables and chi-square test or Fisher’s exact test for categorical variables were used to compare the statistical differences in patient characteristics and treatment outcomes between the treatment groups and obtain p-values. Standardized mean differences (SMDs) were also computed and reported to compare the differences in patient characteristics and treatment outcomes between the treatment groups at baseline. Methods for handling missing data were not applied, as the proportion of missing values was minimal.
Inverse probability of treatment weighting (IPTW) was used to balance patient characteristics within two separate comparisons: the apixaban-warfarin cohort and the DOAC-warfarin cohort. IPTW was used when comparing outcomes between the overall populations and by race/ethnicity within each cohort. The propensity score model included continuous age, gender, geographic region, NVAF diagnosis type and setting, continuous CCI score, history of bleeding and stroke, baseline comorbidities not captured in the CCI and baseline medications. The model also included the index year of treatment as a covariate in the IPTW analysis and thereby allowing to adjust for any temporal trends in DOAC use during the study period. Additionally, race/ethnicity was included in the propensity score model for the overall population within each cohort (apixaban-warfarin and DOAC-warfarin). After the weights were applied, the baseline covariate balance between the treatment groups was assessed, with variables considered balanced if the SMD was ≤0.1. It is important to note that since the IPTW was calculated separately for each cohort, the weights applied to warfarin patients could vary between cohorts, leading to differences in baseline characteristics and outcomes among warfarin patients in the apixaban-warfarin and DOAC-warfarin cohorts. The proportional hazard assumption was assessed and confirmed for all Cox models used in the outcomes analyses. Cox proportional hazard models were used to estimate the TTS and TTD, incorporating the IPTW weights and any baseline covariates that remained unbalanced after weighting. Comparisons were then made between the study groups (apixaban vs warfarin, DOAC vs warfarin), using the warfarin group as the reference category. Results were presented as adjusted hazard ratios (aHRs) with 95% CIs, where the aHR represents the relative risk of the event occurring in one group compared with another, after adjusting for certain covariates included in the model which were not balanced after IPTW.
This study utilized SQL programming for data gathering, cleaning, and query using Snowflake on the Komodo server. All statistical analyses were performed using SAS software, version 9.4 (SAS Institute). This study was compliant with the STROBE (Strengthening the Reporting of Observational studies in Epidemiology) statement.
Results
Baseline characteristics by race/ethnicity
After applying the selection criteria, a total of 195,420 patients with NVAF newly initiated treatment in the apixaban-warfarin cohort. Of these, 122,044 (62.5%) were White, 16,611 (8.5%) Black, 16,306 (8.3%) Hispanic, 5219 (2.7%) Asian/Pacific Islander, 4057 (2.1%) Other and 31,183 (16.0%) had Unknown race/ethnicity. The percentages reported are calculated among patients initiating one of the treatments of interest included in the study (e.g., apixaban, rivaroxaban and dabigatran). Given edoxaban’s small sample size in the study, it was not included as a treatment of interest and was not part of the denominator for these calculations. For this study, the analysis focused on both the overall population and the race/ethnicity subgroups, specifically White, Black and Hispanic patients. The mean age for the overall population in the apixaban-warfarin cohort was 68.7 years, with the following breakdown of age in years by race/ethnicity: 71.5 for White, 67.2 for Black and 70.3 for Hispanic patients. The average CHA2DS2-VASc score, which measures stroke risk was 3.5 for the overall cohort, with higher risk scores among Black and Hispanic patients (4.1 and 4.2, respectively) than White patients (3.7). The mean HAS-BLED score, which assesses bleeding risk was 3.0 for the overall cohort, with scores of 3.1 for White, 3.4 for Black, and 3.3 for Hispanic patients. Additional patient characteristics in the overall apixaban-warfarin cohort, as well as those by race/ethnicity and treatment, can be found in Table 1.
| Overall (n = 195,420) | White (n = 122,044) | Black (n = 16,611) | Hispanic (n = 16,306) | |
|---|---|---|---|---|
| Age in years, mean (SD) | 68.7 (12.0) | 71.5 (11.0) | 67.2 (12.4) | 70.3 (12.4) |
| Median | 69.0 | 72.0 | 68.0 | 72.0 |
| Age group in years, n (%) | ||||
| 18–34 years | 1350 (0.7%) | 460 (0.4%) | 185 (1.1%) | 135 (0.8%) |
| 35–44 years | 4403 (2.3%) | 1562 (1.3%) | 560 (3.4%) | 395 (2.4%) |
| 45–54 years | 16,516 (8.5%) | 6283 (5.1%) | 1765 (10.6%) | 1288 (7.9%) |
| 55–64 years | 52,432 (26.8%) | 24,068 (19.7%) | 4240 (25.5%) | 3306 (20.3%) |
| 66–74 years | 51,561 (26.4%) | 36,715 (30.1%) | 4858 (29.2%) | 4269 (26.2%) |
| ≥75 years | 69,158 (35.4%) | 52,956 (43.4%) | 5003 (30.1%) | 6913 (42.4%) |
| Gender, n (%) | ||||
| Male | 114,268 (58.5%) | 69,247 (56.7%) | 8400 (50.6%) | 8487 (52.0%) |
| Female | 81,152 (41.5%) | 52,797 (43.3%) | 8211 (49.4%) | 7819 (48.0%) |
| Geographic region, n (%) | ||||
| Northeast | 50,460 (25.8%) | 31,843 (26.1%) | 4345 (26.2%) | 3589 (22.0%) |
| Mid-West | 44,149 (22.6%) | 30,992 (25.4%) | 3268 (19.7%) | 1078 (6.6%) |
| South | 61,786 (31.6%) | 36,609 (30.0%) | 7053 (42.5%) | 5052 (31.0%) |
| West | 30,847 (15.8%) | 17,794 (14.6%) | 1191 (7.2%) | 5540 (34.0%) |
| Other/Unknown | 8178 (4.2%) | 4806 (3.9%) | 754 (4.5%) | 1047 (6.4%) |
| NVAF diagnosis type, n (%) | ||||
| Paroxysmal AF | 76,037 (38.9%) | 47,086 (38.6%) | 6076 (36.6%) | 6166 (37.8%) |
| Persistent AF | 8372 (4.3%) | 5368 (4.4%) | 554 (3.3%) | 550 (3.4%) |
| Chronic AF | 12,095 (6.2%) | 8129 (6.7%) | 898 (5.4%) | 1156 (7.1%) |
| Unspecified AF | 127,148 (65.1%) | 78,171 (64.1%) | 11,301 (68.0%) | 10,950 (67.2%) |
| NVAF diagnosis setting†, n (%) | ||||
| Inpatient only | 94,643 (48.4%) | 57,506 (47.1%) | 8978 (54.0%) | 8619 (52.9%) |
| Outpatient only | 100,777 (51.6%) | 64,538 (52.9%) | 7633 (46.0%) | 7687 (47.1%) |
| Quan-CCI, mean (SD) | 2.8 (2.6) | 2.8 (2.6) | 3.9 (2.8) | 3.5 (2.7) |
| Median | 2.0 | 2.0 | 3.0 | 3.0 |
| CHA2DS2-VASc score, mean (SD) | 3.5 (1.9) | 3.7 (1.8) | 4.1 (1.8) | 4.2 (1.9) |
| Median | 3.0 | 4.0 | 4.0 | 4.0 |
| HAS-BLED score‡, mean (SD) | 3.0 (1.3) | 3.1 (1.3) | 3.4 (1.3) | 3.3 (1.3) |
| Median | 3.0 | 3.0 | 3.0 | 3.0 |
| Baseline comorbidities, n (%) | ||||
| History of bleeding | 24,458 (12.5%) | 15,960 (13.1%) | 2459 (14.8%) | 2260 (13.9%) |
| History of stroke | 42,631 (21.8%) | 27,479 (22.5%) | 4802 (28.9%) | 4062 (24.9%) |
| Renal disease | 59,072 (30.2%) | 36,739 (30.1%) | 7920 (47.7%) | 6259 (38.4%) |
| Dyspepsia or stomach discomfort | 29,761 (15.2%) | 17,878 (14.6%) | 3248 (19.6%) | 3386 (20.8%) |
| Diabetes | 70,611 (36.1%) | 41,320 (33.9%) | 8493 (51.1%) | 8645 (53.0%) |
| Hypertension | 159,977 (81.9%) | 100,169 (82.1%) | 15,340 (92.3%) | 14,522 (89.1%) |
| Congestive heart failure | 63,635 (32.6%) | 39,300 (32.2%) | 7806 (47.0%) | 6442 (39.5%) |
| Anemia and coagulation defects | 55,404 (28.4%) | 34,923 (28.6%) | 6593 (39.7%) | 6123 (37.6%) |
| Coronary artery disease | 76,262 (39.0%) | 49,635 (40.7%) | 7103 (42.8%) | 6971 (42.8%) |
| Baseline medications, n (%) | ||||
| ACEs/ARBs | 93,844 (48.0%) | 58,000 (47.5%) | 8635 (52.0%) | 8938 (54.8%) |
| Beta-blockers | 87,023 (44.5%) | 55,334 (45.3%) | 6466 (38.9%) | 6779 (41.6%) |
| Renin-angiotensin system antagonists | 97,164 (49.7%) | 60,262 (49.4%) | 9037 (54.4%) | 9121 (55.9%) |
| Statin | 96,026 (49.1%) | 61,453 (50.4%) | 8420 (50.7%) | 8882 (54.5%) |
| Inhibitor of warfarin | 123,883 (63.4%) | 77,458 (63.5%) | 11,546 (69.5%) | 10,790 (66.2%) |
| Diuretic | 75,027 (38.4%) | 47,672 (39.1%) | 8281 (49.9%) | 6379 (39.1%) |
†
Inpatient only and outpatient only are mutually exclusive categories referring to the setting of the first diagnosis.
‡
A modified HAS-BLED score was used without the requirement of labile INR values.
Continuous age, gender, geographic region, NVAF diagnosis type and setting, continuous CCI score, history of bleeding and stroke, baseline comorbidities not listed in CCI and baseline medications were balanced in all the race/ethnicity groups at the baseline using IPTW. Additionally, race/ethnicity was balanced for overall cohorts.
ACE: Angiotensin-converting enzyme inhibitor; AF: Atrial fibrillation; ARB: Angiotensin receptor blocker; CCI: Charlson Comorbidity Index; CHA2DS2-VASc: Congestive heart failure, hypertension, age ≥75 years, diabetes mellitus, prior stroke or transient ischemic attack or thromboembolism, vascular disease, aged 65–74 years, sex category; HAS-BLED: Hypertension, abnormal renal and liver function, stroke, bleeding, elderly, drugs and alcohol; INR: International normalized ratio; IPTW: Inverse probability treatment weighting; NVAF: Nonvalvular atrial fibrillation; SD: Standard deviation; SE: Systemic embolism; SMD: Standardized mean difference.
A similar race/ethnicity distribution was observed in the DOAC-warfarin cohort, which included 241,511 patients. Of these, 148,810 (61.6%) were White, 20,326 (8.4%) Black, 20,575 (8.5%) Hispanic, 6565 (2.7%) Asian/Pacific Islander, 5166 (2.1%) Other and 40,069 (16.6%) had Unknown race/ethnicity. This cohort included patients in the apixaban-warfarin cohort plus those patients who initiated treatment with other DOACs, specifically with dabigatran or rivaroxaban. Patients in the DOAC-warfarin cohort were similar to those in the apixaban-warfarin cohort, as shown in Table 2.
| Overall (n = 241,511) | White (n = 148,810) | Black (n = 20,326) | Hispanic (n = 20,575) | |
|---|---|---|---|---|
| Age in years, mean (SD) | 68.3 (12.1) | 71.1 (11.2) | 66.7 (12.5) | 69.8 (12.5) |
| Median | 68.0 | 72.0 | 67.0 | 71.0 |
| Age group in years, n (%) | ||||
| 18–34 years | 1898 (0.8%) | 650 (0.4%) | 257 (1.3%) | 181 (0.9%) |
| 35–44 years | 6000 (2.5%) | 2115 (1.4%) | 742 (3.7%) | 555 (2.7%) |
| 45–54 years | 21,433 (8.9%) | 8122 (5.5%) | 2231 (11.0%) | 1700 (8.3%) |
| 55–64 years | 67,032 (27.8%) | 30,685 (20.6%) | 5325 (26.2%) | 4264 (20.7%) |
| 66–74 years | 63,445 (26.3%) | 44,974 (30.2%) | 5940 (29.2%) | 5448 (26.5%) |
| ≥75 years | 81,703 (33.8%) | 62,264 (41.8%) | 5831 (28.7%) | 8427 (41.0%) |
| Gender, n (%) | ||||
| Male | 143,514 (59.4%) | 85,708 (57.6%) | 10,450 (51.4%) | 10,978 (53.4%) |
| Female | 97,997 (40.6%) | 63,102 (42.4%) | 9876 (48.6%) | 9597 (46.6%) |
| Geographic region, n (%) | ||||
| Northeast | 61,316 (25.4%) | 38,063 (25.6%) | 5220 (25.7%) | 4286 (20.8%) |
| Mid-West | 54,452 (22.5%) | 37,644 (25.3%) | 4035 (19.9%) | 1349 (6.6%) |
| South | 76,041 (31.5%) | 44,639 (30.0%) | 8580 (42.2%) | 6409 (31.1%) |
| West | 39,376 (16.3%) | 22,516 (15.1%) | 1556 (7.7%) | 7091 (34.5%) |
| Other/Unknown | 10,326 (4.3%) | 5948 (4.0%) | 935 (4.6%) | 1440 (7.0%) |
| NVAF diagnosis type, n (%) | ||||
| Paroxysmal AF | 94,902 (39.3%) | 57,986 (39.0%) | 7484 (36.8%) | 7789 (37.9%) |
| Persistent AF | 10,601 (4.4%) | 6668 (4.5%) | 680 (3.3%) | 712 (3.5%) |
| Chronic AF | 15,346 (6.4%) | 10,117 (6.8%) | 1144 (5.6%) | 1566 (7.6%) |
| Unspecified AF | 154,751 (64.1%) | 93,933 (63.1%) | 13,674 (67.3%) | 13,574 (66.0%) |
| NVAF diagnosis setting†, n (%) | ||||
| Inpatient only | 110,487 (45.7%) | 66,400 (44.6%) | 10,462 (51.5%) | 10,175 (49.5%) |
| Outpatient only | 131,024 (54.3%) | 82,410 (55.4%) | 9864 (48.5%) | 10,400 (50.5%) |
| Quan-CCI, mean (SD) | 2.7 (2.6) | 2.7 (2.5) | 3.8 (2.8) | 3.4 (2.7) |
| Median | 2.0 | 2.0 | 3.0 | 3.0 |
| CHA2DS2-VASc score, mean (SD) | 3.4 (1.9) | 3.6 (1.8) | 4.1 (1.8) | 4.1 (1.9) |
| Median | 3.0 | 4.0 | 4.0 | 4.0 |
| HAS-BLED score‡, mean (SD) | 3.0 (1.3) | 3.1 (1.3) | 3.3 (1.3) | 3.2 (1.3) |
| Median | 3.0 | 3.0 | 3.0 | 3.0 |
| Baseline comorbidities, n (%) | ||||
| History of bleeding | 28,995 (12.0%) | 18,728 (12.6%) | 2937 (14.4%) | 2715 (13.2%) |
| History of stroke | 50,313 (20.8%) | 32,230 (21.7%) | 5655 (27.8%) | 4868 (23.7%) |
| Renal disease | 69,098 (28.6%) | 42,698 (28.7%) | 9195 (45.2%) | 7532 (36.6%) |
| Dyspepsia or stomach discomfort | 35,923 (14.9%) | 21,336 (14.3%) | 3923 (19.3%) | 4161 (20.2%) |
| Diabetes | 86,135 (35.7%) | 49,880 (33.5%) | 10,251 (50.4%) | 10,787 (52.4%) |
| Hypertension | 196,769 (81.5%) | 121,708 (81.8%) | 18,750 (92.2%) | 18,245 (88.7%) |
| Congestive heart failure | 76,362 (31.6%) | 46,740 (31.4%) | 9375 (46.1%) | 7954 (38.7%) |
| Anemia and coagulation defects | 65,788 (27.2%) | 41,230 (27.7%) | 7711 (37.9%) | 7441 (36.2%) |
| Coronary artery disease | 91,951 (38.1%) | 59,404 (39.9%) | 8494 (41.8%) | 8633 (42.0%) |
| Baseline medications, n (%) | ||||
| ACEs/ARBs | 115,279 (47.7%) | 70,353 (47.3%) | 10,564 (52.0%) | 11,247 (54.7%) |
| Beta-blockers | 108,003 (44.7%) | 67,663 (45.5%) | 7958 (39.2%) | 8549 (41.6%) |
| Renin-angiotensin system antagonists | 82,201 (34.0%) | 49,021 (32.9%) | 9336 (45.9%) | 7405 (36.0%) |
| Statin | 119,337 (49.4%) | 73,099 (49.1%) | 11,041 (54.3%) | 11,487 (55.8%) |
| Inhibitor of warfarin | 117,029 (48.5%) | 74,138 (49.8%) | 10,125 (49.8%) | 11,125 (54.1%) |
| Diuretic | 91,536 (37.9%) | 57,546 (38.7%) | 10,086 (49.6%) | 7989 (38.8%) |
†
Inpatient only and outpatient only are mutually exclusive categories referring to the setting of the first diagnosis.
‡
A modified HAS-BLED score was used without the requirement of labile INR values.
Continuous age, gender, geographic region, NVAF diagnosis type and setting, continuous CCI score, history of bleeding and stroke, baseline comorbidities not listed in CCI and baseline medications were balanced in all the race/ethnicity groups at the baseline using IPTW. Additionally, race/ethnicity was balanced for overall cohorts.
ACE: Angiotensin-converting enzyme inhibitor; AF: Atrial fibrillation; ARB: Angiotensin receptor blocker; CCI: Charlson Comorbidity Index; CHA2DS2-VASc: Congestive heart failure, hypertension, age ≥75 years, diabetes mellitus, prior stroke or transient ischemic attack or thromboembolism, vascular disease, aged 65–74 years, sex category; HAS-BLED: Hypertension, abnormal renal and liver function, stroke, bleeding, elderly, drugs and alcohol; INR: International normalized ratio; IPTW: Inverse probability treatment weighting; NVAF: Nonvalvular atrial fibrillation; SD: Standard deviation; SE: Systemic embolism; SMD: Standardized mean difference.
Baseline characteristics by treatment pre- & post-IPTW
In the apixaban-warfarin cohort, 90.3% (n = 176,411) of patients initiated treatment with apixaban, while 9.7% (n = 19,009) initiated treatment with warfarin. This proportion of patients initiating treatment with apixaban increased from 80.7% in 2019 to 96.4% in 2022.
When comparing apixaban patients to those on warfarin, several differences were observed across the overall cohort and by race/ethnicity. The apixaban group tended to be younger than the warfarin group (68.4% vs 71.7% respectively) with the exception of Black patients, had a higher proportion of female patients (41.8% vs 39.4%), had more patients from the South geographic region of the US (32.6% vs 22.7%), and had fewer patients from the Mid-West region (21.6% vs 32.1%). Apixaban patients in comparison to warfarin patients also had a lower proportion of chronic AF (5.0% vs 17.2%) and a higher proportion of paroxysmal AF (39.7% vs 31.2%). They were more frequently diagnosed in the inpatient setting (50.8% vs 26.6%) and had lower mean CHA2DS2-VASc scores (except among Hispanic patients), though they had higher mean HAS-BLED scores (Supplementary Table 1). In the DOAC-warfarin cohort, the differences between patients receiving DOACs and those on warfarin were similar to those observed in the apixaban-warfarin cohort; however, the differences were significant across all race/ethnicity groups (Supplementary Table 2).
Post-IPTW baseline characteristics for both the apixaban-warfarin and DOAC-warfarin cohorts overall and by race/ethnic group are reported in Tables 3 & 4, respectively. Post-IPTW, all baseline characteristics were balanced, except for age. Therefore, age was adjusted for in the weighted Cox regression analysis when SMD for continuous age was >0.1 after IPTW. This adjustment was made for the overall cohort, for the White and Hispanic populations in the apixaban-warfarin cohort, and for the Hispanic population in the DOAC-warfarin cohort.
| Overall | White | Black | Hispanic | |||||||||
|---|---|---|---|---|---|---|---|---|---|---|---|---|
| Apixaban (n = 176,365) | Warfarin (n = 19,722) | SMD† | Apixaban (n = 108,308) | Warfarin (n = 14,172) | SMD† | Apixaban (n = 15,105) | Warfarin (n = 1508) | SMD† | Apixaban (n = 14,967) | Warfarin (n = 1390) | SMD† | |
| Age in years, mean (SD) | 68.7 (12.0) | 67.3 (12.6) | 0.11 | 71.5 (11.1) | 70.2 (11.7) | 0.11 | 67.2 (12.5) | 66.4 (12.1) | 0.07 | 70.2 (12.5) | 68.3 (12.2) | 0.16 |
| Median | 69.0 | 68.0 | 72.0 | 71.0 | 68.0 | 67.0 | 72.0 | 70.0 | ||||
| Age group in years, n (%) | ||||||||||||
| 18–34 years | 1195 (0.7%) | 239 (1.2%) | 0.05 | 396 (0.4%) | 119 (0.8%) | 0.06 | 171 (1.1%) | 16 (1.0%) | 0.01 | 125 (0.8%) | 7 (0.5%) | 0.04 |
| 35–44 years | 3971 (2.3%) | 551 (2.8%) | 0.03 | 1383 (1.3%) | 235 (1.7%) | 0.03 | 514 (3.4%) | 51 (3.4%) | 0.00 | 364 (2.4%) | 47 (3.4%) | 0.05 |
| 45–54 years | 14,917 (8.5%) | 2012 (10.2%) | 0.06 | 5600 (5.2%) | 878 (6.2%) | 0.04 | 1612 (10.7%) | 182 (12.1%) | 0.04 | 1198 (8.0%) | 116 (8.4%) | 0.01 |
| 55–64 years | 47,548 (27.0%) | 5533 (28.1%) | 0.02 | 21,469 (19.8%) | 3032 (21.4%) | 0.04 | 3840 (25.4%) | 405 (26.9%) | 0.03 | 3054 (20.4%) | 343 (24.7%) | 0.10 |
| 66–74 years | 46,576 (26.4%) | 5071 (25.7%) | 0.02 | 32,681 (30.2%) | 4172 (29.4%) | 0.02 | 4413 (29.2%) | 449 (29.8%) | 0.01 | 3869 (25.9%) | 406 (29.2%) | 0.07 |
| ≥75 years | 62,158 (35.2%) | 6316 (32.0%) | 0.07 | 46,779 (43.2%) | 5736 (40.5%) | 0.05 | 4555 (30.2%) | 404 (26.8%) | 0.07 | 6357 (42.5%) | 471 (33.9%) | 0.18 |
| Gender, n (%) | ||||||||||||
| Male | 103,135 (58.5%) | 11,704 (59.3%) | 0.02 | 61,463 (56.8%) | 8205 (57.9%) | 0.02 | 7639 (50.6%) | 751 (49.8%) | 0.02 | 7795 (52.1%) | 753 (54.2%) | 0.04 |
| Female | 73,230 (41.5%) | 8018 (40.7%) | 0.02 | 46,845 (43.3%) | 5966 (42.1%) | 0.02 | 7466 (49.4%) | 757 (50.2%) | 0.02 | 7172 (47.9%) | 636 (45.8%) | 0.04 |
| Geographic region, n (%) | ||||||||||||
| Northeast | 45,503 (25.8%) | 4953 (25.1%) | 0.02 | 28,231 (26.1%) | 3583 (25.3%) | 0.02 | 3949 (26.1%) | 386 (25.6%) | 0.01 | 3293 (22.0%) | 312 (22.5%) | 0.01 |
| Mid-West | 39,869 (22.6%) | 4671 (23.7%) | 0.03 | 27,531 (25.4%) | 3817 (26.9%) | 0.03 | 2977 (19.7%) | 317 (21.0%) | 0.03 | 989 (6.6%) | 112 (8.0%) | 0.05 |
| South | 55,766 (31.6%) | 6184 (31.4%) | 0.01 | 32,494 (30.0%) | 4150 (29.3%) | 0.02 | 6413 (42.5%) | 654 (43.4%) | 0.02 | 4637 (31.0%) | 433 (31.1%) | 0.00 |
| West | 27,843 (15.8%) | 3041 (15.4%) | 0.01 | 15,791 (14.6%) | 2060 (14.5%) | 0.00 | 1083 (7.2%) | 92 (6.1%) | 0.04 | 5086 (34.0%) | 446 (32.1%) | 0.04 |
| Other/Unknown | 7384 (4.2%) | 874 (4.4%) | 0.01 | 4262 (3.9%) | 562 (4.0%) | 0.00 | 684 (4.5%) | 59 (3.9%) | 0.03 | 961 (6.4%) | 87 (6.2%) | 0.01 |
| NVAF diagnosis type, n (%) | ||||||||||||
| Paroxysmal AF | 68,662 (38.9%) | 8054 (40.8%) | 0.04 | 41,827 (38.6%) | 5782 (40.8%) | 0.04 | 5526 (36.6%) | 566 (37.6%) | 0.02 | 5661 (37.8%) | 563 (40.5%) | 0.05 |
| Persistent AF | 7560 (4.3%) | 867 (4.4%) | 0.01 | 4765 (4.4%) | 608 (4.3%) | 0.01 | 505 (3.3%) | 50 (3.3%) | 0.00 | 505 (3.4%) | 39 (2.8%) | 0.03 |
| Chronic AF | 10,894 (6.2%) | 1135 (5.8%) | 0.02 | 7182 (6.6%) | 867 (6.1%) | 0.02 | 819 (5.4%) | 84 (5.6%) | 0.01 | 1067 (7.1%) | 103 (7.4%) | 0.01 |
| Unspecified AF | 114,745 (65.1%) | 12,838 (65.1%) | 0.00 | 69,376 (64.1%) | 9068 (64.0%) | 0.00 | 10,275 (68.0%) | 1,015 (67.4%) | 0.01 | 10,041 (67.1%) | 897 (64.6%) | 0.05 |
| NVAF diagnosis setting‡, n (%) | ||||||||||||
| Inpatient only | 85,475 (48.5%) | 10,359 (52.5%) | 0.08 | 51,082 (47.2%) | 7151 (50.5%) | 0.07 | 8162 (54.0%) | 826 (54.8%) | 0.01 | 7912 (52.9%) | 785 (56.5%) | 0.07 |
| Outpatient only | 90,890 (51.5%) | 9363 (47.5%) | 0.08 | 57,226 (52.8%) | 7021 (49.5%) | 0.07 | 6943 (46.0%) | 682 (45.2%) | 0.01 | 7055 (47.1%) | 604 (43.5%) | 0.07 |
| Quan-CCI, mean (SD) | 2.8 (2.6) | 3.0 (2.5) | 0.08 | 2.8 (2.6) | 3.1 (2.5) | 0.09 | 3.9 (2.8) | 4.1 (2.7) | 0.08 | 3.5 (2.7) | 3.8 (2.6) | 0.09 |
| Median | 2.0 | 3.0 | 2.0 | 3.0 | 3.0 | 4.0 | 3.0 | 4.0 | ||||
| CHA2DS2-VASc score, mean (SD) | 3.5 (1.9) | 3.6 (1.7) | 0.07 | 3.7 (1.8) | 3.8 (1.7) | 0.07 | 4.1 (1.8) | 4.3 (1.6) | 0.09 | 4.2 (1.9) | 4.2 (1.8) | 0.01 |
| Median | 3.0 | 4.0 | 4.0 | 4.0 | 4.0 | 4.0 | 4.0 | 4.0 | ||||
| HAS-BLED score§, mean (SD) | 3.0 (1.3) | 2.9 (1.3) | 0.09 | 3.2 (1.3) | 3.1 (1.3) | 0.08 | 3.4 (1.3) | 3.3 (1.3) | 0.07 | 3.3 (1.3) | 3.2 (1.3) | 0.11 |
| Median | 3.0 | 3.0 | 3.0 | 3.0 | 3.0 | 3.0 | 3.0 | 3.0 | ||||
| Baseline comorbidities, n (%) | ||||||||||||
| History of bleeding | 22,179 (12.6%) | 2909 (14.8%) | 0.06 | 14,247 (13.2%) | 2190 (15.5%) | 0.07 | 2230 (14.8%) | 286 (18.9%) | 0.11 | 2042 (13.6%) | 280 (20.2%) | 0.17 |
| History of stroke | 38,596 (21.9%) | 4803 (24.4%) | 0.06 | 24,486 (22.6%) | 3633 (25.7%) | 0.07 | 4371 (28.9%) | 454 (30.1%) | 0.03 | 3738 (25.0%) | 402 (29.0%) | 0.09 |
| Renal disease | 53,250 (30.2%) | 6622 (33.6%) | 0.07 | 32,584 (30.1%) | 4724 (33.4%) | 0.07 | 7175 (47.5%) | 802 (53.2%) | 0.11 | 5722 (38.2%) | 602 (43.4%) | 0.10 |
| Dyspepsia or stomach discomfort | 26,909 (15.3%) | 3410 (17.3%) | 0.05 | 15,906 (14.7%) | 2319 (16.4%) | 0.05 | 2956 (19.6%) | 322 (21.3%) | 0.04 | 3109 (20.8%) | 322 (23.2%) | 0.06 |
| Diabetes | 63,137 (35.8%) | 8117 (41.2%) | 0.11 | 36,250 (33.5%) | 5501 (38.9%) | 0.11 | 7674 (50.8%) | 835 (55.4%) | 0.09 | 7902 (52.8%) | 803 (57.8%) | 0.10 |
| Hypertension | 144,499 (81.9%) | 16,602 (84.2%) | 0.06 | 88,991 (82.2%) | 11,945 (84.4%) | 0.06 | 13,954 (92.4%) | 1406 (93.3%) | 0.03 | 13,331 (89.1%) | 1233 (88.7%) | 0.01 |
| Congestive heart failure | 57,078 (32.4%) | 7715 (39.1%) | 0.14 | 34,730 (32.1%) | 5,300 (37.5%) | 0.11 | 7034 (46.6%) | 854 (56.7%) | 0.20 | 5889 (39.3%) | 627 (45.1%) | 0.12 |
| Anemia and coagulation defects | 50,143 (28.4%) | 6136 (31.1%) | 0.06 | 31,102 (28.7%) | 4447 (31.4%) | 0.06 | 6005 (39.8%) | 657 (43.6%) | 0.08 | 5624 (37.6%) | 552 (39.7%) | 0.04 |
| Coronary artery disease | 68,977 (39.1%) | 8433 (42.8%) | 0.07 | 44,168 (40.8%) | 6,420 (45.4%) | 0.09 | 6,467 (42.8%) | 664 (44.1%) | 0.03 | 6408 (42.8%) | 659 (47.4%) | 0.09 |
| Baseline medications, n (%) | ||||||||||||
| ACEs/ARBs | 84,695 (48.0%) | 9722 (49.3%) | 0.03 | 51,463 (47.5%) | 6901 (48.7%) | 0.02 | 7849 (52.0%) | 769 (51.0%) | 0.02 | 8,206 (54.8%) | 780 (56.1%) | 0.03 |
| Beta-blockers | 78,541 (44.5%) | 9027 (45.8%) | 0.02 | 49,113 (45.4%) | 6694 (47.2%) | 0.04 | 5886 (39.0%) | 631 (41.9%) | 0.06 | 6228 (41.6%) | 641 (46.2%) | 0.09 |
| Renin-angiotensin system antagonists | 87,701 (49.7%) | 10,052 (51.0%) | 0.02 | 53,481 (49.4%) | 7159 (50.5%) | 0.02 | 8214 (54.4%) | 806 (53.4%) | 0.02 | 8373 (56.0%) | 793 (57.1%) | 0.02 |
| Statin | 86,665 (49.1%) | 9850 (50.0%) | 0.02 | 54,535 (50.4%) | 7298 (51.5%) | 0.02 | 7661 (50.7%) | 787 (52.2%) | 0.03 | 8153 (54.5%) | 764 (55.0%) | 0.01 |
| Inhibitor of warfarin | 111,861 (63.4%) | 12,931 (65.6%) | 0.04 | 68,784 (63.5%) | 9315 (65.7%) | 0.05 | 10,502 (69.5%) | 1071 (71.0%) | 0.03 | 9909 (66.2%) | 975 (70.1%) | 0.08 |
| Diuretic | 67,755 (38.4%) | 7830 (39.7%) | 0.03 | 42,340 (39.1%) | 5691 (40.2%) | 0.02 | 7533 (49.9%) | 785 (52.1%) | 0.04 | 5852 (39.1%) | 550 (39.6%) | 0.01 |
†
SMDs >10% were considered significant, and are boldface. p-values also were significant (p < 0.05) for the relevant cells.
‡
Inpatient only and outpatient only are mutually exclusive categories referring to the setting of the first diagnosis.
§
A modified HAS-BLED score was used without the requirement of labile INR values.
Continuous age, gender, geographic region, NVAF diagnosis type and setting, continuous CCI score, history of bleeding and stroke, baseline comorbidities not listed in CCI, and baseline medications were balanced in all the race/ethnicity groups at the baseline using IPTW. Additionally, race/ethnicity was balanced for overall cohorts.
ACE: Angiotensin-converting enzyme inhibitor; AF: Atrial fibrillation; ARB: Angiotensin receptor blocker; CCI: Charlson Comorbidity Index; CHA2DS2-VASc: Congestive heart failure, hypertension, age ≥75 years, diabetes mellitus, prior stroke or transient ischemic attack or thromboembolism, vascular disease, aged 65–74 years, sex category; HAS-BLED: Hypertension, abnormal renal and liver function, stroke, bleeding, elderly, drugs and alcohol; INR: International normalized ratio; IPTW: Inverse probability treatment weighting; NVAF: Nonvalvular atrial fibrillation; SD: Standard deviation; SE: Systemic embolism; SMD: Standardized mean difference.
| Overall | White | Black | Hispanic | |||||||||
|---|---|---|---|---|---|---|---|---|---|---|---|---|
| DOAC (n = 222,477) | Warfarin (n = 19,647) | SMD† | DOAC (n = 135,091) | Warfarin (n = 14,139) | SMD† | DOAC (n = 18,820) | Warfarin (n = 1,502) | SMD† | DOAC (n = 19,236) | Warfarin (n = 1,377) | SMD† | |
| Age in years, mean (SD) | 68.2 (12.1) | 67.0 (12.6) | 0.10 | 71.1 (11.2) | 69.9 (11.8) | 0.10 | 66.7 (12.5) | 66.0 (12.2) | 0.06 | 69.8 (12.5) | 68.2 (12.3) | 0.13 |
| Median | 68.0 | 67.0 | 72.0 | 71.0 | 67.0 | 66.0 | 71.0 | 70.0 | ||||
| Age group in years, n (%) | ||||||||||||
| 18–34 years | 1725 (0.8%) | 261 (1.3%) | 0.05 | 578 (0.4%) | 132 (0.9%) | 0.06 | 242 (1.3%) | 17 (1.2%) | 0.01 | 171 (0.9%) | 8 (0.6%) | 0.04 |
| 35–44 years | 5521 (2.5%) | 586 (3.0%) | 0.03 | 1913 (1.4%) | 258 (1.8%) | 0.03 | 690 (3.7%) | 54 (3.6%) | 0.00 | 522 (2.7%) | 49 (3.6%) | 0.05 |
| 45–54 years | 19,731 (8.9%) | 2081 (10.6%) | 0.06 | 7385 (5.5%) | 920 (6.5%) | 0.04 | 2067 (11.0%) | 188 (12.5%) | 0.05 | 1601 (8.3%) | 118 (8.6%) | 0.01 |
| 55–64 years | 61,974 (27.9%) | 5578 (28.4%) | 0.01 | 27,966 (20.7%) | 3093 (21.9%) | 0.03 | 4918 (26.1%) | 408 (27.2%) | 0.02 | 4000 (20.8%) | 337 (24.5%) | 0.09 |
| 66–74 years | 58,497 (26.3%) | 5028 (25.6%) | 0.02 | 40,927 (30.3%) | 4167 (29.5%) | 0.02 | 5499 (29.2%) | 444 (29.5%) | 0.01 | 5052 (26.3%) | 402 (29.2%) | 0.07 |
| ≥75 years | 75,028 (33.7%) | 6113 (31.1%) | 0.06 | 56,323 (41.7%) | 5568 (39.4%) | 0.05 | 5404 (28.7%) | 391 (26.0%) | 0.06 | 7891 (41.0%) | 462 (33.6%) | 0.15 |
| Gender, n (%) | ||||||||||||
| Male | 132,207 (59.4%) | 11,787 (60.0%) | 0.01 | 77,813 (57.6%) | 8274 (58.5%) | 0.02 | 9676 (51.4%) | 760 (50.6%) | 0.02 | 10,266 (53.4%) | 760 (55.2%) | 0.04 |
| Female | 90,270 (40.6%) | 7860 (40.0%) | 0.01 | 57,278 (42.4%) | 5865 (41.5%) | 0.02 | 9144 (48.6%) | 743 (49.4%) | 0.02 | 8,970 (46.6%) | 617 (44.8%) | 0.04 |
| Geographic region, n (%) | ||||||||||||
| Northeast | 56,460 (25.4%) | 4862 (24.8%) | 0.01 | 34,537 (25.6%) | 3,514 (24.9%) | 0.02 | 4831 (25.7%) | 378 (25.2%) | 0.01 | 4006 (20.8%) | 292 (21.2%) | 0.01 |
| Mid-West | 50,170 (22.6%) | 4590 (23.4%) | 0.02 | 34,188 (25.3%) | 3,764 (26.6%) | 0.03 | 3740 (19.9%) | 318 (21.2%) | 0.03 | 1260 (6.6%) | 104 (7.5%) | 0.04 |
| South | 70,050 (31.5%) | 6144 (31.3%) | 0.00 | 40,526 (30.0%) | 4,151 (29.4%) | 0.01 | 7944 (42.2%) | 649 (43.2%) | 0.02 | 5992 (31.2%) | 433 (31.5%) | 0.01 |
| West | 36,280 (16.3%) | 3158 (16.1%) | 0.01 | 20,442 (15.1%) | 2,145 (15.2%) | 0.00 | 1440 (7.7%) | 97 (6.5%) | 0.05 | 6631 (34.5%) | 451 (32.8%) | 0.04 |
| Other/Unknown | 9,517 (4.3%) | 893 (4.6%) | 0.01 | 5397 (4.0%) | 565 (4.0%) | 0.00 | 865 (4.6%) | 60 (4.0%) | 0.03 | 1347 (7.0%) | 97 (7.0%) | 0.00 |
| NVAF diagnosis type, n (%) | ||||||||||||
| Paroxysmal AF | 87,445 (39.3%) | 8038 (40.9%) | 0.03 | 52,667 (39.0%) | 5,793 (41.0%) | 0.04 | 6929 (36.8%) | 559 (37.2%) | 0.01 | 7283 (37.9%) | 555 (40.3%) | 0.05 |
| Persistent AF | 9768 (4.4%) | 885 (4.5%) | 0.01 | 6054 (4.5%) | 621 (4.4%) | 0.00 | 630 (3.4%) | 50 (3.4%) | 0.00 | 666 (3.5%) | 41 (3.0%) | 0.03 |
| Chronic AF | 14,127 (6.4%) | 1172 (6.0%) | 0.02 | 9164 (6.8%) | 888 (6.3%) | 0.02 | 1061 (5.6%) | 88 (5.9%) | 0.01 | 1469 (7.6%) | 112 (8.1%) | 0.02 |
| Unspecified AF | 142,549 (64.1%) | 12,616 (64.2%) | 0.00 | 85,275 (63.1%) | 8918 (63.1%) | 0.00 | 12,660 (67.3%) | 1004 (66.8%) | 0.01 | 12,684 (65.9%) | 871 (63.3%) | 0.06 |
| NVAF diagnosis setting‡, n (%) | ||||||||||||
| Inpatient only | 101,826 (45.8%) | 9855 (50.2%) | 0.09 | 60,316 (44.7%) | 6,814 (48.2%) | 0.07 | 9685 (51.5%) | 785 (52.2%) | 0.02 | 9513 (49.5%) | 727 (52.8%) | 0.07 |
| Outpatient only | 120,651 (54.2%) | 9792 (49.8%) | 0.09 | 74,775 (55.4%) | 7324 (51.8%) | 0.07 | 9135 (48.5%) | 718 (47.8%) | 0.02 | 9723 (50.5%) | 649 (47.2%) | 0.07 |
| Quan-CCI, mean (SD) | 2.7 (2.6) | 2.9 (2.5) | 0.09 | 2.8 (2.5) | 3.0 (2.5) | 0.09 | 3.8 (2.8) | 4.0 (2.7) | 0.08 | 3.4 (2.7) | 3.7 (2.6) | 0.09 |
| Median | 2.0 | 2.0 | 2.0 | 3.0 | 3.0 | 4.0 | 3.0 | 3.0 | ||||
| CHA2DS2-VASc score, mean (SD) | 3.4 (1.9) | 3.6 (1.7) | 0.09 | 3.6 (1.8) | 3.8 (1.7) | 0.08 | 4.0 (1.8) | 4.2 (1.6) | 0.09 | 4.1 (1.9) | 4.1 (1.8) | 0.02 |
| Median | 3.0 | 4.0 | 4.0 | 4.0 | 4.0 | 4.0 | 4.0 | 4.0 | ||||
| HAS-BLED score§, mean (SD) | 3.0 (1.3) | 2.9 (1.3) | 0.07 | 3.1 (1.3) | 3.0 (1.3) | 0.06 | 3.4 (1.3) | 3.3 (1.3) | 0.06 | 3.3 (1.3) | 3.1 (1.3) | 0.09 |
| Median | 3.0 | 3.0 | 3.0 | 3.0 | 3.0 | 3.0 | 3.0 | 3.0 | ||||
| Baseline comorbidities, n (%) | ||||||||||||
| History of bleeding | 26,796 (12.0%) | 2784 (14.2%) | 0.06 | 17,069 (12.6%) | 2103 (14.9%) | 0.07 | 2717 (14.4%) | 273 (18.2%) | 0.10 | 2501 (13.0%) | 268 (19.5%) | 0.17 |
| History of stroke | 46,444 (20.9%) | 4590 (23.4%) | 0.06 | 29,337 (21.7%) | 3495 (24.8%) | 0.07 | 5240 (27.8%) | 434 (28.9%) | 0.02 | 4557 (23.7%) | 372 (27.0%) | 0.08 |
| Renal disease | 63,460 (28.5%) | 6395 (32.6%) | 0.09 | 38,662 (28.6%) | 4586 (32.5%) | 0.08 | 8466 (45.0%) | 775 (51.6%) | 0.13 | 7009 (36.4%) | 579 (42.0%) | 0.11 |
| Dyspepsia or stomachdiscomfort | 33,127 (14.9%) | 3306 (16.9%) | 0.05 | 19,397 (14.4%) | 2256 (16.0%) | 0.05 | 3634 (19.3%) | 316 (21.1%) | 0.04 | 3892 (20.2%) | 312 (22.7%) | 0.06 |
| Diabetes | 78,798 (35.4%) | 8009 (40.8%) | 0.11 | 44,891 (33.2%) | 5446 (38.6%) | 0.11 | 9447 (50.2%) | 822 (54.7%) | 0.09 | 10,052 (52.3%) | 785 (57.0%) | 0.09 |
| Hypertension | 181,367 (81.5%) | 16,500 (84.1%) | 0.07 | 110,573 (81.8%) | 11,895 (84.3%) | 0.07 | 17,364 (92.3%) | 1,399 (93.1%) | 0.03 | 17,060 (88.7%) | 1219 (88.6%) | 0.00 |
| Congestive heart failure | 69,937 (31.4%) | 7557 (38.5%) | 0.15 | 42,248 (31.3%) | 5205 (36.9%) | 0.12 | 8609 (45.7%) | 840 (55.9%) | 0.20 | 7407 (38.5%) | 611 (44.4%) | 0.12 |
| Anemia and coagulationdefects | 60,723 (27.3%) | 5915 (30.2%) | 0.06 | 37,521 (27.8%) | 4311 (30.6%) | 0.06 | 7146 (38.0%) | 622 (41.4%) | 0.07 | 6964 (36.2%) | 538 (39.1%) | 0.06 |
| Coronary artery disease | 84,825 (38.1%) | 8203 (41.8%) | 0.07 | 54,024 (40.0%) | 6279 (44.5%) | 0.09 | 7870 (41.8%) | 646 (43.0%) | 0.02 | 8078 (42.0%) | 634 (46.1%) | 0.08 |
| Baseline medications, n (%) | ||||||||||||
| ACEs/ARBs | 106,196 (47.7%) | 9638 (49.1%) | 0.03 | 63,863 (47.3%) | 6848 (48.4%) | 0.02 | 9779 (52.0%) | 772 (51.4%) | 0.01 | 10,516 (54.7%) | 765 (55.6%) | 0.02 |
| Beta-blockers | 99,490 (44.7%) | 8943 (45.5%) | 0.02 | 61,430 (45.5%) | 6642 (47.0%) | 0.03 | 7372 (39.2%) | 625 (41.6%) | 0.05 | 7995 (41.6%) | 622 (45.2%) | 0.07 |
| Renin-angiotensin systemantagonists | 109,942 (49.4%) | 9969 (50.7%) | 0.03 | 66,363 (49.1%) | 7107 (50.3%) | 0.02 | 10,221 (54.3%) | 808 (53.8%) | 0.01 | 10,740 (55.8%) | 780 (56.6%) | 0.02 |
| Statin | 107,812 (48.5%) | 9676 (49.3%) | 0.02 | 67,307 (49.8%) | 7194 (50.9%) | 0.02 | 9379 (49.8%) | 774 (51.5%) | 0.03 | 10,400 (54.1%) | 749 (54.4%) | 0.01 |
| Inhibitor of warfarin | 140,317 (63.1%) | 12,763 (65.0%) | 0.04 | 85,433 (63.2%) | 9215 (65.2%) | 0.04 | 12,963 (68.9%) | 1,058 (70.4%) | 0.03 | 12,659 (65.8%) | 953 (69.2%) | 0.07 |
| Diuretic | 84,362 (37.9%) | 7716 (39.3%) | 0.03 | 52,271 (38.7%) | 5624 (39.8%) | 0.02 | 9341 (49.6%) | 783 (52.1%) | 0.05 | 7467 (38.8%) | 541 (39.3%) | 0.01 |
†
SMDs > 10% were considered significant, and are boldface. p-values also were significant (p < 0.05) for the relevant cells.
‡
Inpatient only and outpatient only are mutually exclusive categories referring to the setting of the first diagnosis.
§
A modified HAS-BLED score was used without the requirement of labile INR values.
Continuous age, gender, geographic region, NVAF diagnosis type and setting, continuous CCI score, history of bleeding and stroke, baseline comorbidities not listed in CCI and baseline medications were balanced in all the race/ethnicity groups at the baseline using IPTW. Additionally, race/ethnicity was balanced for overall cohorts.
ACE: Angiotensin-converting enzyme inhibitor; AF: Atrial fibrillation; ARB: Angiotensin receptor blocker; CCI: Charlson Comorbidity Index; CHA2DS2-VASc: Congestive heart failure, hypertension, age ≥75 years, diabetes mellitus, prior stroke or transient ischemic attack or thromboembolism, vascular disease, aged 65–74 years, sex category; HAS-BLED: Hypertension, abnormal renal and liver function, stroke, bleeding, elderly, drugs and alcohol; INR: International normalized ratio; IPTW: Inverse probability treatment weighting; NVAF: Nonvalvular atrial fibrillation; SD: Standard deviation; SE: Systemic embolism; SMD: Standardized mean difference.
Baseline characteristics pre- and post-IPTW for race/ethnicity groups that were not included in the analysis can be found in Supplementary Tables 3 & 4 and include results for Asian/Pacific Islander and other/unknown race/ethnicity subgroups.
Follow-up period
The treatment outcomes were analyzed and compared in the follow-up period between the treatment groups in the weighted cohorts. In the apixaban-warfarin cohort, the mean follow-up time was 405.6 days (median = 280.0 days) for the apixaban treatment group and 370.2 days (median = 239.0 days) for the warfarin treatment group, with a significant difference (SMD = 0.10). These follow-up periods reflect the duration after applying the censoring criteria of treatment discontinuation or disenrollment or study end. Among race/ethnicity subgroups, White and Hispanic patients receiving apixaban had significantly longer mean follow-up times compared with those receiving warfarin: 419.0 days for apixaban versus 379.3 days for warfarin in White patients (SMD = 0.11) and 388.6 for apixaban versus 338.7 for warfarin in Hispanic patients (SMD = 0.15). Black patients receiving apixaban were followed for a longer period (353.2 days) than those receiving warfarin (335.4 days), but this difference was not significant (SMD = 0.06). In the DOAC-warfarin cohort, patients receiving DOACs were followed for longer than patients receiving warfarin. However, this difference was only significant among Hispanic patients (Table 5).
| Apixaban-warfarin cohort | DOAC-warfarin cohort | |||||||||
|---|---|---|---|---|---|---|---|---|---|---|
| Apixaban (n = 176,365) | Warfarin (n = 19,722) | p-value† | DOAC (n = 222,477) | Warfarin (n = 19,647) | p-value† | |||||
| Overall | ||||||||||
| Time to treatment initiation (in days), mean, SD | 60.8 | 62.4 | 78.9 | 71.6 | <0.0001 | 64.5 | 63.3 | 81.0 | 71.6 | <0.0001 |
| Follow-up time (in days), mean, SD | 405.6 | 347.8 | 370.2 | 345.4 | <0.0001 | 403.1 | 350.2 | 371.8 | 345.7 | <0.0001 |
| Median | 280.0 | 239.0 | 275.0 | 240.0 | ||||||
| Discontinuation‡ | ||||||||||
| Proportion of discontinuers, n, % | 109,162 | 61.9% | 15,051 | 76.3% | <0.0001 | 140,912 | 63.3% | 14,989 | 76.3% | <0.0001 |
| TTD (in days), mean, SD | 282.7 | 257.5 | 292.3 | 271.7 | <0.0001 | 280.9 | 257.5 | 293.7 | 272.3 | <0.0001 |
| Incidence rate§ | 55.7 | 75.3 | <0.0001 | 57.4 | 74.9 | <0.0001 | ||||
| Switch‡ | ||||||||||
| Proportion of switchers, n, % | 8941 | 5.1% | 6,121 | 31.0% | <0.0001 | 15,080 | 6.8% | 6,074 | 30.9% | <0.0001 |
| Time to switch (in days), mean, SD | 398.9 | 312.7 | 429.1 | 376.8 | <0.0001 | 424.1 | 328.9 | 433.0 | 377.2 | 0.109 |
| Incidence rate§ | 6.3 | 31.5 | <0.0001 | 8.2 | 31.2 | <0.0001 | ||||
| White | n = 108,308 | n = 14,172 | n = 135,091 | n = 14,139 | ||||||
| Time to treatment initiation (in days), mean, SD | 62.9 | 63.0 | 83.6 | 72.0 | <0.0001 | 66.4 | 63.7 | 85.7 | 71.9 | <0.0001 |
| Follow-up time (in days), mean, SD | 419.0 | 355.6 | 379.3 | 352.5 | <0.0001 | 415.8 | 357.8 | 380.8 | 353.0 | <0.0001 |
| Median | 293.0 | 242.0 | 286.0 | 242.0 | ||||||
| Discontinuation | ||||||||||
| Proportion of discontinuers, n, % | 65,015 | 60.0% | 10,823 | 76.4% | <0.0001 | 83,187 | 61.6% | 10,799 | 76.4% | <0.0001 |
| TTD (in days), mean, SD | 289.2 | 263.5 | 300.4 | 276.6 | <0.0001 | 287.1 | 263.2 | 301.6 | 277.3 | <0.0001 |
| Incidence rate | 52.3 | 73.5 | <0.0001 | 54.1 | 73.3 | <0.0001 | ||||
| Switch | ||||||||||
| Proportion of switchers, n, % | 5,379 | 5.0% | 4,220 | 29.8% | <0.0001 | 9,135 | 6.8% | 4,195 | 29.7% | <0.0001 |
| Time to switch (in days), mean, SD | 388.3 | 309.0 | 436.4 | 378.8 | <0.0001 | 417.2 | 328.1 | 439.9 | 379.3 | 0.001 |
| Incidence rate | 6.0 | 29.7 | <0.0001 | 8.0 | 29.4 | <0.0001 | ||||
| Black | n = 15,105 | n = 1508 | n = 18,820 | n = 1502 | ||||||
| Time to treatment initiation (in days), mean, SD | 60.3 | 63.6 | 82.1 | 69.1 | <0.0001 | 64.2 | 64.6 | 83.8 | 69.2 | <0.0001 |
| Follow-up time (in days), mean, SD | 353.2 | 317.7 | 335.4 | 307.8 | 0.037 | 351.3 | 319.7 | 337.1 | 308.7 | 0.097 |
| Median | 240.0 | 223.0 | 239.0 | 226.0 | ||||||
| Discontinuation | ||||||||||
| Proportion of discontinuers, n, % | 10,200 | 67.5% | 1,172 | 77.8% | <0.0001 | 12,923 | 68.7% | 1,165 | 77.5% | <0.0001 |
| TTD (in days), mean, SD | 252.2 | 231.1 | 270.1 | 249.0 | 0.019 | 251.5 | 232.0 | 271.4 | 248.9 | 0.009 |
| Incidence rate | 69.8 | 84.7 | <0.0001 | 71.4 | 84.0 | <0.0001 | ||||
| Switch | ||||||||||
| Proportion of switchers, n, % | 801 | 5.3% | 523 | 34.7% | <0.0001 | 1,409 | 7.5% | 521 | 34.7% | <0.0001 |
| Time to switch (in days), mean, SD | 405.1 | 313.8 | 425.4 | 341.4 | 0.275 | 427.5 | 329.4 | 426.9 | 341.1 | 0.975 |
| Incidence rate | 7.2 | 37.2 | <0.0001 | 10.0 | 37.0 | <0.0001 | ||||
| Hispanic | n = 14,967 | n = 1390 | n = 19,236 | n = 1377 | ||||||
| Time to treatment initiation (in days), mean, SD | 57.9 | 63.4 | 76.2 | 69.8 | <0.0001 | 63.0 | 64.8 | 79.6 | 69.9 | <0.0001 |
| Follow-up time (in days), mean, SD | 388.6 | 336.1 | 338.7 | 317.8 | <0.0001 | 389.0 | 340.0 | 340.7 | 318.0 | <0.0001 |
| Median | 270.0 | 223.0 | 269.0 | 226.0 | ||||||
| Discontinuation | ||||||||||
| Proportion of discontinuers, n, % | 9562 | 63.9% | 1075 | 77.3% | <0.0001 | 12,592 | 65.5% | 1,064 | 77.3% | <0.0001 |
| TTD (in days), mean, SD | 273.8 | 250.1 | 271.5 | 258.1 | <0.0001 | 275.7 | 251.3 | 274.2 | 259.1 | <0.0001 |
| Incidence rate | 60.0 | 83.4 | <0.0001 | 61.5 | 82.8 | <0.0001 | ||||
| Switch | ||||||||||
| Proportion of switchers, n, % | 805 | 5.4% | 466 | 33.6% | <0.0001 | 1,414 | 7.4% | 458 | 33.3% | <0.0001 |
| Time to switch (in days), mean, SD | 405.0 | 321.6 | 411.9 | 351.0 | <0.0001 | 433.4 | 327.8 | 418.1 | 353.8 | <0.0001 |
| Incidence rate | 6.8 | 36.0 | <0.0001 | 9.0 | 35.2 | <0.0001 | ||||
†
p-values were derived from regression models for time to event outcomes.
‡
TTD and TTS were calculated among patients who experienced discontinuation or switching events.
§
Incidence rate was calculated per 100 person-years with the numerator as the number of patients who discontinued/switched, and the denominator as the total time at risk (person-years).
p < 0.05 were considered significant, and are in boldface.
DOAC: Direct oral anticoagulant; SD: Standard deviation; TTD: Time to discontinuation.
Time to treatment initiation
Overall, the average time to treatment initiation was shorter for apixaban compared with warfarin (60.8 vs 78.9 days, respectively; SMD = 0.27). This trend was consistent across all race/ethnicity groups in the apixaban-warfarin cohort. In the DOAC-warfarin cohort, the time to treatment initiation was longer for all treatments across all race/ethnicity groups compared with the apixaban-warfarin cohort. However, similar to the apixaban-warfarin cohort, the time to initiation of DOACs was shorter than the time to initiation of warfarin overall and within each race/ethnicity group (Table 5).
Treatment discontinuation
In the apixaban-warfarin cohort, 61.9% (n = 109,162) of patients discontinued apixaban compared with 76.3% (n = 15,051) who discontinued warfarin therapy (SMD = 0.31) during the follow-up period. Similar trends were observed across race/ethnicity groups: White (60.0% vs 76.4%, SMD = 0.35), Black (67.5% vs 77.8%, SMD = 0.23) and Hispanic (63.9% vs 77.3%, SMD = 0.30). TTD was not significantly different between apixaban and warfarin overall (282.7 days vs 292.3 days, SMD = 0.04) or among the race/ethnicity subgroups. However, the incidence rate for discontinuation was statistically significantly lower in the apixaban group compared with the warfarin groups, both overall (55.7 vs 75.3 per 100 person-years, p < 0.0001) and within each race/ethnicity group: White (52.3 vs 73.5 per 100 person-year, p < 0.0001), Black (69.8 vs 84.7 per 100 person-year, p < 0.0001) and Hispanic (60.0 vs 83.4 per 100 person-year, p < 0.0001).
Patients who initiated apixaban were 24% less likely to discontinue treatment compared with those who initiated warfarin (aHR: 0.76, 95% CI: 0.75–0.77). When examining discontinuation rates by race/ethnicity within the apixaban group, White patients were 27% less likely to discontinue treatment (aHR: 0.73, CI: 0.71–0.74), Black patients were 15% less likely to discontinue (aHR: 0.85, CI: 0.80–0.90), and Hispanic patients were 25% less likely to discontinue (aHR: 0.75, CI: 0.71–0.80). These results highlight the reduced likelihood of treatment discontinuation among different race/ethnicity groups within those who initiate apixaban when compared with those who initiate warfarin. The sensitivity analysis showed similar trends for treatment discontinuation, but with a higher proportion of discontinuation and shorter TTD than the main analysis due to the smaller gap in defining discontinuation (Supplementary Table 5).
Trends were similar in the DOAC-warfarin cohort overall and by race/ethnicity group (Table 6).
| Apixaban-warfarin cohort | DOAC-warfarin cohort | |||
|---|---|---|---|---|
| HR (95% CI) | p-value† | HR (95% CI) | p-value† | |
| Overall | ||||
| Discontinuation | 0.76 (0.75–0.77) | <0.0001 | 0.77 (0.76–0.79) | <0.0001 |
| Switch | 0.21 (0.20–0.22) | <0.0001 | 0.23 (0.23–0.23) | <0.0001 |
| White | ||||
| Discontinuation | 0.73 (0.71–0.74) | <0.0001 | 0.75 (0.73–0.76) | <0.0001 |
| Switch | 0.17 (0.17–0.18) | <0.0001 | 0.23 (0.22–0.24) | <0.0001 |
| Black | ||||
| Discontinuation | 0.85 (0.80–0.90) | <0.0001 | 0.85 (0.80–0.90) | <0.0001 |
| Switch | 0.23 (0.21–0.26) | <0.0001 | 0.23 (0.21–0.26) | <0.0001 |
| Hispanic | ||||
| Discontinuation | 0.75 (0.71–0.80) | <0.0001 | 0.77 (0.73–0.82) | <0.0001 |
| Switch | 0.16 (0.15–0.18) | <0.0001 | 0.22 (0.20–0.24) | <0.0001 |
†
p-values were derived from regression models for time to event outcomes. p < 0.05 were considered significant, and are in boldface.
DOAC: Direct oral anticoagulant; HR: Hazard ratio.
Treatment switching
In the apixaban-warfarin cohort, 5.0% (n = 8941) of patients switched from apixaban to warfarin or another DOAC (dabigatran or rivaroxaban) compared with 31.0% (n = 6121) who switched from warfarin to a DOAC (SMD = 0.71). This switching pattern was consistent across race/ethnicity groups: White (5.0% vs 29.8%, SMD = 0.68), Black (5.3% vs 34.7%, SMD = 0.79) and Hispanic (5.4% vs 33.6%, SMD = 0.75).
Among apixaban patients who switched (n = 8941), 67.9% transitioned to rivaroxaban, 29.0% to warfarin and 3.1% to dabigatran. These trends were similar across race/ethnicity groups, however, a larger proportion of Hispanic patients receiving apixaban switched to rivaroxaban (72.8%) than White (64.8%) and Black (67.2%) patients. Among warfarin patients who switched, 77.2% switched to apixaban, 22.3% to rivaroxaban and 0.5% to dabigatran. A larger proportion of White patients switched to apixaban (80.2%) than Black (76.1%) and Hispanic (76.0%) patients. Figure 3 shows switching patterns in the apixaban versus warfarin cohort overall and by race/ethnicity.
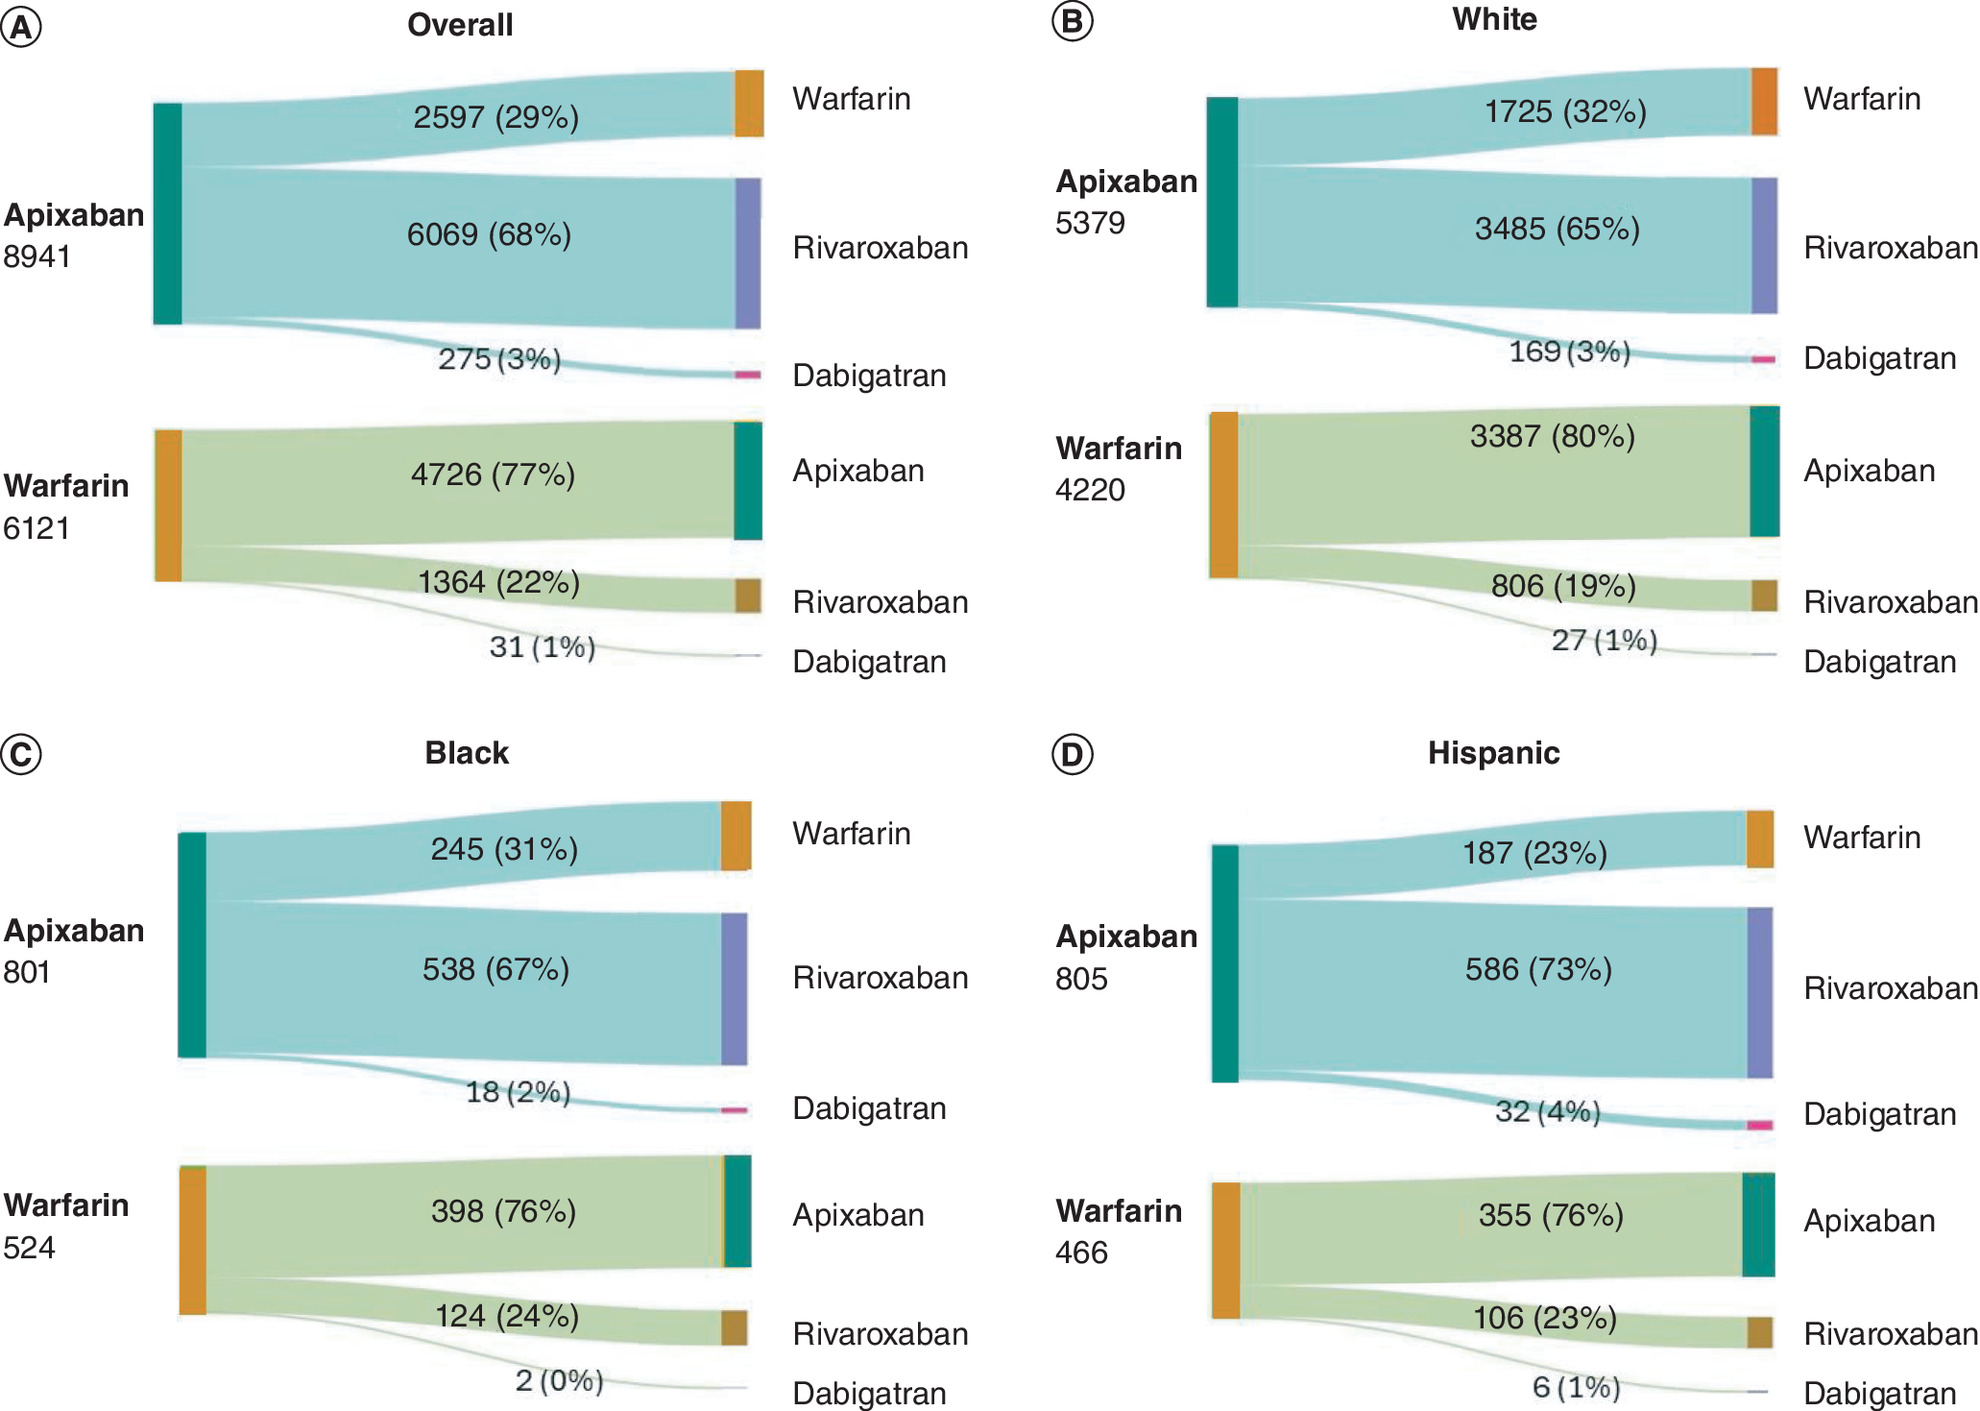
The incidence rate for switching was statistically significantly lower in the apixaban group compared with the warfarin group overall (6.3 vs 31.5 per 100 person-years, p < 0.0001) and across race/ethnicity groups: White (6.0 vs 29.7, p < 0.0001), Black (7.2 vs 37.2, p < 0.0001) and Hispanic (6.8 vs 36.0, p < 0.0001). Patients who initially initiated apixaban were 79% less likely to switch to another oral anticoagulant (aHR: 0.21, 95% CI: 0.20–0.22) compared with those who discontinued warfarin. These results were consistent across race/ethnicity groups: White 83% less likely (aHR: 0.17, CI: 0.17–0.18), Black 77% less likely (aHR: 0.23, CI: 0.21–0.26) and Hispanic patients 84% less likely (aHR: 0.16, CI: 0.15–0.18). The TTS was shorter for patients on apixaban than for those on warfarin (398.9 vs 429.1 days, SMD = 0.09); however, it was only significant among White patients (388.3 vs 436.4 days, SMD = 0.14).
Switching patterns for the DOAC-warfarin cohort are presented in Figure 4. For patients who switch from their index DOAC therapy, the top three common switching patterns for individual agents were rivaroxaban to apixaban (85.9%), dabigatran to apixaban (69.8%) and dabigatran to rivaroxaban (25.3%). Among patients who discontinued warfarin (n = 6074), 77.0% switched to apixaban, 22.5% switched to rivaroxaban and 0.6% switched to dabigatran. These results were consistent across the various race/ethnicity groups (Figure 4).
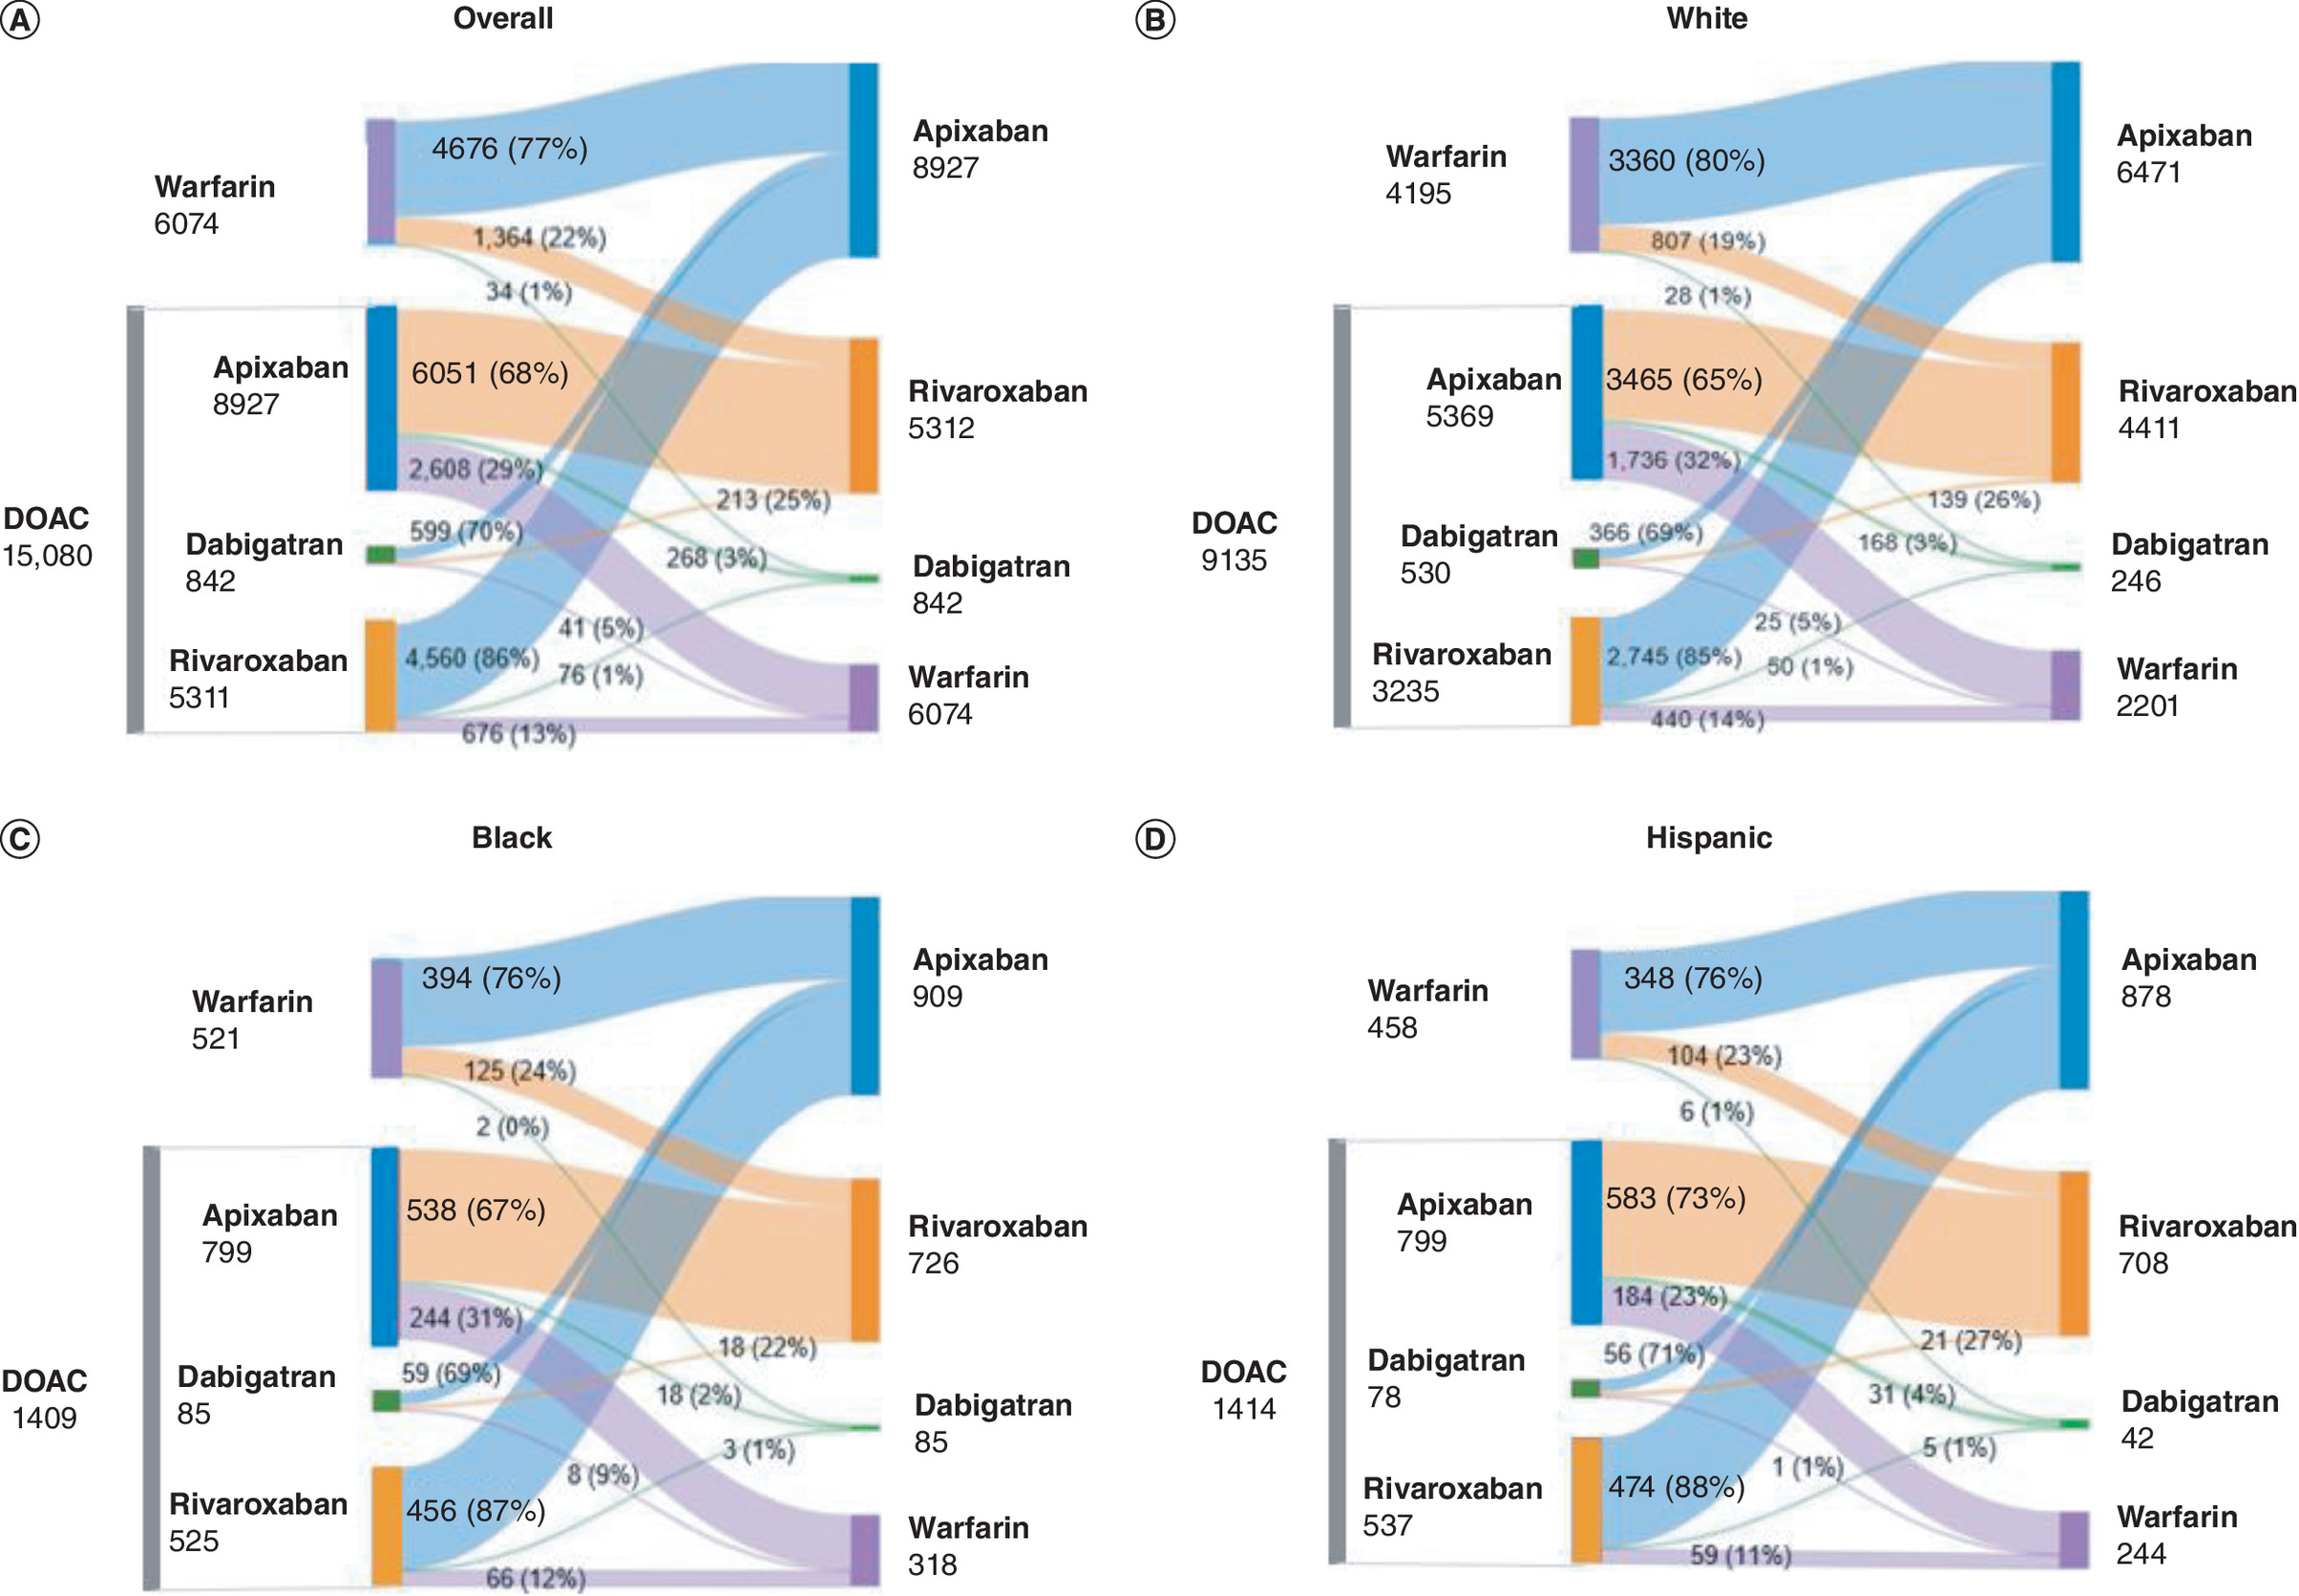
Figure 4. Sankey figures representing switching patterns from each direct oral anticoagulants or warfarin in direct oral anticoagulants-warfarin cohort.
The figure displays weighted population estimates, which when added, may result in a difference of 1 due to rounding adjustments.
DOAC: Direct oral anticoagulant.
In the DOAC-warfarin cohort, the incidence rate for switching was also significantly lower in the DOAC group compared with the warfarin group, both overall and within each race/ethnicity group. Patients who discontinued DOAC were 77% less likely to switch to another oral anticoagulant (aHR: 0.23, 95% CI: 0.23–0.23), with similar results across all race/ethnicity groups: White patients were 77% less likely (aHR: 0.23, CI: 0.22–0.24), Black patients were 77% less likely (aHR: 0.23, CI: 0.21–0.26) and Hispanic patients were 78% less likely (aHR: 0.22, CI: 0.20–0.24). TTS rates in the DOAC-warfarin cohort were similar to those in the apixaban-warfarin cohort; however, the differences were not significant overall or within any of the race/ethnicity groups.
Discussion
This large retrospective study of patients with NVAF in the US compared treatment patterns between patients on DOACs (including apixaban) and those on warfarin across both apixaban-warfarin and DOAC-warfarin cohorts. The study found that patients taking apixaban and DOACs had lower rates of discontinuation and switching compared with those taking warfarin, both overall and across different race/ethnicity groups. However, the magnitude of the differences varied by race/ethnicity, with Black and Hispanic patients having a higher incidence of switch and discontinuation than White patients. However, White and Hispanic patients had a lower risk of switching and discontinuing therapy than Black patients. To the best of our knowledge at the time of this research, this is the first comprehensive analysis of discontinuation and switching trends for DOACs across multiple race/ethnicity groups.
Although minority patients have a lower risk of AF [36], they often face worse clinical outcomes, including a higher risk of stroke [37]. While DOACs offer several advantages over warfarin, poorer outcomes among minority patients may be partly attributed to differences in the use of oral anticoagulants, particularly in the initiation of DOACs among Black and Hispanic patients [31,38–42]. Literature suggests that treatment initiation with DOACs has been less likely in Black and Hispanic patients compared with White patients [30,31]. However, the current study suggests that these differences are narrowing over time. In 2019, 82.7% of White, 86.7% of Black and 87.7% of Hispanic patients who started oral anticoagulant treatment initiated DOAC therapy. By the end of 2022, these rates had increased to 96.7% for White, 97.1% for Black and 97.5% for Hispanic patients. These findings align with a recent study of a Medicare population, which found that in 2019, 90.4% of White, 92.5% of Black and 90.8% of Hispanic patients initiating oral anticoagulant therapy started on a DOAC [41]. This increase in DOAC initiation, favorable treatment patterns and anticoagulant adherence could naturally lead to improved clinical outcomes and quality of life over time.
While the race/ethnicity gap in the initiation of oral anticoagulants or DOAC treatment among patients with NVAF has been narrowing, it remains essential to examine potential differences in treatment patterns among those already receiving oral anticoagulation therapy. Understanding these patterns is crucial as research shows that lower rates of treatment discontinuation and medication switching are linked to fewer interruptions in treatment, better treatment adherence and improved clinical outcomes [20–22]. Conversely, studies have shown that discontinuing oral anticoagulants increases the risk of adverse events, including stroke, bleeding and death [23,24]. Similarly, switching medications can lead to negative clinical outcomes, such as an increased risk of stroke, systemic embolism, major bleeding and other harmful outcomes compared with remaining on the same medication [43]. Therefore, any race/ethnicity differences in treatment patterns may contribute to differences in clinical outcomes for patients with NVAF.
In this study, patients who initiated apixaban or a DOAC were less likely to discontinue treatment or switch to another medication compared with those who had initiated warfarin across all race/ethnicity groups. These findings are consistent with previous research, which has demonstrated lower discontinuation rates for DOACs and apixaban compared with warfarin [40,44], as well as reduced rates of medication switching [45]. However, the extent of the reduction in the risk of discontinuation and switching from apixaban or a DOAC compared with warfarin varied across race/ethnicity groups in this study. While Black and Hispanic patients had a higher incidence rate of discontinuation and switching after being prescribed oral anticoagulants (both DOACs and warfarin) than White patients, White and Hispanic patients experienced the greatest reduction in discontinuation and switching risk when using apixaban instead of warfarin. In contrast, Black patients showed the least reduction in risk for both discontinuation and switching with apixaban or DOAC compared with warfarin. Specifically, White patients were 27%, Black patients were 15% and Hispanic patients were 25% less likely to discontinue apixaban compared with warfarin. Among those who initiated apixaban, 83% of White, 77% of Black and 84% of Hispanic patients were less likely to switch to another oral anticoagulant compared with those who initiated warfarin. These findings were consistent with the DOAC-warfarin cohort.
Of the patients who switched treatments, the most common switching patterns were switching from their index anticoagulant to apixaban, followed by switching from index anticoagulant to rivaroxaban. Across all race/ethnicity groups, patients receiving warfarin had a greater likelihood of switching to another oral anticoagulant after discontinuation compared with those who discontinued a DOAC. Further research is needed to better understand the factors driving these treatment differences throughout the course of therapy. Such insights would help healthcare providers identify and address barriers to access, ensuring that all patients, particularly Black patients, receive optimal, guideline-recommended treatment.
Our analysis sheds light on the important race/ethnicity differences in treatment patterns among patients with NVAF who initiated therapy with either DOAC or warfarin. Understanding these differences is crucial for tailoring treatment strategies that are equitable and effective across diverse populations. By identifying variations in discontinuation and switching rates, these findings can inform healthcare providers about potential barriers to adherence and the need for targeted interventions. As evidenced in a recent study, disadvantaged groups such as Black, elderly with ≥75 years, being male, lacking commercial insurance, unemployed/retired are associated with nonadherence in oral anticoagulant treatment [46]. Ultimately, this analysis not only enhances our understanding of treatment dynamics but also supports efforts to improve outcomes and ensure that all patients receive optimal care based on their unique demographic characteristics. The study also provides an opportunity to explore non-medical discontinuation and switch patterns among NVAF patients of different race/ethnicity. As per Ingham et al. [47], the majority of patients with NVAF who discontinued or switched DOACs in the first quarter of the study, remained untreated later in the year compared with those who discontinued or switched later in the year, and thereby suggesting a potential long-term impact of non-medical discontinuation and switching.
This study has some limitations due to the nature of retrospective observational study designs. One potential source of bias is the high proportion of patients using apixaban or other DOACs, which may have influenced the results, although previous studies have similar proportions of patients on DOACs compared with warfarin. Residual confounding is possible due to other potential confounders not being available in the claims data. However, this study included specific inclusion criteria and IPTW methodology to balance baseline differences, which may help minimize or eliminate confounding. Additionally, the presence of a claim for a filled prescription does not guarantee actual medication adherence, potentially leading to an overestimation of oral anticoagulant utilization. The study excluded edoxaban, which may have affected the proportion of discontinuation and switch due to some of the missed events. However, given its small sample size, we believe that this may not have affected the main results or generalizability to DOACs. Finally, an inconsistency was observed between incidence analyses and time-to-event analyses. Incidence rates provide a crude measure of the frequency of events over time but do not account for censoring or the timing of events. In contrast, time-to-event analyses account for censoring and provide a more detailed understanding of event timing. These methodological differences may explain the discrepancies observed.
Conclusion
This study contributes to the existing literature by examining race/ethnicity differences in treatment patterns among patients with NVAF who initiated therapy with a DOAC or warfarin. This study found that the risk of discontinuation and switching was lower among patients receiving apixaban (in the apixaban-warfarin cohort) or other DOACs (in the DOAC-warfarin cohort) compared with those on warfarin, across all race/ethnicity groups. However, the magnitude of this difference varied. While Black and Hispanic patients were more likely to discontinue or switch therapies than White patients, White and Hispanic patients experienced a greater benefit from apixaban and DOACs in reducing discontinuation and switching. Black patients, however, showed a smaller benefit, with less reduction in these risks. Given the potential clinical implications of DOAC discontinuation and switching, further research is needed to explore the underlying factors contributing to these differences. Understanding these factors will be crucial for addressing treatment gaps and improving outcomes for patients with NVAF, particularly among underrepresented race/ethnicity groups.
Summary points
•
Atrial fibrillation (AF) is the most common cardiac arrhythmia in the US, with non-valvular AF (NVAF) significantly increasing stroke risk, making anticoagulation therapy essential for stroke prevention.
•
Racial/ethnic disparities in NVAF treatment patterns persist despite guideline recommendations for DOAC use. While previous studies highlight racial health inequities in anticoagulant initiation and outcomes, there is limited evidence on treatment patterns (e.g., discontinuation and switching) among racial/ethnic groups after starting therapy.
•
This study examined treatment patterns (discontinuation or switching) among NVAF patients initiating direct oral anticoagulants (DOACs) versus warfarin across White, Black and Hispanic patients in the US, among apixaban-warfarin and DOAC-warfarin cohorts.
•
Statistical methods included descriptive statistics for baseline characteristics and study outcomes. Inverse probability of treatment weighting was used to balance baseline characteristics, and a Cox proportional hazards model assessed adjusted hazard ratios (aHR) and 95% confidence interval (CI).
•
Patients on apixaban were found to be 24% less likely to discontinue treatment (aHR: 0.76) and 79% less likely to switch to another anticoagulant (aHR: 0.21) compared with warfarin users. However, the magnitude of these differences varied across racial/ethnic groups. Black patients experienced higher rates of treatment discontinuation (68%) than White (60%) and Hispanic (63%) patients.
•
The incidence rate of treatment discontinuation was significantly lower in the apixaban group compared with the warfarin group. Overall, the rates were 55.7 versus 75.3 per 100 person-years (p < 0.0001), and this pattern was consistent across all race/ethnicity groups: White patients had discontinuation rates of 52.3 versus 73.5 per 100 person-years (p < 0.0001), Black patients had rates of 69.8 versus 84.7 (p < 0.0001) and Hispanic patients had rates of 60.0 versus 83.4 (p < 0.0001).
•
Patients on apixaban were 79% less likely to switch to another oral anticoagulant (aHR: 0.21, 95% CI: 0.20–0.22) compared with those on warfarin. This reduction in switching was observed across all racial/ethnic groups but varied in magnitude. White patients were 83% less likely to switch, Black patients were 77% less likely and Hispanic patients were 84% less likely.
•
The incidence rate for switching was also significantly lower in the apixaban group compared with the warfarin group. Overall, the rates were 6.3 versus 31.5 per 100 person-years (p < 0.0001), with similar reductions seen in all race/ethnic groups: White patients had switching rates of 6.0 versus 29.7 (p < 0.0001), Black patients 7.2 versus 37.2 (p < 0.0001) and Hispanic patients 6.8 versus 36.0 (p < 0.0001).
•
Almost 5% of apixaban patients switched to another anticoagulant, compared with 31% of warfarin patients. Among those switching from warfarin, 77% started apixaban.
•
The results in the apixaban-warfarin cohort are similar in the DOAC-warfarin cohort overall and by race/ethnicity group.
•
While patients on apixaban and DOACs had lower rates of discontinuation and switching compared with warfarin users overall and across racial/ethnic groups, the magnitude of the differences varied by race/ethnicity. Black and Hispanic patients had higher incidence rates of switching and discontinuation compared with White patients, but both White and Hispanic patients had lower risks of switching and discontinuing compared with Black patients.
•
Further research is needed to understand the underlying reasons for treatment discontinuation and switching by race/ethnicity groups to improve differences in treatment patterns and subsequent outcomes among patients with NVAF.
Author contributions
All listed authors meet the International Committee of Medical Journal Editors (ICMJE) criteria for authorship for this paper. All authors participated in the concept and design of the paper. R Singh and S Dhuliawala conducted the data acquisition/analysis. M Zhang, R Singh and D Stafkey drafted the manuscript. M Zhang, D Cheng, A Dubey and E Vodicka provided critical feedback and supervision throughout the research process. All authors participated in data interpretation and critical revision of the paper. The final version of the manuscript was approved by all authors. All authors agree to be accountable for all aspects of the work done.
Financial disclosure
This study was sponsored by the Bristol-Myers Squibb/Pfizer Alliance.
Competing interests disclosure
D Cheng and A Dubey are employees and shareholders of Bristol-Myers Squibb, one of the study sponsors. M Zhang is a Post-Doctoral Fellow at Bristol-Myers Squibb and is associated with the University of Southern California. M Hagan was a former employee of Bristol-Myers Squibb. R Singh, S Dhuliawala and D Stafkey are employees of Cencora who were paid consultants to Bristol-Myers Squibb in connection with the development of this manuscript. E Vodicka is an employee of Pfizer, one of the study sponsors. The authors have no other competing interests or relevant affiliations with any organization or entity with the subject matter or materials discussed in the manuscript apart from those disclosed.
Writing disclosure
Editorial/medical writing support was provided by Bridgette Schroader, Jenny Jung, Lori Justice and Christina Schnell at Cencora and was funded by the Bristol Myers-Squibb/Pfizer Alliance.
Data sharing statement
The data supporting the findings of this study will be made available by the Bristol Myers-Squibb/Pfizer Alliance upon request and subject to review.
Open access
This work is licensed under the Attribution-NonCommercial-NoDerivatives 4.0 Unported License. To view a copy of this license, visit https://creativecommons.org/licenses/by-nc-nd/4.0/
Supplementary Material
File (supplementary data.docx)
- Download
- 112.11 KB
References
Papers of special note have been highlighted as: • of interest
1.
Alkhouli M, Friedman PA. Ischemic stroke risk in patients with nonvalvular atrial fibrillation: JACC review topic of the week. J. Am. Coll. Cardiol. 74(24), 3050–3065 (2019).
2.
Colilla S, Crow A, Petkun W, Singer DE, Simon T, Liu X. Estimates of current and future incidence and prevalence of atrial fibrillation in the U.S. adult population. Am. J. Cardiol. 112(8), 1142–1147 (2013).
3.
Di Biase L. Use of direct oral anticoagulants in patients with atrial fibrillation and valvular heart lesions. J. Am. Heart Assoc. 5(2), e002776 (2016).
4.
Kornej J, Borschel CS, Benjamin EJ, Schnabel RB. Epidemiology of atrial fibrillation in the 21st century: novel methods and new insights. Circ. Res. 127(1), 4–20 (2020).
5.
Writing Committee Members, Joglar JA, Chung MK, Armbruster AL, Benjamin EJ, Chyou JY, Cronin EM et al. 2023 ACC/AHA/ACCP/HRS guideline for the diagnosis and management of atrial fibrillation: a report of the American College of Cardiology/American Heart Association Joint Committee on Clinical Practice Guidelines. J. Am. Coll. Cardiol. 83(1), 109–279 (2024).
6.
Saeed H, Ovalle OG, Bokhary U, Jermihov A, Lepkowska K, Bauer V et al. National physician survey for nonvalvular atrial fibrillation (NVAF) anticoagulation comparing knowledge, attitudes and practice of cardiologist to PCPs. Clin. Appl. Thromb. Hemost. 26, 1076029620952550 (2020).
7.
Bradley M, Welch EC, Eworuke E, Graham DJ, Zhang R, Huang TY. Risk of stroke and bleeding in atrial fibrillation treated with apixaban compared with warfarin. J. Gen. Intern. Med. 35(12), 3597–33604 (2020).
8.
Connolly SJ, Ezekowitz MD, Yusuf S, Eikelboom J, Oldgren J, Parekh A et al. Dabigatran versus warfarin in patients with atrial fibrillation. N. Engl. J. Med. 361(12), 1139–1151 (2009).
9.
Giugliano RP, Ruff CT, Braunwald E, Murphy SA, Wiviott SD, Halperin JL et al. Edoxaban versus warfarin in patients with atrial fibrillation. N. Engl. J. Med. 369(22), 2093–2104 (2013).
10.
Granger CB, Alexander JH, McMurray JJ, Lopes RD, Hylek EM, Hanna M et al. Apixaban versus warfarin in patients with atrial fibrillation. N. Engl. J. Med. 365(11), 981–992 (2011).
11.
Lopez-Lopez JA, Sterne JAC, Thom HHZ, Higgins JPT, Hingorani AD, Okoli GN et al. Oral anticoagulants for prevention of stroke in atrial fibrillation: systematic review, network meta-analysis, and cost effectiveness analysis. Brit. Med. J. 359, j5058 (2017).
12.
Patel MR, Mahaffey KW, Garg J, Pan G, Singer DE, Hacke W et al. Rivaroxaban versus warfarin in nonvalvular atrial fibrillation. N. Engl. J. Med. 365(10), 883–891 (2011).
13.
Ruff CT, Giugliano RP, Braunwald E, Hoffman EB, Deenadayalu N, Ezekowitz MD et al. Comparison of the efficacy and safety of new oral anticoagulants with warfarin in patients with atrial fibrillation: a meta-analysis of randomised trials. Lancet 383(9921), 955–962 (2014).
14.
Zirlik A, Bode C. Vitamin K antagonists: relative strengths and weaknesses vs. direct oral anticoagulants for stroke prevention in patients with atrial fibrillation. J. Thromb. Thrombolysis 43(3), 365–379 (2017).
15.
Adelakun AR, Turgeon RD, De Vera MA, McGrail K, Loewen PS. Oral anticoagulant switching in patients with atrial fibrillation: a scoping review. BMJ Open 13(4), e071907 (2023).
16.
Afzal SK, Hasan SS, Babar ZU. A systematic review of patient-reported outcomes associated with the use of direct-acting oral anticoagulants. Br. J. Clin. Pharmacol. 85(12), 2652–2667 (2019).
17.
Wheelock KM, Ross JS, Murugiah K, Lin Z, Krumholz HM, Khera R. Clinician trends in prescribing direct oral anticoagulants for US Medicare beneficiaries. JAMA Netw. Open 4(12), e2137288 (2021).
18.
Baker CL, Dhamane AD, Mardekian J, Dina O, Russ C, Rosenblatt L et al. Comparison of drug switching and discontinuation rates in patients with nonvalvular atrial fibrillation treated with direct oral anticoagulants in the United States. Adv. Ther. 36(1), 162–174 (2019).
19.
Willey V, Franchino-Elder J, Fu AC, Wang C, Sander S, Tan H et al. Treatment and persistence with oral anticoagulants among newly diagnosed patients with non-valvular atrial fibrillation: a retrospective observational study in a US commercially insured and Medicare Advantage population. BMJ Open 8(6), e020676 (2018).
20.
Atreja N, Kohli M, Hines DM, Jiang J, Hagan M, Aweh G et al. Gender and racial differences in outcomes among patients with NVAF treated with oral anticoagulants: a real-world evaluation of Medicare beneficiaries. Poster ESC 85570. Presented at: European Society of Cardiology Congress, London, United Kingdom of Great Britain and Northern Ireland (2004).
21.
Deitelzweig S, Kang A, Jiang J, Gao C, Luo X, Atreja N et al. Clinical impact of switching or continuation of apixaban or rivaroxaban among patients with non-valvular atrial fibrillation. J. Clin. Med. 13(4), 1073 (2024).
22.
Toma MM, Bungau SG, Tit DM, Moisi MI, Bustea C, Vesa CM et al. Use of anticoagulant drugs in patients with atrial fibrillation. Does adherence to therapy have a prognostic impact? Biomed. Pharmacother. 150, 113002 (2022).
• Review highlighting that anticoagulant adherence is a key predictor in nonvalvular atrial fibrillation (NVAF) outcomes and that clinicians must improve adherence strategies.
23.
Lowres N, Giskes K, Hespe C, Freedman B. Reducing stroke risk in atrial fibrillation: adherence to guidelines has improved, but patient persistence with anticoagulant therapy remains suboptimal. Korean Circ. J. 49(10), 883–907 (2019).
24.
Rivera-Caravaca JM, Esteve-Pastor MA, Roldan V, Marin F, Lip GYH. Non-vitamin K antagonist oral anticoagulants: impact of non-adherence and discontinuation. Expert Opin. Drug Saf. 16(9), 1051–1062 (2017).
• Review and expert opinion on the consequences of direct oral anticoagulants (DOAC) nonadherence and how to reduce barriers to adherence.
25.
Jackson LR 2nd, Kim S, Blanco R, Thomas L, Ansell J, Fonarow GC et al. Discontinuation rates of warfarin versus direct acting oral anticoagulants in US clinical practice: results from Outcomes Registry for Better Informed Treatment of Atrial Fibrillation II (ORBIT-AF II). Am. Heart J. 226, 85–93 (2020).
26.
Rush KL, Seaton CL, Burton L, Loewen P, O'Connor BP, Moroz L et al. Quality of life among patients with atrial fibrillation: a theoretically-guided cross-sectional study. PLOS ONE 18(10), e0291575 (2023).
27.
Essien UR, Magnani JW, Chen N, Gellad WF, Fine MJ, Hernandez I. Race/ethnicity and sex-related differences in direct oral anticoagulant initiation in newly diagnosed atrial fibrillation: a retrospective study of Medicare data. J. Natl Med. Assoc. 112(1), 103–108 (2020).
• Study showing variability in DOAC initiation by race/ethnicity and sex.
28.
Navar AM, Kolkailah AA, Overton R, Shah NP, Rousseau JF, Flaker GC et al. Trends in oral anticoagulant use among 436 864 patients with atrial fibrillation in community practice, 2011 to 2020. J. Am. Heart Assoc. 11(22), e026723 (2022).
29.
Magnani JW, Norby FL, Agarwal SK, Soliman EZ, Chen LY, Loehr LR et al. Racial differences in atrial fibrillation-related cardiovascular disease and mortality: The Atherosclerosis Risk in Communities (ARIC) Study. JAMA Cardiol. 1(4), 433–441 (2016).
30.
Azizi Z, Ward AT, Lee DJ, Gad SS, Bhasin K, Beetel RJ et al. Sociodemographic determinants of oral anticoagulant prescription in patients with atrial fibrillations: findings from the PINNACLE registry using machine learning. Heart Rhythm O2 4(3), 158–168 (2023).
31.
Essien UR, Chiswell K, Kaltenbach LA, Wang TY, Fonarow GC, Thomas KL et al. Association of race and ethnicity with oral anticoagulation and associated outcomes in patients with atrial fibrillation: Findings from the Get With The Guidelines-Atrial Fibrillation Registry. JAMA Cardiol. 7(12), 1207–1217 (2022).
• Study showing the need for more research on racial disparities in AF anticoagulant use and outcomes despite guideline-based therapy availability.
32.
Ajabnoor AM, Zghebi SS, Parisi R, Ashcroft DM, Rutter MK, Doran T et al. Incidence of nonvalvular atrial fibrillation and oral anticoagulant prescribing in England, 2009 to 2019: a cohort study. PLOS Med. 19(6), e1004003 (2022).
33.
Komodo Health, Inc. Healthcare map [cited: 27 November 2024]. Available from: https://www.komodohealth.com/technology/healthcare-map/
34.
Ramagopalan SV, Graham S, Carroll R, Raluy-Callado M, Nordstrom BL, Donaldson R et al. Discontinuation and primary care visits in nonvalvular atrial fibrillation patients treated with apixaban or warfarin. J. Comp. Eff. Res. 8(6), 371–379 (2019).
35.
Ruigomez A, Vora P, Balabanova Y, Brobert G, Roberts L, Fatoba S et al. Discontinuation of non-Vitamin K antagonist oral anticoagulants in patients with non-valvular atrial fibrillation: a population-based cohort study using primary care data from The Health Improvement Network in the UK. BMJ Open 9(10), e031342 (2019).
36.
Norby FL, Benjamin EJ, Alonso A, Chugh SS. Racial and ethnic considerations in patients with atrial fibrillation: JACC Focus Seminar 5/9. J. Am. Coll. Cardiol. 78(25), 2563–2572 (2021).
37.
Ugowe FE, Jackson LR 2nd, Thomas KL. Racial and ethnic differences in the prevalence, management, and outcomes in patients with atrial fibrillation: a systematic review. Heart Rhythm. 15(9), 1337–1345 (2019).
38.
Banerjee A, Benedetto V, Gichuru P, Burnell J, Antoniou S, Schilling RJ et al. Adherence and persistence to direct oral anticoagulants in atrial fibrillation: a population-based study. Heart 106(2), 119–126 (2020).
39.
Danchin N, Steg G, Mahe I, Hanon O, Jacoud F, Nolin M et al. Comparative non-persistence in the first year of treatment with oral anticoagulants in patients with atrial fibrillation: a French comprehensive nationwide study. Arch. Cardiovasc. Dis. 115(11), 571–577 (2022).
40.
Lip GYH, Pan X, Kamble S, Kawabata H, Mardekian J, Masseria C et al. Discontinuation risk comparison among ‘real-world’ newly anticoagulated atrial fibrillation patients: apixaban, warfarin, dabigatran, or rivaroxaban. PLOS ONE 13(4), e0195950 (2018).
41.
Reynolds KR, Khosrow-Khavar F, Dave CV. Racial and ethnic disparities in initiation of direct oral anticoagulants among Medicare beneficiaries. JAMA Netw. Open 7(5), e249465 (2024).
42.
Tamirisa KP, Al-Khatib SM, Mohanty S, Han JK, Natale A, Gupta D et al. Racial and ethnic differences in the management of atrial fibrillation. CJC Open 3(Suppl. 12), S137–S148 (2021).
• Review summarizing the racial/ethnic differences in the management of AF and potential initiatives to address disparities.
43.
Holbrook A, Morrow R, Lee AYY, Foster G, Pullenyegum E. Comparative effectiveness and safety of oral anticoagulants for atrial fibrillation: a retrospective cohort study. J. Popul. Ther. Clin. Pharmacol. 27(2), e28–e44 (2020).
44.
Dhamane AD, Hernandez I, Di Fusco M, Gutierrez C, Ferri M, Russ C et al. Non-persistence to oral anticoagulation treatment in patients with non-valvular atrial fibrillation in the USA. Am. J. Cardiovasc. Drugs 22(3), 333–343 (2022).
45.
Kefale AT, Peterson GM, Bezabhe WM, Bereznicki LR. Switching of oral anticoagulants in patients with nonvalvular atrial fibrillation: a narrative review. Br. J. Clin. Pharmacol. 88(2), 514–534 (2022).
46.
Glowacki N, Guzman I, Mills JR, Parks A, Ateya M, Dai F et al. Impact of social determinants of health on primary adherence of oral anticoagulants among patients with newly diagnosed atrial fibrillation. Cardiol. Ther. 14(1), 53–69 (2025).
• How social determinants of health can impact oral anticoagulant nonadherence.
47.
Ingham M, Romdhani H, Patel A, Ashton V, Caron-Lapointe G, Tardif-Samson A et al. Non-medical switching or discontinuation patterns among patients with non-valvular atrial fibrillation treated with direct oral anticoagulants in the United States: a claims-based analysis. J. Mark. Access Health Policy 12(3), 252–263 (2024).
Information & Authors
Information
Published In
Copyright
© 2025 Bristol Myers Squibb Company, NJ, USA. This work is licensed under the Attribution-NonCommercial-NoDerivatives 4.0 Unported License
History
Received: 22 April 2025
Accepted: 30 June 2025
Published online: 5 August 2025
Keywords:
Topics
Authors
Metrics & Citations
Metrics
Article Usage
Article usage data only available from February 2023. Historical article usage data, showing the number of article downloads, is available upon request.
Citations
How to Cite
Evaluation of the treatment patterns among commercially insured patients with nonvalvular atrial fibrillation prescribed an oral anticoagulant by race/ethnicity. (2025) Journal of Comparative Effectiveness Research. DOI: 10.57264/cer-2025-0057
Export citation
Select the citation format you wish to export for this article or chapter.