Efficacy and safety of advanced therapies for moderately to severely active ulcerative colitis in induction and maintenance: systematic literature review and Bayesian network meta-analysis
Publication: Journal of Comparative Effectiveness Research
Abstract
Aim: Several therapies have recently been licensed for the treatment of patients with moderately to severely active ulcerative colitis (UC). To provide comparative evidence of newly available treatments, Bayesian network meta-analyses were conducted to compare their relative efficacy and safety profiles in both the induction and maintenance phases. Materials & methods: A systematic literature review was conducted to identify the available literature on randomized controlled trials for advanced treatments (AT) of moderately to severely active UC. Bayesian network meta-analyses were used to synthesize evidence on prespecified efficacy and safety outcomes. Primary efficacy end points clinical response and clinical remission were measured at the end of induction and clinical response and clinical remission among induction phase responders were assessed at the end of the maintenance period. Efficacy outcomes were analyzed separately for AT-naive and -experienced populations. Safety outcomes included serious infections over the induction period, and serious infections among others over the maintenance period. Treat-through trial outcomes were adjusted to align with responder rerandomized trial outcomes. Results: The systematic review identified 58 relevant trials of which 28 met criteria for inclusion in the main analysis networks. At the end of the induction period, all treatments were efficacious against placebo for both AT-naive and AT-experienced populations. Upadacitinib 45 mg demonstrated a higher likelihood of clinical response and remission compared with other treatments. Adalimumab had less favorable performance over the induction period. Among induction phase responders, most treatments demonstrated similar efficacy at the end of the maintenance period. Tofacitinib 10 mg was more likely to achieve clinical response and remission than several other treatments in the AT-naive population. In the AT-experienced population, upadacitinib 30 mg demonstrated a higher likelihood of clinical response and remission compared with other treatments. The safety outcomes among treatments were similar. Conclusion: This study provides an updated comparison of treatments for moderately to severely active UC. Most treatments demonstrated comparable efficacy at the end of maintenance. The findings from this study can inform decision making in treatment choice for patients with moderately to severely active UC.
Plain language summary
What is the article about?
Ulcerative colitis (UC) is a chronic inflammatory condition of the colon that can significantly impact daily life. For individuals with moderately to severely active UC, several new treatments have recently been approved. This study compared the effectiveness and safety of these therapies using data from clinical trials using advanced statistical methods.
What were the results?
A systematic review identified 28 trials that met the criteria for inclusion in our analysis. Treatments were assessed in two key phases: the induction phase and the maintenance phase. Analyses were conducted separately for patients who were new to advanced therapies (AT-naive) and those who had previous exposure (AT-experienced). During the induction phase, all treatments outperformed placebo in both AT-naive and AT-experienced groups. Upadacitinib 45 mg demonstrated the highest likelihood of achieving clinical response and remission, while adalimumab showed less favorable outcomes compared with other treatments. By the end of the maintenance phase, most treatments showed similar effectiveness. Tofacitinib 10 mg was most effective for maintaining response and remission in AT-naive patients. For AT-experienced patients, upadacitinib 30 mg had the greatest likelihood of clinical response and remission among induction phases responders at the end of maintenance. Safety outcomes were broadly comparable across treatments.
Why is this important?
The findings of this study offers valuable insights to support informed treatment decisions, helping clinicians navigate the growing range of therapeutic options.
Ulcerative colitis (UC) is an idiopathic inflammatory bowel disease characterized by inflammation of the colonic mucosa [1]. Common symptoms of UC include diarrhoea, abdominal pain, urgency, rectal pain, rectal bleeding, weight loss, fatigue, fever and psychosocial issues [1,2].
The treatment options for adults with moderately to severely active UC are rapidly evolving. Current treatments include multiple monoclonal antibodies (biologics) designed to target specific inflammatory pathways, such as infliximab, adalimumab, golimumab, vedolizumab, ustekinumab, mirikizumab, risankizumab and guselkumab (US FDA, 2024). In addition to biologics, small molecule drugs that inhibit the Janus kinase (JAK)-mediated inflammatory pathways, such as tofacitinib, filgotinib and upadacitinib, are used in adults with moderately to severely active UC. Etrasimod and ozanimod, both small molecule drugs that selectively modulate the sphingosine1-phosphate receptors (S1P), are also available for the treatment of UC.
Treatment selection in the era of multiple therapies is typically influenced by diverse factors including patient and disease related characteristics, patient preference, route of administration, access to therapy and perhaps primarily comparative effectiveness and safety. However, in the absence of head-to-head studies directly comparing all treatments, insights for clinical and healthcare decision making can be obtained through indirect comparisons using network meta-analyses (NMAs). The trial designs of treatments approved for UC differ between responder rerandomization (ReR) and a treat-through (TT) design. While this difference in trial design can make indirect comparisons challenging due to the assumption of similarity, they still represent a valuable source of comparison for treatment effectiveness and safety.
This study aimed to update the existing literature on the comparative effectiveness and safety of approved treatments for moderately to severely active UC over the induction period and maintenance period using Bayesian NMAs and accounting for difference in trial designs.
Materials & methods
Systematic literature review
A clinical systematic literature review (SLR) was conducted following the National Institute for Health and Care Excellence (NICE) and Preferred Reporting Items for Systematic Reviews and Meta-Analyses (PRISMA) guidelines [3,4]. Systematic searches were performed in electronic databases, including Medline, Embase, Cochrane Library and supplemented by manual searches of conference proceedings and other secondary sources to identify publications reporting on the clinical efficacy and safety of various treatment options for the population of interest. The population of interest comprises of patients, including those aged 16 years and older, with moderately to severely active UC. The SLR searches were conducted on 15 November 2022. Details of the search strategy are presented in Supplementary Table 1. Title/abstract and full-text screenings were conducted to identify studies that met the SLR eligibility criteria, as outlined in Table 1. The NICE checklist was used to assess the quality of the included studies [5]. Two independent reviewers conducted this assessment, and differences were resolved in discussion with a third reviewer.
| Category | Inclusion criteria | Exclusion criteria |
|---|---|---|
| Population | • Patients with moderately to severely active UC • Age group: ≥18 years | • Nonhuman studies • Studies with a mixed population (mild to moderate, mild to severe) were excluded if relevant data was not reported separately for the relevant patient population |
| Intervention | Any | Not applicable |
| Comparators | Etrasimod, infliximab, adalimumab, golimumab, vedolizumab, ustekinumab, tofacitinib, filgotinib, mirikizumab, upadacitinib, ozanimod, risankizumab and guselkumab | Not applicable |
| Outcomes | Clinical efficacy: Clinical response, rates and duration of response, clinical remission, symptomatic remission, rectal bleeding, stool frequency, endoscopic healing, mucosal healing (combines endoscopic and histological healing), endoscopic improvement, mortality, measures of disease activity (Mayo score, C-reactive protein levels, etc.), relapse, corticosteroid-free remission, rates of surgical intervention, time to surgical intervention, etc. Safety: Frequencies and grades of AEs, treatment discontinuations due to adverse events, proportion of patients requiring surgery | Studies not reporting any of the relevant outcomes |
| Study types | • Randomized controlled trials (RCTs) | • Observational studies and economic studies • Case studies/reports, case series, protocols, validation studies • Comments, editorials, magazine, letter to editor, expert opinions, books, erratums • Systematic literature reviews and meta-analyses were excluded but flagged for bibliographic check |
| Language | English | Non-English |
Feasibility & network meta-analysis
The trials identified in the SLR were assessed against inclusion criteria detailed in Table 2 to determine their eligibility for inclusion in the NMA. Both phase II and phase III studies were considered. A qualitative evaluation of all studies was performed, considering study designs, inclusion and exclusion criteria, baseline characteristics, interventions, as well as outcome definitions and timing. Only interventions that met the inclusion criteria and fell within the licensed dose range for patients with moderately to severely active UC, as defined by the EMA or FDA, were included in the NMA. Both head-to-head trials and randomized controlled trials (RCTs) with active comparators versus placebo were considered. All main analyses of the maintenance period excluded studies with maintenance periods of less than 38 weeks since these trials have a shorter evaluation of the clinical outcomes compared with other maintenance trials. For the main efficacy analyses, only studies that reported both clinical response and clinical remission outcomes were included.
| Component | Inclusion | |
|---|---|---|
| Patient population | Adults (≥16 years) with moderately to severely active UC from randomized controlled trials | |
| Interventions | • ADA 80/40 mg (80 mg at week 0, 40 mg at week 2); ADA 160/80 mg (160 mg at week 0, 80 mg at week 2) | • ADA 40 mg (every other week) |
| • ETS 2 mg (once daily) | • ETS 2 mg (once daily) | |
| • FIL 100 mg; FIL 200 mg (once daily) | • FIL 100 mg; FIL 200 mg (once daily) | |
| • GOL 200/100 mg (200 mg at week 0 and 100 mg at week 2) | • GOL 100 mg; GOL 50 mg (every 4 weeks) | |
| • IFX 5 mg (5 mg/kg weeks 0, 2, and 6) | • IFX 5 mg (every 8 weeks) | |
| • OZN 1 mg † (0.23 mg at days 1–4, 0.46 mg at days 5–7, 0.92 mg at day 8 and after) | • OZN 1 mg a (0.92 mg once daily) | |
| • TOF 10 mg (twice daily) | • TOF 10 mg; TOF 5 mg (twice daily) | |
| • UPA 45 mg (once daily) | • UPA 15 mg; UPA 30 mg (once daily) | |
| • UST 6 mg (6 mg/kg at week 0) | • UST 90 mg Q8W (every 8 weeks); UST 90 mg Q12W (week 8 then every 12 weeks) | |
| • VDZ 300 mg (weeks 0, 2 and 6, or weeks 0 and 2 ‡) | • VDZ 300 mg Q8W (every 8 weeks); VDZ 300 mg Q4W (every 4 weeks) • VDZ 108 mg SC (every 2 weeks) | |
| Outcomes measures | Reported an outcome of interest after 6–14 weeks of induction treatment and/or after at least 38 weeks of maintenance treatment | |
| Study design | Phase II or III double-blinded randomized controlled trial | |
†
0.92 mg ozanimod is equivalent to 1 mg ozanimod hydrochloride.
‡
When combined with VDZ 300 mg Q4W maintenance dose, represents an approved induction/maintenance dosing regimen.
The abbreviations used in this table are used throughout this manuscript, e.g., ADA80/40 refers to ADA 80/40 mg (80 mg at week 0, 40 mg at week 2), ETS2 refers to ETS 2 mg (once daily), etc.
ADA: Adalimumab; ETS: Etrasimod; FIL: Filgotinib; GOL: Golimumab; IFX: Infliximab; OZN: Ozanimod; SC: Subcutaneous; TOF: Tofacitinib; UPA: Upadacitinib; UST: Ustekinumab; VDZ: Vedolizumab.
Outcomes & imputation
Efficacy outcomes were assessed based on the Mayo Clinical score (MCS) when reported or the modified Mayo score (MMS) otherwise as the main measure of outcomes. The MCS, also known as the total Mayo score, consists of four components: the stool frequency subscore, the rectal bleeding subscore, the endoscopic subscore and the physician’s global assessment, all of which have subscore ranges between 0 and 3 [6], with higher scores indicating higher disease activity. The MMS has the same components as the MCS except that it does not include the physician’s global assessment component. The evaluation of efficacy outcomes was conducted at the end of both the induction and maintenance periods. In the induction period, the efficacy outcomes included clinical response and clinical remission (Supplementary Material 2). Analyses were carried out within both the advanced therapy (AT)-naive and AT-experienced populations. Notably, AT was defined to include biologics, JAK inhibitors and S1Ps. The definition of AT-experienced includes patients who have previously been exposed to, experienced, or failed a treatment, reflecting the evolving treatment landscape. Serious infections were the primary safety and tolerability outcome of interest and were analyzed for both the induction and maintenance populations. Other safety and tolerability outcomes that were assessed over the maintenance period included serious adverse events (AEs), overall AEs and discontinuations due to AEs.
To minimize the heterogeneity and improve comparability in the maintenance populations between trials, TT trial outcomes were adjusted to mimic ReR trial outcomes [7]. For outcomes related to the maintenance period, the observed data from the ReR trials was used directly, whereas the observed data from the TT trials were adjusted based on the assumption that the number of responders for a specific arm at the end of induction serves as a proxy for the total number of patients entering maintenance, i.e., an ReR analysis [8,9] (Supplementary Material 3). Thus, in the maintenance period, the outcomes assessed were clinical response and clinical remission in individuals who had previously responded during the induction phase. Clinical response from the TT trials was based on the proportion achieving sustained clinical response, as this mitigates the risk of counting maintenance phase responders who were induction phase non-responders. If this was not reported for TT trials, responder rerandomized outcomes could not be estimated and the trial was excluded from maintenance analysis networks. For etrasimod, patient-level data were available, and a responder randomization analysis was conducted directly using this data.
Several prespecified sensitivity analyses were conducted and are described in Supplementary Table 3.
Statistical analysis
The NMAs were conducted under a Bayesian framework using Gibbs sampling [10]. The efficacy analyses were conducted using a Bayesian multinomial likelihood NMA model with a probit link, an approach that accounts for correlation between the outcomes, in this case clinical response and clinical remission. For the safety and tolerability outcomes, a Bayesian binomial likelihood model was utilized with a logit link.
The placebo response and remission rates among trials have been known to vary and depend on several factors [11]. Therefore, models with and without a component to adjust for the baseline risk across trials were performed for each analysis to account for this variability. All analyses were conducted using fixed effect (FE) and random effects (RE) modelling assumptions of relative treatment effects with vague priors (Supplementary Material 5). Independent baseline natural history models were run using a random effects binomial model.
Convergence was assessed by evaluating the Brooks–Gelman–Rubin statistics and related plots [12], reviewing trace plots, and comparing prior and posterior distributions. Correlation was assessed by reviewing autocorrelation plots. A thinning factor was applied to reduce autocorrelation specific to each analysis.
The assumption of similarity of potential effect modifiers was assessed as part of the feasibility assessment. Heterogeneity was assessed by performing a pairwise meta-analysis for each comparison informing the network, or inspecting the I2 statistic and p-value from the chi-squared test where multiple studies informed the comparison [13]. Networks with evidence loops, were assessed for consistency by comparing the fit of an FE unrelated mean effects model to the associated FE NMA model [14].
For each analysis, the median and 95% credible interval of the posterior samples for each effect were used to estimate all pairwise relative risks (RR) between treatments. The deviance information criterion and mean residual deviance was used to assess model fit and compare between fixed and random effects models for the same analysis.
Results
Systematic literature review
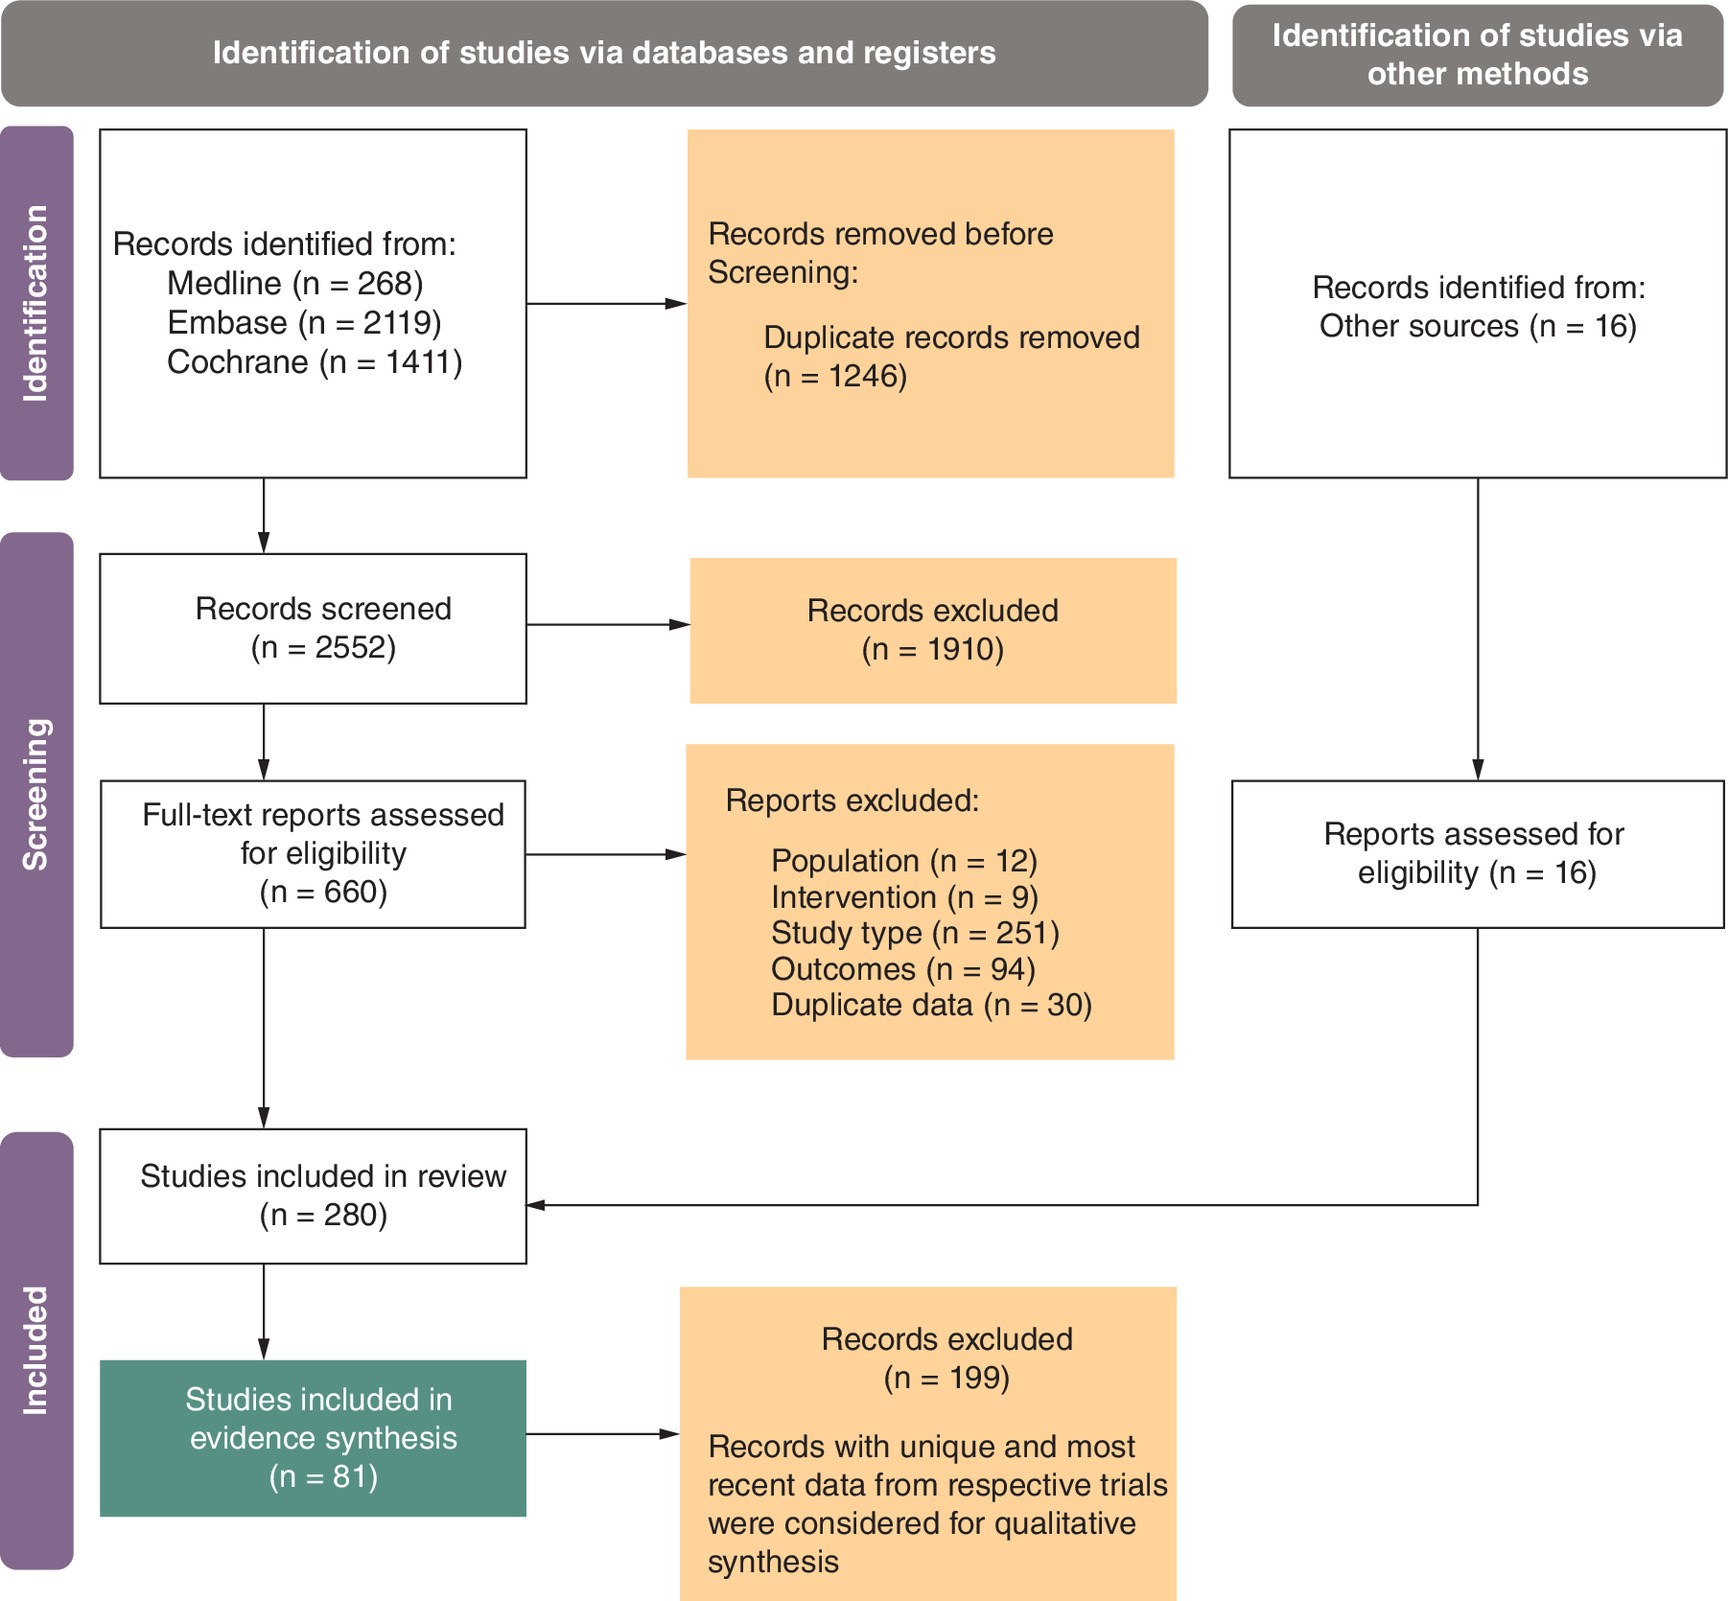
The SLR search strategy identified 3798 records, of which 2552 proceeded to title/abstract review and 280 for qualitive assessment including 16 studies from other sources. Of the 280 records, 81 were unique and the most recent data were included for feasibility assessment covering 58 original RCTs. Figure 1 summarizes the flow of identified records included in the evidence synthesis in the SLR.
Feasibility assessment
Of the 58 RCTs, 28 contributed to the main analysis networks. A total of 30 RCTs were excluded due to study characteristics (e.g., open label), outcomes (did not report an outcome of interest), and/or interventions (e.g., comparator not of interest). A summary of included trial characteristics is given in Supplementary Table 4.
The baseline patient characteristics were broadly comparable across arms within trials and across trials. There was some heterogeneity observed in disease duration, proportion of patients with concomitant use of corticosteroids and other concomitant medications and the proportion of AT-naive patients. For example, the proportion of patients with concomitant corticosteroid use at baseline typically ranged between 23 and 57%, some studies included budesonide within the proportion concomitant corticosteroid use while it was unclear for others. Further, the proportion of patients AT-naive is slightly larger in the ELEVATE UC trials (66–71%) relative to other trials that were not AT-naive only trials (45–66%) other than VARSITY (79%). The risk of bias assessment found that no studies were deemed to have a high risk of bias (Supplementary Table 5).
For induction efficacy analyses, 21 and 12 RCTs formed the AT-naive and AT-experienced populations, respectively, and 11 and 8 RCTs contributed to the AT-naive and AT-experienced maintenance networks, respectively. For the safety outcomes, a total of 25 trials contributed to the networks although this varied by outcome. The length of induction period among trials varied between 6 (GEMINI 1, PURSUIT-SC) and 14 weeks (VARSITY), with the majority of trials having an induction period length of 8 weeks (Supplementary Table 4). Similarly, maintenance period lengths varied from 38 (VARSITY) to 48 weeks (PURSUIT-J, PURSUIT-M). ACT2 and NCT01551290 were excluded from the main analysis due to their short maintenance period length, 22 and 18 weeks, respectively.
Although most studies used the MCS, there were several that used the MMS for the populations of interest. These included ELEVATE UC 12, ELEVATE UC 52 and TRUE NORTH for both efficacy outcomes and additionally SELECTION for the clinical remission outcome. Outcome definitions used in the included RCTs are described in Supplementary Table 2.
Of the 11 trials that contributed to the main efficacy analyses over the maintenance period, 7 trials had a ReR trial design (GEMINI 1, OCTAVE Sustain, PURSUIT-J, PURSUIT-M, SELECTION, TRUE NORTH, U-ACHIEVE, UNIFI) and 3 trials had a TT trial design (ACT-1, ELEVATE UC 52 and ULTRA-2). For the maintenance safety analyses of TT trials (ACT-1, ULTRA 2 and VARSITY) that did not report maintenance period safety outcomes separately, the proportion of events that occurred in the induction period of the ELEVATE UC 52 trial was used to subtract induction events from the overall number of events.
Efficacy
The results focus on the FE model results which converged in all cases; detailed findings for the RE results where there was model convergence are also provided in Figures 2 & 3 and in Supplementary Material 8. Models with the baseline risk adjustment only converged in a small number of analyses and results are presented in Supplementary Material 8. Table 2 contains the treatment abbreviations.
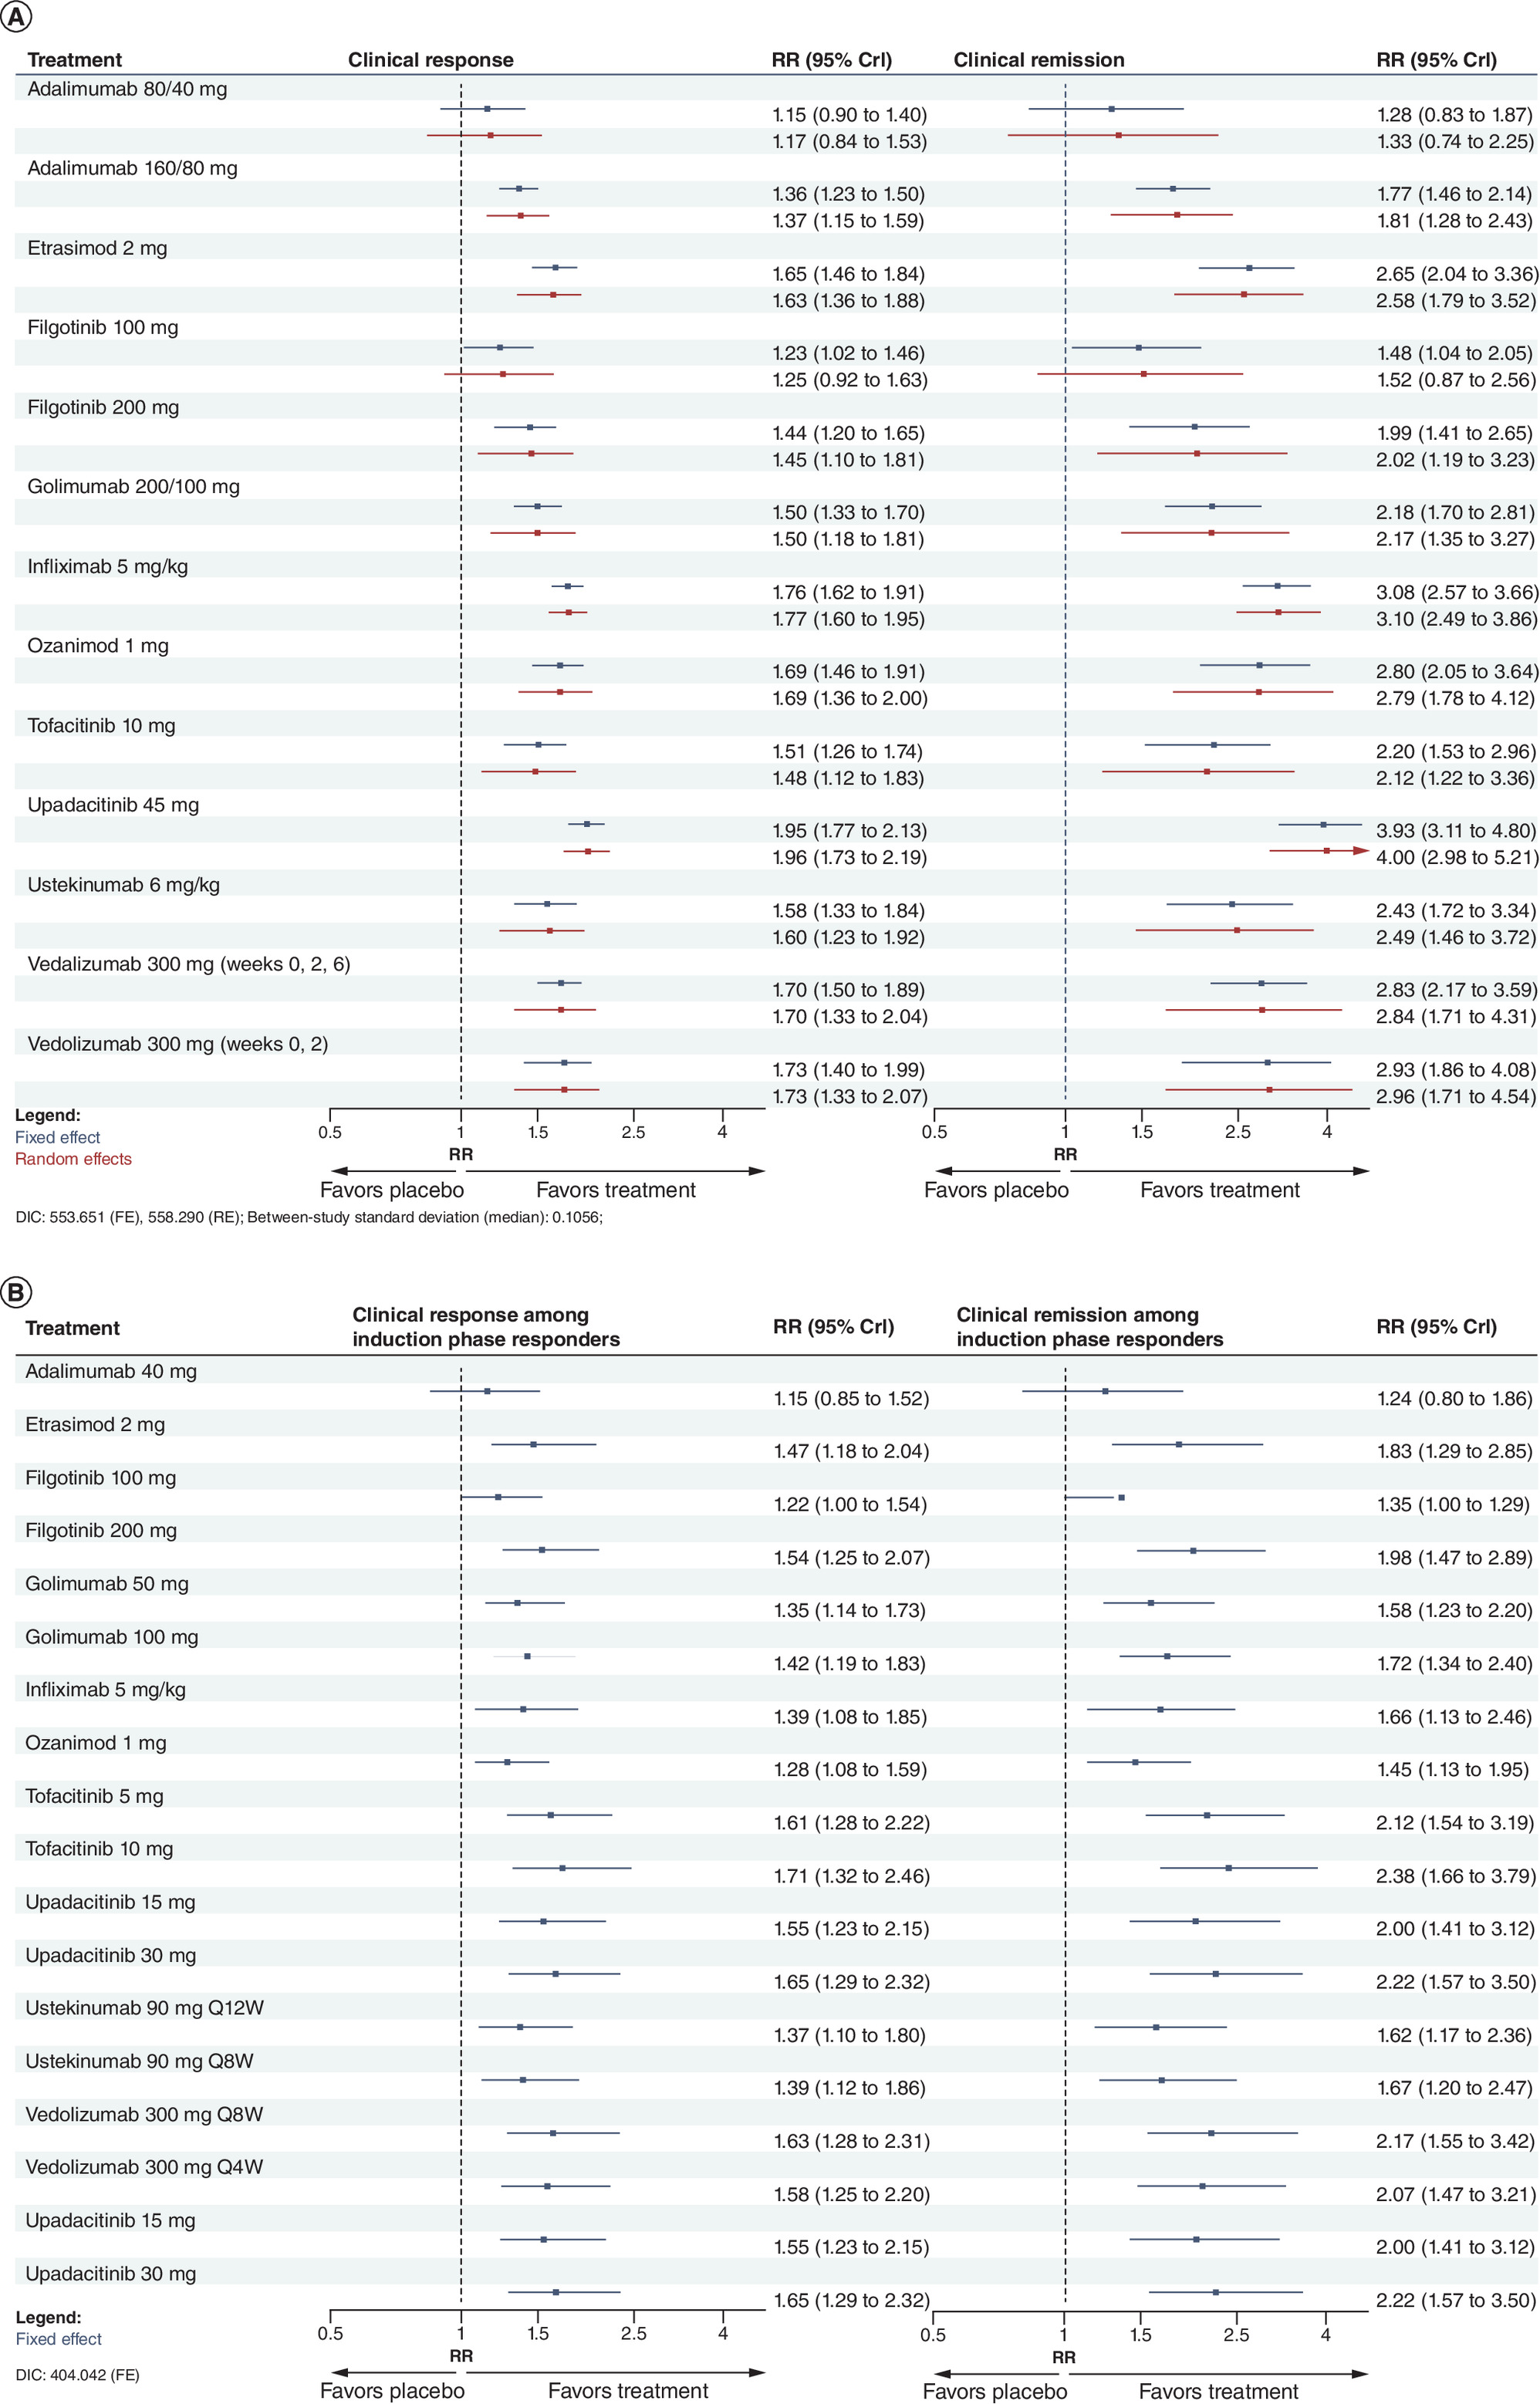
Figure 2. Forest plots showing the relative risk and 95% credible intervals between active treatments and placebo for efficacy outcomes for the AT-naive population over the induction and maintenance period.
(A) Induction period and over the (B) maintenance period using a Bayesian multinomial model.
AT: Advanced treatment; CrI: Credible interval; DIC: Deviance information criterion; RR: Relative risk.
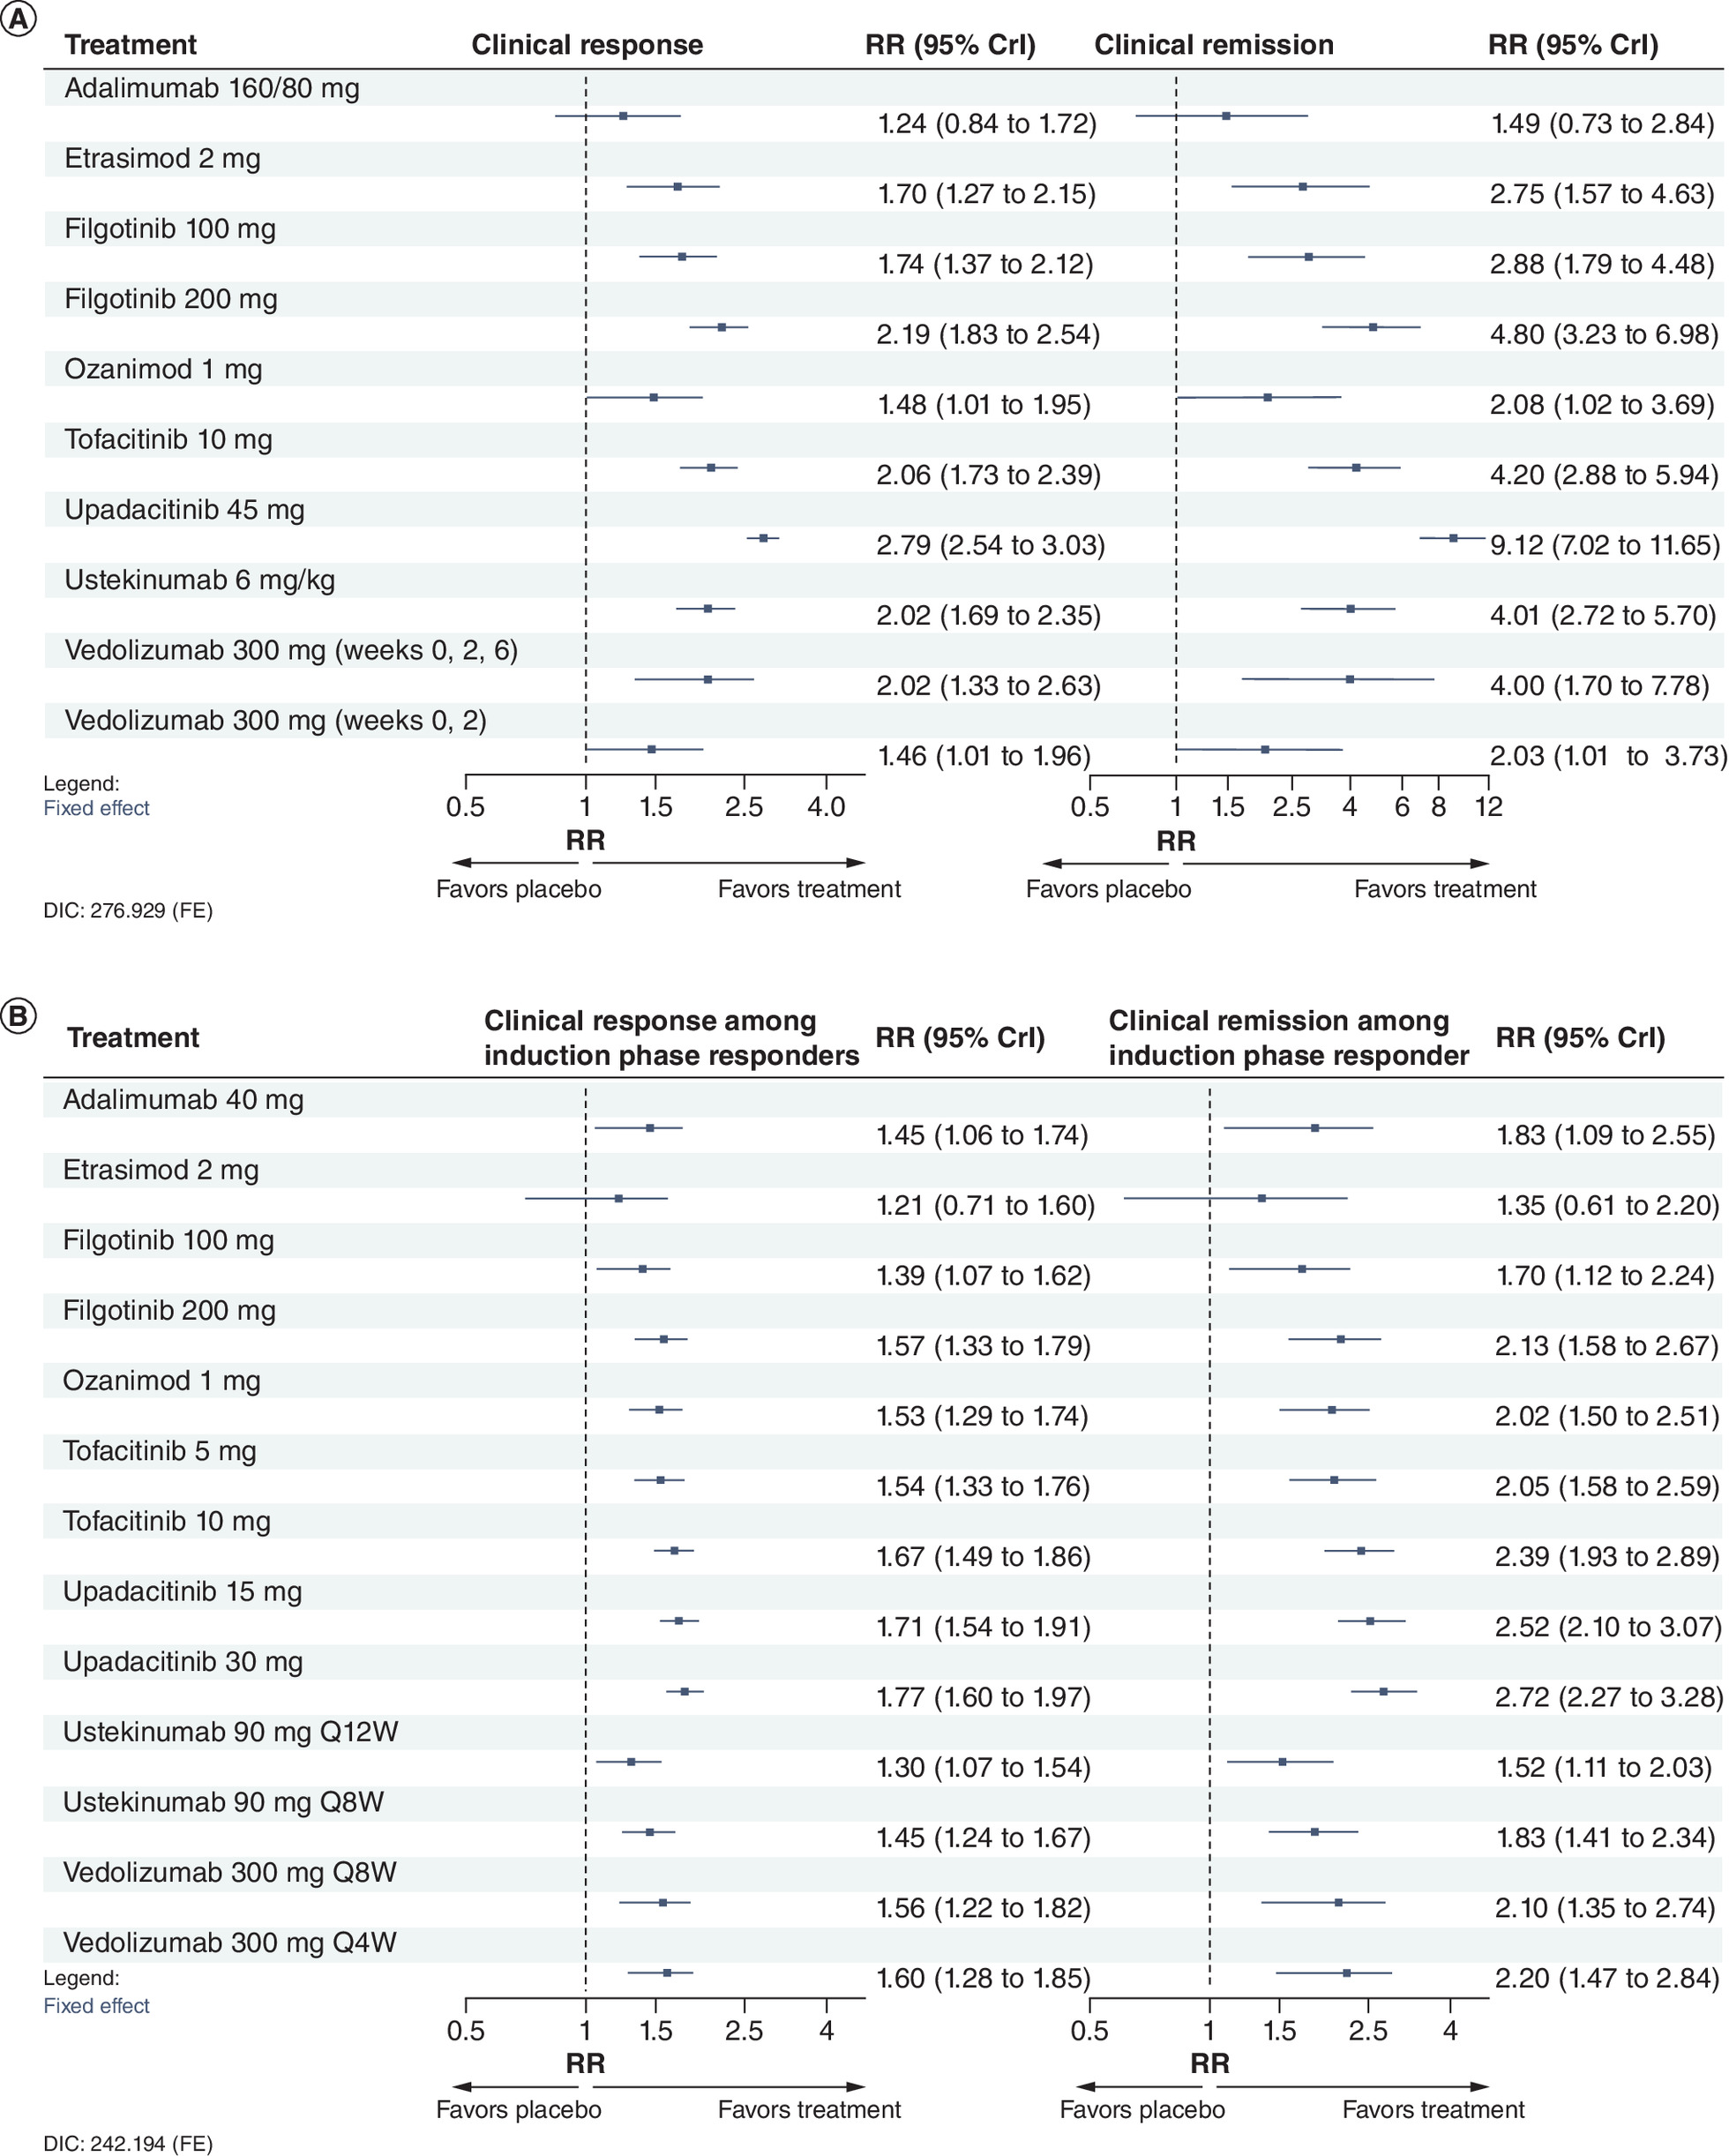
Figure 3. Forest plots showing the relative risk and 95% credible intervals between active treatments and placebo for efficacy outcomes for the AT-experienced population over the induction and maintenance period.
(A) Induction period and over the (B) maintenance period using a Bayesian multinomial model.
AT: Advanced treatment; CrI: Credible interval; DIC: Deviance information criterion; FE: Fixed effect; RR: Relative risk.
AT-naive
The network plots for clinical response and clinical remission at end of induction and among induction phase responders at the end of maintenance in the AT-naive population are given in Figure 4A & C.
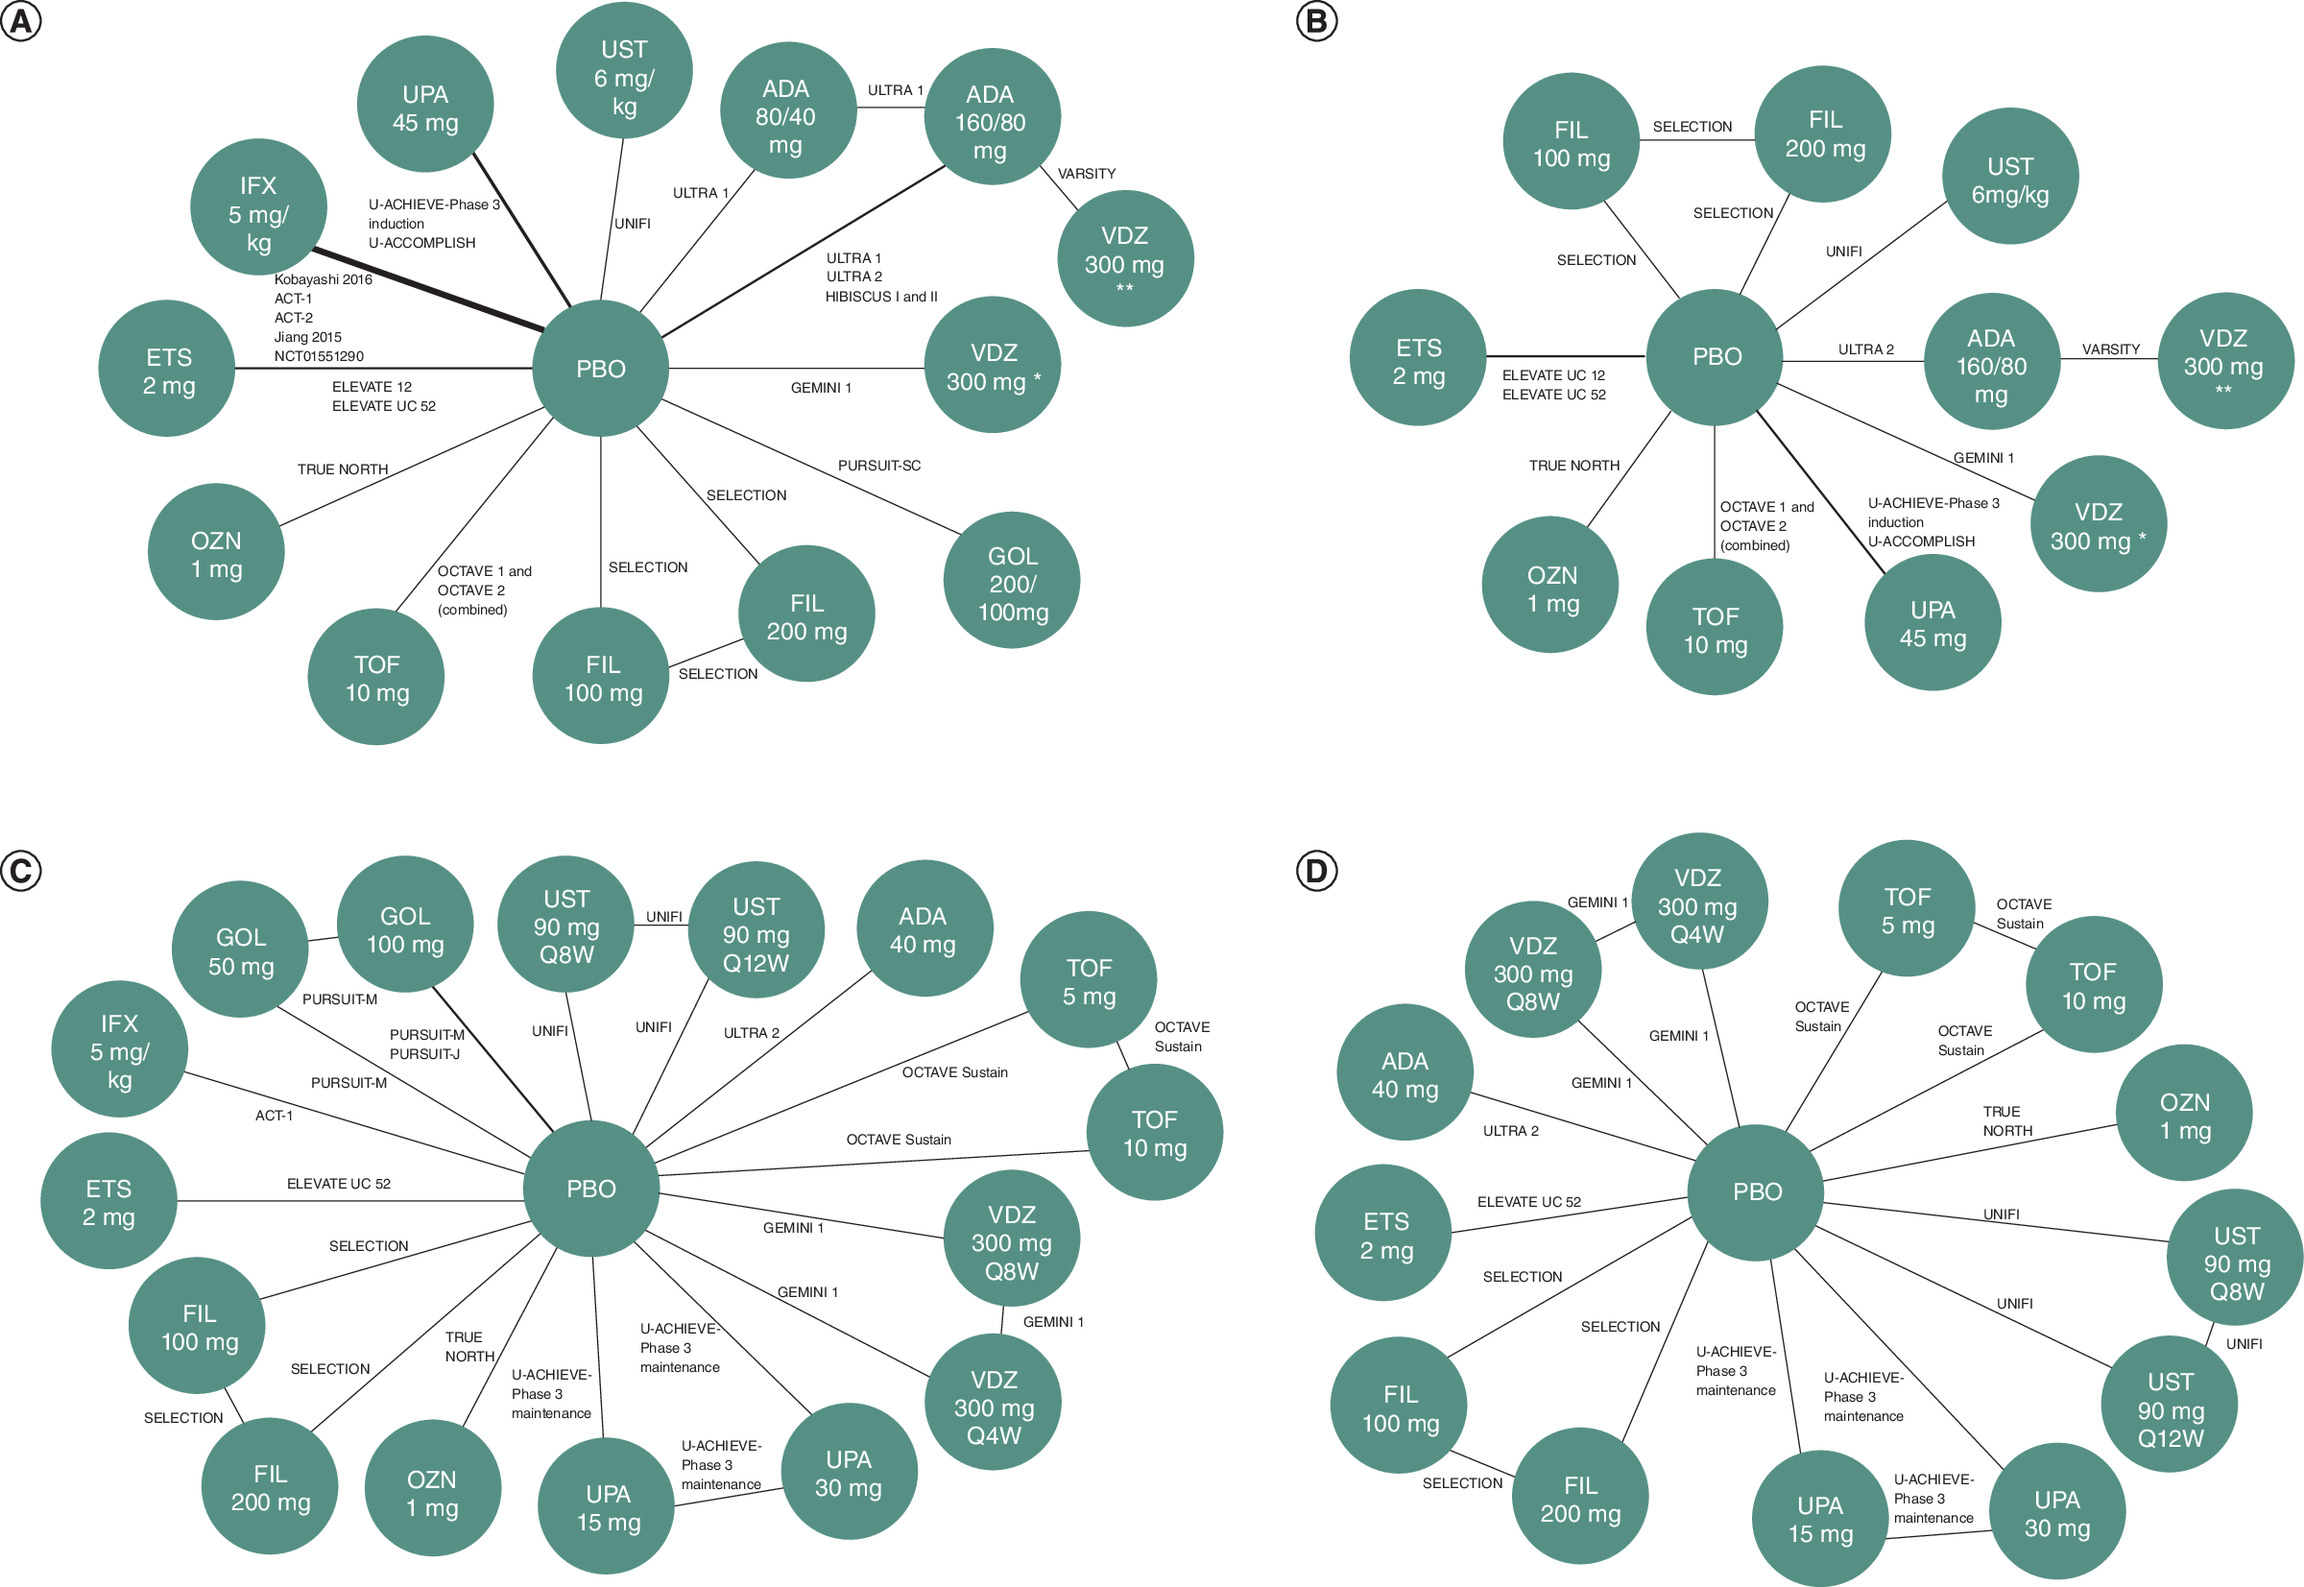
Figure 4. Network plots of the efficacy analyses.
(A) AT-naive induction period, (B) AT-experienced induction period, (C) AT-naive maintenance period and (D) AT-experienced maintenance period. The thickness of the lines between treatment nodes indicates the number of studies informing the comparison.
*Doses at weejs 0, 2 only.
**Doses at weeks 0, 2 and 6.
AT: Advanced treatment.
Clinical response
Induction
At the end of the induction period, all treatments demonstrated efficacy compared with placebo (PBO); however, ADA80/40 was not statistically significantly better (Figure 2A). However, the ADA80/40 dose is typically for patients under the age of 18 with a weighing less than 40 kg [15]. ETS2, OZN1, IFX5 and VDZ300 (dosed at weeks 0, 2 and 6) showed a significantly higher likelihood of clinical response compared with ADA80/40, ADA160/80, FIL100 and PBO. Additionally, IFX5 was significant compared with GOL200/100 and FIL200 (Supplementary Material 8). UPA45 was significantly more effective compared with all comparator treatments other than OZN1, IFX5 and VDZ300 (weeks 0 and 2 dosing).
Maintenance
Among induction phase responders, all treatments were efficacious when compared with PBO at the end of the maintenance period, although ADA40 and FIL100 did not achieve statistical significance (Figure 2B). FIL100 is a lower maintenance dose typically used in patients at a higher risk of venous thromboembolism, major adverse cardiovascular events and malignancy, hence the reduced efficacy [16]. TOF5, TOF10, VDZ300Q8W and UPA30 had significantly higher likelihoods of clinical response compared with ADA40, GOL50, OZN1 and FIL100. TOF10 was additionally significant against GOL100, UST90Q8W, UST90Q12W and IFX5 (Supplementary Material 8). The lowest effective dose is recommended first for TOF and UPA and higher doses (TOF10, UPA30) are not recommended for patients at increased risk for venous thromboembolism, major adverse cardiovascular events or malignancy [17,18]. Several treatments were significantly efficacious compared with ADA40 and OZN1 including FIL200, TOF5, TOF10, VDZ300Q8W, VDZ300Q4W and UPA30. ETS2 was comparable to other treatments, with no treatment demonstrating significantly better performance.
Clinical remission
Induction
At the end of induction, all comparators were efficacious when compared with PBO, with the exception of ADA80/40 which was not statistically significantly better (Figure 2A). ETS2, OZN1, IFX5 VDZ300 (weeks 0, 2 and 6 dosing) had significantly higher likelihood of clinical remission compared with ADA80/40, ADA160/80 and FIL100. Additionally, IFX5 had significantly improved efficacy outcomes compared with GOL 200/100 and FIL200 (Supplementary Material 8). UPA45 was significant against all comparator treatments other than OZN1, IFX5 and VDZ300 (weeks 0 and 2 dosing).
Maintenance
At the end of maintenance, results were similar to those seen as for clinical response among induction phase responders, with all treatments significant compared with PBO except FIL100 and ADA40 (Figure 2B). TOF5, TOF10, VDZ300Q8W and UPA30 had a significantly higher likelihood of clinical remission compared with ADA40, GOL50, OZN1 and FIL100. TOF10 was additionally significant against GOL100, UST90Q8W, UST90Q12W and IFX5 (Supplementary Material 8). Consistent with the clinical response results, FIL200, TOF5, TOF10, VDZ300Q8W, VDZ300Q4W and UPA30-treated patients were significantly more likely to achieve clinical remission compared with ADA 40 and OZN1. ETS2 was similar to other treatments.
AT-experienced
The network plots for clinical response and clinical remission at end of induction and among induction phase responders at the end of maintenance in the AT-experienced population are given in Figure 4B & D.
Clinical response
Induction
For clinical response outcomes in the AT-experienced population at the end of induction, all treatments were efficacious against PBO other than ADA160/80 (Figure 3A). FIL200 and TOF10 had a significantly higher likelihood of clinical response compared with ADA160/80, OZN1 and VDZ300 (weeks 0 and 2 dosing) (Supplementary Material 8). UST6, VDZ300 (weeks 0, 2 and 6 dosing). UPA45 was significant compared with all comparators.
Maintenance
At the end of maintenance, all treatments demonstrated efficacy when compared with PBO, other than ETS2 where the improvement was not statistically significant (Figure 3B). However, the small number of patients in the placebo arm (n = 11) of the ELEVATE UC 52 trial, due to the selection of responders from the induction phase, contributed to increased uncertainty in comparisons involving ETS2. Notably, ETS performed similarly to other comparators other than TOF10, UPA15 and UPA30 which were significant compared with ETS2 (Supplementary Material 8). UPA30 had a significantly higher likelihood of clinical response compared with all comparator treatments other than TOF10, VDZ300Q8W, VDZ300Q4W and UPA15.
Clinical remission
Induction
Results for the clinical remission outcome were similar to the clinical response outcomes at the end of induction. All comparators were efficacious when compared with PBO, with ADA160/80 not achieving statistical significance (Figure 3A). Similarly, FIL200 and TOF10 had a significantly higher likelihood of clinical remission compared with ADA160/80, OZN1 and VDZ300 (weeks 0 and 2 dosing) (Supplementary Material 8). UPA45 was significant compared with all comparators.
Maintenance
At the end of maintenance, similar to the clinical response outcome, all comparators were efficacious compared with PBO, with ETS2 not achieving statistical significance (Figure 3B). However, as previously discussed, the selection of responders from the induction phase for the maintenance analysis resulted in only a small number of patients (n = 11) in the placebo arm in ELEVATE UC 52. This limited sample size introduced uncertainty in the comparisons involving ETS. ETS showed comparable performance to other treatments, except for TOF10, UPA15, and UPA30, which were significant compared with ETS2 (Supplementary Material 8). As with the clinical response outcome, UPA30 had a significantly higher likelihood of clinical remission compared with all comparator treatments other than TOF10, VDZ300Q8W, VDZ300Q4W and UPA15.
Sensitivity analyses
The results of the sensitivity analysis that used the MCS rather than the MMS for ELEVATE trials to measure efficacy outcomes did not result in any significant differences between treatment comparisons with ETS2 compared with the main analyses for efficacy outcomes other than some borderline significant results (Supplementary Material 8). The sensitivity analysis that included trials with a maintenance period of less than 38 weeks resulted in some differences compared with the main analyses for treatment comparisons involving IFX5. FIL200, TOF5, VDX300Q8W, VDZ300Q4W, UPA15 and UPA30 became statistically significant compared with IFX5 which was not the case in the main analyses. For the sensitivity analyses that included the trials that only reported one efficacy outcome some minor differences over the induction period and over the maintenance period to borderline results, however, all results were consistent with the main analyses (Supplementary Material 8).
To assess the impact of applying the ReR analysis to the TT trials, a sensitivity analysis including only TT trials (ADA, ETS, IFX and VDZ) was conducted that assessed efficacy outcome over the entire treatment period (induction and maintenance). The network plots for the TT only analyses are given in Supplementary Figure 65. All treatments were significant compared with PBO other than VDZ300Q8W in the AT-experienced population. There was only one significant comparison between treatments – VDZ300Q8W had a significantly higher likelihood of clinical response and remission compared with ADA40 in the AT-naive population. The point estimates indicated favorable performance of ETS2 compared with all treatments in both the AT-naive and AT-experienced populations for both clinical response and clinical remission although the results were not statistically significant (Supplementary Material 8).
Safety
The results focus on the FE model results which converged in all cases; detailed findings for the RE results where there was model convergence are also provided in Figure 5 & in Supplementary Material 8. Models with the baseline risk adjustment only converged in a small number of analyses and results are presented in the Supplementary Material.
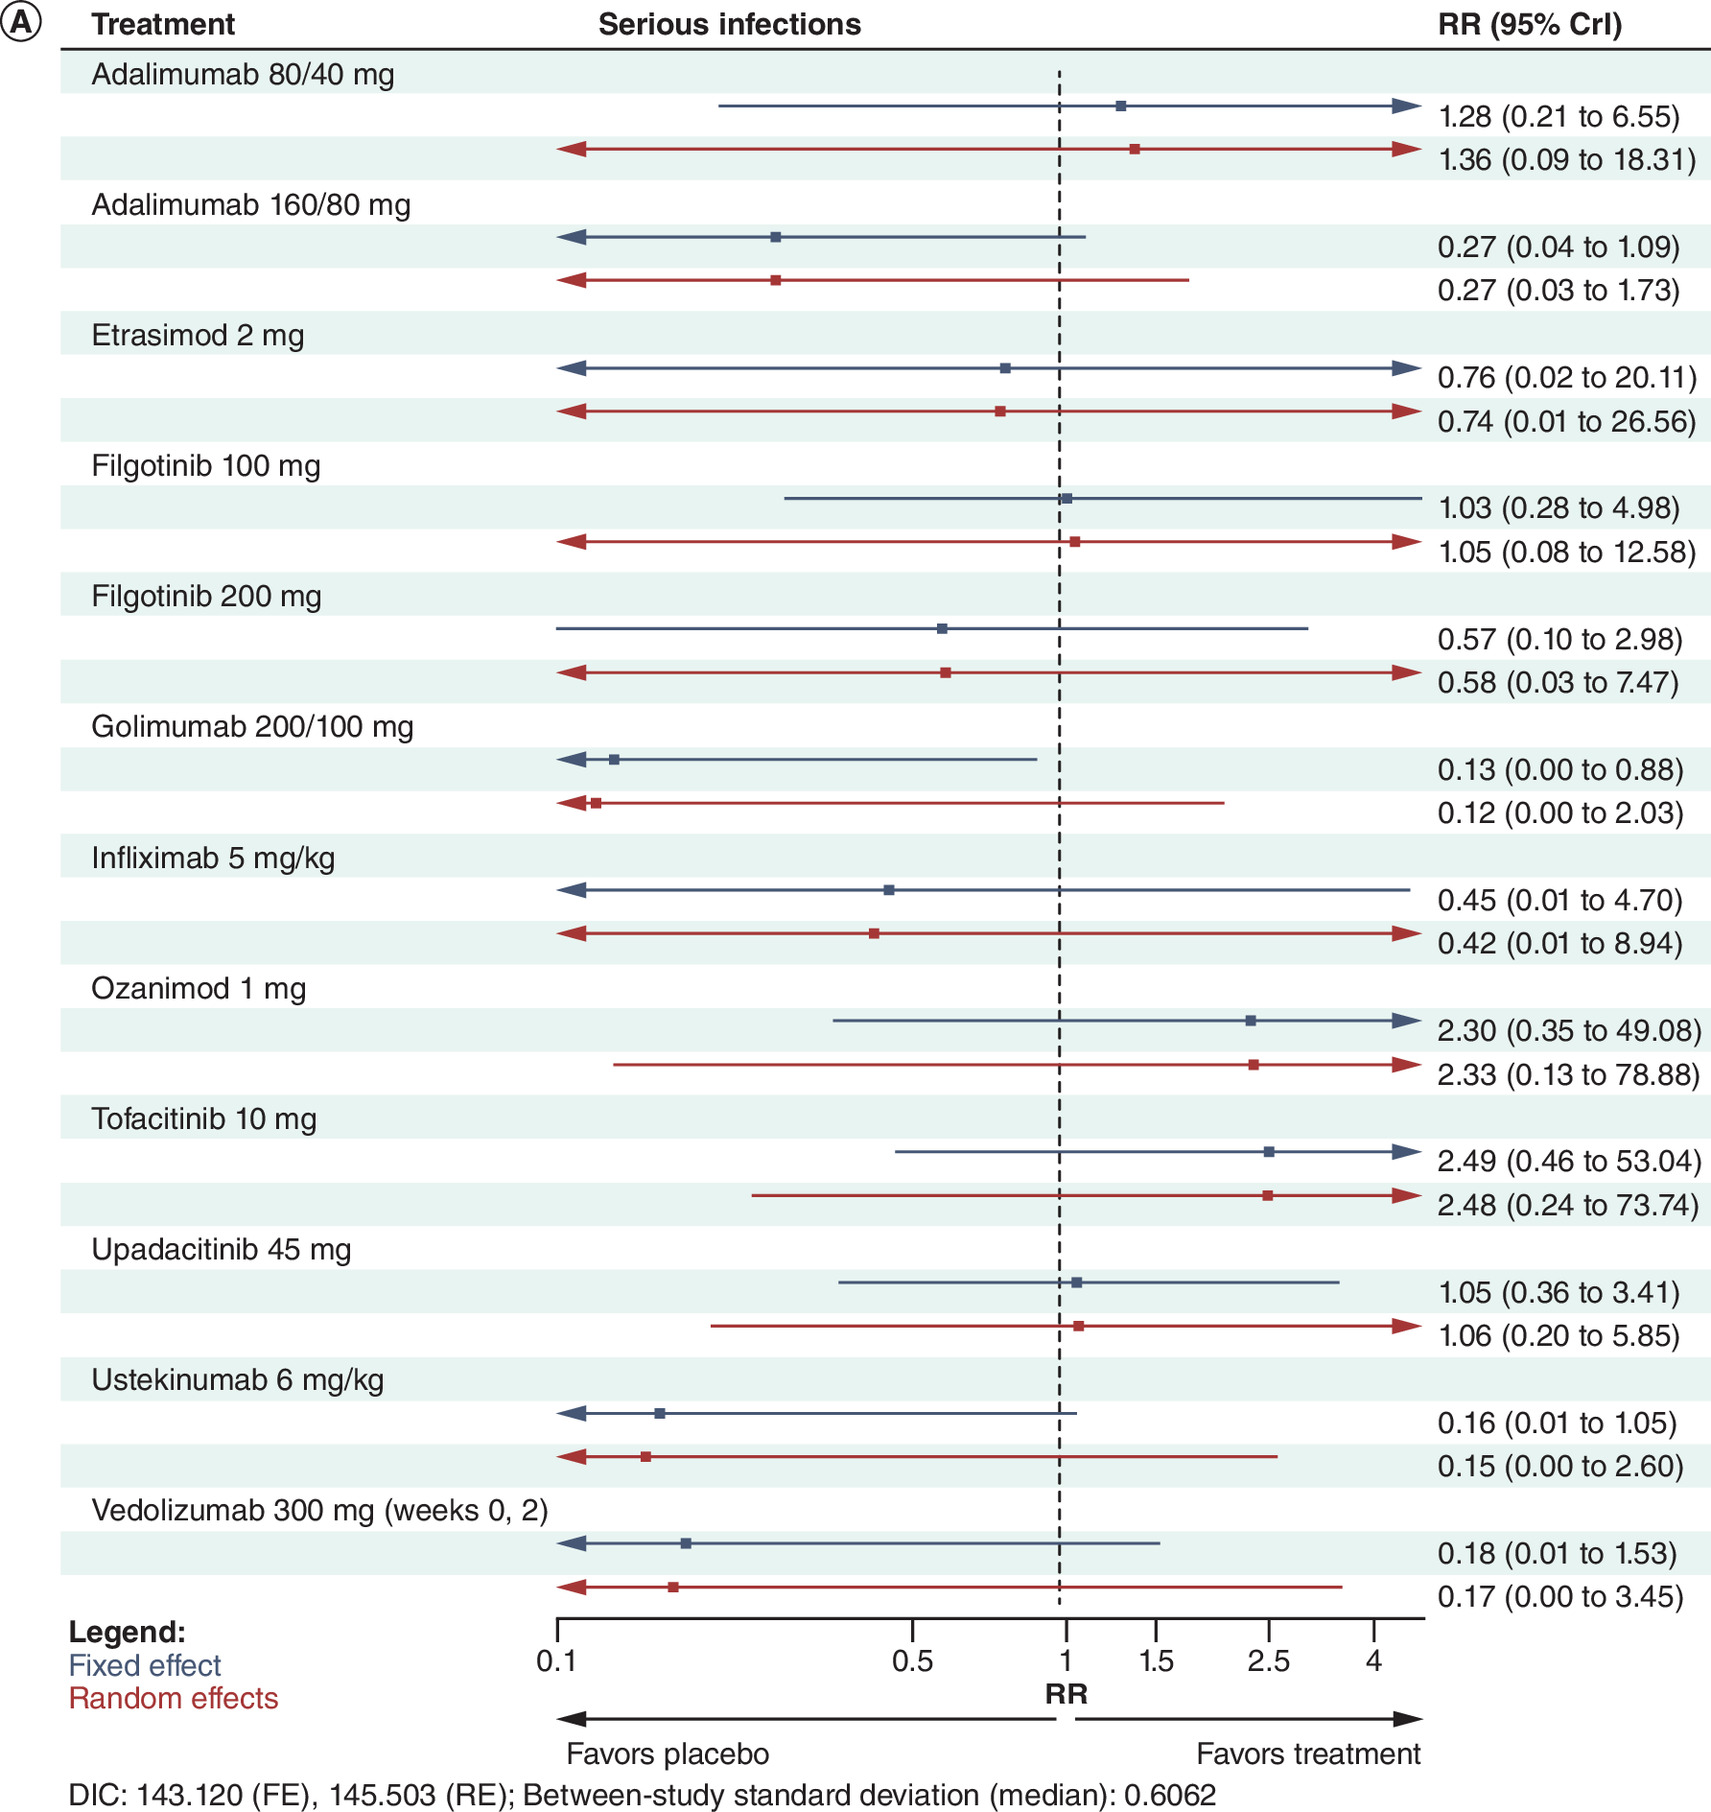
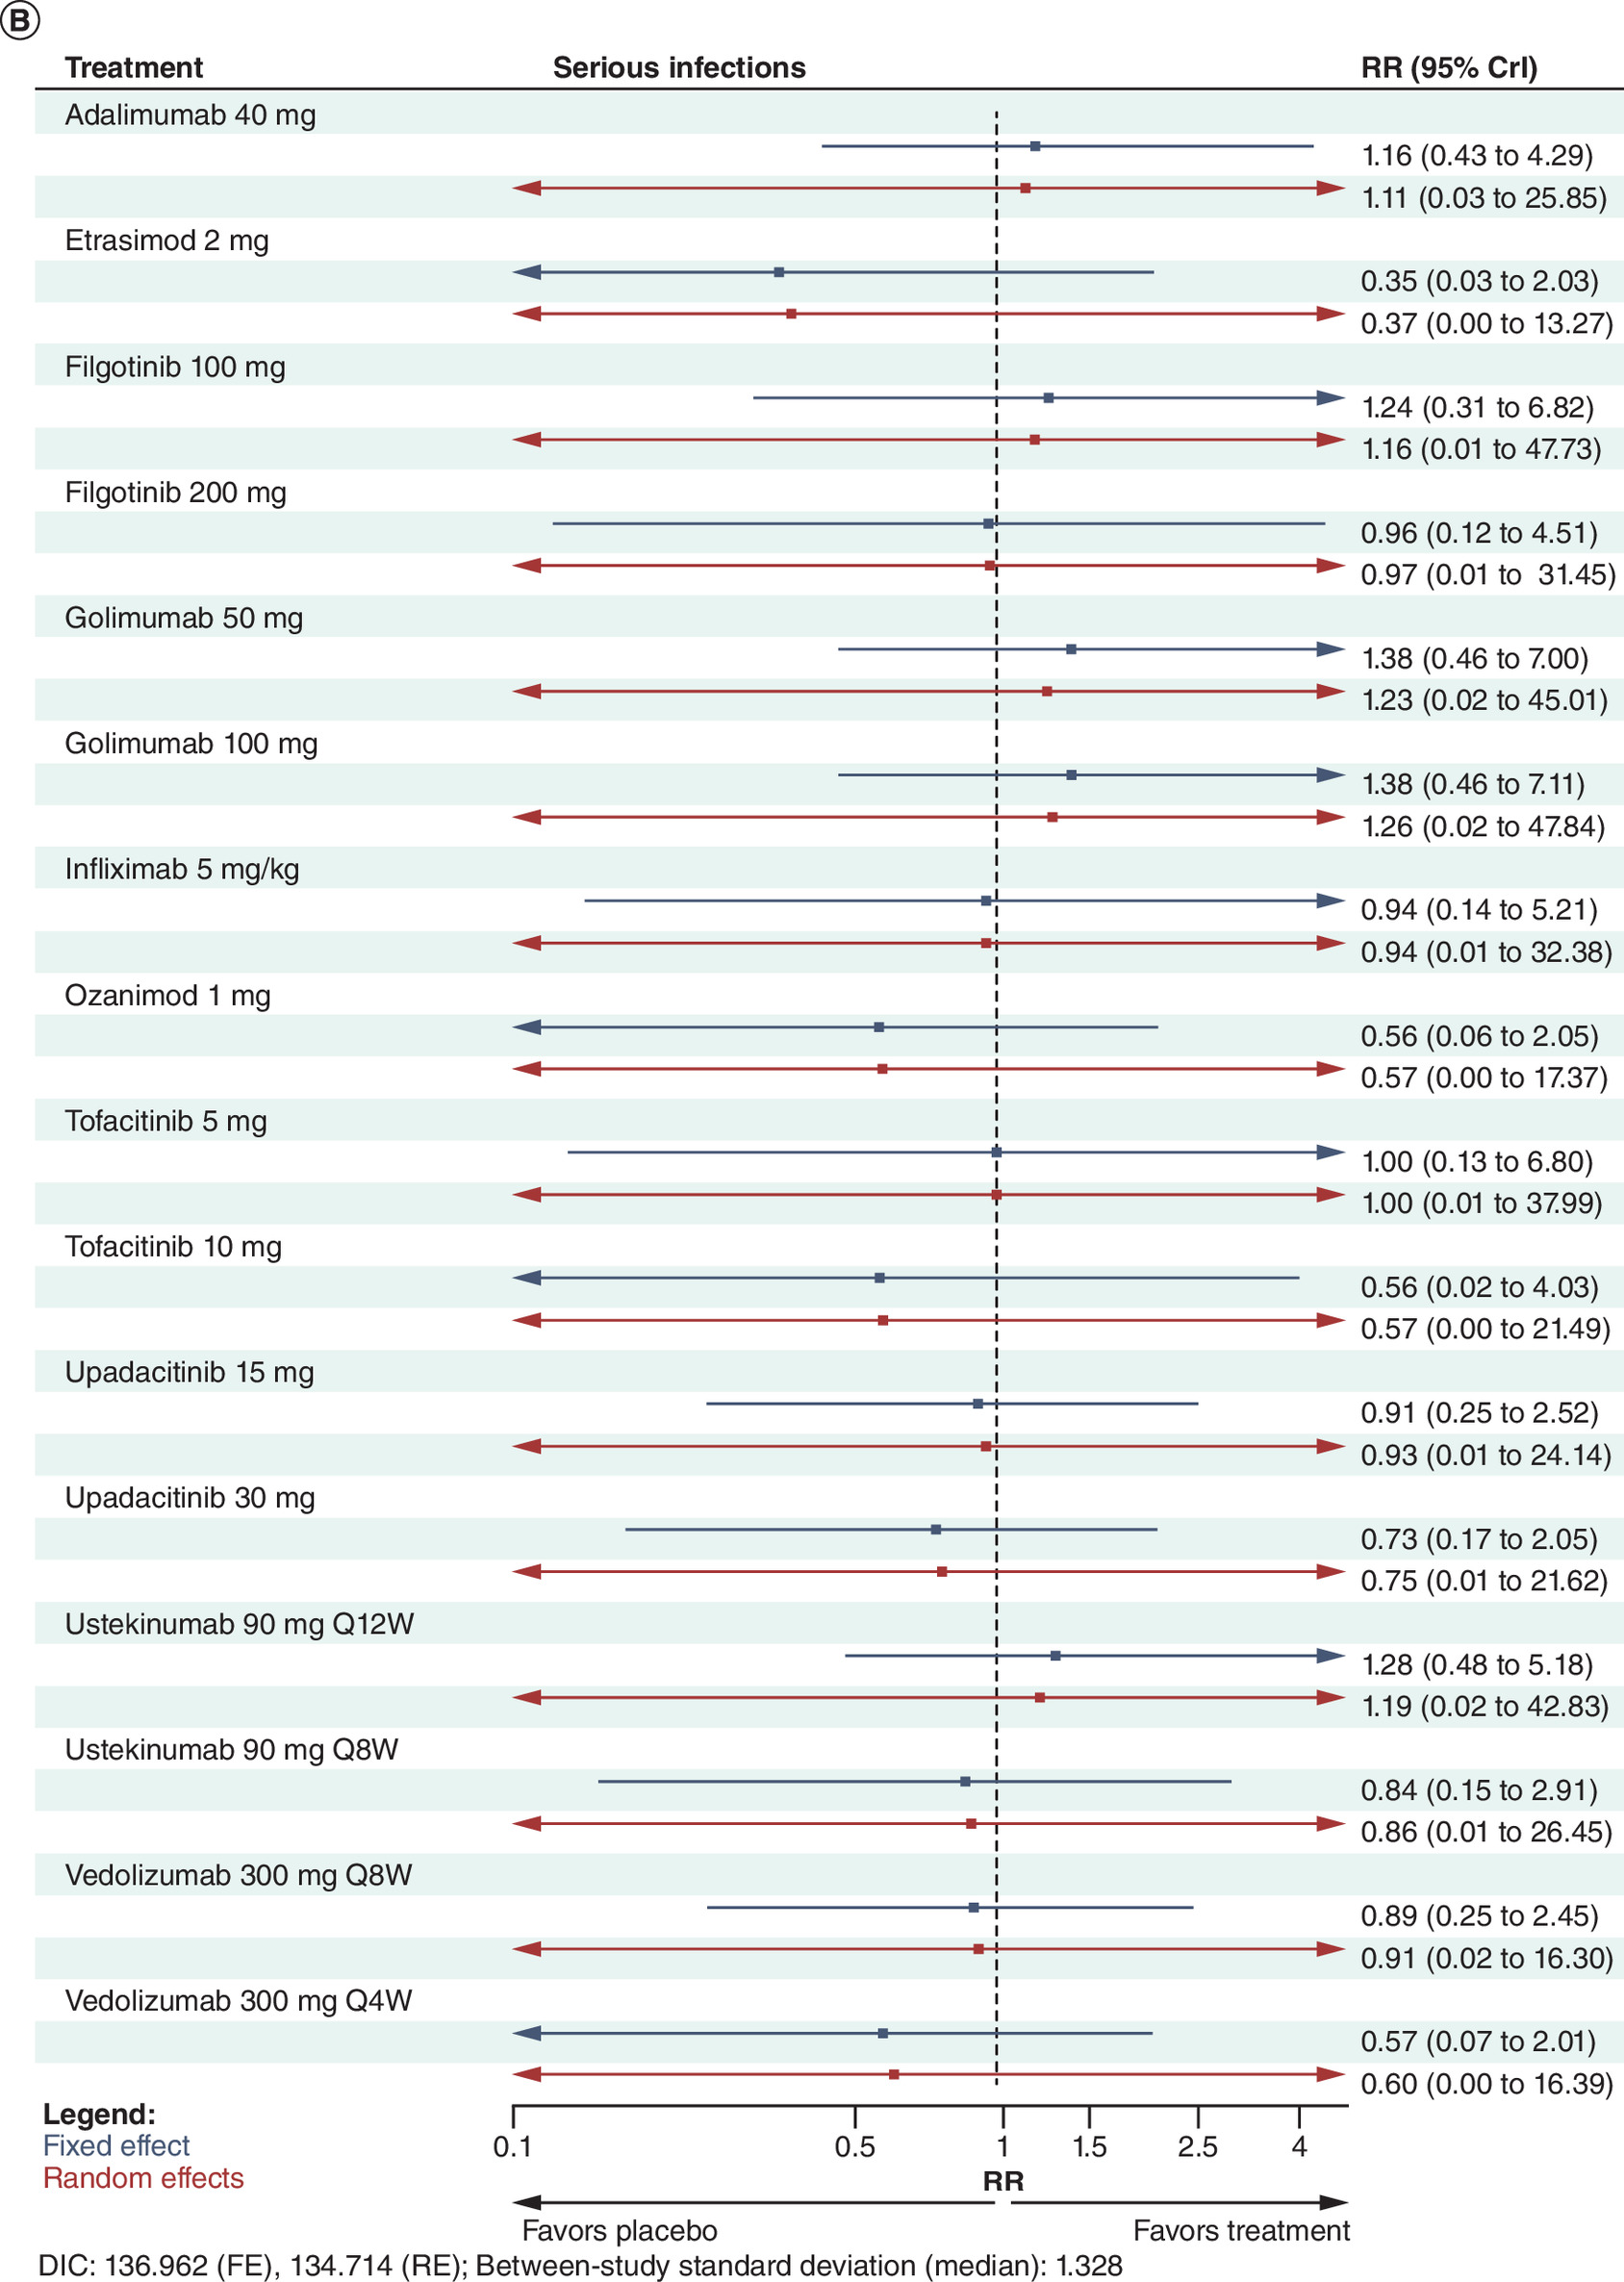
Figure 5. Forest plots showing the relative risk and 95% credible intervals between active treatments and placebo for serious infections over the induction and maintenance period.
(A) Induction period and (B) maintenance period using a Bayesian binomial model.
CrI: Credible interval; DIC: Deviance information criterion; FE: Fixed effect; RE: Random effect; RR: Relative risk.
Serious infections
Induction
The safety analysis of serious infections over the induction period included 16 trials (Supplementary Figure 63). There were few serious infection events reported across trials which led to large credible intervals. Three treatments, UST6, GOL200/100 and ADA160/80 had significantly fewer events compared with TOF10; GOL200/100 was also significant against OZN1 and PBO (Figure 5A). All other comparisons were not significant. ETS2 reported no serious infections, as did ADA160/80 for two of the three trials included.
Maintenance
For serious infections over the maintenance period, 11 trials contributed to the network (Supplementary Figure 63). There were no statistically significant treatment effects across the constellation of comparisons (Figure 5B).
Other safety outcomes
Over the maintenance period, there were 11 trials informing discontinuations due to AEs network, and 13 trials informing the serious AEs and overall AEs networks (Supplementary Figure 64).
There were few significant comparisons for the serious AEs outcome over the maintenance period. VDZ300Q8W and UPA30 had statistically fewer events compared with PBO, and were each borderline significant (Supplementary Material 8). IFX5, VDZ300Q8W, VDZ300Q4W, UPA15 and UPA30 were all also borderline significant against GOL100.
For the overall AEs outcome, VDZ108SC had significantly fewer events compared with ADA40, FIL200, GOL50, GOL100, OZN1, TOF10, UPA15, UPA30 and PBO (Supplementary Material 8). Other doses of VDZ also performed well against comparators. IFX5 and UST90Q12W also had several favorable significant comparisons with GOL50, GOL100, OZN1; UST90Q12W was also significant against FIL200 and TOF10.
There were several statistically significant comparisons between treatments for the discontinuations due to AEs outcome (Supplementary Material 8). UPA15, UTS90Q12W, UTS90Q8W, TOF5 and TOF10 had significantly fewer discontinuations due to AEs than PBO, FIL100, IFX5, GOL100 and ADA40. ADA40 had significantly more discontinuations due to AEs compared with PBO.
Discussion
This study provides updated comparative evidence from clinical trial data on treatments approved by the EMA and FDA, among patients with moderately to severely active UC in both the induction and maintenance periods. The study examined both efficacy and safety outcomes.
At the end of the induction period for the AT-naive population, several differences emerged between treatments for clinical response and clinical remission outcomes. ADA80/40 and FIL100 showed relatively weaker performance compared with other treatments, while UPA45 and IFX5 demonstrated more favorable efficacy. Similarly, in the AT-experienced population, ADA160/80 performed poorly compared with other treatments, whereas UPA45 and FIL200 outperformed several alternatives. Among induction phase responders, at the end of the maintenance phase for the AT-naive population efficacy analyses, there were some statistically significant differences between treatments, with TOF10, showing improved efficacy compared with several other treatments. For the AT-experienced population, fewer statistically significant differences were observed; however, UPA30 demonstrated favorable performance relative to other treatments. The sensitivity analyses largely aligned with the main findings. Where RE models converged, the limited number of studies informing many comparisons resulted in a greater reliance on prior distributions. This led to large uncertainty and wide credible intervals in some comparisons, that resulted in few statistically significant comparisons.
Other published NMAs have investigated the comparative effectiveness and safety between treatments for patients with moderately to severely active UC [8,9,19–28]. This study differs in scope to previous analyses, namely the inclusion of recently approved etrasimod, broad inclusion of treatment classes, and handling of study design differences (TT vs ReR trial outcomes). The analyses conducted in this study were generally consistent with the findings of Lasa, Olivera [29], Burr, Gracie [27], Panaccione, Collins [9] and Rokkas, Gisbert [26]. Lasa, Olivera [29], and Burr, Gracie [27] employed a frequentist NMA methodology, Panaccione, Collins [9] and Rokkas, Gisbert [26] adopted a similar Bayesian approach as this study [30]. Their findings broadly concurred with the outcomes of this investigation, irrespective of patients’ prior biologics exposure. Rokkas, Gisbert [26] conducted separate NMAs for the ReR and TT trials, respectively. Rokkas, Gisbert [26] found that for the clinical remission outcome, UPA30 was the most efficacious treatment of the ReR trials and ETS2 the most efficacious among TT trials which is consistent with the findings of this study. Another study examined the risk of serious infections between treatments, excluding etrasimod and upadacitinib for UC [31]. It found that the risk of serious infections was lower for VDZ compared with TNF antagonists which aligns with the results of this study although differences were not statistically significant.
This study has several strengths, including a thorough evaluation for potential sources of heterogeneity and choosing to include therapies most likely used in clinical practice by including only doses within the licensed range and avoiding the pooling of doses. Other strengths include the assessment of inconsistency and accounting for differences in trial design. Further, this study conducted extensive sensitivity analyses to assess the robustness of the analysis results to assumptions. While there are differences in trial design, i.e., TT versus ReR trials, this analysis applied an approach to align the outcomes from both trial types to mitigate this limitation of the trial design differences. The adjustment involved taking only those who responded in the induction period as the denominator for the maintenance period to mimic ReR trials. While the adjustment applied to TT trials aimed to align outcomes with ReR trials, it relies on assumptions that introduce potential limitations. Specifically, the calculation of clinical remitters in placebo arms of TT trials was based on an average proportion derived from ReR trials, which may not fully capture the variability in remission rates across individual studies. Furthermore, discrepancies arose between response and remission rates such as observed with ACT-1, underscore the challenges of synthesizing data across differing trial designs (Supplementary Material 3).
This study has several limitations. Due to sparse data, there are potential issues with precision. While we have attempted to overcome this issue by using a Bayesian approach and applying a continuity correction where required, it limits the interpretability of some analyses. In addition, the application of the responder randomization analysis that was applied to TT trials resulted in only 11 patients in the denominator of the placebo arm for ELEVATE UC 52 AT-experienced population, resulting in potentially unreliable comparisons with ETS in this analysis. Caution should be used when interpreting results of the AT-experienced maintenance analysis and should be interpreted with reference to the TT only analyses. The TT analyses were conducted to address this limitation, and the findings align with the anticipated outcomes from the phase III trial data.
Furthermore, maintenance phase analyses should also be interpreted with caution due to the potential concerns of treatment carryover effects from rerandomized trials, i.e., in the placebo arms over the maintenance period. The differences in the maintenance phase of the placebo arms are not only between TT trial placebo arms and ReR trial placebo arms, but also the differential carryover effects among different treatments of ReR trials. Additionally, the maintenance period of some ReR trials, e.g., TRUE NORTH & GEMINI 1, included patients from an open-label induction phase as well as a blinded induction period. It is well known that open-label trials generally have higher relative treatment effects than blinded trials [32]. Consequently, there may be a larger number of patients who achieve clinical response and who are eligible for the maintenance phase in some ReR trials that had an open-label induction trial contribute eligible patients.
A further limitation is that trials included in the analyses were conducted since 2002 and as a result, not all trials could stratify their results by all prior treatment types (for example by prior use of JAK inhibitors) since some treatment types were not approved at the time the trial was conducted. Therefore, in these analyses, efficacy was stratified by AT-naive and AT-experienced population, which groups patients with different numbers and types of prior therapy. Similarly, there were some small differences in the definition of outcomes, for example, the percentage reduction from baseline of the MCS in defining clinical response (Supplementary Material 2). These could potentially represent additional sources of heterogeneity within the analyses.
There were differences in outcome measurement scales (MMS vs MCS) with most studies using the MCS. Although there is reasonable consensus that MCS and MMS are strongly correlated and that the MMS is a reasonable proxy for the MCS [33], a sensitivity analysis was performed to assess the impact of using MMS versus MCS in the ELEVATE trials. It found no appreciable difference in the outcomes.
While there was a thorough assessment of heterogeneity conducted prior to the analyses, some residual unobserved heterogeneity might persist within the included studies, stemming from variations in methodologies, participant characteristics, definitions of outcomes or unmeasured variables.
Conclusion
The findings of this study were consistent with previously conducted NMAs of treatments for moderately to severely active UC. Over the induction period, ADA performed less favorably than other treatments for both efficacy outcomes. Treatments showed similar results across safety and tolerability outcomes. While most treatments demonstrated similar efficacy in the maintenance period, the results suggested TOF10 and UPA30 had favorable performance in the AT-naive and AT-experienced populations, respectively. The findings from this study provide updated evidence regarding the relative efficacy and safety of AT and can inform decision making in treatment choice for patients with moderately to severely active UC. Future research should include recently approved treatments.
Summary points
•
The aim of this study was to update the evidence on the relative efficacy and safety of treatments approved for moderate to severely active ulcerative colitis.
•
Bayesian network meta-analyses were conducted, and the analyses accounted for differences in trial designs by adjusting treat-through trial outcomes to mimic rerandomized trial outcomes.
•
Co-primary efficacy outcomes assessed were clinical response and clinical remission at the end of the induction phase and end of the maintenance phase.
•
Most treatments demonstrated similar efficacy in the maintenance period. Tofacitinib 10 mg and upadacitinib 30 mg had favorable performance in the advanced treatment-naive and advanced treatment experienced populations, respectively.
•
Over the induction period, adalimumab performed less favorably than other active treatments for both efficacy outcomes.
•
Upadacitinib 45 mg had higher rates of clinical response and clinical remission compared with most treatments in the induction phase.
•
The relative risk of serious infections were similar among treatments.
Author contributions
L Bartolome, K Wosik, D Gruben, JC Cappelleri, P Hur, TP Leahy and R Potluri were responsible for study conception and design; TP Leahy, R Potluri, P Hur and L Bartolome were responsible for the acquisition of data; TP Leahy was responsible for the data analysis and all authors contributed to the drafting and revision of the manuscript.
Financial disclosure
This work was sponsored by Pfizer Inc. The authors have received no other financial and/or material support for this research or the creation of this work apart from that disclosed.
Competing interests disclosure
V Jairath has received has received consulting/advisory board fees from AbbVie, Alimentiv, Arena pharmaceuticals, Asahi Kasei Pharma, Asieris, Astra Zeneca, Avoro Capital, Bristol Myers Squibb, Celltrion, Eli Lilly, Endpoint Health, Enthera, Ferring, Flagship Pioneering, Fresenius Kabi, Galapagos, Gilde Healthcare, GlaxoSmithKline, Genentech, Gilead, Innomar, JAMP, Janssen, Merck, Metacrine, Mylan, MRM Health, Pandion, Pendopharm, Pfizer, Protagonist, Prometheus Biosciences, Reistone Biopharma, Roche, Roivant, Sandoz, Second Genome, Sorriso, Synedgen, Takeda, TD Securities, Teva, Topivert, Ventyx, Vividion; speaker's fees from, Abbvie, Ferring, Bristol Myers Squibb, Galapagos, Janssen Pfizer Shire, Takeda, Fresenius Kabi. T Raine has received research/educational grants and/or speaker/consultation fees from Abbvie, Arena, Aslan, AstraZeneca, Boehringer-Ingelheim, BMS, Celgene, Eli Lilly, Ferring, Galapagos, Gilead, GSK, Heptares, LabGenius, Janssen, MonteRosa, Mylan, MSD, Novartis, Numab, Pfizer, Roche, Sandoz, Takeda, UCB and XAP therapeutics. TP Leahy and R Potluri are employees of Putnam Associates. TP Leahy is a stockholder of Pfizer Inc. K Wosik, D Gruben, JC Cappelleri, P Hur and L Bartolome are all employees and stockholders of Pfizer Inc. The authors have no other competing interests or relevant affiliations with any organization/entity with a financial interest in or financial conflict with the subject matter or materials discussed in the manuscript apart from those disclosed.
Writing disclosure
No writing assistance was utilized in the production of this manuscript.
Data availability statement
The data to support the findings of this study are available in corresponding publications as given in the article.
Open access
This work is licensed under the Attribution-NonCommercial-NoDerivatives 4.0 Unported License. To view a copy of this license, visit https://creativecommons.org/licenses/by-nc-nd/4.0/
Supplementary Material
File (supplementary material.doc)
- Download
- 3.15 MB
References
Papers of special note have been highlighted as: • of interest
1.
Jess T, Gamborg M, Munkholm P, Sørensen TI. Overall and cause-specific mortality in ulcerative colitis: meta-analysis of population-based inception cohort studies. Am. J. Gastroenterol. 102(3), 609–617 (2007).
2.
Adams S, Bornemann P. Ulcerative colitis. Am. Fam. Physician 15(10), 699–705 (2013).
3.
National Institute for Health and Care Excellence. NICE Process and Methods Guides. Methods for the Development of NICE Public Health Guidance. National Institute for Health and Care Excellence (NICE), Royston, UK (2012).
4.
Page MJ, McKenzie JE, Bossuyt PM et al. The PRISMA 2020 statement: an updated guideline for reporting systematic reviews. Brit. Med. J. 372, n71 (2021).
5.
National Institute for Health and Care Excellence. Process and methods [PMG6]: The Guidelines Nanual. National Institute for Health and Care Excellence (NICE), Royston, UK (2012).
6.
Schroeder KW, Tremaine WJ, Ilstrup DM. Coated oral 5-aminosalicylic acid therapy for mildly to moderately active ulcerative colitis. N. Engl. J. Med. 317(26), 1625–1629 (1987).
7.
National Institute for Health and Care Excellence. Technology appraisal guidance [TA547]: tofacitinib for previously treated active ulcerative colitis. National Institute for Health and Care Excellence (NICE), Royston, UK (2018).
8.
Lu X, Jarrett J, Sadler S et al. Comparative efficacy of advanced treatments in biologic-naïve or biologic-experienced patients with ulcerative colitis: a systematic review and network meta-analysis. Int. J. Clin. Pharm. 45(2), 330–341 (2023).
9.
Panaccione R, Collins EB, Melmed GY et al. Efficacy and safety of advanced therapies for moderately to severely active ulcerative colitis at induction and maintenance: an indirect treatment comparison using Bayesian network meta-analysis. Crohns Colitis 360 5(2), otad009 (2023).
• Study reports results of Bayesian network meta-analyses excluding etrasimod and reports similar conclusions.
10.
Lunn D, Thomas A, Best N, Spiegelhalter D. WinBUGS – a Bayesian modeling framework: concepts, structure and extensibility. Stat. Comput. 10, 325–337 (2000).
11.
Jairath V, Zou GY, Parker CE et al. Placebo response and remission rates in randomised trials of induction and maintenance therapy for ulcerative colitis. Cochrane Database Syst. Rev. 9(9), Cd011572 (2017).
• Evaluates placebo response and remission rates in ulcerative colities trials.
12.
Gelman A, Rubin D. Inference from iterative simulation using multiple sequences. Stat. Sci. 7(4), 457–472 (1992).
13.
Higgins JP, Thomas J, Chandler J et al. Cochrane Handbook for Systematic Reviews of Interventions. John Wiley & Sons (2019).
14.
Daly C, Downing BC, Welton NJ. A practical guide to inconsistency checks in Bayesian network meta-analysis. (2022). Available from: https://www.bristol.ac.uk/media-library/sites/social-community-medicine/documents/mpes/Guide%20to%20Checking%20for%20Inconsistency%20in%20NMA_TSU.pdf
15.
European Medicines Agency. Humira: EPAR – Product Information Amsterdam, Netherlands. (2024). Available from: https://www.ema.europa.eu/en/documents/product-information/humira-epar-product-information_en.pdf
16.
European Medicines Agency. Jyseleca: EPAR – Product Information Amsterdam, Netherlands. (2024). Available from: https://www.ema.europa.eu/en/documents/product-information/jyseleca-epar-product-information_en.pdf
17.
European Medicines Agency. Xeljanz: EPAR – Product Information Amsterdam, Netherlands. (2025). Available from: https://www.ema.europa.eu/en/documents/product-information/xeljanz-epar-product-information_en.pdf
18.
European Medicines Agency. Rinvoq: EPAR – Product Information Amsterdam, Netherlands. (2025). Available from: https://www.ema.europa.eu/en/documents/product-information/rinvoq-epar-product-information_en.pdf
19.
Moćko P, Kawalec P, Pilc A. Safety profile of biologic drugs in the therapy of ulcerative colitis: a systematic review and network meta-analysis. Pharmacotherapy 36(8), 870–879 (2016).
20.
Stidham RW, Lee TC, Higgins PD et al. Systematic review with network meta-analysis: the efficacy of anti-tumour necrosis factor-alpha agents for the treatment of ulcerative colitis. Aliment. Pharmacol. Ther. 39(7), 660–671 (2014).
21.
Lohan C, Diamantopoulos A, LeReun C et al. Tofacitinib for the treatment of moderately to severely active ulcerative colitis: a systematic review, network meta-analysis and economic evaluation. BMJ Open Gastroenterol. 6(1), e000302 (2019).
22.
Trigo-Vicente C, Gimeno-Ballester V, García-López S, López-Del Val A. Systematic review and network meta-analysis of treatment for moderate-to-severe ulcerative colitis. Int. J. Clin. Pharm. 40(6), 1411–1419 (2018).
23.
Li Y, Yao C, Xiong Q et al. Network meta-analysis on efficacy and safety of different Janus kinase inhibitors for ulcerative colitis. J. Clin. Pharm. Ther. 47(7), 851–859 (2022).
24.
Welty M, Mesana L, Padhiar A et al. Efficacy of ustekinumab vs. advanced therapies for the treatment of moderately to severely active ulcerative colitis: a systematic review and network meta-analysis. Curr. Med. Res. Opin. 36(4), 595–606 (2020).
25.
Thorlund K, Druyts E, Toor K, Mills EJ. Comparative efficacy of golimumab, infliximab, and adalimumab for moderately to severely active ulcerative colitis: a network meta-analysis accounting for differences in trial designs. Expert Rev. Gastroenterol. Hepatol. 9(5), 693–700 (2015).
26.
Rokkas T, Gisbert JP, Ekmektzoglou K et al. Comparative maintenance performance of all biologic agents and small molecules in ulcerative colitis: a network meta-analysis. Eur. J. Gastroenterol. Hepatol. 36(5), 520–533 (2024).
27.
Burr NE, Gracie DJ, Black CJ, Ford AC. Efficacy of biological therapies and small molecules in moderate to severe ulcerative colitis: systematic review and network meta-analysis. Gut 71(10), 1976–1987 (2022).
28.
Ananthakrishnan AN, Murad MH, Scott FI et al. Comparative efficacy of advanced therapies for management of moderate-to-severe ulcerative colitis: 2024 American Gastroenterological Association Evidence Synthesis. Gastroenterology 167(7), 1460–1482 (2024).
29.
Lasa JS, Olivera PA, Danese S, Peyrin-Biroulet L. Efficacy and safety of biologics and small molecule drugs for patients with moderate-to-severe ulcerative colitis: a systematic review and network meta-analysis. Lancet Gastroenterol. Hepatol. 7(2), 161–170 (2022).
30.
Dias S, Welton NJ, Sutton AJ, Ades A. NICE DSU technical support document 2: a generalised linear modelling framework for pairwise and network meta-analysis of randomised controlled trials. National Institute for Health and Care Excellence (NICE), Royston, UK (2011).
• National Institute for Health and Care Excellence guidelines for the development of meta-analyses. Provides a comprehensive overview of methods.
31.
Solitano V, Facciorusso A, Jess T et al. Comparative risk of serious infections with biologic agents and oral small molecules in inflammatory bowel diseases: a systematic review and meta-analysis. Clin. Gastroenterol. Hepatol. 21(4), 907–921.e2 (2023).
32.
Beyer-Westendorf J, Büller H. External and internal validity of open label or double-blind trials in oral anticoagulation: better, worse or just different? J. Thromb. Haemost. 9(11), 2153–2158 (2011).
33.
Naegeli AN, Hunter T, Dong Y et al. Full, partial, and modified permutations of the Mayo Score: characterizing clinical and patient-reported outcomes in ulcerative colitis patients. Crohns Colitis 360 3(1), otab007 (2021).
Information & Authors
Information
Published In
Copyright
© 2025 The authors. This work is licensed under the Attribution-NonCommercial-NoDerivatives 4.0 Unported License
History
Received: 28 November 2024
Accepted: 27 February 2025
Published online: 17 March 2025
Keywords:
Topics
Authors
Metrics & Citations
Metrics
Article Usage
Article usage data only available from February 2023. Historical article usage data, showing the number of article downloads, is available upon request.
Citations
How to Cite
Efficacy and safety of advanced therapies for moderately to severely active ulcerative colitis in induction and maintenance: systematic literature review and Bayesian network meta-analysis. (2025) Journal of Comparative Effectiveness Research. DOI: 10.57264/cer-2024-0225
Export citation
Select the citation format you wish to export for this article or chapter.
Citing Literature
- Giacinto Libertini, Graziamaria Corbi, Valeria Conti, Nicola Ferrara, Assessment of Causes and Potential Prevention and Therapy for Autoimmune Diseases Through Evolutionary Medicine, Journal of Gerontology and Geriatrics, 10.3390/jgg74030019, 74, 3, (19), (2026).
- Carlos R. Montes-de-Oca-Saucedo, Bruno Briceño-Villardaga, Sebastián R. Fuentes-Salinas, Adolfo Soto-Domínguez, Extraction Matrix Shapes the Efficacy of Gegen Qinlian Decoction in DSS-Induced Colitis: A Preclinical Systematic Review and Meta-Analysis, Pharmaceuticals, 10.3390/ph19020277, 19, 2, (277), (2026).
- Muhammad Umar Ahsan, Syeda Laiba Sajid, Rahul Balach, Muhammad Daniyal, Noor Ul Ain, Muhammad Mudasir, Emerging role of Janus kinase inhibitors in ulcerative colitis management, World Journal of Gastrointestinal Pharmacology and Therapeutics, 10.4292/wjgpt.v16.i4.110472, 16, 4, (2025).
- Iago Rodríguez-Lago, Fernando Muñoz Núñez, Alfredo J. Lucendo, Alfonso De Lossada Juste, Ana Cabez, Alberto de la Cuadra-Grande, Itziar Oyagüez, Emilio Monte-Boquet, Cost-Effectiveness Analysis of Etrasimod Compared With Biologic Therapies for the Treatment of Patients with Moderately-to-Severely Active Ulcerative Colitis in Spain, PharmacoEconomics - Open, 10.1007/s41669-025-00619-6, 10, 1, (121-142), (2025).
- Natalie Shields, Michael Colwill, Valentina Raspa, Yaw Twum-Danso, Andrew Poullis, Kamal Patel, Sailish Honap, Sphingosine-1-Phosphate (S1P) Receptor Modulators for the Treatment of Inflammatory Bowel Disease (IBD): Mechanisms, Clinical Evidence, and Practical Insights, Biomedicines, 10.3390/biomedicines13112655, 13, 11, (2655), (2025).
- Jay Pravda, Ulcerative colitis: Timeline to a cure, World Journal of Gastroenterology, 10.3748/wjg.v31.i26.108375, 31, 26, (2025).
- Xin Yi Choon, Jie Han Yeo, Christopher White, Esha Sharma, Mark A. Samaan, The Current Sphingosine 1 Phosphate Receptor Modulators in the Management of Ulcerative Colitis, Journal of Clinical Medicine, 10.3390/jcm14103475, 14, 10, (3475), (2025).