Identification of treatment effect modifiers and prognostic factors in newly diagnosed and relapsed or refractory multiple myeloma
Publication: Journal of Comparative Effectiveness Research
Abstract
Aim: We aimed to identify variables that affect the prognosis and treatment effect in multiple myeloma (MM). Materials & methods: Published literature of randomized controlled trials (RCTs) and population-adjusted indirect comparisons (PAICs) in newly diagnosed (ND) and relapsed/refractory (RR) MM populations reporting overall survival (OS) and progression-free survival (PFS) were identified. Possible treatment effect modifiers (TEMs) were evaluated based on the ratio between effect estimates of different strata within subgroups for OS and PFS among eligible RCTs. Potential prognostic factors (PFs) were identified using the lists of covariates adjusted for in PAICs meeting the eligibility criteria. Results: Sixty-five RCTs and 59 PAICs were included for synthesis. In ND-MM and RR-MM patients, age, sex, International Staging System stage, and cytogenetics were identified as potential TEMs for PFS based on data from published RCTs. Refractory disease, prior therapy exposure status and creatinine clearance were additional TEMs for PFS in RR-MM patients. Eastern Cooperative Oncology Group performance score and creatinine clearance were TEM candidates of PFS for ND-MM stem-cell transplant-ineligible patients. No consistent TEMs for OS were identified across all MM populations. Commonly adjusted variables for both OS and PFS in published PAICs of all populations aligned with potential TEMs of PFS identified in published RCTs. Additionally, subtype of MM, time since diagnosis and extramedullary disease or presence of plasmacytoma were common variables for adjustment in PAICs evaluating RR-MM. Frequency of each variable adjusted for differs by population and outcome. Only one PAIC reported TEMs separately from PFs. Conclusion: TEMs and PFs identified herein can help inform future clinical trial design and serve as a primer when conducting PAICs evaluating OS and PFS in ND/RR-MM.
Plain language summary: identification of patient characteristics that affect treatment effectiveness in multiple myeloma
What is this article about?
Multiple myeloma (MM) is a cancer of the blood that has remained an incurable disease. Rapid technological advances have introduced numerous new therapeutic classes that improve survival. Randomized controlled trials (RCTs) are the gold standard study. However, complex treatment landscapes can pose practical challenges in directly comparing the effectiveness of novel regimens against all available standard of care drug regimens in head-to-head clinical trials. In the absence of head-to-head RCT data, indirect treatment comparison (ITC) is another way to compare the relative effectiveness of alternative treatments that have been studied in separate clinical trials. Prior to conducting RCTs and ITCs, patient characteristics that may affect outcomes or influence the magnitude of the treatment effect should be identified. Reviews of publications across multiple MM populations were conducted to identify such patient characteristics.
What were the results?
Ten characteristics related to patient demographics, disease severity, prior therapy exposure and laboratory values were considered likely to influence treatment effectiveness across different MM populations.
Why is this important?
Results from this research can help inform future ITCs and clinical trials in MM.
Multiple myeloma (MM) is a hematological cancer resulting in the overproduction of abnormal monoclonal protein by malignant plasma cells [1]. Globally, MM accounts for approximately 1.8% of all cancers, and overall incidences have been increasing from 160,000 [2] in 2018 to 187,952 [3] in 2022. Although rates of mortality involving MM have improved since the introduction of targeted therapies over the past 20 years, MM remains an incurable disease with an overall 5-year relative survival rate of 62.4% [4].
Several treatments focused on increasing response rates, and prolonging progression-free survival (PFS) and overall survival (OS) are available. Therapeutic options recommended by the National Comprehensive Cancer Network (NCCN), the European Hematology Association (EHA) and European Society for Medical Oncology (ESMO) vary depending on whether patients are newly diagnosed (ND) and hematopoietic stem-cell transplant eligible (TE) or ineligible (TIE), or are relapsed or refractory (RR) and have received at least 1 prior treatment regimen (1PL) or have been triple-class exposed (TCE) to proteasome inhibitors (PIs), immunomodulatory drug (IMiD) and anti-CD38 monoclonal antibodies (mAbs) [1,5–7]. While regimens consisting of these three main treatment classes have remained the preferred therapy, rapid technological advances have introduced other novel therapeutic classes such as chimeric antigen T-cell therapies, bispecific antibodies, monoclonal antibody-drug conjugates, peptide-drug conjugates and selective inhibitors of nuclear compounds within the past 5 years into the MM treatment landscape, increasing the complexities in healthcare decision-making [1,5,6,8].
Randomized controlled trials (RCTs) evaluating direct or head-to-head treatment comparisons are considered the highest quality of evidence to inform MM treatment guidelines. However, it is not feasible to conduct head-to-head comparisons for all relevant therapies in RCTs, particularly in MM where multiple drug regimens are preferred. In the absence of such RCTs, indirect treatment comparisons (ITCs) can serve as a valuable resource to provide insights into comparative clinical-effectiveness versus existing therapy options [9].
Validity of traditional unadjusted ITC estimates rely on the assumption that populations for comparison have homogenous distributions of outcome-influencing covariates [10]. Such covariates can be either treatment effect modifiers (TEMs) that affect the effectiveness of a treatment on an outcome, or prognostic factors (PFs) that affect outcomes regardless of intervention [11]. In cases where imbalances in TEMs or PFs exist, traditional unadjusted ITCs, such as Bucher's or network meta-analyses that rely strictly on aggregate-level data, may yield inaccurate estimates and thus threaten external validity [11,12]. When individual patient data (IPD) are available, population-adjusted indirect comparisons (PAICs), such as matching-adjusted indirect comparisons (MAICs) [11,13,14], propensity score matching (PSMs) [15], and inverse probability of treatment weighting (IPTW) [16], or multi-level meta-regression (ML-NMR) [17] can be leveraged. Depending on whether the PAIC is anchored by a common comparator arm or unanchored, TEMs and/or PFs must be accounted for to reduce confounding and selection biases in comparative estimates [11,13,14]. Thus, it is crucial to ensure TEMs and PFs are accurately identified, and the method of selecting them should be clearly described and transparent to facilitate external validation.
To date, limited details on the process for selecting appropriate TEMs or PFs have been reported [18,19]. Additionally, of the few publications synthesizing TEMs and PFs in MM populations available [20,21], none included assessments in patients with NDMM. More recently, at the time when this manuscript was under peer review, Kumar et al. [22] reviewed PFs in RRMM based on a physician panel following a systematic literature review. However, this review had not included NDMM populations or assessed TEM. Hence, the objective of this study was to identify and determine key baseline covariates that are potentially TEMs or PFs for OS or PFS in patients with NDMM and RRMM.
Materials & methods
Literature searches, study selection & data extraction
Literature reviews were conducted during April and October 2023 to identify RCTs and PAICs, respectively. Real-world evidence or observational studies were ineligible because unlike RCTs, the causal effect of treatments on outcomes cannot be isolated from potential influences of confounding factors. ITC methods which do not adjust for population characteristics were ineligible because they would not have adjusted for covariates that are considered potential TEMs or PFs. Populations of interest were selected to align with patient categories delineated in NCCN and ESMO treatment management guidelines, which include NDMM TE or TIE, RRMM 1PL or TCE [6,7]. Outcomes of interest were OS and PFS. Searches of RCTs were performed in PubMed® (inclusive of MEDLINE®, PubMed Central® and Bookshelf citation archives [23]) while searches of PAICs were performed within the Ovid® platform and included the following electronic databases: Embase, Ovid MEDLINE® (including Epub ahead of print and In-process and other non-index citations), Ovid MEDLINE® Daily and Cochrane Database of Systematic Reviews. Search strategies utilized a combination of controlled vocabulary (e.g., ‘multiple myeloma’) and keywords (e.g., ‘RRMM’) (Supplementary Table 1). Vocabulary and syntax were adjusted across databases. For all searches, language was restricted to English. Abstracts from conference proceedings identified from the literature searches of RCTs were also included. All search strategies were generated utilizing the Population, Intervention, Comparator, and Study Design (PICOS) elements (Supplementary Tables 2 & 3).
Additional searches of RCTs were conducted in ClinicalTrials.gov, websites for key conferences (i.e., American Society of Clinical Oncology, American Society of Hematology and EHA), regulatory authorities (US FDA and EMA) and press releases from drug manufacturers, as well as reference lists of included reviews, while additional searches of PAICs were conducted in key health technology assessment (HTA) authorities: Canada’s Drug Agency (CDA, formerly known as Canadian Agency for Drugs and Technologies in Health [CADTH]), National Institute for Health and Care Excellence (NICE) and Federal Joint Committee (GBA).
After the literature search and removal of duplicate citations using EndNote (Version 20.1 and 20.4; Clarivate, EndNote, AZ, USA) or Microsoft Excel® (Microsoft Corporation, WA, USA), eligible records were selected for inclusion through a two-step process in Microsoft Excel. Citations were screened initially at the title and abstract level, then assessed for eligibility using retrieved full-text reports. At least two reviewers independently screened all citations, and discrepancies were resolved through consensus or a third independent reviewer. Implementation and reporting of the literature review was conducted in accordance with the Preferred Reporting Items for Systematic Literature Reviews and Meta-Analyses (PRISMA) statement [24,25]. Additional details on literature review methods are provided in Supplementary Appendix A.
Relevant data from citations meeting eligibility criteria were extracted. Data extraction was performed by multiple reviewers using a specialized electronic data extraction spreadsheet developed in Microsoft Excel. Data of interest from eligible RCTs included: the trial name, patient eligibility criteria, interventions details, stratum of subgroup analyses (e.g., strata of ≤60 and >60 years for the covariate of age) reported, sample size per stratum and treatment arm, as well as hazard ratios (HRs) and 95% CIs illustrating relative effects of the investigational treatment versus control on OS or PFS within the intention-to-treat subgroup stratification. For eligible PAICs, the following data were extracted: MM population, trials and treatments compared, type of PAICs (e.g., IPTW, PSM, MAIC, etc.), type of analysis based on the presence or absence of a common comparator in the network of treatments (e.g., either anchored or unanchored, respectively), covariates used for population-adjustment in either the base-case or sensitivity analysis and the method(s) leveraged to select them, covariates strata and survival outcomes analyzed (i.e., OS, PFS or both). Additionally, rankings of covariates based on expected clinical importance for adjustment informed by clinical expert consultations were extracted from published PAICs if available.
Prognostic factor & treatment effect modifier determination
Using HRs and CIs extracted from subgroup analyses reported in RCTs, the likelihood that a covariate is a TEM for OS or PFS was assessed. List of covariates identified in PAICs were then leveraged to validate findings from the TEM assessment and identify candidate PFs.
Initially, subgroup analyses that are expected to maximize the sensitivity and specificity of assessments were selected. For each covariate, two extracted strata were chosen to represent the reference and comparator. The stratum with the largest sample size was chosen as the reference stratum, while the stratum with the largest difference in HR to the reference stratum was considered the comparator stratum. Additionally, multiple reference and comparator pairs were selected if subgroup analyses were available for more than one stratification factor. For example, within the covariate of cytogenetic risk, strata for presence or absence of deletion in all or part of the short arm of chromosome 17 (del 17p) were grouped separately from strata for presence or absence of translocations involving chromosomes 14 and 16 (t [14,16]).
Subsequently, whether a covariate is possibly a TEM was assessed. A covariate was considered as a potential TEM based on 80% CI (equivalent to p < 0.2) of the ratio between HRs of treatment effect from the comparator and reference strata of a subgroup analysis [26]. The 80% CI (p < 0.2) was used as the minimum threshold because subgroup analyses in RCTs were generally underpowered to detect differences at significant level of 0.05. In addition, the 80% CI was previously used to select potential TEMs in the literature [27].
Evidence of potential TEMs was aggregated by trials and tallied across each covariate. For trials that reported multiple subgroup analyses for a covariate, either by different stratification factors (i.e., presence or absence of del 17p or t [14,16]), or timepoints (i.e., primary or final survival analysis), and TEM assessments differed between analyses of different stratifications or timepoints, only one analysis suggesting the covariate is a potential TEM was included to avoid double-counting the number of trials. The proportions of trials supporting a covariate as potential TEM was summarized. A covariate was considered as a ‘likely’ TEM if it was supported by at least three unique RCTs.
Finally, PAICs were reviewed to validate findings from the TEM assessment and identify PFs. According to methodological guidance, all potential TEMs must be adjusted for in anchored analyses, and all potential TEMs and PFs must be adjusted for in unanchored analyses [14,28]. Potential TEMs were discerned from potential PFs under the assumption that the selection of covariates for adjustment in identified PAICs adhered to this guidance. Thus, covariates identified in both anchored and unanchored PAICs in the current study were considered potential TEMs, while those identified in only unanchored PAICs were considered potential PFs. Reported data on covariate selection and/or rankings based on clinical expert opinion were documented from each PAIC.
Results
Treatment effect modifiers identified from RCTs
A total 1895 records were identified from databases, registries and various other sources. After excluding 1739 records that did not meet the prespecified PICOS criteria (Supplementary Table 2), a total of 156 unique records reporting subgroup analyses were reviewed. From the review, 88 unique records and 65 unique RCTs were included in the assessment of TEMs (Figure 1). Of these, 36 RCTs were in NDMM, including 15 in TE and 21 in TIE, while 29 RCTs were in RRMM 1PL (Supplementary Table 4). No RCTs in RRMM TCE reported subgroup analyses of OS and PFS.
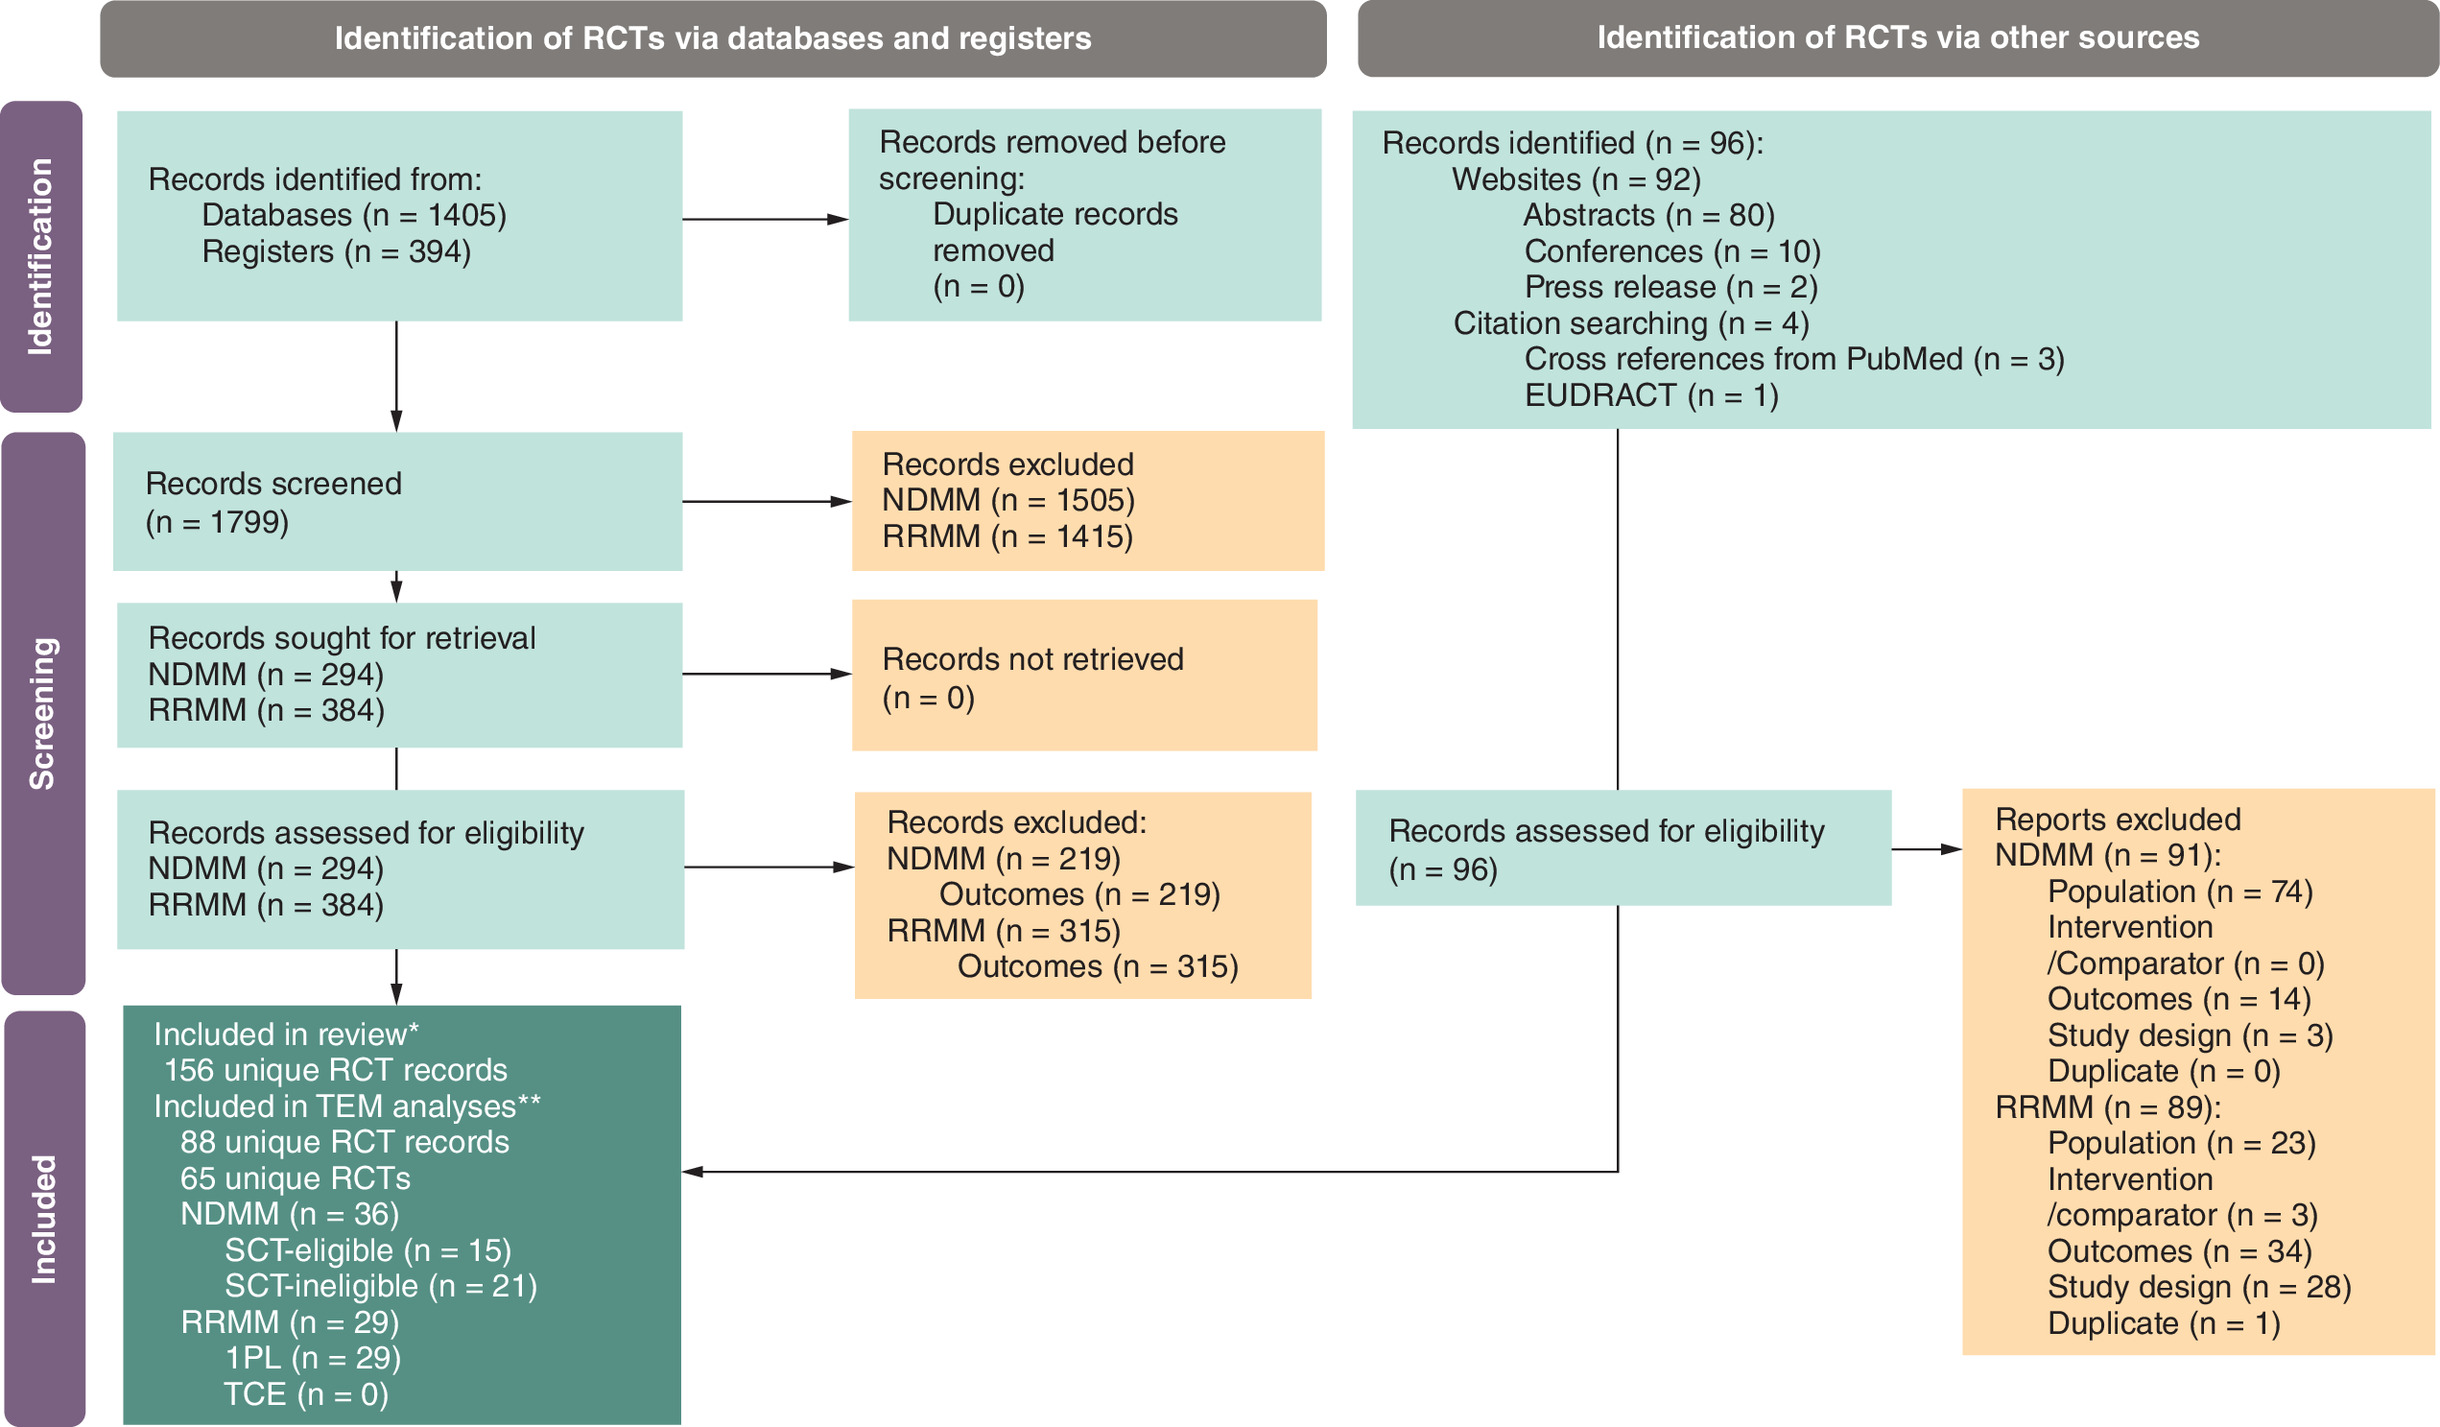
Figure 1. PRISMA diagram – literature review of randomized controlled trials.
*Refers to citations reporting any subgroup analyses for outcomes of interest in eligible populations.
**Refers to citations reporting analyses of subgroups by baseline factors for outcomes of interest in eligible populations.
EUDRACT: European Union Drug Regulating Authorities Clinical Trial; NDMM: Newly diagnosed multiple myeloma; PRSIMA: Preferred Reporting Items for Systematic reviews and Meta-Analyses; RCT: Randomized controlled trial; RRMM: Relapsed and refractory multiple myeloma.
NDMM TE
Of the 15 included RCTs of NDMM TE with subgroup analyses, six reported effect estimates for OS and all 15 reported estimates for PFS.
Subgroup analyses of OS were available for 11 covariates related to patient demographics (age, sex and race), disease characteristics (Eastern Cooperative Oncology Group [ECOG] Performance Status [PS], International Staging System [ISS]/revised-ISS [r-ISS] stage, cytogenetic risk and type of MM), baseline laboratory values (hemoglobulin, lactate dehydrogenase [LDH] and plasma cells) and other patient characteristics (BMI) (Table 1). None of these covariates met the criteria to be considered likely TEMs (Table 1).
| Covariate category | Covariate | Number of RCTs suggesting covariate is potentially a TEM with ≥80% confidence over number of RCTs reporting subgroup analyses for covariate | |||||
|---|---|---|---|---|---|---|---|
| NDMM TE | NDMM TIE | RRMM 1PL | |||||
| OS (n = 6) | PFS (n = 15) | OS (n = 10) | PFS (n = 18) | OS (n = 16) | PFS (n = 26) | ||
| Population demographics | Age | 2/5 | 5/12 | 1/6 | 4/11 | 3/10 | 5/20 |
| Sex | 1/4 | 3/9 | 1/4 | 3/11 | 2/6 | 3/10 | |
| Race | 0/1 | 0/1 | 1/3 | 1/5 | 2/3 | 2/10 | |
| Region | – | – | 1/3 | 0/7 | 3/5 | 5/8 | |
| Disease characteristics | ECOG PS | 0/1 | 1/4 | 0/2 | 4/9 | 1/6 | 2/10 |
| ISS/r-ISS stage | 2/5 | 5/13 | 0/4 | 3/11 | 3/8 | 5/18 | |
| Cytogenetic risk | 1/6 | 8/14 | 3/8 | 6/16 | 4/10 | 5/26 | |
| EMD/plasmacytomas | – | – | – | – | 0/1 | 1/1 | |
| Time since diagnosis | – | – | – | – | – | 1/1 | |
| Type of MM | 1/1 | 1/3 | 1/1 | 1/4 | 0/1 | 1/5 | |
| Prior treatment history | Prior LOTs (n) | – | – | – | – | 2/9 | 4/17 |
| Prior line status (i.e., refractory or relapsed to prior line) | – | – | – | – | 1/5 | 1/8 | |
| Prior PI | – | – | – | – | 1/6 | 2/13 | |
| Prior IMiD | – | – | – | – | 1/6 | 3/12 | |
| Prior SCT | – | – | – | – | 2/5 | 2/12 | |
| Refractory status | – | – | – | – | 2/3 | 1/4 | |
| Refractory to PI | – | – | – | – | 0/1 | 1/8 | |
| Refractory to IMiD | – | – | – | – | 1/3 | 5/13 | |
| Laboratory values | Albumin | – | – | 0/2 | 0/2 | – | – |
| β-2 microglobulin | – | – | 2/2 | 1/3 | 0/1 | 0/1 | |
| Creatinine clearance | – | 1/2 | 2/4 | 5/10 | 2/4 | 4/12 | |
| Hemoglobin | 0/1 | 0/2 | – | – | – | – | |
| Hepatic function | – | 0/1 | 0/1 | 1/2 | 0/1 | 1/4 | |
| LDH | 0/1 | 0/4 | 1/2 | 2/3 | – | 0/1 | |
| Plasma cells | 0/1 | 0/2 | – | – | – | – | |
| Platelets | – | 0/1 | – | – | – | – | |
| Renal function | – | – | – | – | 0/2 | – | |
| Other | BMI | 0/1 | 1/1 | – | – | – | 0/1 |
| BPI | – | – | – | 0/1 | – | – | |
| Frailty | – | – | 0/1 | 2/2 | – | 0/1 | |
Values in bold indicated the associated covariate was considered a ‘likely’ TEM as evidence of TEM at p < 0.2 was identified in at least three unique RCTs.
1PL: One or more prior line; BPI: Brief pain inventory; ECOG PS: Eastern Cooperative Oncology Group performance score; EMD: Extramedullary disease; IMiD: Immunomodulatory drug; ISS: International Staging System; LDH: Lactate dehydrogenase; LOT: Line of therapy; MM: Multiple myeloma; NDMM: Newly diagnosed multiple myeloma; OS: Overall survival; PFS: Progression-free survival; PI: Proteasome inhibitor; RCT: Randomized controlled trial; r-ISS: Revised International Staging System; RRMM: Relapsed/refractory multiple myeloma; SCT: Stem-cell transplant; TEM: Treatment effect modifier; TE: Transplant-eligible; TIE: Transplant-ineligible.
Subgroup analyses of PFS were available for 14 covariates related to patient demographics (age, sex and race), disease characteristics (ECOG PS, ISS/r-ISS stage, cytogenetic risk and type of MM), baseline laboratory values (creatinine clearance, hemoglobulin, hepatic function, LDH, plasma cells and platelets) and other patient characteristics (BMI). Evidence of TEM at p < 0.2 in at least three unique RCTs was observed for four covariates, including two related to patient demographics (age and sex) and two related to disease characteristics (ISS/r-ISS stage and cytogenetic risk) (Table 1).
NDMM TIE
Of the 21 included RCTs of NDMM TIE with subgroup analyses, 10 reported effect estimates for OS and 18 reported estimates for PFS.
Subgroup analyses for OS were available for 14 covariates related to patient demographics (age, sex, race and region), disease characteristics (ECOG PS, ISS/r-ISS stage, cytogenetic risk and type of MM), baseline laboratory values (albumin, β-2 microglobulin, creatinine clearance, hepatic function and LDH) and other patient characteristics (frailty). Evidence of TEM at p < 0.2 in at least three RCTs was observed for one covariate related to disease characteristics (cytogenetic risk) (Table 1).
Subgroup analyses for PFS were available for 15 covariates related to patient demographics (age, sex, race and region), disease characteristics (ECOG PS, ISS/r-ISS stage, cytogenetic risk and type of MM), baseline laboratory values (albumin, β-2 microglobulin, creatinine clearance, hepatic function and LDH) and other patient characteristics (brief pain index [BPI] and frailty). Evidence of TEM p < 0.2 in at least three unique RCTs was observed for six covariates, including two related to patient demographics (age and sex), three related to disease characteristics (ECOG PS, ISS/r-ISS stage and cytogenetic risk) and one related to baseline laboratory values (creatinine clearance) (Table 1).
RRMM 1PL
Of the 29 included RCTs of RRMM 1PL with subgroup analyses, 16 reported effect estimates for OS and 26 reported estimates for PFS.
Subgroup analyses for OS were available for 21 covariates related to patient demographics (age, sex, race and region), disease characteristics (ECOG PS, ISS/r-ISS stage, cytogenetic risk, extramedullary disease (EMD)/plasmacytomas and type of MM), prior treatment history (number of prior lines of therapy [LOTs], prior line status [i.e., refractory or relapsed to prior line], prior PI, prior IMiD, prior stem-cell transplant [SCT], refractory status, refractory to PI, refractory to IMiD) and baseline laboratory values (β-2 microglobulin, creatinine clearance, hepatic function and renal function) (Table 1).
Evidence of TEM at p < 0.2 in at least three unique RCTs was observed for four covariates, including two related to patient demographics (age and region) and two related to disease characteristics (ISS/R-ISS stage and cytogenetic risk) (Table 1).
Subgroup analyses for PFS were available for 24 covariates related to demographics (age, sex, race and region), disease characteristics (ECOG PS, ISS/r-ISS stage, cytogenetic risk, EMD/plasmacytomas, time since diagnosis and type of MM), prior treatment history (number of prior LOTs, prior line status [i.e., refractory or relapsed to prior line], prior PI, prior IMiD, prior SCT, refractory status, refractory to PI and refractory to IMiD), baseline laboratory values (β-2 microglobulin, creatinine clearance, hepatic function, and LDH) and other patient characteristics (BMI and frailty) (Table 1).
Evidence of TEM at p < 0.2 in at least three unique RCTs was observed for nine covariates, including three related to demographics (age, sex and region), two related to disease characteristics (ISS/r-ISS stage and cytogenetic risk), three related to prior treatment history (number of prior LOTs, prior IMiD and refractory to IMiD) and one related to baseline laboratory values (creatinine clearance) (Table 1).
Prognostic factors & treatment effect modifiers identified from PAICs
A total of 2146 records were identified from databases and various other sources. After exclusions of 2087 records using prespecified PICOS criteria (Supplementary Table 3), 59 PAICs were identified for inclusion from 45 publications and 12 HTA submission documents (Figure 2). Of these, 18 PAICs were in NDMM, including eight in SCT-eligible and 10 in SCT-ineligible, while 41 were in RRMM, including 23 with 1PL and 18 with TCE (Figure 3). The most commonly identified population adjustment method was MAICs across all populations. Full breakdown of PAIC methods by population can be found in Supplementary Table 5.

Figure 2. PRISMA diagram – literature review of population-adjusted indirect comparisons.
1PL: One or more prior therapy; CDA-AMC: Canada’s Drug Agency - L'agence des medicaments du Canada; GBA: The Federal Joint Committee; HTA: Health technology agency; NDMM: Newly diagnosed multiple myeloma; NICE: The National Institute for Health and Care Excellence; PAIC: Population-adjusted indirect comparison; RRMM: Relapsed/refractory multiple myeloma; TCE: Triple-class exposed; TE: Stem-cell transplant eligible; TIE: Stem-cell transplant ineligible.
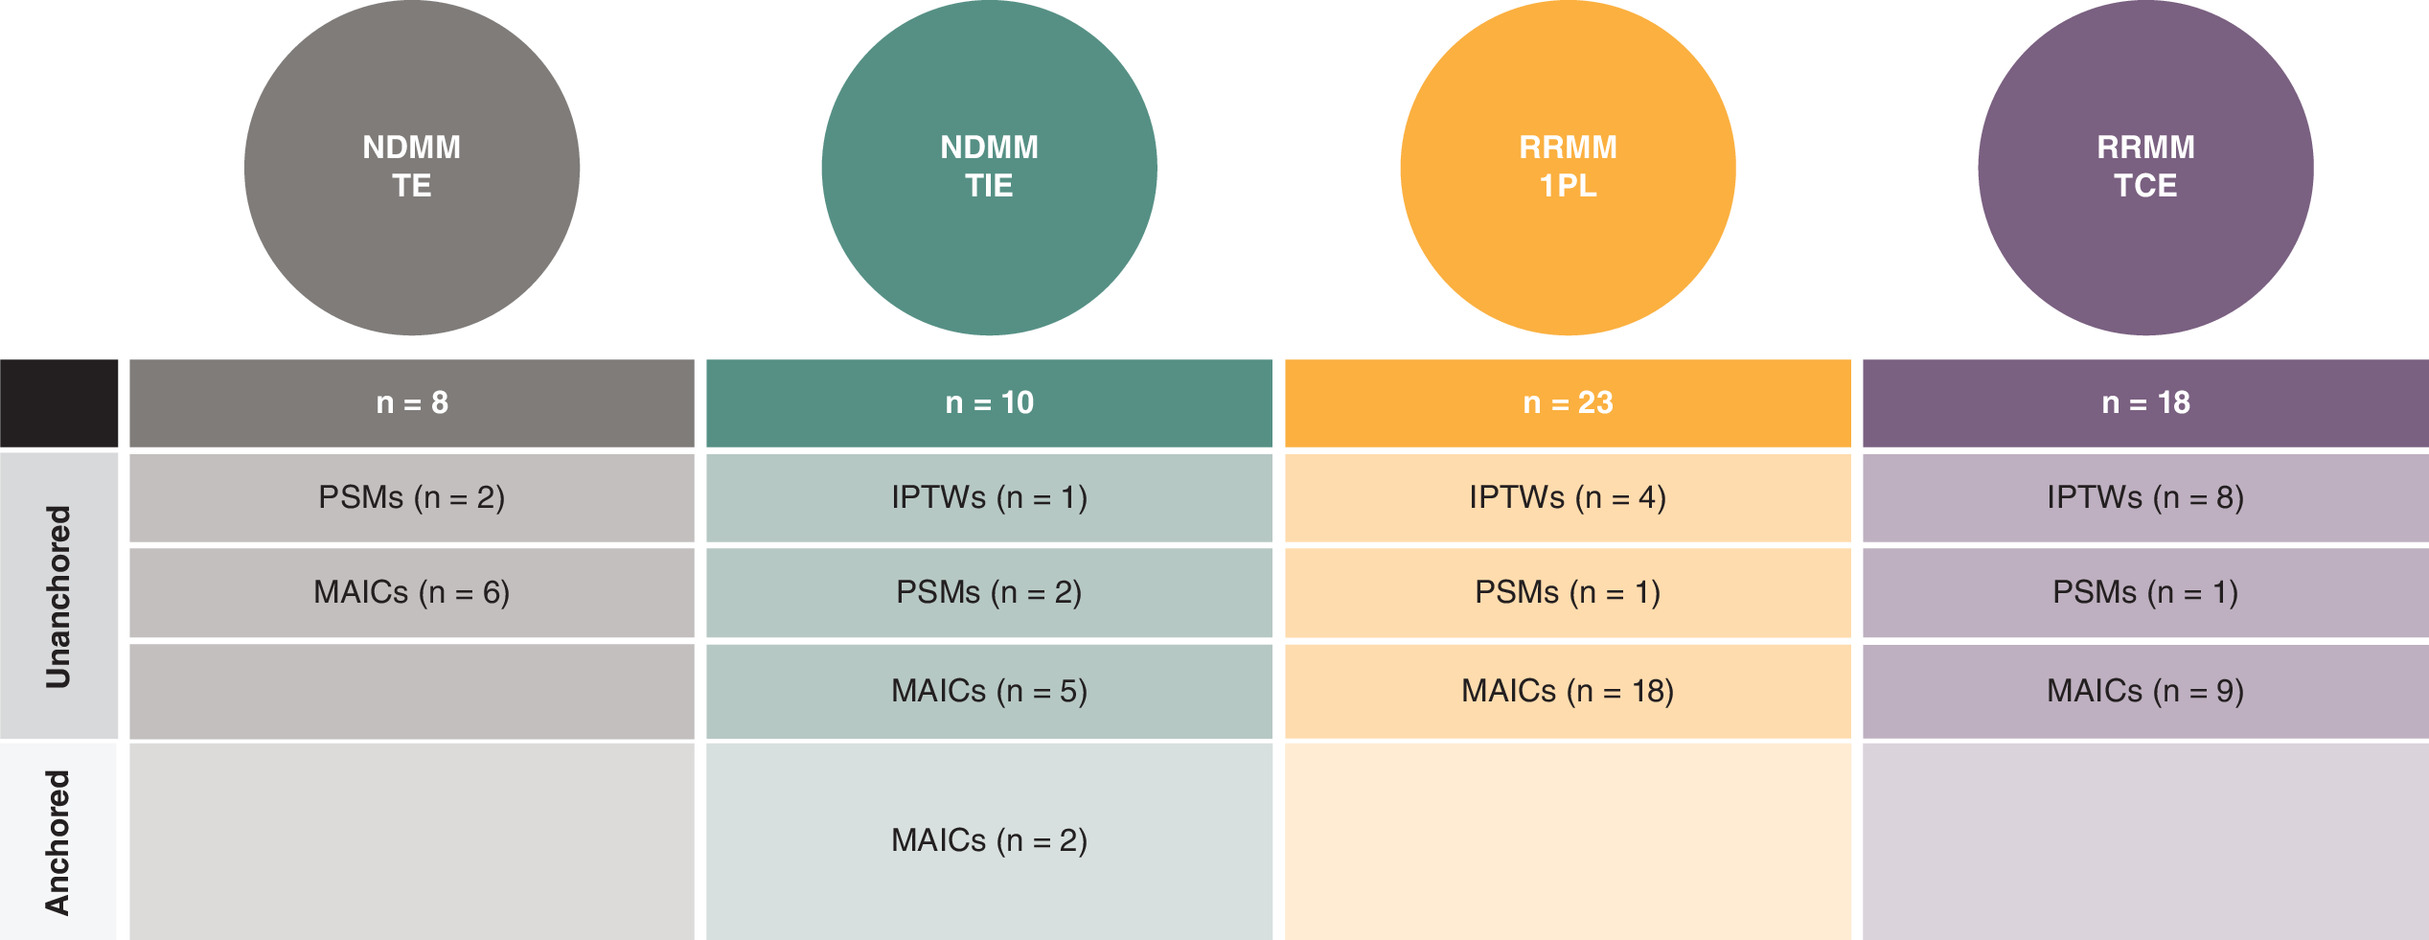
Figure 3. Summary of Included population-adjusted indirect comparison methods by population.
1PL: One or more prior therapy; IPTW: Inverse probability of treatment weighting; MAIC: Matching-adjusted indirect comparison; MM: Multiple myeloma; NDMM: Newly diagnosed multiple myeloma; PAIC: Population-adjusted indirect comparison; PSM: Propensity score matching; RRMM: Relapsed/refractory multiple myeloma; TCE: Triple-class exposed; TE: Stem-cell transplant eligible; TIE: Stem-cell transplant ineligible.
NDMM TE
Eight PAICs for NDMM TE reported in a total of eight PAIC publications/HTA submission documents were included. Of these, all were unanchored PAICs reporting covariate data for both OS and PFS. Most commonly adjusted covariates across these eight PAICs were cytogenetic risk, ISS/r-ISS stage, age, sex, type of MM, creatinine clearance and hemoglobulin levels (Table 2). None of the PAIC publications or HTA submission documents reported univariate or multivariate analyses assessing prognostic strength between baseline covariates and OS or PFS. All eight PAICs leveraged clinical expert opinion to inform the selection of covariates for adjustment (Table 2). Of the clinical expert-informed, none reported covariate rankings based on clinical importance.
| Covariates | Evidence pointing to covariate as a potential PF or TEM based on PAICs | |||||
|---|---|---|---|---|---|---|
| OS | PFS | |||||
| PAICs based on model type | Clinical expert-informed PAICs which identify covariate as important (n = 8) | PAICs based on model type | Clinical expert-informed PAICs which identify covariate as important (n = 8) | |||
| NDMM TE | Anchored (n = 0) | Unanchored (n = 8) | Anchored (n = 0) | Unanchored (n = 8) | ||
| Age | – | 8 | 8 | – | 8 | 8 |
| Sex | – | 8 | 8 | – | 8 | 8 |
| ECOG PS | – | 4 | 4 | – | 4 | 4 |
| ISS/r-ISS stage | – | 8 | 8 | – | 8 | 8 |
| Cytogenetic risk | – | 8 | 8 | – | 8 | 8 |
| Type of MM | – | 6 | 6 | – | 6 | 6 |
| Anemia | – | 2 | 2 | – | 2 | 2 |
| β-2 microglobulin | – | 2 | 2 | – | 2 | 2 |
| Bone disease | – | 2 | 2 | – | 2 | 2 |
| Calcium levels | – | 4 | 4 | – | 4 | 4 |
| Creatinine clearance | – | 6 | 6 | – | 6 | 6 |
| Hemoglobin | – | 6 | 6 | – | 6 | 6 |
| LDH | – | 2 | 2 | – | 2 | 2 |
| Platelets | – | 4 | 4 | – | 4 | 4 |
| Covariates | Evidence pointing to covariate as a potential PF or TEM based on PAICs | |||||
| OS | PFS | |||||
| PAICs based on model type | Clinical expert-informed PAICs which identify covariate as important (n = 2) | PAICs based on model type | Clinical expert-informed PAICs which identify covariate as important (n = 3) | |||
| NDMM TIE | Anchored (n = 0) | Unanchored (n = 6) | Anchored (n = 2) | Unanchored (n = 8) | ||
| Age | – | 6 | 2 | 2 | 8 | 3 |
| Sex | – | 6 | 2 | 2 | 8 | 3 |
| Race | – | 1 | 1 | 2 | 1 | 1 |
| Region | – | 1 | 1 | – | 1 | 1 |
| ECOG PS | – | 4 | 1 | 2 | 5 | 2 |
| ISS/r-ISS stage | – | 6 | 2 | 2 | 8 | 3 |
| Cytogenetic risk | – | 4 | 1 | 2 | 5 | 1 |
| EMD/plasmacytomas | – | 1 | 1 | – | 1 | 1 |
| Time since diagnosis | – | 1 | – | 2 | 1 | – |
| Type of MM | – | 4 | 1 | – | 5 | 2 |
| Albumin levels | – | – | – | – | 1 | – |
| β2-microglobulin | – | 1 | – | – | 2 | – |
| Calcium levels | – | 1 | 1 | – | 1 | 1 |
| Creatinine clearance | – | 5 | 2 | 2 | 7 | 3 |
| Hepatic function | – | 1 | 1 | – | 1 | 1 |
| Renal function | – | 1 | – | – | 2 | 1 |
| Covariates | Evidence pointing to covariate as a potential PF or TEM based on PAICs | |||||
| OS | PFS | |||||
| PAICs based on model type | Clinical expert-informed PAICs which identify covariate as important (n = 8) | PAICs based on model type | Clinical expert-informed PAICs which identify covariate as important (n = 12) | |||
| RRRMM 1PL | Anchored (n = 0) | Unanchored (n = 15) | Anchored (n = 0) | Unanchored (n = 23) | ||
| Age | – | 13 | 6 | – | 19 | 10 |
| Sex | – | 8 | 3 | – | 11 | 5 |
| Race | – | 3 | 2 | – | 5 | 2 |
| ECOG PS | – | 13 | 7 | – | 20 | 11 |
| ISS/r-ISS stage | – | 9 | 5 | – | 13 | 8 |
| Cytogenetic risk | – | 4 | 3 | – | 7 | 5 |
| EMD/plasmacytoma status | – | – | – | – | 2 | – |
| Time since diagnosis | – | 10 | 6 | – | 18 | 10 |
| Type of MM | – | 3 | 2 | – | 8 | 4 |
| LOTs (n) | – | 15 | 8 | – | 19 | 11 |
| Prior line status (i.e., refractory or relapsed to prior line) | – | 2 | 2 | – | 6 | 4 |
| Prior PI | – | 7 | 3 | – | 9 | 4 |
| Prior IMiD | – | 5 | 3 | – | 7 | 4 |
| Prior SCT | – | 9 | 5 | – | 13 | 8 |
| Refractory status | – | 1 | 1 | – | 1 | 1 |
| Refractory to PI | – | 4 | 1 | – | 8 | 3 |
| Refractory to IMiD | – | 6 | 3 | – | 10 | 5 |
| Albumin levels | 1 | – | – | 1 | – | |
| β2-microglobulin | – | 2 | 1 | – | 2 | 1 |
| Bone lesions/disease | 3 | 2 | – | 3 | 2 | |
| Creatinine clearance | – | 4 | 3 | – | 10 | 5 |
| Renal function | – | 2 | – | – | 2 | – |
| Covariates | Evidence pointing to covariate as a potential PF or TEM based on PAICs | |||||
| OS | PFS | |||||
| PAICs based on model type | Clinical expert-informed PAICs which identify covariate as important (n = 12) | PAICs based on model type | Clinical expert-informed PAICs which identify covariate as important (n = 11) | |||
| RRMM TCE | Anchored (n = 0) | Unanchored (n = 18) | Anchored (n = 0) | Unanchored (n = 17) | ||
| Age | – | 17 | 12 | – | 16 | 11 |
| Sex | – | 17 | 11 | – | 16 | 10 |
| Race | – | 10 | 6 | – | 10 | 6 |
| ECOG PS | – | 15 | 10 | – | 14 | 9 |
| ISS/r-ISS stage | – | 16 | 10 | – | 15 | 9 |
| Cytogenetic risk | – | 14 | 9 | – | 14 | 9 |
| EMD/plasmacytoma status | – | 11 | 6 | – | 11 | 6 |
| Time since diagnosis | – | 15 | 9 | – | 14 | 8 |
| Type of MM | – | 9 | 5 | – | 9 | 5 |
| Time since progression | – | 8 | 4 | – | 7 | 3 |
| Average duration of prior LOTs | – | 3 | 1 | – | 2 | – |
| Prior LOTs (n) | – | 18 | 12 | – | 17 | 11 |
| Prior line status (i.e., refractory or relapsed to prior line) | – | 4 | 4 | – | 4 | 4 |
| Prior SCT | – | 13 | 7 | – | 13 | 7 |
| Refractory status | – | 14 | 8 | – | 13 | 7 |
| Refractory to PI | – | 6 | 5 | – | 6 | 5 |
| Refractory to IMiD | 6 | 5 | – | 6 | 5 | |
| Refractory to anti-CD38 mAb | – | 3 | 2 | – | 3 | 2 |
| Albumin levels | – | 3 | 3 | – | 2 | 2 |
| β-2 microglobulin | – | 1 | 1 | – | – | – |
| Bone lesions/disease | – | 1 | 1 | – | 1 | 1 |
| Calcium levels | – | 1 | 1 | – | 1 | 1 |
| Creatinine clearance | – | 8 | 5 | – | 8 | 5 |
| Hemoglobulin levels | – | 6 | 3 | – | 6 | 3 |
| LDH levels | – | 3 | 1 | – | 3 | 1 |
| Renal function | – | 1 | 1 | – | 1 | 1 |
1PL: One or more prior line; ECOG PS: Eastern Cooperative Oncology Group performance score; EMD: Extramedullary disease; IMiD: Immunomodulatory drug; ISS: International Staging System; LDH: Lactate dehydrogenase; LOT: Line of therapy; mAb: Monoclonal antibody; MM: Multiple myeloma; NDMM: Newly diagnosed multiple myeloma; OS: Overall survival; PAIC: Population-adjusted indirect comparison; PF: Prognostic factor; PFS: Progression-free survival; PI: Proteasome inhibitor; r-ISS: Revised International Staging System; RRMM: Relapsed/refractory multiple myeloma; SCT: Stem-cell transplant; TCE: Triple-class exposed; TE: Stem-cell transplant eligible; TEM: Treatment effect modifier; TIE: Stem-cell transplant ineligible.
NDMM TIE
Ten PAICs for NDMM TIE reported in a total of nine PAIC publications/HTA submission documents were included. Of these, eight were unanchored and only two were anchored PAICs. All PAICs reported covariate data for PFS, while only six reported data for OS additionally. Most commonly adjusted covariates across these 10 PAICs were ISS/r-ISS stage, age, sex, creatinine clearance, cytogenetics risk and type of MM (Table 2). None of the PAIC publications or HTA submission documents reported univariate or multivariate analyses assessing prognostic strength between baseline covariates and OS or PFS. Only three PAICs leveraged clinical expert opinion to inform the selection of covariates for adjustment (Table 2). Of the clinical expert-informed PAICs, none reported covariate rankings based on clinical importance.
RRMM 1PL
Twenty-three PAICs for RRMM 1PL reported in a total of 23 PAIC publications/HTA submission documents were included. Of these, all were unanchored analyses reporting covariate data for the outcome of PFS. Only 15 PAICs reported data for OS. Most commonly adjusted covariates across these 23 PAICs were number of prior LOTs, ECOG PS, age, time since diagnosis, ISS/r-ISS stage, prior SCT, sex, IMiD refractory status, prior PI, creatinine clearance, prior IMiD and PI refractory status and cytogenetic risk (Table 2). None of the PAIC publications or HTA submission documents reported univariate or multivariate analyses assessing prognostic strength between baseline covariates and OS or PFS.
Twelve PAICs leveraged clinical expert opinion to inform the selection of covariates for adjustment (Table 2). Of the clinical expert-informed, only three reported covariate rankings based on clinical importance. Based on covariate rankings of clinical importance reported in clinical expert-informed PAICs, the most important covariates in RRMM 1PL, identified in order of importance, appear to be refractorysx status, number of prior LOTs, ISS/r-ISS stage, creatinine clearance, ECOG PS, cytogenetic risk, time since diagnosis, type of MM, race, β-2 microglobulin, bone lesions/disease, prior SCT and age (Figure 4A).
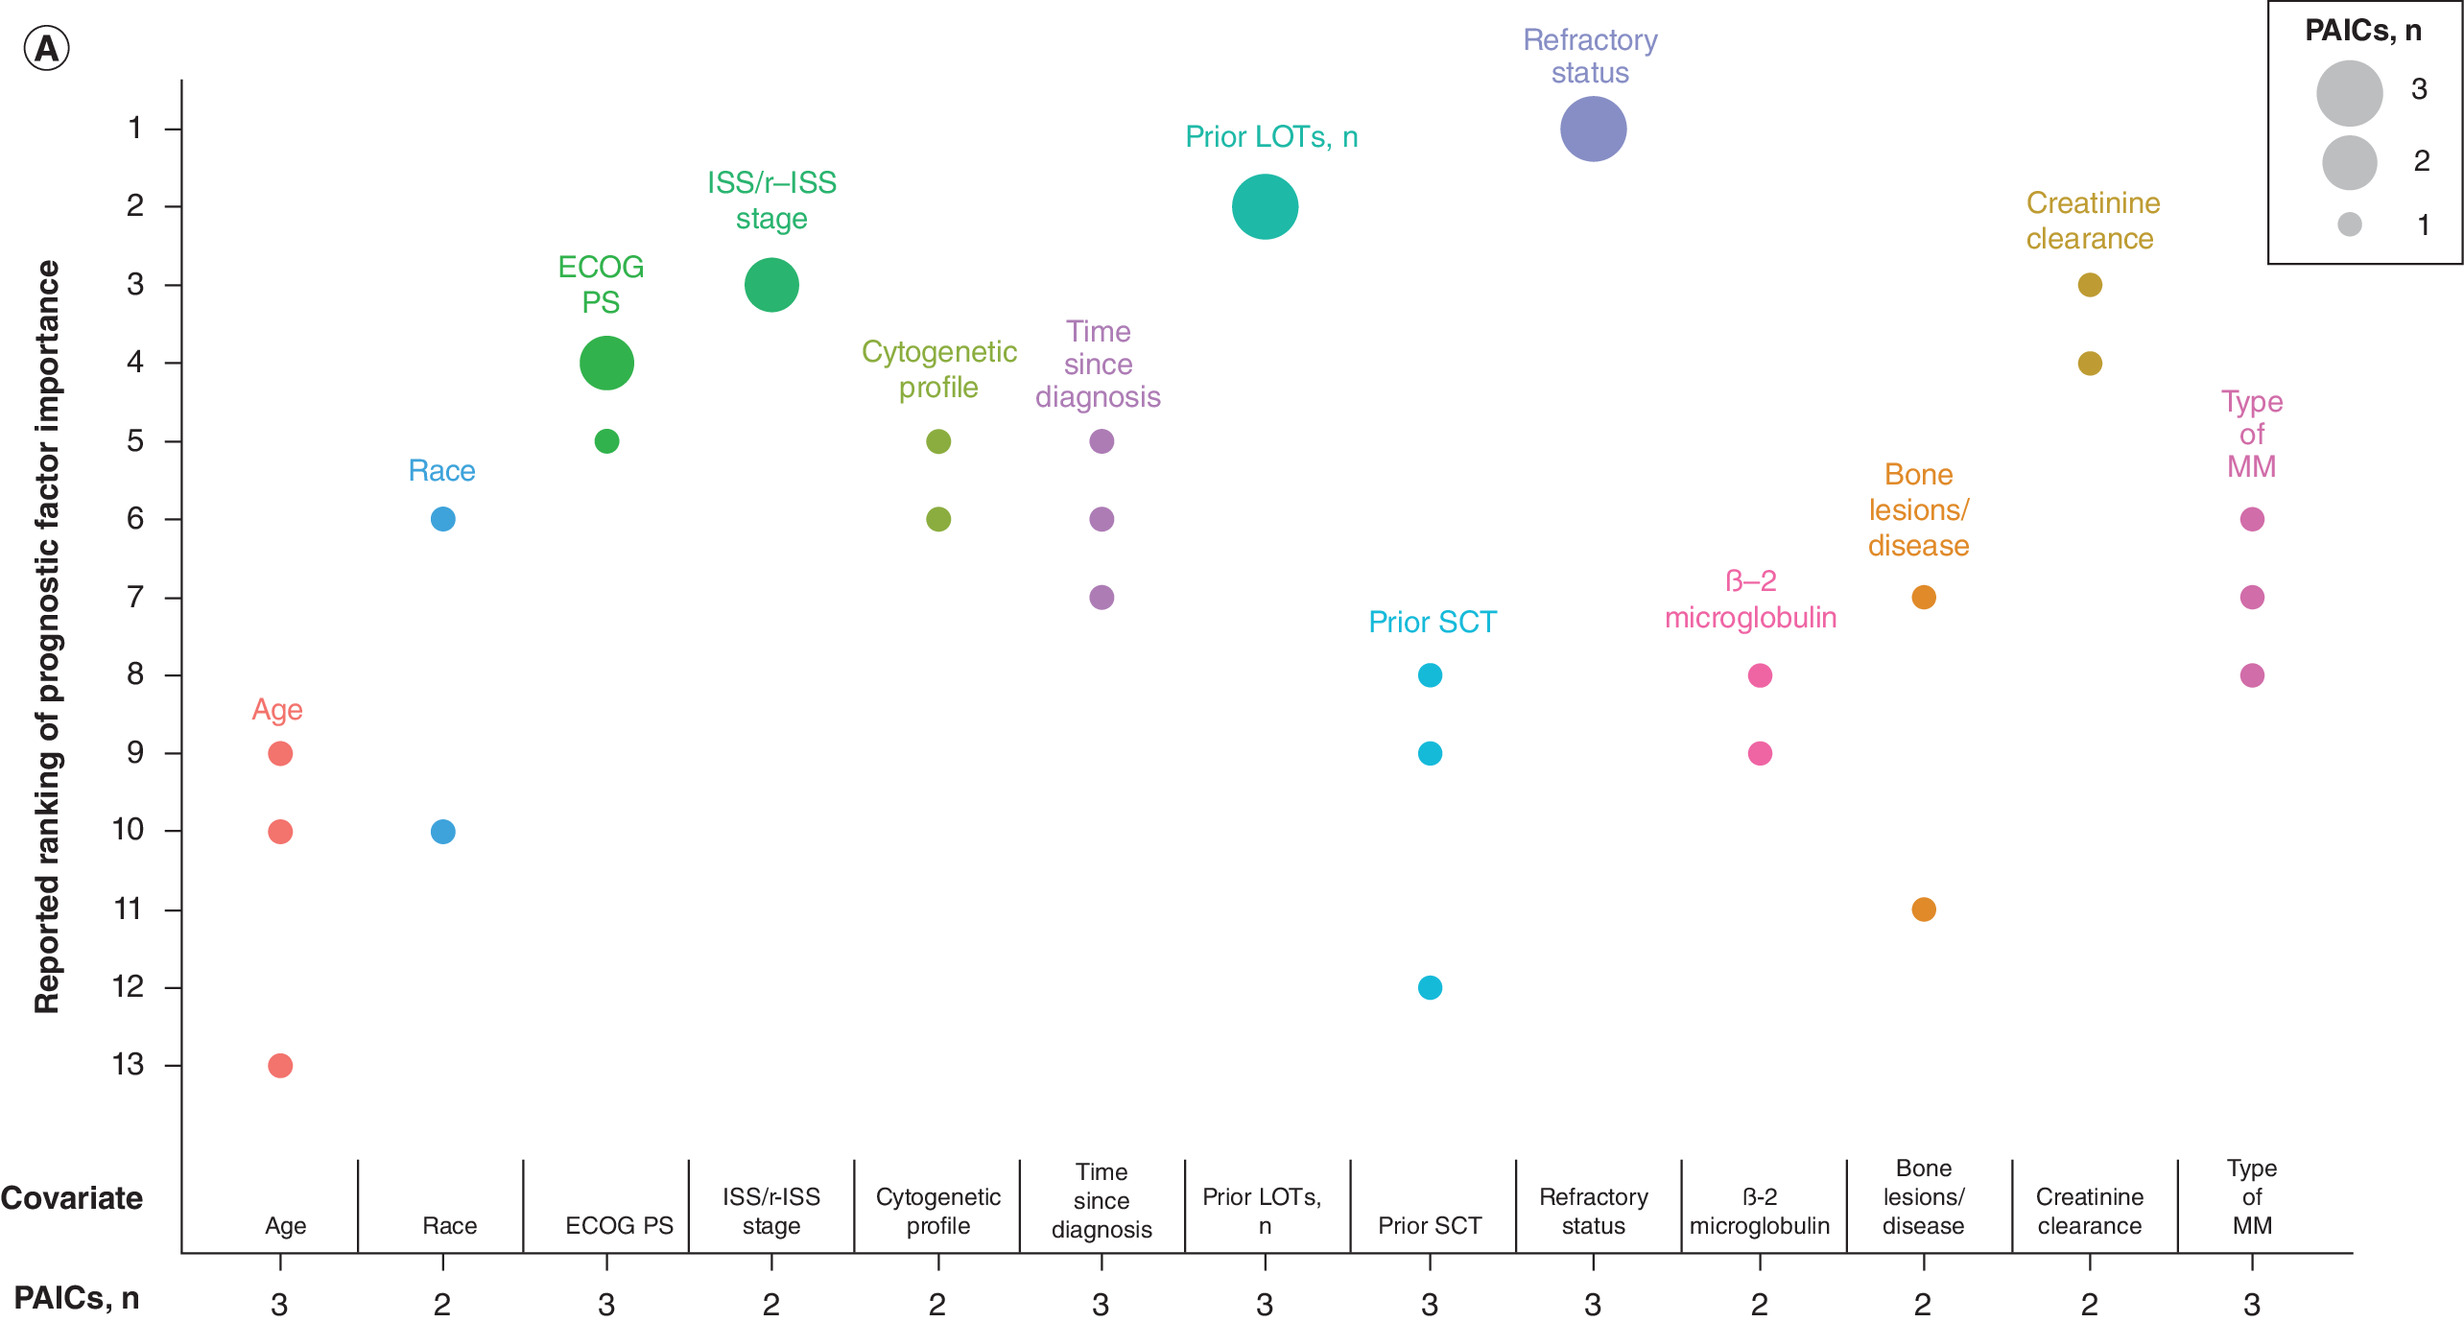
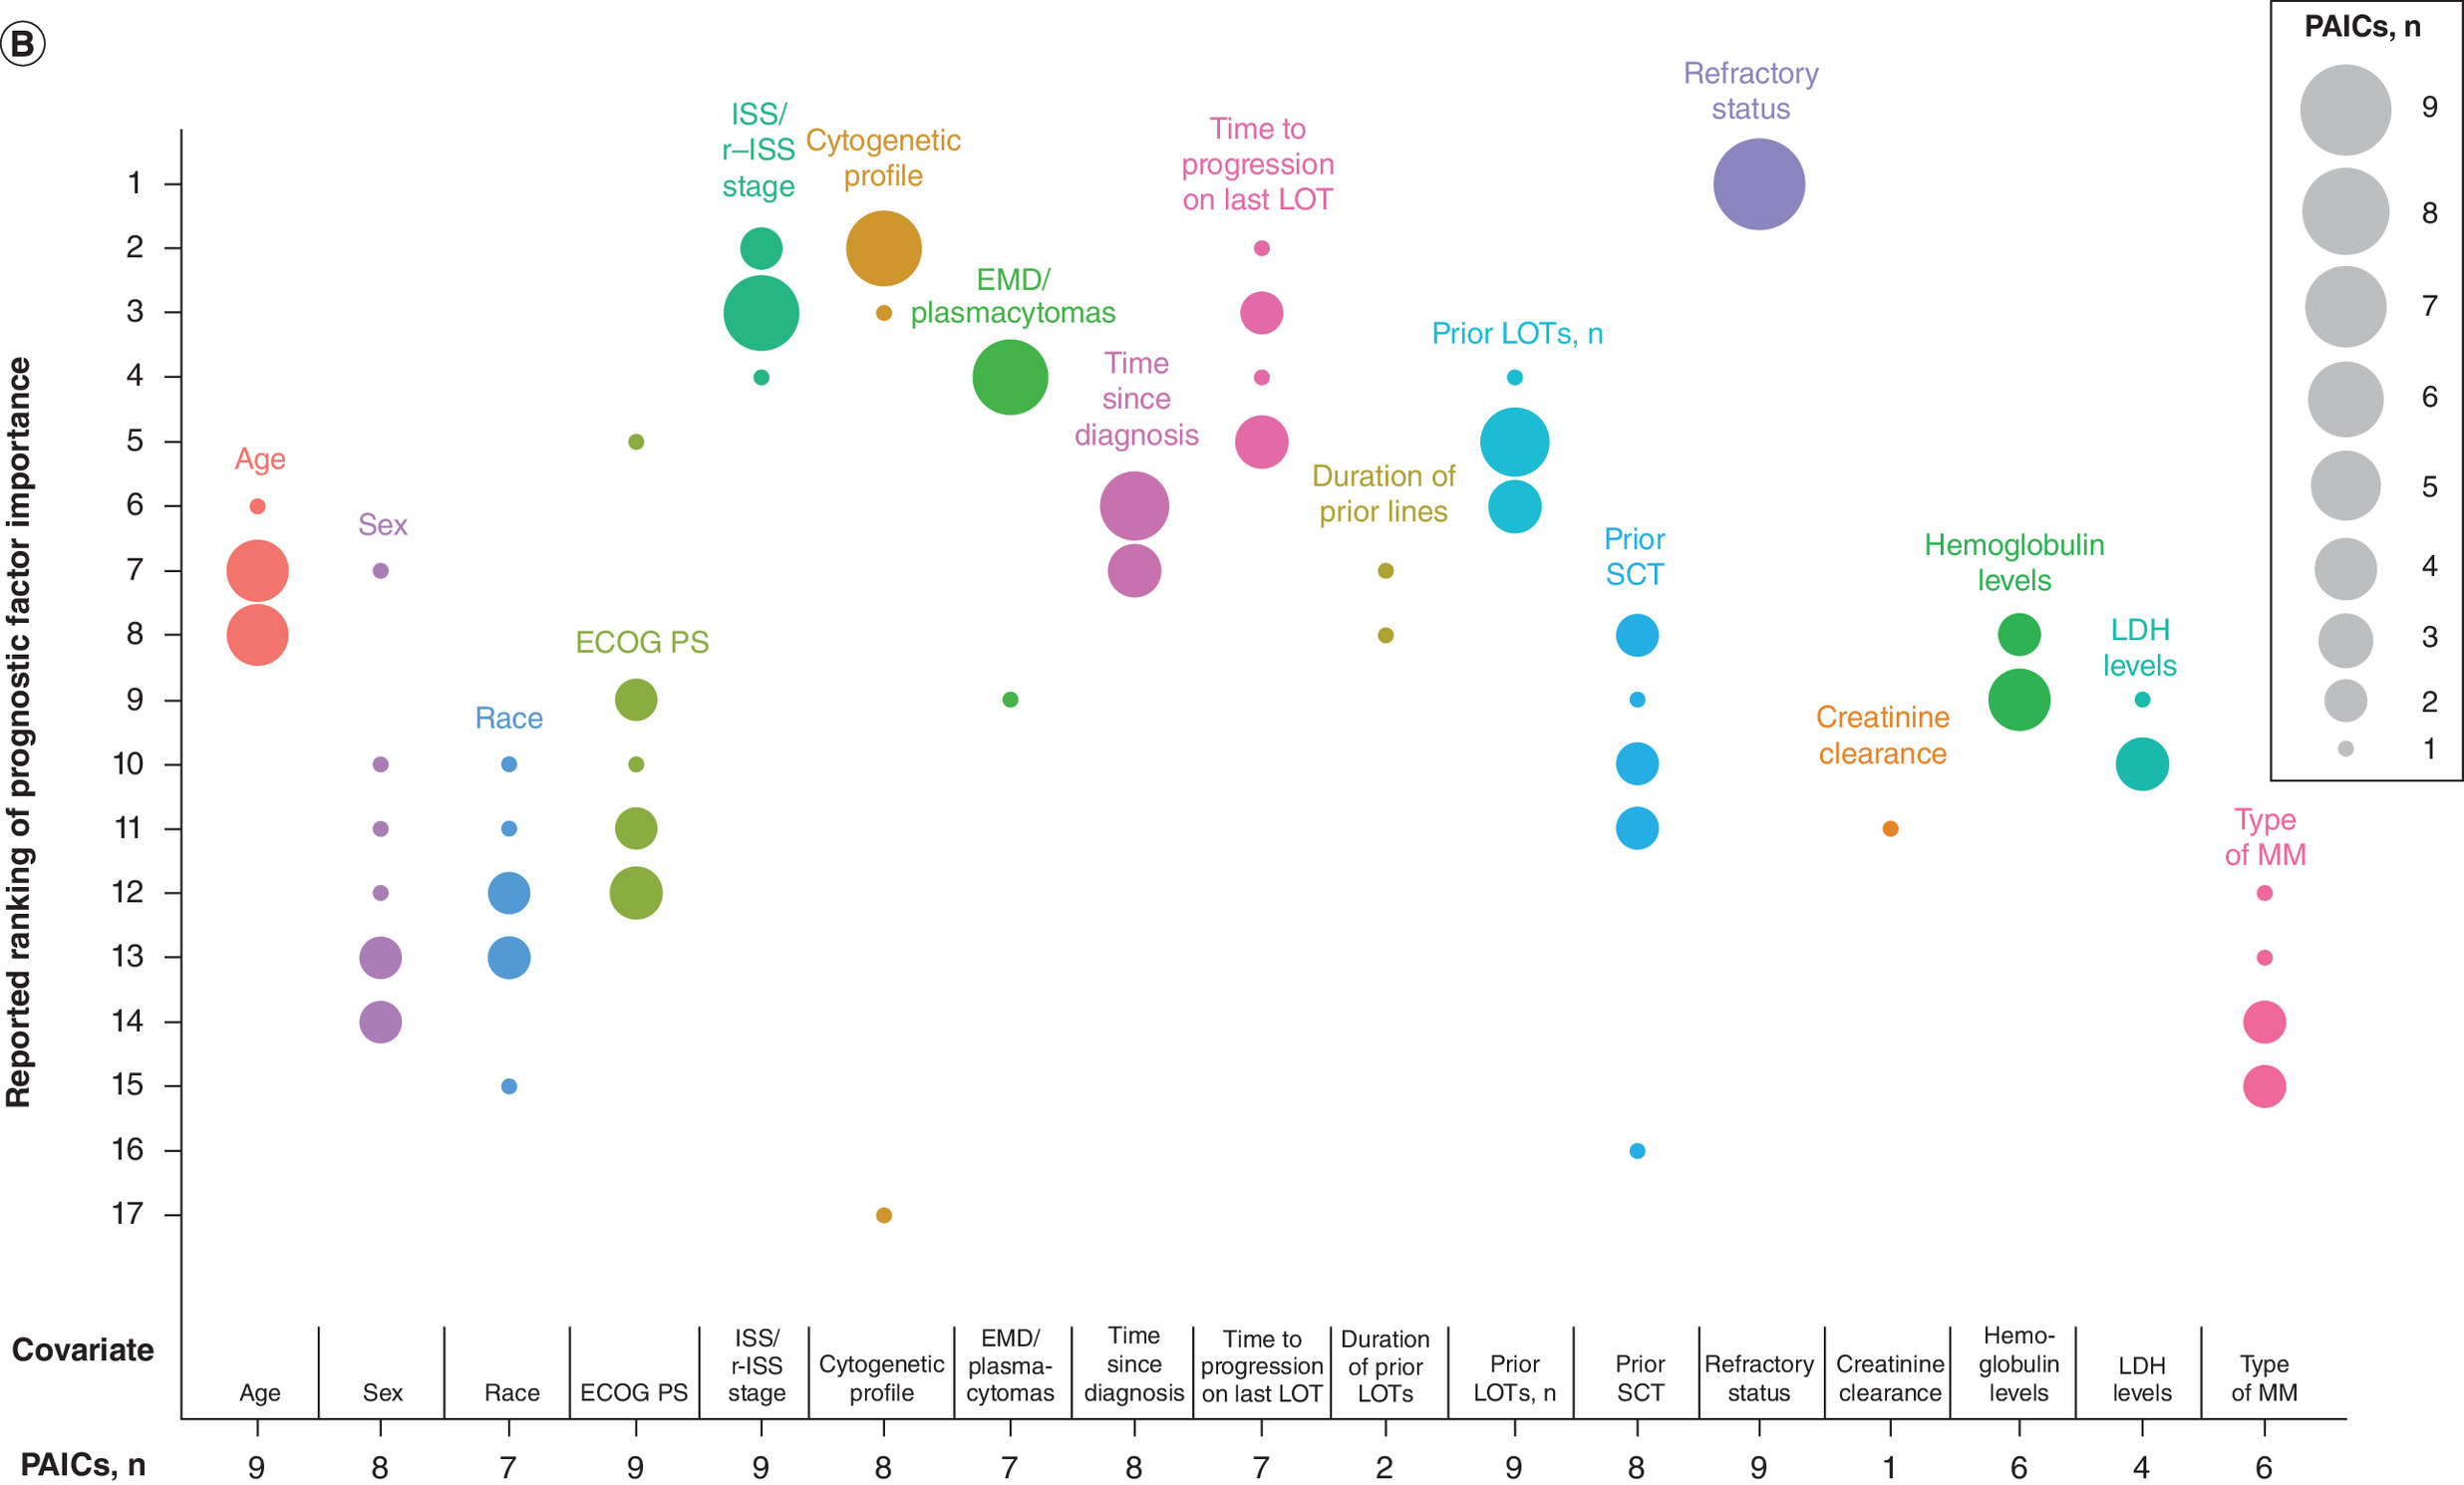
Figure 4. Summary of covariates rankings in clinical expert-informed population-adjusted indirect comparisons.
(A) Summary of covariate rankings identified in published PAICs – RRMM 1PL. (B) Summary of covariate rankings identified in published PAICs – RRMM TCE.
1PL: One or more prior therapy; ECOG PS: Eastern Cooperative Oncology Group performance score; EMD: Extramedullary disease; ISS: International Staging System; LDH: Lactate dehydrogenase; LOTs: Lines of therapy; MM: Multiple myeloma; PAIC: Population-adjusted indirect comparison; r-ISS: Revised International Staging System; RRMM: Relapsed/refractory multiple myeloma; SCT: Stem-cell transplant; TCE: Triple class exposed.
RRMM TCE
Eighteen PAICs for RRMM TCE reported in a total of 18 PAIC publications/HTA submission documents were included. Of these, all were unanchored analyses reporting covariate data for the outcome of OS. Only 17 PAICs reported data for PFS. Most commonly adjusted covariates across these 18 PAICs were number of prior LOTs, age, sex, ISS/r-ISS stage, ECOG PS, time since diagnosis, cytogenetic risk, refractory status, prior SCT, EMD/plasmacytoma, race, type of MM, creatinine clearance, time since progression, refractory to PI, refractory to IMiD and hemoglobulin levels (Table 2). None of the PAIC publications or HTA submission documents reported univariate or multivariate analyses assessing prognostic strength between baseline covariates and OS or PFS.
Twelve PAICs leveraged clinical expert opinion to inform the selection of covariates for adjustment (Table 2). Of the clinical expert-informed, nine reported covariate rankings based on clinical importance. Based on rankings of clinical importance reported in clinical expert-informed PAICs, the most important covariates in RRMM TCE were disease characteristics, followed by baseline laboratory values and demographics. The following variables were identified in order of importance in PAICs: refractory status, ISS/r-ISS stage, cytogenetic risk, time to progression on last LOT, EMD/plasmacytomas, number of prior LOTs, time since diagnosis, age, hemoglobulin levels, LDH levels, creatinine clearance, average duration of prior lines, prior SCT, ECOG PS, race, sex and type of MM (Figure 4B).
It is unclear whether each covariate was a PF, TEM or both in these PAICs. However, based on the MAIC of DREAMM-2 versus STORM part 2 included in the literature review, according to clinical experts, age, ECOG PS, comorbidities (renal, liver, or frailty index), cytogenetic factors, r-ISS stage, EMD/plasmacytomas, serum B-cell maturation antigen levels, number of prior LOTs and refractory status were considered PFs, while cytogenetic factors, r-ISS stage, number of prior LOTs and refractory status were considered TEMs [29].
Discussion
Complex treatment landscapes in MM pose practical challenges in directly comparing the effectiveness of novel regimens versus all relevant standard of care regimens using head-to-head clinical trials. In the absence of head-to-head data, ITC is a way to compare the relative effectiveness of alternative treatments that have been studied in separate clinical trials. Prior to conducting ITCs, patient characteristics that may affect outcomes or influence the magnitude of the treatment effect should be identified and adjusted for via statistical methods to minimize bias. This work aimed to identify potential TEMs on a statistical basis using summary-level data from published RCTs in MM. A literature review of previously published PAICs in MM was also conducted to validate TEM findings and explore candidate PFs.
Age, sex, ISS/r-ISS stage and cytogenetic risk were consistently identified via RCTs as likely TEMs for PFS and were validated by the augmented review of PAICs in MM across all MM populations evaluated herein. Cytogenetic risk was also identified as a likely TEM for OS via RCTs in NDMM TIE and RRMM 1PL. Additional covariates of age, ISS/r-ISS stage and geographical region were identified for RRMM 1PL. Age, ISS/r-ISS stage and cytogenetic risk were validated as TEMs of OS by the augmented review of PAICs.
TEMs may vary depending on treatments investigated, MM population or outcome for assessment [6,7]. Patients with RRMM are known to have worse prognosis compared with those with NDMM due to disease progression, and similarly between patients with NDMM TIE versus NDMM TE due to comorbidities and other risk factors [6,7]. Hence, the current approach delineated each MM population as per NCCN and ESMO definition and then assessed TEMs within each subpopulation independently to minimize bias. Additionally, current therapies for MM consist of regimens composed of drugs with different mechanisms of action [1,5–7]. Given the treatment-specific nature of effect modification, certain covariates may only be consistently identified as a TEM within trials investigating a specific drug. For instance, age, sex and ISS/r-ISS stage were consistently identified as likely TEMs of PFS across RCTs in NDMM TE patients investigating the addition of an PI with a corticosteroid or chemotherapy to the control regimen [30,31], whereas results of the TEM assessment were mixed for the covariates of age and ISS/r-ISS stage across RCTs evaluating the addition of an anti-CD38 mAb to the control regimen [32–35]. Additionally, effect modification could be of varying magnitudes within a specific class of drugs. Among RCTs investigating regimens consisting of the same treatment classes but different drugs across the control and treatment arms, effect modification was not consistently identified for the same covariate across all RCTs in NDMM TIE [36,37]. Potential interaction effects may also explain this discrepancy, considering patients with NDMM TIE have comorbidities that render them ineligible for SCT [1] and no subgroup analyses by comorbidities were available for further evaluation. Moreover, covariates could have varying additive or multiplicative effect modification [38]. For continuous variables such as laboratory values, effect modification may have only been detected from subgroup analyses with specific numerical cut-offs.
In general, the literature review of PAICs validated the TEMs identified from the literature review of RCTs. The majority of PAICs across all MM populations adjusted for covariates that were identified as likely TEMs of PFS or OS from RCTs. Few discrepancies between covariates identified in PAICs and those identified as potential TEMs from subgroup analyses in RCTs were noted, apart from covariates related to baseline laboratory values (e.g., hepatic function and LDH). Overall, published PAICs identified in this review adjusted for a broader pool of covariates than those identified from RCTs. This could be due to the incorporation of additional covariates specific to the treatment under investigation and deemed relevant to clinical practice considering covariate selection for PAICs include statistical ranking to identify PFs based on unpublished IPD and consultations with medical experts, respectively. Nevertheless, there was a significant overlap between the covariates identified in the PAICs list and the RCTs lists, primarily with covariates related to patient and disease characteristics. Additionally, certain covariates adjusted for in published PAICs may potentially be PFs, which were largely indistinguishable from TEMs in our assessments due to either the lack of differentiation in reporting, or the lack of data to assess whether a covariate was a PF or TEM from the PAICs. Exceptions to this include the covariates of age, sex, ISS/r-ISS, ECOG PS, cytogenetic risk, and creatinine clearance, which could potentially be considered PFs since they were adjusted for in both anchored and unanchored analyses for NDMM TIE. Even though only two anchored analyses were identified, evidence supporting these covariates as PFs are established in literature [39–45]. Despite some differences between covariates adjusted for in PAICs and those identified from subgroup analyses in RCTs, the considerable overlap across survival outcomes and different MM populations provide evidence that the covariates adjusted for in published PAICs identified herein could serve as an initial set of potential covariates for adjustment or subgroup analyses in future PAICS or RCTs, respectively.
While there was overlap in covariates identified for OS versus those identified for PFS, there were also a few discrepancies. The inconsistency across outcomes may primarily be driven by the higher frequency of subgroup analyses reported in RCTs for PFS than for OS. This aligns with findings from another study investigating effect modification, but solely for the covariates of refractory status and number of LOTs in RRMM [46]. A larger evidence base for PFS is also expected as PFS is an accepted surrogate end point of OS for accelerated regulatory approval of certain targeted therapies and combination regimens that demonstrate improved survival outcomes [47]. Although fewer TEMs were identified for OS, it does not preclude other variables as potential candidates for TEM.
Overall, this study had several strengths. Various data sources were leveraged to inform the evidence base, including both RCT and PAIC study designs which can more reliably capture TEMs and PFs. Searches of published literature included historical and contemporary data (i.e., since the years 1996 for RCTs and 2013 for PAICs) to ensure the identification of potential TEMs that were more recently identified as an important risk factor (i.e., EMD/plasmacytomas) in addition to those commonly reported in RCTs evaluating established therapies. Analysis approaches also consider potential heterogeneity of TEMs within MM. Considering TEMs can vary by MM population, including a mixed population for TEM assessment may introduce bias. By delineating each MM population per NCCN and ESMO treatment guideline definitions, and assessing TEMs within each subpopulation independently, the current approach minimizes uncertainty, allowing the results to be valuable for diverse stakeholders involved in healthcare decision-making. Assessments of TEM were conducted with established statistical methods [26,27], and validated iteratively by a panel of statistical experts. Additionally, clinical expert opinion reported in published PAICs and HTAs were included to inform which covariates might be of greater clinical relevance.
To our knowledge, there is no other study that reviews both TEMs and PFs across four MM populations and determine TEMs through a statistical approach. However, three publications in RRMM populations have reviewed potential TEMs or PFs [20,21], or evaluated effect modification in selected covariates [46] at the time when this manuscript was written. Towle et al. was a conference poster focused on identifying both potential TEMs or PFs in unanchored ITCs of TCE RRMM [21]. Kumar et al. aimed to review potential PFs broadly for both response and survival outcomes reported in either observational studies or clinical trials of RRMM [20]. Although methods vary between our study and the two aforementioned studies, the covariates identified were largely aligned. Compared with Kumar et al. [20], our study also captured baseline covariates related to demographics (age and sex), disease characteristics (cytogenetic risk, ECOG PS, ISS/r-ISS stage, EMD/plasmacytomas, time from diagnosis), prior treatment history (prior therapy with IMiD, prior therapy with SCT and prior LOTs) and biochemical laboratory values (albumin, LDH and β2-microglobulin) as potential PFs of OS and PFS in RRMM 1PL. Covariates captured in Towle et al. were consistent with Kumar et al. and additionally included refractory status, time to progression on last LOT, hemoglobin, creatinine clearance, average duration of prior therapies and race [21]. Our study identified all covariates noted in Towle et al. [21]. Rose et al. evaluated effect modification of refractory status and prior LOTs in RRMM using a random-effects meta-analysis approach [46]. Effect modification by these two covariates were considered weak and thus unlikely to bias NMA estimates [46]. This contradicts with our findings, in which number of prior LOTs and refractory status to IMiDs were considered likely TEMs. However, conclusions from Rose et al. were based on broad covariate definitions, which does not consider the treatment-specific nature of TEMs. In our analysis, refractory status was only considered a likely TEM in the context of IMiDs. Additionally, Rose et al. did not acknowledge how varying magnitudes of effect modification on the additive or multiplicative scale could influence detection of TEMs.
Despite these strengths, this study also had limitations. TEM assessments were limited to known covariates that have been considered in published clinical trials and thus may not have necessarily identified unknown covariates that are potential TEMs. Published data are also strictly summary-level, which prevented further evaluation of the magnitude of effect modification on either the additive or multiplicative scale. Additionally, although covariates selected for adjustment were reported, whether these covariates were considered TEMs or PFs was not disclosed in included PAICs of MM populations except one [29]. Concluding whether covariates were TEMs or PFs based on methodology from NICE TSDs [11,14,28] were not feasible considering anchored PAICs are rarely conducted in MM due to lack of a common comparator regimen across RCTs. Furthermore, covariates identified as TEMs based on historical data may not necessarily be considered TEMs in future PAICs given the treatment-specific nature of TEMs. Thus, while this analysis could potentially inform preliminary covariate selection prior to the conduct of future PAICs, de novo analysis of newly collected data should be performed alongside consultations with subject-matter experts to ensure all relevant covariates are adjusted.
Several opportunities for future research are possible. Availability of IPD or real-world evidence can permit investigations into the prognostic value of candidate PFs and each TEM’s magnitude of effect modification, either on additive scale or on a multiplicative scale. Additionally, emerging understanding of covariates associated with poorer prognosis, such as EMD/plasmacytomas [48], and the incorporation of additional factors to assign risk to MM patients [49,50], may also lead to increased reporting of subgroup analyses in pivotal publications for covariates that were either sparsely identified or lacking entirely in the current study. As the treatment landscape in MM is constantly evolving, increasing evidence generation from both RCTs and PAICs are expected, providing available data and thus opportunities to investigate TEM's treatment-specific nature and outcome associations.
Conclusions from this work can be leveraged by various stakeholders who rely on accurate estimates of comparative effectiveness to provide guidance on MM treatment guideline updates. In line with best practices published by NICE and IQWiG, a priori identification and adjustment of TEMs and PFs strengthen the validity of results from comparative estimates in PAICs and subgroup or stratification analyses in RCTs [51,52]. The current work defines an initial set of potential TEMs and PFs that can be used to establish a standard prespecified list, which can then be shared with a panel of clinical experts in MM to validate, supplement or refine prior to a formal statistical analysis. Following these steps, data analyses using IPD can further validate potential or identify new TEMs and PFs, assess the degree of collinearity (or redundancy) among TEMs and PFs and assess population differences in TEMs and PFs across the evidence. Findings from this research can contribute to increased transparency and standardization in the selection process to support comparability of different PAICs and future clinical trial design in terms of preplanned subgroups analyses as well as stratification analyses.
Conclusion
The use of a historical data-informed approach allowed the identification of a list of potential TEMs and PFs to use in conjunction with data analysis and clinical validation during the development of future studies in MM populations of interest. Given the emergence of new diagnostic tools and treatment classes for MM, future efforts should focus on ensuring selected covariates remain accurate with updated clinical opinion prior to conducting analyses. This research can help increase transparency in the identification process of TEMs and PFs in designs of preplanned subgroup and stratification analyses in future RCTs and improve comparability of results from different PAICs.
Summary points
•
Healthcare decisions for patients with multiple myeloma (MM) have become increasingly complex due to the introduction of innovative treatment classes in the past decade.
•
Of the few publications synthesizing treatment effect modifiers (TEMs) and prognostics factors (PFs) in MM populations currently available, none included assessments in patients with newly diagnosed multiple myeloma.
•
Covariates considered likely TEMs were identified and determined from subgroup analyses collected from a literature review of randomized controlled trials and validated using a separate literature review of population-adjusted indirect comparisons.
•
Four covariates, age, sex, ISS/r-ISS stage and cytogenetic risk were consistently identified as likely TEMs for progression-free survival and varied for overall survival across MM populations assessed.
•
Published population-adjusted indirect comparisons identified in this review adjusted for a broader pool of covariates than those determined from published randomized controlled trials.
•
Several other covariates may potentially be TEMs depending on treatments investigated, MM population or outcome.
•
Age, sex, ISS/r-ISS, Eastern Cooperative Oncology Group performance score, cytogenetic risk and creatinine clearance could potentially be considered PFs since they were adjusted for in both anchored and unanchored analyses of newly diagnosed multiple myeloma with hematopoietic stem-cell transplant ineligibility.
•
The use of a historical data-informed approach allowed the identification of a list of potential TEMs and PFs to use in conjunction with data analysis and clinical validation during the development of future studies in MM populations of interest.
Author contributions
All authors participated in the conception and design of the study. K Chiang and IA Samjoo contributed to the literature review, data collection and data analysis. J He and X Lin contributed to data analysis. J Maringwa contributed to data collection. All authors contributed to the interpretation of the data and critically reviewed for importance of intellectual content for the work. All authors were responsible for drafting or reviewing the manuscript and for providing final approval. All named authors meet the International Committee of Medical Journal Editors (ICMJE) criteria for authorship for this article, take responsibility for the integrity of the work and have given their approval for this version to be published.
Acknowledgments
The authors acknowledge Joanna Bielecki who developed, conducted and documented the database searches, Muhaimen Siddiqui for providing statistical expertise and Maxwell Bezaire and Alexandra Hall for assisting with the literature review and data collection. J Bielecki and M Siddiqui are employed by EVERSANA™, Canada. M Bezaire and A Hall are former employees of EVERSANA™, Canada. In addition, the authors acknowledge Annette Lam, Eric Ammann, Joris Diels and Joao Mendes from Johnson and Johnson who provided valuable comments for this work.
Financial disclosure
This work was sponsored by Johnson and Johnson.
Competing interests disclosure
J He, X Lin, J Kwong, J Maringwa, L Yang, S Nair, M Hashim, MJ Keng are employees of Johnson and Johnson. J He, X Lin, J Kwong, L Yang, M Hashim, S Nair also own Johnson and Johnson stock. K Chiang and IA Samjoo are employees of EVERSANA™, Canada, which was a paid consultant to Johnson and Johnson in connection with the development of this manuscript. The authors have no other competing interests or relevant affiliations with any organization or entity with the subject matter or materials discussed in the manuscript apart from those disclosed.
Writing disclosure
Medical writing support was provided by K Chiang and IA Samjoo from EVERSANA™, Canada and funded by Johnson and Johnson.
Ethical conduct of research
This article is based on previously conducted studies and does not contain any new studies with human participants or animals performed by any of the authors.
Open access
This work is licensed under the Attribution-NonCommercial-NoDerivatives 4.0 Unported License. To view a copy of this license, visit https://creativecommons.org/licenses/by-nc-nd/4.0/
Supplementary Material
File (supplementary materials.docx)
- Download
- 468.35 KB
References
Papers of special note have been highlighted as: •• of considerable interest
1.
Rajkumar SV. Multiple myeloma: 2024 update on diagnosis, risk-stratification, and management. Am. J. Hematol. 99(9), 1802–1824 (2024).
2.
Ferlay JA-O, Colombet M, Soerjomataram I et al. Estimating the global cancer incidence and mortality in 2018: GLOBOCAN sources and methods. Int. J. Cancer 144(8), 1941–1953 (2019).
3.
Ferlay J, Ervik M, Lam F et al. Global Cancer Observatory: Cancer Today. International Agency for Research on Cancer, France. Available from: https://gco.iarc.who.int/today
4.
National Cancer Institute's Surveillance, Epidemiology, and End Results (SEER) Program. Cancer Stat Facts: myeloma [updated 2025]. Available from: https://seer.cancer.gov/statfacts/html/mulmy.html
5.
Callander NS, Kumar SK. Updates to the management of multiple myeloma. J. Natl Compr. Canc. Netw. 22(Suppl.), e245004 (2024).
6.
National Comprehensive Cancer Network. NCCN Clinical Practice Guidelines in Oncology (NCCN Guidelines®): multiple myeloma version 2.2026. (2025). Available from: www.nccn.org/guidelines/
7.
Dimopoulos MA, Moreau P, Terpos E et al. Multiple myeloma: EHA-ESMO Clinical Practice Guidelines for diagnosis, treatment and follow-up. Hemasphere 5(2), e528 (2021).
8.
FDA. Oncology (cancer) / hematologic malignancies approval notifications [updated July 2, 2025]. Available from: https://www.fda.gov/drugs/resources-information-approved-drugs/oncology-cancer-hematologic-malignancies-approval-notifications
9.
Tanaka S, Igarashi A, De Moor R et al. A targeted review of worldwide indirect treatment comparison (ITC) guidelines and best practices. Value Health 27(9), 1179–1190 (2024).
•• Identifies and compares jurisdiction-specific methodology and reporting recommendations. It also highlights the global acceptance of various indirect treatment comparison (ITC) techniques.
10.
Dias S, Sutton AJ, Ades A, Welton NJ. Evidence synthesis for decision making 2: a generalized linear modeling framework for pairwise and network meta-analysis of randomized controlled trials. Med. Decis. Making 33(5), 607–617 (2013).
11.
Phillippo D, Ades T, Dias S, Palmer S, Abrams KR, Welton N. NICE DSU Technical Support Document 18: Methods for population-adjusted indirect comparisons in submissions to NICE. NICE Decision Support Unit, UK (2016).
12.
Samjoo IA, Worthington E, Haltner A et al. The importance of considering differences in study and patient characteristics before undertaking indirect treatment comparisons: a case study of siponimod for secondary progressive multiple sclerosis. Curr. Med. Res. Opin. 36(7), 1145–1156 (2020).
13.
Cope S, Toor K, Popoff E et al. Critical appraisal of published indirect comparisons and network meta-analyses of competing interventions for multiple myeloma. Value Health 23(4), 441–450 (2020).
•• This critical appraisal highlights the relevance and credibility of published ITCs in relapsed/refractory multiple myeloma (RRMM) and reported key potential treatment effect modifiers as identified by clinical experts.
14.
Phillippo DM, Ades AE, Dias S, Palmer S, Abrams KR, Welton NJ. Methods for population-adjusted indirect comparisons in health technology appraisal. Med. Decis. Making 38(2), 200–211 (2018).
•• Highlights methodological requirements, particularly in regards to TEMs and prognostics factors (PFs), when conducting anchored or unanchored population-adjusted indirect comparisons.
15.
Austin PC. Balance diagnostics for comparing the distribution of baseline covariates between treatment groups in propensity-score matched samples. Stat. Med. 28(25), 3083–3107 (2009).
16.
Austin PC. Variance estimation when using inverse probability of treatment weighting (IPTW) with survival analysis. Stat. Med. 35(30), 5642–5655 (2016).
17.
Phillippo DM, Dias S, Ades AE et al. Multilevel network meta-regression for population-adjusted treatment comparisons. JR Stat. Soc. Ser. A Stat. Soc. 183(3), 1189–1210 (2020).
18.
Freitag A, Gurskyte L, Sarri G. Increasing transparency in indirect treatment comparisons: is selecting effect modifiers the missing part of the puzzle? A review of methodological approaches and critical considerations. J. Comp. Eff. Res. 12(10), e230046 (2023).
•• Highlights the lack of detailed guidance on how to systematically identify EMs for ITCs in the context of health technology assessment decision making.
19.
Vanier A, Fernandez JA-O, Kelley S et al. Rapid access to innovative medicinal products while ensuring relevant health technology assessment. Position of the French National Authority for Health. BMJ Evid. Based Med. 29(1), 1–5 (2024).
20.
Kumar S, Leleu X, Weisel K et al. PB2090: systematic literature review of prognostic factors for relapsed/refractory multiple myeloma. Hemasphere 7(Suppl. 3), e9426734 (2023).
•• Identifies potential PFs for both response and survival outcomes reported in either observational studies or clinical trials of RRMM.
21.
Towle K, Caisip C, Karampampa K, Cope S, Dhanda D. CO53: a review of treatment effect modifiers and/or prognostic factors included in unanchored indirect treatment comparisons (ITCs) Involving triple-class exposed (TCE) relapsed/refractory multiple myeloma (RRMM). Value Health 26(12), S23–S24 (2023).
•• Identifies both TEMs and PFs in unanchored ITCs of TCE RRMM.
22.
Kumar S, Leleu X, Weisel KC et al. Ranking the importance of prognostic factors for relapsed/refractory multiple myeloma: International physician panel consensus following a systematic literature review. Clin. Lymphoma Myeloma Leuk. (2025) (Epub ahead of print).
23.
Bookshelf Overview. Bookshelf overview. National Center for Biotechnology Information, MD, USA (2010). Available from: https://www.ncbi.nlm.nih.gov/books/NBK554850/
24.
Higgins JPT, Thomas J, Chandler J et al. Cochrane handbook for systematic reviews of interventions version 6.5 [updated August 22, 2024]. Cochrane. (2024). Available from: www.cochrane.org/handbook
25.
Moher D, Liberati A, Tetzlaff J, Altman DG, Group P. Preferred reporting items for systematic reviews and meta-analyses: the PRISMA statement. PLoS Med. 6(7), e1000097 (2009).
26.
Christensen R, Bours MJL, Nielsen SM. Effect modifiers and statistical tests for interaction in randomized trials. J. Clin. Epidemiol. 134, 174–177 (2021).
•• Provides a concise and nontechnical explanation of the use of simple statistical tests for interaction to identify effect modifiers in RCTs.
27.
Baranello G, Gorni K, Daigl M et al. Prognostic factors and treatment-effect modifiers in spinal muscular atrophy. Clin. Pharmacol. Ther. 110(6), 1435–1454 (2021).
•• Establishes a broad threshold for statistical significance (p < 0.2) to evaluate association between outcomes and prognostic/predictive factors.
28.
Phillippo DM, Dias S, Elsada A, Ades AE, Welton NJ. Population adjustment methods for indirect comparisons: a review of National Institute for Health and Care Excellence technology appraisals. Int. J. Technol. Assess. Health Care 35(3), 221–228 (2019).
29.
Prawitz T, Popat R, Suvannasankha A et al. DREAMM-2: indirect comparisons of belantamab mafodotin vs. selinexor + dexamethasone and standard of care treatments in relapsed/refractory multiple myeloma. Adv. Ther. 38(11), 5501–5518 (2021).
30.
Dytfeld D, Wróbel T, Jamroziak K et al. Carfilzomib, lenalidomide, and dexamethasone or lenalidomide alone as maintenance therapy after autologous stem-cell transplantation in patients with multiple myeloma (ATLAS): interim analysis of a randomised, open-label, Phase III trial. Lancet Oncol. 24(2), 139–150 (2023).
31.
Jackson GH, Davies FE, Pawlyn C et al. Response-adapted intensification with cyclophosphamide, bortezomib, and dexamethasone versus no intensification in patients with newly diagnosed multiple myeloma (Myeloma XI): a multicentre, open-label, randomised, Phase III trial. Lancet Haematol. 6(12), e616–e629 (2019).
32.
Cavo M, Gay F, Beksac M et al. Autologous haematopoietic stem-cell transplantation versus bortezomib-melphalan-prednisone, with or without bortezomib-lenalidomide-dexamethasone consolidation therapy, and lenalidomide maintenance for newly diagnosed multiple myeloma (EMN02/HO95): a multicentre, randomised, open-label, Phase III study. Lancet Haematol. 7(6), e456–e468 (2020).
33.
Richardson PG, Jacobus SJ, Weller EA et al. Triplet therapy, transplantation, and maintenance until progression in myeloma. N. Engl. J. Med. 387(2), 132–147 (2022).
34.
Moreau P, Hulin C, Perrot A et al. Maintenance with daratumumab or observation following treatment with bortezomib, thalidomide, and dexamethasone with or without daratumumab and autologous stem-cell transplant in patients with newly diagnosed multiple myeloma (CASSIOPEIA): an open-label, randomised, Phase III trial. Lancet Oncol. 22(10), 1378–1390 (2021).
35.
Moreau P, Attal M, Hulin C et al. Bortezomib, thalidomide, and dexamethasone with or without daratumumab before and after autologous stem-cell transplantation for newly diagnosed multiple myeloma (CASSIOPEIA): a randomised, open-label, Phase III study. Lancet 394(10192), 29–38 (2019).
36.
Facon T, Kumar SK, Plesner T et al. Daratumumab, lenalidomide, and dexamethasone versus lenalidomide and dexamethasone alone in newly diagnosed multiple myeloma (MAIA): overall survival results from a randomised, open-label, Phase III trial. Lancet Oncol. 22(11), 1582–1596 (2021).
37.
Dimopoulos MA, Richardson PG, Bahlis NJ et al. Addition of elotuzumab to lenalidomide and dexamethasone for patients with newly diagnosed, transplantation ineligible multiple myeloma (ELOQUENT-1): an open-label, multicentre, randomised, Phase III trial. Lancet Haematol. 9(6), e403–e414 (2022).
38.
Girerd N, Rabilloud M, Pibarot P, Mathieu P, Roy P. Quantification of treatment effect modification on both an additive and multiplicative scale. PloS ONE 11(4), e0153010 (2016).
39.
Chretien ML, Hebraud B, Cances-Lauwers V et al. Age is a prognostic factor even among patients with multiple myeloma younger than 66 years treated with high-dose melphalan: the IFM experience on 2316 patients. Haematologica 99(7), 1236–1238 (2014).
40.
Cordas Dos Santos DM, Saliba RM, Patel R et al. age is a prognostic factor for the overall survival of patients with multiple myeloma undergoing upfront autologous hematopoietic stem cell transplantation. Biol. Blood Marrow Transplant. 26(6), 1077–1083 (2020).
41.
Bird S, Cairns D, Menzies T et al. Sex differences in multiple myeloma biology but not clinical outcomes: results from 3894 patients in the Myeloma XI Trial. Clin. Lymphoma Myeloma Leuk. 21(10), 667–675 (2021).
42.
Greipp PR, Miguel JS, Durie BG et al. International staging system for multiple myeloma. J. Clin. Oncol. 23(15), 3412–3420 (2005).
43.
Palumbo A, Avet-Loiseau H, Oliva S et al. Revised International Staging System for multiple myeloma: a report from International Myeloma Working Group. J. Clin. Oncol. 33(26), 2863–2869 (2015).
44.
Afram G, Gran C, Borg Bruchfeld J et al. Impact of performance status on overall survival in patients with relapsed and/or refractory multiple myeloma: real-life outcomes of daratumumab treatment. Eur. J. Haematol. 105(2), 196–202 (2020).
45.
Laing AA, Geddes C, Soutar R. Renal impairment at presentation in multiple myeloma continues to be associated with poor survival. Brit. J. Haematol. 169(6), 901–902 (2015).
46.
Rose CJ, Ohm IK, Giske L, Næss GE, Fretheim A. Effect modification in network meta-analyses for relapsed/refractory multiple myeloma: systematic review and meta-analysis. BMJ Open 13(8), e067966 (2023).
47.
Pawlyn C, Schjesvold FH, Cairns DA et al. Progression-free survival as a surrogate endpoint in myeloma clinical trials: an evolving paradigm. Blood Cancer J. 14(1), 134 (2024).
48.
Bladé J, Beksac M, Caers J et al. Extramedullary disease in multiple myeloma: a systematic literature review. Blood Cancer J. 12(3), 45 (2022).
49.
Abdallah NH, Binder M, Rajkumar SV et al. A simple additive staging system for newly diagnosed multiple myeloma. Blood Cancer J. 12(1), 21 (2022).
50.
D'agostino M, Cairns DA, Lahuerta JJ et al. Second revision of the International Staging System (R2-ISS) for overall survival in multiple myeloma: a European Myeloma Network (EMN) report within the HARMONY project. J. Clin. Oncol. 40(29), 3406–3418 (2022).
51.
NICE. Health Technology Evaluations: The Manual. (2022).
52.
IQWiG. General Methods (Version 6.0 of 5 November 2020). (2020).
Information & Authors
Information
Published In
Copyright
© 2025 The authors. This work is licensed under the Attribution-NonCommercial-NoDerivatives 4.0 Unported License
History
Received: 12 December 2024
Accepted: 8 July 2025
Published online: 12 August 2025
Keywords:
Topics
Authors
Metrics & Citations
Metrics
Article Usage
Article usage data only available from February 2023. Historical article usage data, showing the number of article downloads, is available upon request.
Citations
How to Cite
Identification of treatment effect modifiers and prognostic factors in newly diagnosed and relapsed or refractory multiple myeloma. (2025) Journal of Comparative Effectiveness Research. DOI: 10.57264/cer-2024-0180
Export citation
Select the citation format you wish to export for this article or chapter.