Estimating utility values for non-alcoholic steatohepatitis health states: a discrete choice experiment
Publication: Journal of Comparative Effectiveness Research
Abstract
Background: This study estimated utility values for non-alcoholic steatohepatitis (NASH). Previous studies have assumed that health-related quality of life does not vary between the early stages of NASH. Materials & Methods: Discrete choice experiment (DCE) surveys estimated the value of avoiding fibrosis progression. Patients also completed the EQ-5D-5L. Marginal rates of substitution estimated utility change associated with fibrosis progression. Results: DCE surveys were completed by the UK general public (n = 520) and patients with NASH (n = 154). The utility decline between fibrosis stages F1 and F4 decompensated was between -0.521 to -0.646 (depending on method). Conclusion: Three methods were used to estimate utilities for NASH, each one showed sensitivity to advancing fibrosis, including in the early stages, which is often considered asymptomatic.
Tweetable abstract
Preventing worsening in liver fibrosis can produce net gains in health and quality of life. This new research explores methods for valuing these gains in health
Plain language summary
What is this article about?
Nonalcoholic steatohepatitis (NASH) is a form of nonalcoholic fatty liver disease (NAFLD). In addition to excessive fat in the liver, NASH also includes liver inflammation and damage. Over time, NASH can cause permanent liver damage. As the condition worsens, it can have a more severe impact on patients' health-related quality of life. However, few studies have explored the impact of NASH on patients at different stages of the condition, particularly in the early stages. This study explored the impact of NASH on health-related quality of life at different disease stages.
What were the results?
Patients with NASH experience significant impacts on health-related quality of life, which becomes progressively worse as the condition worsens, even in the early stages of disease.
What do the results of the study mean?
The results show the importance patients with NASH and the public place on avoiding worsening NASH and the potential benefits of preventing worsening NASH. These results could also be used to estimate the cost-effectiveness of new NASH treatments.
Nonalcoholic steatohepatitis (NASH) is the progressive form of nonalcoholic fatty liver disease (NAFLD). NASH is the inflammatory subtype of NAFLD and is characterized by steatosis as well as evidence of hepatocyte injury (ballooning) and inflammation, with or without fibrosis [1]. Indeed, NASH is classified in five stages according to levels of fibrosis ranging from none (stage F0) to cirrhosis (F4), which can lead to end-stage liver disease and hepatocellular carcinoma (HCC) [1–3]. Comorbidities such as obesity, high blood pressure and diabetes increase the risk of NAFLD progressing to NASH [4]. One study estimated the overall global prevalence of NASH to be 1.5–6.5% [5]. Currently, there are no approved treatments for NASH, but there are a number in late stages of clinical development. The present standard of care is lifestyle modification, although some patients are prescribed off-label pharmacologic treatments, such as vitamin E, statins and metformin [6].
NASH has often been described as an asymptomatic condition [7] particularly in its early stages, however studies are increasingly recognizing that individuals with NASH do experience symptoms such as fatigue, malaise, pruritis and abdominal pain [6,8]. A recent review showed that people living with NASH had lower health-related quality of life (HRQL) compared with the general population and people with NAFLD [9]. This review described the different impacts of NASH on patients' daily life, including dietary restrictions, reduced sleep, negative impacts on relationships, limited social activity, medication/healthcare related frustration and fear or worry about the future. There is also emerging evidence to suggest that worsening fibrosis has a more severe impact on HRQL [8–10].
The adoption of new treatments in many countries requires evidence of the HRQL impact of the condition and treatment. For agencies such as the National Institute for Health and Care Excellence (NICE) in the UK, the HRQL data should be measured as utility weights which are used to estimate quality adjusted life years (QALYs). Utility weights reflect the perceived value of health on a scale from 0 (equal to dead) to 1 (full health) and should reflect societal preferences. Previous research in NASH has presented utility scores for early fibrosis stages grouped together, suggesting an assumption that there is no difference in HRQL between these early stages (e.g., O'Hara et al., reported utilities for patients at F0, F1 and F2 to be 0.80) [11]. Similarly, Zhang et al., reported a cost-utility analysis including a utility of 0.84 for patients in F1, F2 and F3 [12]. It may be correct that HRQL does not vary in the early stages of NASH, but this is an empirical question and should not be based on an assumption.
Probably the most common method for generating utility weights is the EQ-5D [13]. However, the EQ-5D is often criticized for being insensitive to changes in some conditions, and in such circumstances alternative methods can be used. In this study we also explore the use of discrete choice experiment (DCE) methods for estimating utilities for different fibrosis stages. DCEs are an alternative method for estimating utilities where the survey includes attributes which describe quality of life and length of life [14]. The objectives of this study were to explore the HRQL impact at each stage of NASH and to then use different methods to value differences in HRQL associated with NASH fibrosis progression. The study also aimed to explore the sensitivity of the EQ-5D-5L to changes in fibrosis stage.
Methods
Study design
This study used a two-phase cross-sectional design consisting of qualitative interviews and online surveys. Both phases were reviewed by the Western Institutional Review Board (WIRB) and determined to be minimal risk and exempt from full review. All participants gave informed consent.
Qualitative phase
To explore the HRQL burden at each fibrosis stage, semi-structured interviews were conducted with NASH patients from the UK and USA with either biopsy or fibroscan confirmed fibrosis stage. Participants were recruited by a specialist patient recruitment agency. Interviews followed a semi-structured interview guide and explored symptoms and HRQL impacts. Participants were probed regarding the severity and frequency of any symptoms they mentioned. Questions also explored daily activities, emotional impact, work relationships, self-care,= and leisure activities. Interviews lasted 60 to 80 min and were recorded and transcribed.
Qualitative data were analysed using thematic analysis in MAXQDA [15]. This involved reading and re-reading the transcripts; generating a coding framework and then coding the transcripts. This then led to the identification of themes and relationships between themes.
Utility survey
The online survey was designed to estimate utility decrements associated with fibrosis stage progression. Separate surveys were developed for patients and the general public to derive patient and societal utilities, respectively. The development of the DCE was informed by the qualitative results and ISPOR best practice guidelines [16,17]. The DCE section of the survey started with an introduction to the task and, for the public version, background information about the condition (as shown in Appendix 1); the general public were asked to imagine they had a liver disease and were at stage F2. Patients with NASH were asked to respond to the survey questions in the context of their own fibrosis stage.
The DCE surveys described NASH outcomes in terms of different attributes which were combined into hypothetical choices. The survey also contained sociodemographic questions (including age, gender, ethnicity and employment status). Additional clinical questions were included in the patient survey to capture information about diagnosis, comorbidities and current fibrosis stage.
Survey development
Identification of survey attributes
A review of published studies, clinical trials, and regulatory documents (such as the Summary of Product Characteristics) and other grey literature was conducted. Attribute selection was also driven by the findings from the qualitative interviews with NASH patients [9,18–21].
A long list of possible attributes was identified for inclusion in the online DCE survey. The selection process was framed by the study objectives, and attributes were selected which were considered important from a patient perspective, and avoided potential overlap with other attributes. Attributes describing length of life and fibrosis stage attributes were included to estimate utility weights. As the symptoms and impacts of NASH correlate with fibrosis stage, it was decided to incorporate these concepts into the description of fibrosis stage. The DCE survey included length of life, fibrosis stage and mode of treatment administration. Draft descriptions of the attributes and attribute levels were developed based on the literature and the qualitative findings.
Survey content
Surveys were developed for patients and the general public. For the public version, participants were asked to imagine they were in F2 and the attribute levels described an improvement (by 1 stage), remain the same (F2), worsen by 1 stage (F3), worsen by 2 stages (F4 compensated), worsen by 3 stages (F4 decompensated). Length of life was also described in terms of five levels (overall length of life reduced by 12, 9, 6 or 3 years or no reduction). In the patient version, participants were asked to consider their own current fibrosis stage when considering the choice scenarios. This attribute was described according to two levels (fibrosis worsens by 1 stage, fibrosis remains the same). Length of life was described based on three levels (reduced by 12, 6 or 0 years). Both versions of the survey described treatment mode according to the same three levels (daily tablet, injection once a month and injection biweekly). The attributes and levels were combined into choice sets using a D-efficient design generated with NGene software version 1.2.1 [22]. The survey consisted of 15 choice sets for the general public version and 12 choice sets for the patient versions. Sample choice questions are shown in Appendix 2. The survey included background questions, and the patient survey included the EQ-5D-5L [13] and the NASH-Check (a disease-specific measure of HRQL) [23].
The surveys were reviewed in cognitive debrief interviews with NASH patients (n = 5), the general public (n = 5) and clinicians with experience of treating people with NASH (n = 2). The aim of these interviews was to check the clinical accuracy of the survey, patient relevance and understanding among patients and the public. Participants were asked to speak aloud as they read/completed the survey and provide feedback. Minor amendments were made after all interviews were completed based on the interview findings. The final attributes and levels for each survey are shown in Table 1.
| Attribute | Level 1 | Level 2 | Level 3 | Level 4 | Level 5 |
|---|---|---|---|---|---|
| General Public DCE | |||||
| Length of life | Overall life expectancy reduced by 0 years | Overall life expectancy reduced by 3 years | Overall life expectancy reduced by 6 years | Overall life expectancy reduced by 9 years | Overall life expectancy reduced by 12 years |
| Disease (fibrosis) stage | Stage 1 | Remain stable/Stage 2 | Stage 3 | Stage 4 | Stage 5 |
| How treatment is given | Treatment is a tablet taken daily at home | Treatment is an injection once a month | Treatment is an injection every 2 weeks | ||
| Patient DCE | |||||
|---|---|---|---|---|---|
| Length of life | Overall life expectancy reduced by 0 years | Overall life expectancy reduced by 6 years | Overall life expectancy reduced by 12 years | ||
| Disease (fibrosis) stage | Worsen by 1 stage over next 4 years | Remain stable over next 4 years | |||
| How treatment is given | Treatment is a tablet taken daily at home | Treatment is an injection once a month | Treatment is an injection every 2 weeks | ||
DCE: Discrete choice experiment.
Pilot
The DCE survey was piloted with the UK general public (n = 71, results not shown) to explore whether attribute coefficients were in the expected direction and to establish quality control thresholds for the survey data (e.g., excluding members of the general public completing the survey too quickly). A few minor amendments to the wording of the attribute descriptions were made to improve clarity. Based on an analysis of pilot data, participants who completed the DCE survey in <230 seconds were excluded from the main study analyses (estimated based on a reasonable minimal completion time and an optimal threshold for excluding respondents making ≥1 illogical responses).
Main study participants
Participants for the general population survey were recruited in the UK between March and April 2021 with sample quotas for age, gender, ethnicity and geographic location. Patients with NASH were recruited by a specialist patient recruitment agency. They were all aged over 18, had a diagnosis of NASH with their fibrosis stage confirmed by biopsy or fibroscan (participants did not specify which procedure was used for staging), had a fibrosis stage between 1 and 4 (compensated or decompensated) or HCC and lived in the UK or US. No formal sample size estimation was conducted; target sample sizes for each sample were based on sample sizes reported in previous valuation studies [24,25], best practice guidance [16,26] and recruitment feasibility. All eligible participants provided online informed consent.
Statistical analyses
Sociodemographic and clinical data were analyzed using descriptive statistics. NASH-CHECK data were scored based on the developers' scoring guidelines. EQ-5D-5L was scored with UK and US preference weights [27,28]. Discrete choice data were analyzed using a mixed-effects logit regression model [29] to estimate preference strength for each attribute while accounting for heterogeneity among respondents. These models are estimated using the maximum simulated likelihood approach. The logit model estimates beta coefficients for each attribute. For categorical variables, the coefficient indicates their importance with respect to a reference category. For the continuous reduction in life expectancy variable, the model presents the odds of selection for a 1-year reduction in life expectancy. Coefficients were converted to odds ratios (ORs) for ease of interpretation. An alternative-specific constant was added to the model to account for any ‘left’ bias (i.e., selecting the choice shown on the left more frequently) in respondent's choices.
The utility value for a change in fibrosis stage was estimated based on the marginal rates of substitution (MRS), which is estimated by taking a ratio of the coefficients for two attributes: the life expectancy coefficient for a 1-year reduction (obtained by entering life expectancy as a continuous variable into the models) and the change in fibrosis stage attribute. The MRS indicates the extent to which participants were willing to trade years of life to avoid certain levels of worsening fibrosis. The change in utility was calculated by dividing the MRS value for each fibrosis attribute level by the estimated remaining life expectancy of the sample. The life expectancy of the sample was estimated based on the average life expectancy for men and women in the UK and weighted according to the proportion of men and women in the sample [30]. Average remaining life expectancy for the patient and general public samples was 30.2 years and 34.4 years, respectively. In order to enable comparison of the utilities estimated using the different methods, the utilities for each NASH stage were then estimated using utility values for a change in NASH stage derived from the general public DCE, anchored using the patient EQ-5D estimates for NASH stage F2 based on UK preference weights, as shown in the equation below.
NASH stage utility value x = patient EQ-5D F2 utility value + utility for y stage improvement/worsening
Where x represents the NASH stage; y represents the general public DCE estimated change in utility for a specified change in NASH stages.
All quantitative data were analyzed in Stata version 16.0.
Supplementary analysis: predictors of EQ-5D utility values
An additional analysis was performed to explore the predictors of EQ-5D utility values, based on the UK preference weights, and to understand whether current fibrosis stage predicts EQ-5D utility values independent of the comorbidities that often accompany NASH. Linear regression models were used to identify univariate predictors of EQ-5D values. Significant univariate predictors were then included in a multivariate model to identify independent associations.
Results
Qualitative interviews
Semi-structured interviews were conducted with 17 NASH patients (with biopsy or fibroscan confirmed fibrosis stage) from the US or UK. Patients at all fibrosis stages reported symptoms they experience due to NASH. Fatigue (n = 17) was common at all stages and was more severe at advanced stages. The severity of the fatigue described ranged from feelings of tiredness through to chronic exhaustion.
“It's almost like you just feel whacked, like just not having any more energy to do anything. (NASH patient, F3)
Abdominal pain (n = 16) was also common at all stages, with some participants describing a stabbing/throbbing pain and others an aching/dull pain. Participants reported more frequent or more severe pain at more advanced fibrosis stages.
“Some days it would feel like somebody was stabbing me” (NASH patient, F1)“It's a real digging under the ribs, a real sharp pain.” (NASH patient, F2)
Other common symptoms included cognitive problems (n = 14), sleep issues (n = 15), itchy skin (n = 11) and nausea/vomiting/bloating (n = 10) but the impact of fibrosis stage on severity of these symptoms was less clear. Sweating (n = 3), bowel issues (n = 3) and weight gain (n = 3) were also reported but were less common. In addition to the symptomatic burden, patients also described how the symptomatic burden negatively impacted many areas of daily life and wellbeing, including daily, social and physical activities, emotional well-being, relationships and work.
“I mean going out with friends for one is not something that I do, because most days I feel sluggish and tired and in pain” (NASH patient, F2)
Impacts were more severe at advanced stages (F3 and F4), except for social activities and diet which had a similar impact across stages. Further detail on the results of the qualitative phase of this study have been published elsewhere [21].
General public survey sample
The general public sample (n = 520) were largely representative based on the UK census data but were slightly older than the population norm (Table 2) [31]. The prevalence of long-term conditions was also slightly higher than that observed in the latest UK opinions and lifestyle survey [32].
| General public (n = 520) | NASH patient sample (n = 154) | UK census data | ||
|---|---|---|---|---|
| Characteristic | % (n) | |||
| Age (years) | Mean (SD) | 48.5 (15.9) | 52.7 (11.7) | 39.4‡ |
| Range | 18–88 | 24–72 | ||
| Country | UK | 100% (520) | 10.4% (16) | |
| USA | NA | 89.6% (138) | ||
| Gender | Male | 48.1% (250)§ | 43.5% (67)¶ | 49%‡ |
| Ethnicity | White British or American | 91.5% (476)# | 42.2% (65)†† | 86%‡ |
| Employment status | Employed full or part-time | 58.6% (305)‡‡ | 33.1% (51)§§ | 62%‡ |
| Long-term condition | Yes | 44.6% (232) | NA | 36%¶¶ |
| No | 54.8% (285) | NA | ||
| Prefer not to answer | 0.6% (3) | NA | ||
| Time since NASH diagnosis (months) | Mean (SD) | NA | 63.0 (57.4) | |
| Range | NA | 2–376 | ||
| Median (IQR) | NA | 43.5 (22.5–88.0) | ||
| Missing | NA | 1.3% (2) | ||
| Time since last biopsy/fibroscan (months) | Mean (SD) | NA | 14.1 (33.9) | |
| Range | NA | 0–376 | ||
| Median (IQR) | NA | 8.0 (4.0–16.0) | ||
| Not known | NA | 2.6% (4) | ||
| Current fibrosis stage | Stage 1 | NA | 26.0% (40) | |
| Stage 2 | NA | 24.0% (37) | ||
| Stage 3 | NA | 27.9% (43) | ||
| Stage 4 compensated cirrhosis | NA | 12.3% (19) | ||
| Stage 4 decompensated cirrhosis | NA | 9.7% (15) | ||
| Liver cancer/hepatocellular carcinoma | NA | 0.0% (0) | ||
| Chronic conditions | Cardiovascular disease | 2.9% (15) | 12.3% (19) | |
| Type 2 diabetes | 7.3% (38) | 33.3% (51) | ||
| Type 1 diabetes | 1.4% (7) | 0.7% (1) | ||
| High blood pressure | 17.1% (89) | 35.1% (54) | ||
| High cholesterol | 12.5% (65) | 32.5% (50) | ||
| Obesity | 8.5% (44) | 18.2% (28) | ||
| Depression | 13.1% (68) | 18.2% (28) | ||
| Anxiety | 15.0% (78) | 13.0% (20) | ||
| Other | 13.9% (72) | 9.7% (15) | ||
| NASH symptoms/complications## | Ascites | NA | 20.1% (31) | |
| Gastrointestinal bleeding | NA | 9.1% (14) | ||
| Sleep apnoea | NA | 29.2% (45) | ||
| None of above | NA | 46.1% (71) | ||
†
all self-reported.
‡
Figures based on data from the 2011 United Kingdom national census for England and Wales (Office for National Statistics https://www.ons.gov.uk/census).
§
Other response options (Female: 51.7% [n = 269], Other: 0.0% [n = 0], Prefer not answer: 0.2% [n = 1]).
¶
Other response options (Female: 56.5% [n = 87], Other: 0.0% [n = 0], Prefer not answer: 0.0% [n = 0]).
#
Other response options (Black: 1.4% [n = 7], Asian: 4.8% [n = 25], Mixed: 1.5% [n = 8], Other: 0.2% [n = 1], Prefer not to answer: 0.6% [n = 3]).
††
Other response options (Black American: 22.7% [n = 35], Hispanic and Latino Americans: 13.6% [n = 21], Asian British/American: 8.4% [n = 13], Mixed British/American: 5.8% [n = 9], Other: 2.6% [n = 4], Prefer not to answer: 4.5% [n = 7]).
‡‡
Other response options (Full-time homemaker/caregiver: 6.2% [n = 32], Retired: 21.7% [n = 113], Seeking work/unemployed: 5.8% [n = 30], Unable to work due to disability: 4.0% [n = 21], Student: 2.7% [n = 14], Other: 0.8% [n = 4], Prefer not to answer: 0.2% [n = 1]).
§§
Other response options (Full-time homemaker/caregiver: 11.0% [n = 17], Retired: 25.3% [n = 39], Seeking work/unemployed: 4.6% [n = 7], Unable to work due to disability: 18.8% [n = 29], Student: 0.0% [n = 0], Other: 6.5% [n = 10], Prefer not to answer: 0.7% [n = 1]).
¶¶
Figure based on data from the 2013 UK Opinions and Lifestyle Survey (Office for National Statistics https://www.ons.gov.uk/peoplepopulationandcommunity/healthandsocialcare/healthandlifeexpectancies/compendium/opinionsandlifestylesurvey/2015-03-19/adulthealthingreatbritain2013.
##
All self-reported, therefore may not be clinically diagnosed or confirmed.
NASH: Non-alcoholic steatohepatitis; SD: Standard deviation.
Patient survey sample
The patient sample (n = 154) are shown in Table 2. All fibrosis stages from F1 to F4 decompensated were captured, with most patients currently at F1 to F3 (77.9%). A wide range of comorbidities were reported, with most patients reporting at least one comorbidity (80.5%).
General public DCE survey results
All attributes were significant (p < 0.001) independent predictors of choice (Table 3). Participants preferred to avoid a reduction in years of life. The odds of preferring an outcome which reduced length of life by one year was 0.675, (95% confidence intervals, 95% CI = 0.646 to 0.705). By extrapolating the coefficient for one year, the estimated odds of preferring an outcome which reduced length of life by twelve years was close to zero (OR: 0.009, 95% CI = 0.005, 0.015). Participants also placed significant weight on avoiding worsening fibrosis. The odds ratio was lowest for scenarios associated with a 3-stage worsening (OR: 0.003, 95% CI: 0.002 to 0.006). Treatments that were administered via an injection were more likely to be chosen compared with oral tablets; the highest odds ratio was observed for biweekly injections (OR: 3.514, 95% CI: 2.716 to 4.545).
| Coeff. | OR | 95% CI | p-value | |
|---|---|---|---|---|
| Alternative-specific constant Ref.: treatment B (right column) | 0.107 | 1.113 | (1.006, 1.230) | 0.038 |
| Reduction in life expectancy 1-year decrease | -0.393 | 0.675 | (0.646, 0.705) | <0.001 |
| Fibrosis stage | ||||
| Improved by 1 stage (stage F1) | 1.373 | 3.947 | (2.914, 5.347) | <0.001 |
| Remained the same (stage F2) | Reference | |||
| Worsened by 1 stage (stage F3) | -0.889 | 0.411 | (0.337, 0.502) | <0.001 |
| Worsened by 2 stages (stage F4 compensated) | -2.311 | 0.099 | (0.073, 0.134) | <0.001 |
| Worsened by 3 stages (stage F4 decompensated) | -5.681 | 0.003 | (0.002, 0.006) | <0.001 |
| How treatment is given | ||||
| Tablet (once daily) | Reference | |||
| Injection (monthly) | 0.402 | 1.495 | (1.305, 1.714) | <0.001 |
| Injection (biweekly) | 1.257 | 3.514 | (2.716, 4.545) | <0.001 |
F1: Fibrosis stage 1; F2: Fibrosis stage 2; F3: Fibrosis stage 3; F4: Fibrosis stage 4; CI: Confidence interval; OR: Odds ratio.
Estimation of utility for change in fibrosis
Based on the MRS estimates rescaled against remaining average life expectancy, utility values for an increase and decline in utility (disutility) were estimated (Table 4). Larger disutilities were observed for worsening to more advanced fibrosis stages, with a particularly marked decline observed for worsening to stage F4 decompensated compared with remaining at stage F2 (-0.420, 95% CI: -0.372, -0.467).
| Patient survey | General public DCE (n = 520) | ||
|---|---|---|---|
| Fibrosis stage | EQ-5D UK utilities (95% CI), n | Change in utility (95% CI)† | Estimated utility (95% CI)‡ |
| F1 | 0.768 (0.689, 0.848), 40 | +0.101 (0.079, 0.124) | 0.772 (0.750, 0.795) |
| F2 | 0.671 (0.607, 0.736), 37 | Ref. | - |
| F3 | 0.513 (0.439, 0.587), 43 | -0.066 (-0.051, -0.080) | 0.605 (0.591, 0.620) |
| F4 compensated | 0.252 (0.097, 0.407), 19 | -0.171 (-0.148, -0.193) | 0.500 (0.478, 0.523) |
| F4 decompensated | 0.122 (-0.041, 0.285), 15 | -0.420 (-0.372, -0.467) | 0.251 (0.204, 0.299) |
†
Positive values indicate an increase in utility, whereas negative values represent a utility decline (or a disutility).
‡
Estimated using from the change in utility values derived from the general public DCE anchored using the patient EQ-5D estimates for F2 based on UK preference weights (0.671) (e.g., F1 = 0.671 + 0.101 = 0.772).
F1: Fibrosis stage 1; F2: Fibrosis stage 2; F3: Fibrosis stage 3; F4: Fibrosis stage 4.
Patient sample DCE survey results
All attributes were significant (p < 0.001) independent predictors of choice (Table 5). People with NASH expressed a preference to avoid a reduction in years of life (per year of life lost: OR 0.611, 95% CI: 0.528, 0.709) and worsening fibrosis (per 1-stage worsening: OR 0.010, 95% CI: 0.003, 0.036). By extrapolating the coefficient for one year of life lost, the estimated odds of preferring an outcome which reduced length of life by twelve years was close to zero (OR: 0.003, 95% CI = 0.000, 0.016). Patients were also averse to receiving treatment via injections; monthly (OR: 0.365, 95% CI: 0.213, 0.624) and biweekly injections (OR: 0.072, 95% CI: 0.030, 0.171) were significantly less likely to be chosen compared with daily tablets.
| Coeff. | OR | 95% CI | p-value | |
|---|---|---|---|---|
| Alternative-specific constant Ref.: treatment B (right column) | -0.231 | 0.794 | (0.591, 1.065) | 0.124 |
| Reduction in life expectancy 1-year decrease | -0.492 | 0.611 | (0.528, 0.709) | <0.001 |
| Fibrosis stage | ||||
| Remained the same | Reference | |||
| Worsened by 1 stage | -4.655 | 0.010 | (0.003, 0.036) | <0.001 |
| How treatment is given | ||||
| Tablet (once daily) | Reference | |||
| Injection (monthly) | -1.008 | 0.365 | (0.213, 0.624) | <0.001 |
| Injection (biweekly) | -2.634 | 0.072 | (0.030, 0.171) | <0.001 |
F1: Fibrosis stage 1; F2: Fibrosis stage 2; F3: Fibrosis stage 3; F4: Fibrosis stage 4; CI: Confidence interval; OR: Odds ratio.
Estimation of utility for change in fibrosis
Based on the mixed effects logit model results for the whole patient sample, the disutility for a 1-stage worsening in fibrosis was -0.313 (95% CI: -0.223, 0.-403). Further analyses were conducted stratifying the sample by fibrosis stage (stage 1–2; stage 3; stage 4 compensated and decompensated). Due to small subgroup sample sizes, these analyses were conducted using conditional logit models, which do not account for preference heterogeneity across the sample. Using these results, larger disutilities for a 1-stage worsening in fibrosis were estimated for patients at more advanced fibrosis stages (data provided in Appendix 3).
Patient utilities were also estimated for each fibrosis stage using patient reported EQ-5D scores. Utilities were estimated for all patients using both UK and USA preference weights. Utility values were lower for more advanced fibrosis stages (Figure 1). Utilities declined between each fibrosis stage, but the largest decrement was reported between stage 3 and stage 4 compensated. US and UK utility values were comparable at early fibrosis stages but US values were markedly lower than UK values at more severe stages. A comparison between patient-derived utilities based on EQ-5D values, estimated using UK preference weights, and utilities derived from the general public DCE, anchored using the patient EQ-5D F2 utility value, is shown in Table 4. The utility values are comparable for fibrosis stage 1, but the general public estimates are substantially higher for fibrosis stages ≥3 when compared with the patient-derived data.
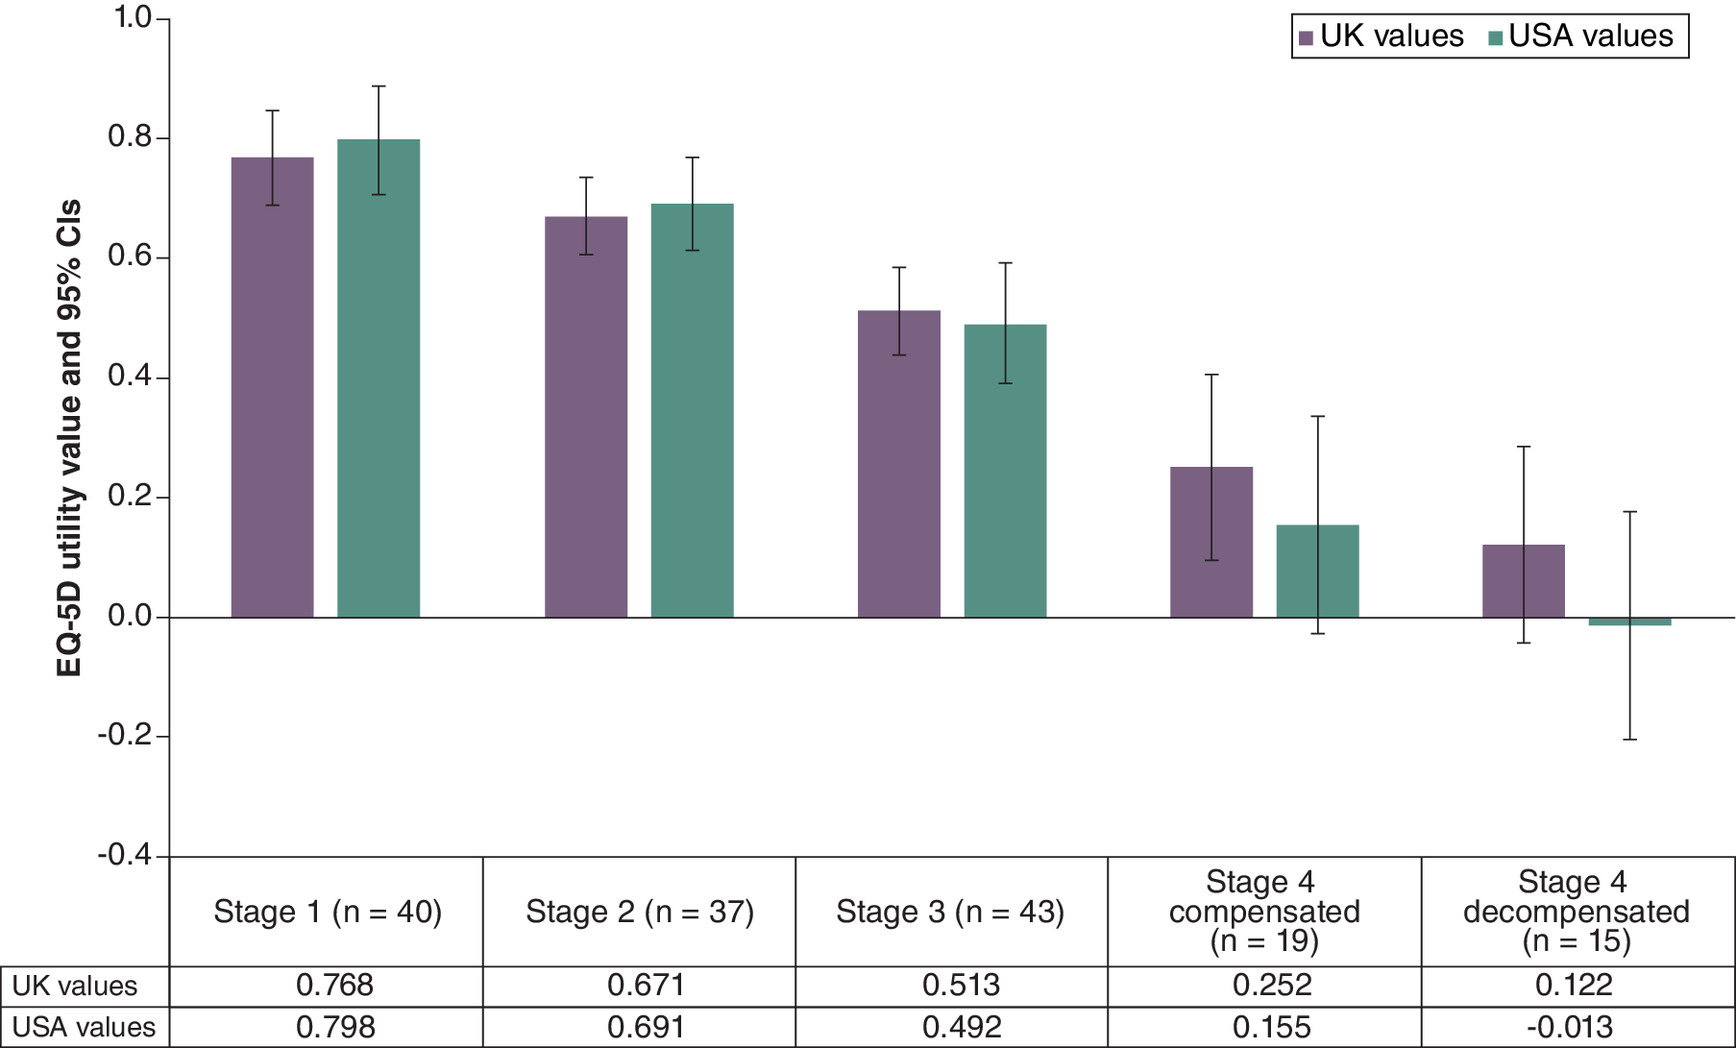
Figure 1. EQ-5D utility values by fibrosis stage based on UK and US preference weights (n = 154).
CI: Confidence interval.
NASH check results
People in more advanced fibrosis stage reported worse symptom scores on the NASH-CHECK. Large differences between F1 and F4 fibrosis stage were observed for the abdominal pain, abdominal bloating and physical fatigue scores. Large differences were also observed across all subscales, but they were particularly marked for social impact and activity limitations. All NASH Check results are provided in the Appendix 4.
Supplementary analysis: predictors of EQ-5D utility values
Significant univariate predictors (p < 0.05) of EQ-5D utility values included current fibrosis stage, age, years diagnosed with NASH, employment status, cardiovascular disease, Type 2 diabetes, high cholesterol, obesity, depression and anxiety. Multivariate analysis showed that only current fibrosis stage, cardiovascular disease, depression and anxiety were significantly associated with EQ-5D utility values after adjusting for all other significant univariate predictors (see Appendix File 5). This suggests that current fibrosis stage is associated with EQ-5D utilities independently of other comorbidities. Years diagnosed with NASH and employment were not included in the multivariate model as they were moderate to highly correlated with age (r = 0.39–0.59) and the variance inflation factor indicated some evidence of multicollinearity (values for abovementioned variables ranged between 2.35 and 3.87).
Discussion
This study was designed to explore if HRQL is different in different NASH fibrosis stages. Qualitative methods, HRQL assessments and stated preference surveys were used to explore this issue and the study produced quite consistent results. Patients in more severe NASH fibrosis stages reported more symptoms and a greater burden of disease in the qualitative research undertaken. In the quantitative phase, we also found that patients in more severe fibrosis stages reported worse HRQL using the EQ-5D-5L and the disease-specific NASH-CHECK measure. People with NASH had a strong preference to avoid worse liver fibrosis. In a parallel preference survey, the general public also expressed a strong preference to avoid worse fibrosis stages which was used to provide an alternative estimate of health state utility. Also, there was no evidence from the current study that EQ-5D was not sensitive enough to measure the effect of fibrosis on HRQL. The study provides evidence from different sources that HRQL burden increases with worsening liver fibrosis.
We believe that this study advances our understanding of the impact of the early stages of NASH on patients. Previous studies reporting utilities for NASH have assumed that HRQL is the same between F0 to F3 [11,12], however as the current study found a utility difference of 0.255 between F1 and F3 (from the patient EQ-5D data) this assumption was not supported by the current study. Making this assumption in a cost–effectiveness model may miss important aspects of benefit in treatments that are effective in delaying or preventing further decline in fibrosis. There may often be merit in testing assumptions regarding a model structure with patient-derived data. We believe that this study provides an example of why incorporating patient views in cost–effectiveness model structures can be a valuable step. The qualitative data illustrated the nature of the patient burden experienced. The subsequent survey data was able to quantify that. Declines in HRQL may be explained by a wide range of impacts, including worsening symptoms, activity impairment, emotional wellbeing and social functioning, as evidenced by the NASH-CHECK data.
Limited previous research has reported worsening symptoms or HRQL in more advanced stages of NASH. A study of patients with NAFLD including patients with NASH found that worsening of fibrosis was independently associated with significantly worse physical HRQL compared with no fibrosis [33]. Another study found that patients with F4 fibrosis reported worse HRQL on several outcome measures compared with patients with F3 fibrosis [10]. The current study supports these findings, and to our knowledge is the first study to report separate utilities and NASH CHECK scores for patients in each fibrosis stage.
There are important limitations in this study which affect our interpretation of the data. Patients with NASH commonly experience comorbidities and people with more severe disease may experience them more frequently. This could lead to an overestimation of the impact of fibrosis on HRQL. In this study, regression analyses estimated the impact of fibrosis stage on EQ-5D utility values after controlling for comorbidities. However, we accept that the research question in this study would have been better addressed with a longitudinal study. Another limitation of the patient survey is that inclusion required a biopsy or fibroscan confirmed fibrosis stage. Although liver biopsy is the gold standard for determining fibrosis stage, it is an invasive procedure that is not performed routinely, particularly in the UK, therefore participants whose fibrosis stage was confirmed through fibroscan were also included in the study. As fibroscan is not the gold standard method for staging fibrosis, this limitation should be considered when interpreting the study results. In addition, although most patients had a biopsy or fibroscan in the 2 years prior to completion of the survey, some participants had not had a biopsy/fibroscan for many years. It is therefore possible that these patients' fibrosis stage may have been misclassified. It was also not possible to recruit large samples of participants with more advanced fibrosis stages, which limits the certainty of the findings. In the DCE, although the attribute selection process aimed to avoid conceptual overlap, it is possible that some participants may have perceived an overlap between some attributes. For example, advancing fibrosis is directly related to a reduction in life expectancy and its possible that participants may have perceived these as correlated. Furthermore, the patient and general population results differed in terms of preference for mode of treatment administration, with patients preferring tablets and the general population preferring injections (stronger preference for more frequent injections). The general public preference for more frequent injections rather than tablets seems counter-intuitive and is unexplained in the current study. There are several possible reasons for this result, one possibility is that although no details about the treatment other than the mode of administration were provided, participants may have inferred that a regular injection may have greater efficacy than a tablet. It is also possible that as the other two attributes were such strong predictors of choice, the significant result for the mode of administration may have been artifactual.
In the general population DCE participants were asked to imagine themselves in the health states described in the choice sets and were provided information to do that. The DCE was kept deliberately simple to aid comprehension. However, it is possible that the general public did not fully understand how the disease would affect daily life. The survey development was informed by a review of existing literature and qualitative research with NASH patients, and the survey content was validated through cognitive debriefing interviews with patients, clinicians and members of the public and through pilot testing. The pilot study also informed various quality control procedures, including the implementation of a minimum time limit for the public survey to exclude any participants speeding through the questionnaire as well as a number of amendments to the survey to improve clarity. Furthermore, as the general population DCE estimated a value for advancing or improving fibrosis stages, a utility estimate was required to ‘anchor’ the values to in order to estimate a value for each stage. In this study the ‘anchor’ was taken from the patient EQ-5D results, using a different anchor would produce different estimates.
Conclusion
This study uses three different approaches to estimate the disutilities associated with NASH fibrosis stage progression. Each approach showed that disutilities were greater for more advanced fibrosis stages, including in the earlier stages of fibrosis. Larger disutilities were derived from the patient EQ-5D data compared with the general public DCE estimates (which possibly reflects the additional impact of comorbidities). Together these data illustrate the burden of NASH and we believe the importance of gathering the patient perspective on the impact of a disease when developing economic evaluations.
Summary points
•
Previous utility studies in non-alcoholic steatohepatitis (NASH) have grouped together the earlier fibrosis stages into one health-state utility value.
•
Limited research has explored the health-related quality of life impact of NASH at different fibrosis stages.
•
Qualitative interviews showed that participants at all fibrosis stages experience symptoms from NASH.
•
Fatigue and abdominal pain were common at all stages, patients at more advanced stages reported greater severity.
•
Patient-completed EQ-5D-5L and NASH-CHECK also showed greater health-related quality of life impact at more advanced stages.
•
Discrete choice experiment (DCE) surveys showed that both patients and the general public showed a strong preference to avoid worse liver fibrosis.
•
The study provides estimates of utility values for each fibrosis stage (F1 – F4 decompensated) from three different sources (patient EQ-5D-5L, patient DCE, general public DCE).
•
The study provides support for the sensitivity of the EQ-5D-5L in NASH.
Author contributions
All authors are responsible for the work described in this article. D Aggio, K Gallop and AJ Lloyd were responsible for data acquisition and analysis. All authors were responsible for drafting and revision of the manuscript.
Acknowledgments
The authors would like to thank the participants who gave their time to participate in this study.
Financial disclosure
Financial support for this study was provided by a contract with Boehringer Ingelheim International GmbH. The funding agreement ensured the authors' independence in designing the study, interpreting the data, writing, and publishing the report. The authors have no other relevant affiliations or financial involvement with any organization or entity with a financial interest in or financial conflict with the subject matter or materials discussed in the manuscript apart from those disclosed.
Competing interest disclosure
D Aggio, K Gallop and AJ Lloyd are employees of Acaster Lloyd Consulting Ltd. Acaster Lloyd Consulting received funding from Boehringer Ingelheim. V Wittrup-Jensen and S Fazeli Farsani are employees of Boehringer Ingelheim. The authors have no other competing interests or relevant affiliations with any organization or entity with the subject matter or materials discussed in the manuscript apart from those disclosed.
Writing disclosure
No writing assistance was utilized in the production of this manuscript.
Ethical conduct of research
The authors state that they have obtained appropriate institutional review board approval. In addition, informed consent has been obtained from all human participants involved.
Open access
This work is licensed under the Creative Commons Attribution 4.0 License. To view a copy of this license, visit https://creativecommons.org/licenses/by/4.0/
Supplementary Material
File (appendix.docx)
- Download
- 855.05 KB
References
Papers of special note have been highlighted as: • of interest; •• of considerable interest
1.
Chalasani N, Younossi Z, Lavine JE et al. The diagnosis and management of non-alcoholic fatty liver disease: practice Guideline by the American Association for the Study of Liver Diseases, American College of Gastroenterology, and the American Gastroenterological Association. Hepatology 55(6), 2005–2023 (2012).
• Information on the natural history of non-alcoholic steatohepatitis (NASH) as well as diagnosis and management guidelines.
2.
Younossi ZM, Loomba R, Anstee QM et al. Diagnostic modalities for nonalcoholic fatty liver disease, nonalcoholic steatohepatitis, and associated fibrosis. Hepatology 68(1), 349–360 (2018).
3.
Garcia-Tsao G, Friedman S, Iredale J, Pinzani M. Now there are many (stages) where before there was one: in search of a pathophysiological classification of cirrhosis. Hepatology 51(4), 1445 (2010).
4.
Corte CD, Ferrari F, Villani A, Nobili V. Epidemiology and Natural History of NAFLD. J. Med. Biochem. 34(1), 13 (2015).
5.
Younossi ZM, Koenig AB, Abdelatif D, Fazel Y, Henry L, Wymer M. Global epidemiology of nonalcoholic fatty liver disease-meta-analytic assessment of prevalence, incidence, and outcomes. Hepatology 64(1), 73–84 (2016).
• A literature review of the global prevalence of nonalcoholic fatty liver disease (NAFLD) and NASH.
6.
Geier A, Rinella ME, Balp MM et al. Real-world burden of nonalcoholic steatohepatitis. Clin. Gastroenterol. Hepatol. 19(5), 1020–1029.e7 (2021).
• A cross-sectional survey examining resource use and burden of NASH indicated that the burden of NASH may be underestimated by previous studies.
7.
Sheka AC, Adeyi O, Thompson J, Hameed B, Crawford PA, Ikramuddin S. Nonalcoholic steatohepatitis: a review. JAMA 323(12), 1175–1183 (2020).
8.
Younossi ZM, Wong VWS, Anstee QM et al. Fatigue and pruritus in patients with advanced fibrosis due to nonalcoholic steatohepatitis: the impact on patient-reported outcomes. Hepatol. Commun. 4(11), 1637–1650 (2020).
9.
Kennedy-Martin T, Bae JP, Paczkowski R, Freeman E. Health-related quality of life burden of nonalcoholic steatohepatitis: a robust pragmatic literature review. J. Patient Rep. Outcomes. 2, 28 (2018).
• Literature review summarizing research on the health-related quality of life burden of NASH.
10.
Younossi ZM, Stepanova M, Anstee QM et al. Reduced patient-reported outcome scores associate with level of fibrosis in patients with nonalcoholic steatohepatitis. Clin. Gastroenterol. Hepatol. 17(12), 2552–2560.e10 (2019).
11.
O'Hara J, Finnegan A, Dhillon H et al. Cost of non-alcoholic steatohepatitis in Europe and the USA: The GAIN study. JHEP Rep. 2(5), 100142 (2020).
•• The study reports EQ-5D values for NASH patients (early: F0–F2 and advanced: F3–F4) from a multi-country study.
12.
Zhang E, Wartelle-Bladou C, Lepanto L, Lachaine J, Cloutier G, Tang A. Cost-utility analysis of nonalcoholic steatohepatitis screening. Eur. Radiol. 25(11), 3282–3294 (2015).
•• A cost-utility analysis evaluating NASH screening, using one utility value for patients in F1, F2 and F3.
13.
Herdman M, Gudex C, Lloyd A et al. Development and preliminary testing of the new five-level version of EQ-5D (EQ-5D-5L). Qual. Life Res. 20(10), 1727–1736 (2011).
14.
Bansback N, Brazier J, Tsuchiya A, Anis A. Using a discrete choice experiment to estimate health state utility values. J. Health Econ. 31(1), 306–318 (2012).
15.
VERBI Software. MAXQDA 2020. (2019).
16.
Johnson FR, Lancsar E, Marshall D et al. Constructing experimental designs for discrete-choice experiments: report of the ISPOR Conjoint Analysis Experimental Design Good Research Practices Task Force. Value Health. 16(1), 3–13 (2013).
17.
Bridges JFP, Hauber AB, Marshall D et al. Conjoint analysis applications in health–a checklist: a report of the ISPOR Good Research Practices for Conjoint Analysis Task Force. Value Health. 14(4), 403–413 (2011).
18.
Anstee QM, Neuschwander-Tetri BA, Wong VWS et al. Cenicriviroc for the treatment of liver fibrosis in adults with nonalcoholic steatohepatitis: AURORA Phase 3 study design. Contemp. Clin. Trials. 89, 105922 (2020).
19.
OCALIVA 5 mg film-coated tablets – Summary of Product Characteristics (SmPC) - (emc). https://www.medicines.org.uk/emc/product/2561/smpc
20.
Nonalcoholic Fatty Liver Disease & NASH. NIDDK, https://www.niddk.nih.gov/health-information/liver-disease/nafld-nash
21.
Aggio D, Gallop K, Wittrup-Jensen V, Farsani S, Acaster S. ISPOR – A Qualitative Study of the Symptoms and Health-Related Quality of Life Impact Experienced by Patients Diagnosed with NASH (Non-Alcoholic Steatohepatitis). https://www.ispor.org/heor-resources/presentations-database/presentation/euro2021-3408/113771
22.
ChoiceMetrics. Ngene 1.2 USER MANUAL & REFERENCE GUIDE The Cutting Edge in Experimental Design.
23.
Doward LC, Balp MM, Twiss J et al. Development of a patient-reported outcome measure for non-alcoholic steatohepatitis (NASH-CHECK): results of a qualitative study. Patient. 14(5), 533 (2021).
24.
Lo SH, Sharma R, Costentin CE et al. Patient preferences for advanced hepatocellular carcinoma treatment: a multicountry stated preference study. Future Oncol. 17(32), 4275–4287 (2021).
25.
Williams K, Aggio D, Chen P, Anokhina K, Lloyd AJ, Wang Y. Utility values associated with atypical hemolytic uremic syndrome-related attributes: a discrete choice experiment in five countries. Pharmacoeconomics 39(8), 901–912 (2021).
26.
Marshall D, Bridges JFP, Hauber B et al. Conjoint analysis applications in health – how are studies being designed and reported?: an update on current practice in the published literature between 2005 and 2008. Patient. 3(4), 249–256 (2010).
27.
Van Hout B, Janssen MF, Feng Y et al. Interim scoring for the EQ-5D-5L: Mapping the EQ-5D-5L to EQ-5D-3L value sets. Value Health. 15(5), 708–715 (2012).
28.
Pickard AS, Law EH, Jiang R et al. United States valuation of EQ-5D-5L health states using an international protocol. Value Health. 22(8), 931–941 (2019).
29.
Hole AR. Fitting mixed logit models by using maximum simulated likelihood. Stata J. 7(3), 388–401 (2007).
30.
National life tables, UK – Office for National Statistics. https://www.ons.gov.uk/peoplepopulationandcommunity/birthsdeathsandmarriages/lifeexpectancies/bulletins/nationallifetablesunitedkingdom/2014to2016
31.
2011 Census data - Office for National Statistics. https://www.ons.gov.uk/census/2011census/2011censusdata
32.
Adult Health in Great Britain, 2013 - Office for National Statistics. https://www.ons.gov.uk/peoplepopulationandcommunity/healthandsocialcare/healthandlifeexpectancies/compendium/opinionsandlifestylesurvey/2015-03-19/adulthealthingreatbritain2013
33.
David K, Kowdley KV, Unalp A et al. Quality of life in adults with nonalcoholic fatty liver disease: baseline data from the nonalcoholic steatohepatitis clinical research network. Hepatology 49(6), 1904–1912 (2009).
Information & Authors
Information
Published In
Copyright
© 2024 Boehringer Ingelheim GmbH. This work is licensed under the Creative Commons Attribution 4.0 License
History
Received: 22 March 2023
Accepted: 12 December 2023
Published online: 16 January 2024
Keywords:
Topics
Authors
Metrics & Citations
Metrics
Article Usage
Article usage data only available from February 2023. Historical article usage data, showing the number of article downloads, is available upon request.
Citations
How to Cite
Estimating utility values for non-alcoholic steatohepatitis health states: a discrete choice experiment. (2024) Journal of Comparative Effectiveness Research. DOI: 10.57264/cer-2023-0033
Export citation
Select the citation format you wish to export for this article or chapter.
Citing Literature
- Ali A. Abdeen, Turgay Ayer, Aanan Biswas, Chase J. Wehrle, Sobia N. Laique, Ali Aminian, Cost‐Effectiveness of Pharmacologic Therapies for Metabolic Dysfunction–Associated Steatohepatitis With Significant Fibrosis in the United States, Diabetes, Obesity and Metabolism, 10.1111/dom.71020, (2026).
- Andrew H Briggs, Ziyi Lin, Daniel Aggio, Villum Wittrup-Jensen, Salvador Augustin, John Schneider, Andrew Lloyd, Understanding the Humanistic Burden of Metabolic Dysfunction-Associated Steatohepatitis Liver Disease in the US Population: Age/Sex Stratified Analysis of Morbidity and Mortality, PharmacoEconomics - Open, 10.1007/s41669-025-00635-6, (2026).
- Xinran Liu, Chang Luo, Shitong Xie, Jing Wu, Health Utility Decrement of Injection Treatment-Related Attributes Using Time Trade-Off Among Type 2 Diabetes Patients: A Vignette-Based Study, PharmacoEconomics - Open, 10.1007/s41669-025-00615-w, 10, 1, (167-178), (2025).
- Aurora Barberá, Trenton M. White, Anish K. Arora, Linda Henry, Jeffrey V. Lazarus, Zobair M. Younossi, Patient-Reported Outcomes in Metabolic Dysfunction-Associated Steatotic Liver Disease, Seminars in Liver Disease, 10.1055/a-2435-2091, 45, 02, (210-220), (2024).