Economic burden of rivaroxaban and warfarin among nonvalvular atrial fibrillation patients with obesity and polypharmacy
Publication: Journal of Comparative Effectiveness Research
Abstract
Aim: Evaluate healthcare resource utilization (HRU) and costs associated with rivaroxaban and warfarin among nonvalvular atrial fibrillation (NVAF) patients with obesity and polypharmacy. Materials & methods: IQVIA PharMetrics® Plus (January 2010–September 2019) data were used to identify NVAF patients with obesity (BMI ≥30 kg/m2) and polypharmacy (≥5 medications) initiated on rivaroxaban or warfarin. Weighted rate ratios and cost differences were evaluated post-treatment initiation. Results: Rivaroxaban was associated with significantly lower rates of HRU, including hospitalization (rate ratio [95% CI]: 0.83 [0.77, 0.92]). Medical costs were reduced in rivaroxaban users (difference [95% CI]: -US$6868 [-US$10,628, -US$2954]), resulting in significantly lower total healthcare costs compared with warfarin users (difference [95% CI]: -US$4433 [-US$8136, -US$582]). Conclusion: Rivaroxaban was associated with lower HRU and costs compared with warfarin among NVAF patients with obesity and polypharmacy in commercially insured US patients.
Atrial fibrillation (AF), the most prevalent form of treated cardiac arrhythmia [1], is a strong independent risk factor for stroke and systemic embolism (stroke/SE) associated with an estimated fivefold higher risk [2–5]. Nonvalvular AF (NVAF) is the most common type of AF in the US, with NVAF-related strokes accounting for over 15% of all strokes [6]. Obesity is the second most common predictor of AF and a major driver in the increasing prevalence of this disease [7]. Both AF and obesity are often accompanied by multiple comorbidities (e.g., hypertension and diabetes) that may require polypharmacy [8–12], commonly defined as the use of ≥5 concurrent medications [13–15]. Among patients with AF, polypharmacy prevalence has ranged from 50% to as high as approximately 95% across studies [8,16–18]. While evidence-based polypharmacy may confer clinical benefits, multiple medication use has the potential to increase the risk of adverse clinical outcomes [8,14,17,19,20]. Therefore, it is critical to identify treatment approaches that may mitigate the healthcare and economic burden among clinically complex AF patients with obesity and polypharmacy.
Chronic anticoagulation therapies are key to reducing the risk of stroke/SE and mortality among patients with NVAF [21]. In particular, direct-acting oral anticoagulants (DOAC) [22–24] such as rivaroxaban have been deemed a safe and effective alternative to traditional vitamin K antagonists (VKAs) such as warfarin for the treatment of patients with NVAF [25–28]. Further, DOACs such as rivaroxaban are being increasingly preferred over the VKAs such as warfarin [29,30] due to the absence of any requirement for international normalized ratio (INR) monitoring as well as their more limited drug–drug interactions [31,32].
An accumulation of evidence suggests that rivaroxaban may also be safe and effective among NVAF patients with complex clinical profiles, including obesity (BMI ≥30 kg/m2) or polypharmacy. High-quality data from the Phase III ROCKET AF clinical trial, combined with the results of several observational studies, suggest that rivaroxaban is safe and effective among NVAF patients with obesity [27,33–37]. Furthermore, rivaroxaban also appears to be well-tolerated among patients with polypharmacy based on clinical trial and real-world evidence [16,20,38,39]. In an analysis of the ROCKET AF trial population [20], an increase in the number of medications used did not compromise the safety and efficacy of rivaroxaban compared with warfarin. In more recent retrospective claims-based studies of polypharmacy users, rivaroxaban was associated with a risk of stroke/SE that was similar or reduced compared with warfarin, with no significant difference in the risk of major bleeding [16,38].
Studies investigating the impact of polypharmacy on anticoagulant users with obesity are currently scarce in the literature. However, one recent retrospective study of polypharmacy users with obesity by the present authors found that rivaroxaban was associated with a 29% lower risk of stroke/SE compared with warfarin, with no significant difference in the risk of major bleeding [39].
The economic burden among AF patients in the US is substantial [40,41]. In a 2011 study, AF was associated with a net incremental healthcare cost of US$8,705 per patient per year, resulting in a national incremental cost projection between US$6 billion and US$26 billion annually [40]. In a 2014 study of newly diagnosed NVAF patients, ischemic stroke and major bleeding were each associated with total incremental costs of over US$26,000 per patient per year on average, which were primarily driven by inpatient utilization [41]. Moreover, hospitalizations rates and associated costs in AF have been significantly increasing over the past two decades [42–44]. Evidence suggests that rivaroxaban could reduce this economic burden [45–48], including among NVAF patients with obesity [49,50] – a population at high risk for multimorbidity and polypharmacy [8–12]. In two recent retrospective studies of NVAF patients with obesity (including one conducted by the authors of the current study), rivaroxaban was associated with significantly reduced healthcare resource utilization (HRU) and healthcare costs compared with warfarin at follow-up [49,50]. However, further research is needed to determine whether these incremental economic benefits of rivaroxaban would apply to polypharmacy users. The present study is an extension of our previous claims study [50] and aims to evaluate HRU and healthcare costs associated with rivaroxaban and warfarin use among NVAF patients with obesity and polypharmacy in a commercially insured US population.
Materials & methods
Data source
IQVIA PharMetrics® Plus covers around 40 million patients in all census regions in the US with both medical and pharmacy benefits in any given recent year. The enrollee population in IQVIA PharMetrics Plus is generally representative of the less-than-65 years of age, commercially insured population in the US with respect to both age and gender. IQVIA PharMetrics Plus contains historical information on patient demographics, plan enrollment, and claims for inpatient, OP and pharmacy as well as their associated costs for 39 months on average. Therefore, de-identified healthcare insurance claims compliant with the Health Insurance Portability and Accountability Act were used to conduct the current study, with data spanning from 1 January 2010 to 30 September 2019.
Study design & population
A retrospective weighted-cohort design was used to evaluate outcomes among NVAF patients with obesity and polypharmacy initiated on rivaroxaban or warfarin. Eligible patients were those with ≥1 dispensing for rivaroxaban or warfarin between 4 November 2011 and 30 September 2019 (identification period), with the first dispensing defined as the index date. The baseline period was defined as the 12 months prior to the index date. Although rivaroxaban was approved in November 2011, only patients with an index date on or after 1 January 2013 were included in the study population since it may take a certain amount of time for recently-approved medications to be prescribed and early adopters may differ in their characteristics. Patients with polypharmacy were defined as having ≥5 concurrent OP pharmacy dispensings for any medications on the index date (including rivaroxaban or warfarin); concurrent use was defined based on the number of dispensing with days of supplies overlapping with the index date [14].
Additionally, patients had one or more diagnosis for AF and had one or more diagnosis for obesity or BMI ≥30 kg/m2 during the baseline period or on the index date (see Supplementary Table 1 for a list of codes used), had at least 12 months of continuous health plan enrollment before the index date, and were at least 18 years old at the index date. Patients were excluded from the analysis if they had more than one dispensings of an oral anticoagulant (i.e., rivaroxaban, warfarin, apixaban, edoxaban, betrixaban or dabigatran) at the index date or if they had any of the following during the baseline period: at least one dispensing for an oral anticoagulant, at least one venous thromboembolism or mitral-stenosis diagnosis, at least one knee or hip replacement surgery, or at least one procedure for a mechanical heart-valve.
An intention-to-treat approach was used to evaluate HRU and healthcare cost outcomes during the observation (follow-up) period, defined as the index date until the earliest of health plan disenrollment or end of data availability (including the index date). In this intention-to-treat design, patients were observed beyond the point at which they discontinued or switched to another similar medication; this approach assesses the impact of rivaroxaban and warfarin treatment based on the way they are likely to be used in real-world clinical practice, rather than complete adherent use with no changes or gaps in treatment. Study outcomes were evaluated over two distinct follow-up periods, up to 12 and 36 months of observation. As a sensitivity analysis, outcomes were evaluated over follow-up periods additionally censored at a switch to warfarin or another oral anticoagulant, if any, for patients in the rivaroxaban cohort, or at a switch to rivaroxaban or another oral anticoagulant for patients in the warfarin cohort.
Study outcomes
Demographics and clinical characteristics were evaluated during the baseline period. All-cause and NVAF-related HRU and healthcare cost were assessed up to 12 and 36 months of follow-up. The number of hospitalizations, length of stay in days, and the number of emergency room (ER) visits and outpatient (OP) visits were included. OP visits were stratified by office visits, OP hospital visits, and other OP visits (including patient home and other unlisted facilities). Associated medical (i.e., hospitalization, ER, and OP stratified by office, OP hospital and OP other) and pharmacy costs were assessed. Costs for INR monitoring and other laboratory tests are typically captured by OP and other costs, although these were not isolated in the present study [49]. NVAF-related HRU and costs included all visits associated with a primary or a secondary diagnosis (i.e., identified in any other diagnosis fields) of AF [51].
Statistical analysis
All analyses were performed using SAS Enterprise Guide version 7.15 (SAS Institute, NC, USA). To minimize the potential confounding between patients treated with rivaroxaban and warfarin, the inverse probability of treatment weighting approach based on the propensity score (PS) was used [52]. The PS (i.e., probability of being treated with rivaroxaban) was estimated using a multivariable logistic regression conditional on covariates observed during the baseline period, including age, sex, year of index date, region, type of insurance plan, morbid obesity, baseline coronary artery disease or peripheral artery disease, baseline stroke/SE, baseline major bleeding, cardiovascular-related medications, cardiovascular procedures, use of non-oral anticoagulants (i.e., unfractionated heparin, fondaparinux and low molecular weight heparin), prior history of cancer diagnosis and treatment, baseline HRU and healthcare costs, and baseline risk factors for stroke and bleeding events (with ≥5% prevalence in either cohort). Weights were defined as 1/PS and 1/(1-PS) for the rivaroxaban and warfarin cohorts, respectively, and normalized within each cohort (i.e., dividing each weight by the mean of the weights per cohort).
Claims-based algorithms were used to calculate Quan-Charlson comorbidity index score [53], CHA2DS2-VASc score (congestive heart failure, hypertension, age [>65 = 1 point, >75 = 2 points], diabetes, previous stroke/transient ischemic attack [2 points], vascular disease, and sex category [female]; Supplementary Table 2) [54,55] and HAS-BLED score (hypertension, abnormal renal and liver function, stroke, bleeding, age [>65 years], drugs and alcohol; Supplementary Table 3) [56].
Patient characteristics for both cohorts were evaluated using descriptive statistics including mean, standard deviation (SD), and median values for the continuous variables, and relative frequencies and proportions for the categorical variables. The balance of these characteristics between cohorts was assessed using standardized differences, where a difference of less than 10% was considered a sufficient balance [57].
HRU during follow-up were evaluated per patient-years (PPY) to account for different lengths of observation periods among patients. The mean rate of HRU, which is the number of events PPY, was compared across cohorts with rate ratios obtained from Poisson regression models. Weighted average annualized per patient costs were calculated to avoid overestimating costs observed for a short period of time, with the observation period of each patient used as the weight. Cost differences were obtained using multivariable linear regression models controlling for baseline healthcare costs to avoid any residual confounders. Of note, the linear regression models were used only to obtain the point estimates (i.e., adjusted cost differences). P-values and 95% CI were estimated using non-parametric bootstrap procedures with 499 repetitions, since HRU and cost data have positive values that follow a non-normal distribution and commonly include zero values. Healthcare costs were adjusted to 2019 US dollars based on the medical care component of the Consumer Price Index.
Results
After applying the study eligibility criteria, a total of 7000 and 3920 NVAF patients with obesity and polypharmacy were included in the rivaroxaban and warfarin cohorts, respectively (Figure 1).
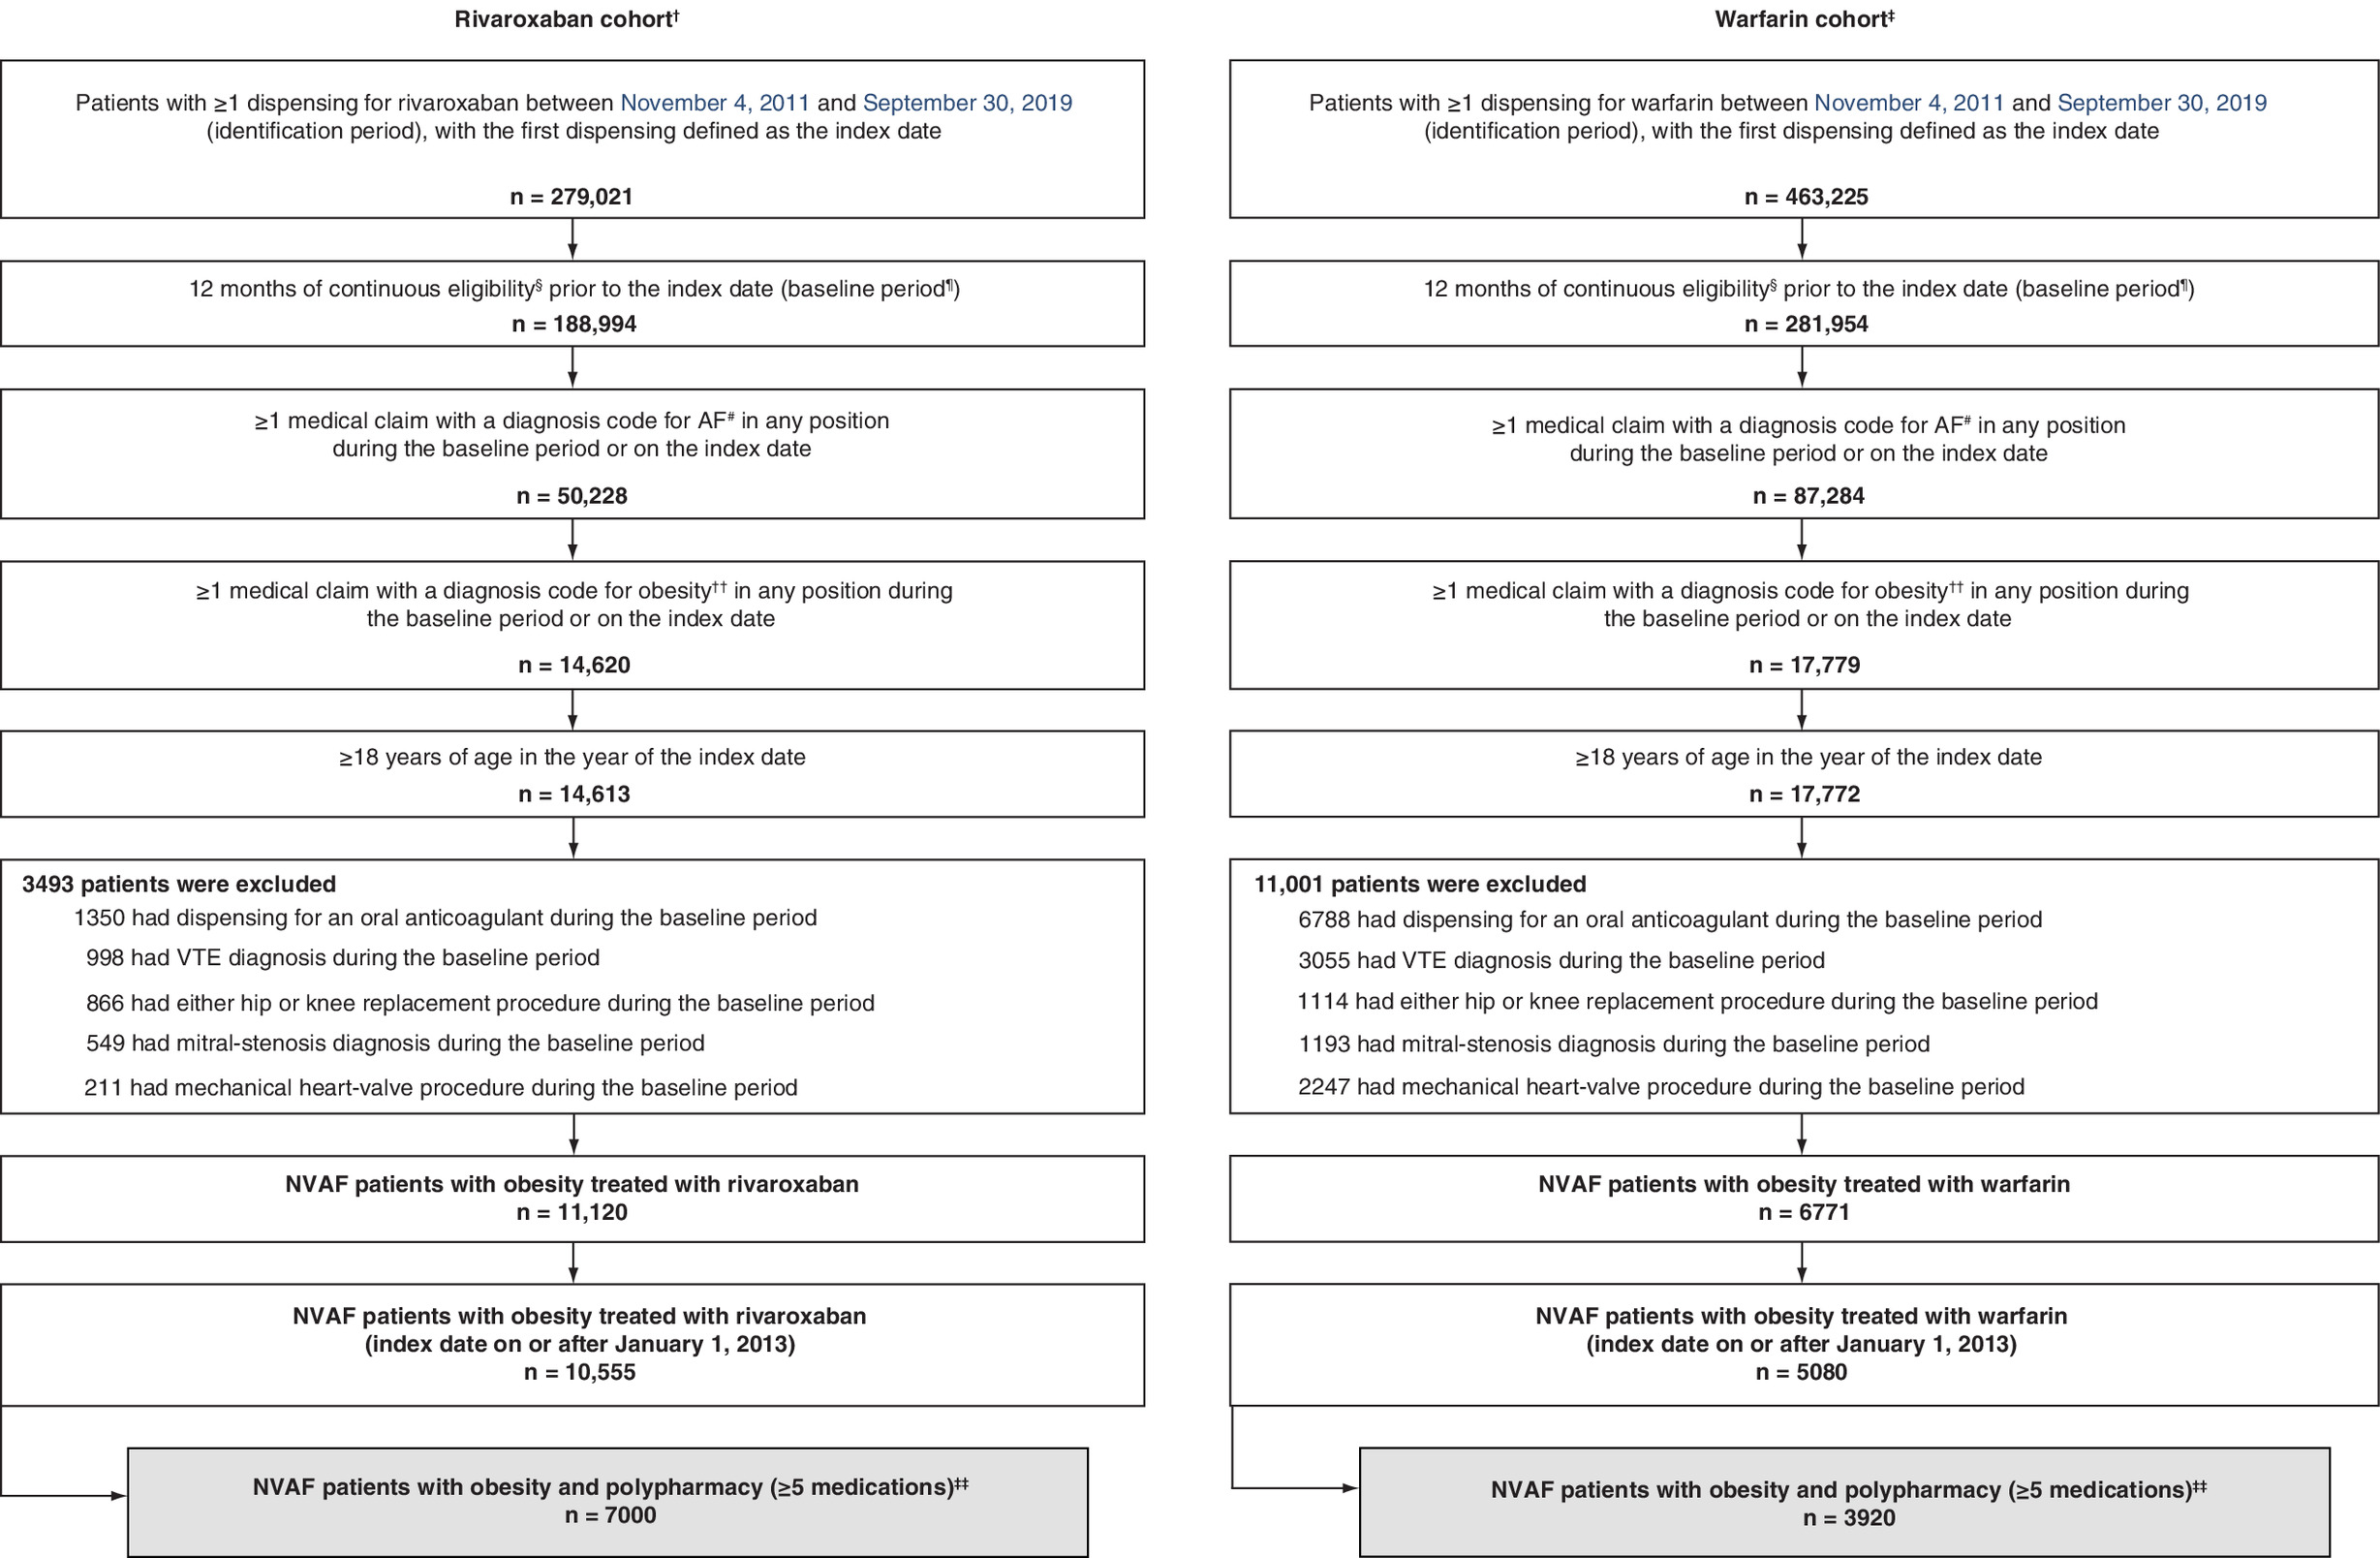
Figure 1. Patient disposition – nonvalvular atrial fibrillation patients polypharmacy population.
Data source: IQVIA PharMetrics® Plus, consisting of AF patients with obesity, from 1 January 2010 to 30 September 2019.
†A total of 326 rivaroxaban patients with >1 oral anticoagulant medications on the index date were excluded.
‡A total of 379 warfarin patients with >1 oral anticoagulant medications on the index date were excluded.
§Continuous eligibility was defined as continuous health plan enrollment with medical and pharmacy coverage.
¶Baseline period was defined as the 12 months prior to the index date.
#AF was identified with the following ICD-9-CM codes: 427.31, and ICD-10-CM: I48.0-148.2x, I48.91.
††See Supplementary Table 1 for obesity diagnosis codes.
‡‡Patients with concurrent pharmacy dispensing for ≥5 different medications based on the date of the pharmacy claim and days’ supply on the index date [14].
AF: Atrial fibrillation; GPI: Generic product identifier; ICD: International classification of disease; NVAF: Nonvalvular atrial fibrillation; VTE: Venous thromboembolism.
Reproduced from [39].
Baseline demographics & clinical characteristics
The weighted rivaroxaban and warfarin cohorts were well-balanced (i.e., standard difference <10%) with respect to baseline demographic and clinical characteristics (Table 1) and baseline comorbidities (Table 2). At the index date, the mean age of both cohorts was 60 years and approximately a third of the patients were female. CCI score (mean: 2.06 and 2.02, respectively), CHA2DS2-VASc score (mean: 2.96 and 3.00, respectively), and HAS-BLED score (mean: 1.99 and 1.98, respectively; Table 2) were similar for patients in the weighted rivaroxaban and warfarin cohorts.
| Characteristics | Unweighted cohorts | Weighted cohorts | ||||
|---|---|---|---|---|---|---|
| Rivaroxaban (n = 7000) | Warfarin (n = 3920) | Std diff.†,‡ (%) | Rivaroxaban (n = 7000) | Warfarin (n = 3920) | Std diff.†,‡ (%) | |
| Observation period§, months, mean ± SD [median] | 19.7 ± 12.8 [18] | 19.9 ± 13.1 [18] | 20.3 ± 12.9 [19] | 19.5 ± 12.9 [18] | ||
| Demographics¶ | ||||||
| Age, years, mean ± SD [median] | 59.5 ± 8.1 [60] | 61.3 ± 8.6 [62] | 21.9 | 60.2 ± 8.1 [61] | 60.1 ± 8.6 [61] | 0.6 |
| Age categories, n (%) | ||||||
| – <65 years | 5631 (80.4) | 2829 (72.2) | 19.5 | 5455 (77.9) | 3011 (76.8) | 2.7 |
| – ≥65 years | 1369 (19.6) | 1091 (27.8) | 19.5 | 1545 (22.1) | 909 (23.2) | 2.7 |
| – Sex, female, n (%) | 2208 (31.5) | 1224 (31.2) | 0.7 | 2174 (31.1) | 1262 (32.2) | 2.5 |
| Region¶, n (%) | ||||||
| – South | 1615 (23.1) | 1112 (28.4) | 12.1 | 1721 (24.6) | 944 (24.1) | 1.2 |
| – Midwest | 1922 (27.5) | 1258 (32.1) | 10.1 | 2042 (29.2) | 1153 (29.4) | 0.5 |
| – Northeast | 2921 (41.7) | 1097 (28.0) | 28.8 | 2584 (36.9) | 1477 (37.7) | 1.6 |
| – West | 542 (7.7) | 453 (11.6) | 12.9 | 653 (9.3) | 346 (8.8) | 1.7 |
| Insurance plan type¶, n (%) | ||||||
| – PPO | 5990 (85.6) | 3223 (82.2) | 9.1 | 5867 (83.8) | 3295 (84.1) | 0.7 |
| – HMO | 577 (8.2) | 361 (9.2) | 3.4 | 633 (9.0) | 333 (8.5) | 1.9 |
| – POS | 244 (3.5) | 139 (3.5) | 0.3 | 241 (3.4) | 140 (3.6) | 0.7 |
| – Indemnity/traditional | 161 (2.3) | 177 (4.5) | 12.2 | 228 (3.3) | 133 (3.4) | 0.7 |
| – Unknown | 23 (0.3) | 15 (0.4) | 0.9 | 26 (0.4) | 16 (0.4) | 0.4 |
| – CDHC | 5 (0.1) | 3 (0.1) | 0.2 | 6 (0.1) | 3 (0.1) | 0.2 |
| Morbid obesity (BMI ≥40)#, n(%) | 2708 (38.7) | 1672 (42.7) | 8.1 | 2798 (40.0) | 1621 (41.4) | 2.8 |
| Baseline stroke/SE and major bleeding††, n (%) | ||||||
| – Stroke/SE | 243 (3.5) | 343 (8.8) | 22.0 | 441 (6.3) | 220 (5.6) | 2.9 |
| – Ischemic stroke | 224 (3.2) | 311 (7.9) | 20.6 | 387 (5.5) | 203 (5.2) | 1.6 |
| – Hemorrhagic stroke | 12 (0.2) | 36 (0.9) | 10.1 | 38 (0.5) | 21 (0.5) | 0.1 |
| – SE | 16 (0.2) | 29 (0.7) | 7.4 | 29 (0.4) | 15 (0.4) | 0.6 |
| – Major bleeding | 138 (2.0) | 210 (5.4) | 18.0 | 287 (4.1) | 128 (3.3) | 4.3 |
| Gastric bypass surgery††, n (%) | 40 (0.6) | 29 (0.7) | 2.1 | 37 (0.5) | 26 (0.7) | 1.8 |
| Polypharmacy category‡‡, n (%) | ||||||
| – Dispensing for ≥10 medications | 1661 (23.7) | 1346 (34.3) | 23.4 | 1881 (26.9) | 1125 (28.7) | 4.1 |
| Dispensing of nonoral anticoagulants††, n (%) | 1106 (15.8) | 767 (19.6) | 9.9 | 1201 (17.2) | 670 (17.1) | 0.2 |
| Dispensing of cardiovascular-related medications††, n (%) | 6387 (91.2) | 3535 (90.2) | 3.7 | 6361 (90.9) | 3565 (90.9) | 0.3 |
| – Antihypertensive agents | 5931 (84.7) | 3313 (84.5) | 0.6 | 5945 (84.9) | 3319 (84.7) | 0.8 |
| – Antihyperlipidemic agents | 4168 (59.5) | 2431 (62.0) | 5.1 | 4280 (61.1) | 2352 (60.0) | 2.3 |
| – Antiplatelet agents | 735 (10.5) | 554 (14.1) | 11.1 | 963 (13.8) | 447 (11.4) | 7.2 |
| Cardiovascular procedures††, n (%) | 414 (5.9) | 654 (16.7) | 34.0 | 749 (10.7) | 395 (10.1) | 2.1 |
| – Percutaneous coronary intervention | 268 (3.8) | 281 (7.2) | 14.7 | 444 (6.3) | 175 (4.5) | 8.4 |
| – Coronary bypass graft | 169 (2.4) | 410 (10.5) | 32.8 | 353 (5.0) | 240 (6.1) | 4.7 |
| Prior history of cancer diagnosis and treatment††, n (%) | 932 (13.3) | 594 (15.2) | 5.3 | 1014 (14.5) | 538 (13.7) | 2.2 |
| Baseline healthcare resource utilization††, mean ± SD [median] | ||||||
| All-cause | ||||||
| – Hospitalizations | 0.71 ± 0.80 [1] | 1.06 ± 1.06 [1] | 37.2 | 0.87 ± 0.96 [1] | 0.85 ± 0.94 [1] | 1.6 |
| – ER visits | 0.73 ± 1.34 [0] | 0.81 ± 1.75 [0] | 4.8 | 0.76 ± 1.42 [0] | 0.77 ± 1.60 [0] | 0.5 |
| – OP visits | 20.78 ± 19.90 [16] | 26.63 ± 32.25 [18] | 21.9 | 23.19 ± 25.49 [17] | 23.34 ± 25.42 [16] | 0.6 |
| – OP hospital visits | 4.97 ± 7.73 [3] | 8.13 ± 19.65 [4] | 21.2 | 5.98 ± 9.75 [3] | 6.18 ± 13.60 [3] | 1.7 |
| – Office visits | 10.44 ± 10.16 [8] | 10.07 ± 10.09 [7] | 3.7 | 10.69 ± 10.80 [8] | 10.49 ± 11.35 [7] | 1.8 |
| – Other visits | 5.37 ± 11.90 [3] | 8.43 ± 20.01 [3] | 18.6 | 6.52 ± 16.85 [3] | 6.66 ± 14.51 [3] | 0.9 |
| NVAF-related§§ | ||||||
| – Hospitalizations | 0.57 ± 0.63 [1] | 0.77 ± 0.70 [1] | 29.8 | 0.68 ± 0.73 [1] | 0.64 ± 0.66 [1] | 5.7 |
| – ER visits | 0.24 ± 0.59 [0] | 0.18 ± 0.55 [0] | 11.3 | 0.23 ± 0.58 [0] | 0.20 ± 0.57 [0] | 5.1 |
| – OP visits | 2.31 ± 3.53 [1] | 2.50 ± 5.27 [0] | 4.3 | 2.31 ± 3.92 [1] | 2.57 ± 4.78 [1] | 5.8 |
| – OP hospital visits | 0.85 ± 1.67 [0] | 1.00 ± 3.03 [0] | 6.1 | 0.85 ± 1.86 [0] | 1.00 ± 2.66 [0] | 6.5 |
| – Office visits | 1.06 ± 1.67 [0] | 0.86 ± 2.12 [0] | 10.3 | 0.98 ± 1.64 [0] | 0.99 ± 2.21 [0] | 0.6 |
| – Other visits | 0.41 ± 1.76 [0] | 0.64 ± 2.45 [0] | 11.1 | 0.48 ± 2.15 [0] | 0.58 ± 2.09 [0] | 4.5 |
| Baseline healthcare costs††,¶¶, US$ 2019, mean ± SD | ||||||
| All-cause | ||||||
| Total healthcare costs | US$33,125 ± 46,048 | US$67,884 ± 118,312 | 38.7 | US$47,174 ± 74,255 | US$46,192 ± 83,288 | 1.2 |
| Total medical costs | US$28,668 ± 44,001 | US$62,966 ± 116,457 | 39.0 | US$42,438 ± 72,534 | US$41,937 ± 81,459 | 0.7 |
| – Hospitalization costs | US$16,694 ± 36,252 | US$46,793 ± 106,618 | 37.8 | US$29,056 ± 63,223 | US$28,633 ± 72,661 | 0.6 |
| – ER costs | US$1452 ± 3777 | US$1493 ± 4086 | 1.1 | US$1460 ± 3811 | US$1409 ± 3729 | 1.4 |
| – OP costs | US$10,522 ± 19,822 | US$14,679 ± 34,211 | 14.9 | US$11,923 ± 23,726 | US$11,895 ± 27,120 | 0.1 |
| – OP hospital costs | US$7358 ± 17,929 | US$9385 ± 24,517 | 9.4 | US$8286 ± 21,485 | US$7833 ± 21,009 | 2.1 |
| – Office costs | US$1508 ± 2845 | US$1588 ± 3600 | 2.4 | US$1798 ± 4507 | US$1558 ± 3499 | 5.9 |
| – Other costs | US$1655 ± 5054 | US$3707 ± 19,510 | 14.4 | US$1838 ± 5449 | US$2504 ± 13,215 | 6.6 |
| – Pharmacy costs | US$4457 ± 10,386 | US$4918 ± 11,304 | 4.2 | US$4736 ± 10,935 | US$4255 ± 10,539 | 4.5 |
| NVAF-related§§ | ||||||
| Total medical costs | US$17,309 ± 33,626 | US$41,187 ± 95,685 | 33.3 | US$27,829 ± 60,232 | US$26,373 ± 64,596 | 2.3 |
| Hospitalization costs | US$13,456 ± 32,269 | US$38,389 ± 95,348 | 35.0 | US$24,296 ± 59,592 | US$22,967 ± 63,742 | 2.2 |
| – ER costs | US$724 ± 2573 | US$494 ± 2101 | 9.8 | US$657 ± 2452 | US$570 ± 2171 | 3.7 |
| – OP costs | US$3129 ± 9500 | US$2304 ± 9620 | 8.6 | US$2877 ± 9151 | US$2835 ± 12,003 | 0.4 |
| – OP hospital costs | US$2722 ± 9275 | US$1926 ± 9201 | 8.6 | US$2494 ± 8932 | US$2461 ± 11,712 | 0.3 |
| – Office costs | US$192 ± 493 | US$139 ± 517 | 10.5 | US$177 ± 474 | US$154 ± 521 | 4.7 |
| – Other costs | US$214 ± 1146 | US$239 ± 2108 | 1.4 | US$205 ± 1106 | US$221 ± 1819 | 1.0 |
†
For continuous variables, the standardized difference is calculated by dividing the absolute difference in means of the control and the case by the pooled standard deviation of both groups. The pooled standard deviation is the square root of the average of the squared standard deviations.
‡
For dichotomous variables, the standardized difference is calculated using the following equation where P is the respective proportion of participants in each group: |(Pcase-Pcontrol)|/√[(Pcase(1-Pcase)+Pcontrol(1-Pcontrol))/2].
§
Observation period spans from the index date to the earliest of: 36 months, end of continuous enrollment, or end of data availability.
¶
Evaluated at the index date.
#
Closest value to the index date, evaluated during the 12 months prior to the index date, including the index date.
††
Evaluated during the 12 months prior to the index date, excluding the index date.
‡‡
Polypharmacy is defined as pharmacy dispensing for different medications (first 8-digits of GPI) on the index date (Piccini et al., 2016).
§§
NVAF-related HRU and costs were identified as any claim with a primary or secondary diagnosis of atrial fibrillation.
¶¶
Costs are adjusted to US$US 2019 using the US Medical Care consumer price index from the Bureau of Labor Statistics, US Department of Labor.
CDHC: Consumer-directed healthcare; ER: Emergency room; HRU: Healthcare resource utilization; HMO: Health maintenance organization; NVAF: Nonvalvular atrial fibrillation; OP: Outpatient; POS: Point-of-service; PPO: Preferred provider organization; Quan-CCI: Quan-Charlson comorbidity index; SD: Standard deviation; SE: Systemic embolism; Std diff: Standardized difference.
| Clinical characteristics† | Unweighted cohorts | Weighted cohorts | ||||
|---|---|---|---|---|---|---|
| Rivaroxaban (n = 7000) | Warfarin (n = 3920) | Std diff.‡,§ (%) | Rivaroxaban (n = 7000) | Warfarin (n = 3920) | Std diff.‡,§ (%) | |
| Quan-CCI¶, mean ± SD [median] | 1.71 ± 1.84 [1] | 2.47 ± 2.13 [2] | 38.1 | 2.06 ± 2.19 [2] | 2.02 ± 2.00 [2] | 2.1 |
| CHA2DS2-VASc score, mean ± SD [median] | 2.67 ± 1.41 [2] | 3.42 ± 1.59 [3] | 49.8 | 2.96 ± 1.55 [3] | 3.00 ± 1.50 [3] | 2.8 |
| HAS-BLED score, mean ± SD [median] | 1.86 ± 0.99 [2] | 2.14 ± 1.13 [2] | 26.6 | 1.99 ± 1.09 [2] | 1.98 ± 1.06 [2] | 0.7 |
| Risk factors for stroke and bleeding events, n (%) | ||||||
| – Hypertension | 6420 (91.7) | 3636 (92.8) | 3.9 | 6460 (92.3) | 3632 (92.7) | 1.4 |
| – Arrhythmia (excluding AF) | 6234 (89.1) | 3599 (91.8) | 9.4 | 6307 (90.1) | 3523 (89.9) | 0.7 |
| – Hyperlipidemia | 5145 (73.5) | 2951 (75.3) | 4.1 | 5200 (74.3) | 2904 (74.1) | 0.5 |
| – Diabetes | 3319 (47.4) | 2272 (58.0) | 21.1 | 3597 (51.4) | 2051 (52.3) | 1.9 |
| – CAD | 2359 (33.7) | 1912 (48.8) | 30.6 | 2771 (39.6) | 1549 (39.5) | 0.2 |
| – Congestive heart failure | 2305 (32.9) | 1917 (48.9) | 32.5 | 2781 (39.7) | 1543 (39.4) | 0.7 |
| – NSAID use | 2021 (28.9) | 864 (22.0) | 15.7 | 1855 (26.5) | 1067 (27.2) | 1.7 |
| – Renal disease | 1637 (23.4) | 1591 (40.6) | 36.9 | 2091 (29.9) | 1170 (29.8) | 0.1 |
| – Excessive fall risk (Parkinson’s disease, etc.) | 1621 (23.2) | 938 (23.9) | 1.8 | 1671 (23.9) | 941 (24.0) | 0.3 |
| – Chronic kidney disease | 1474 (21.1) | 1322 (33.7) | 28.4 | 1783 (25.5) | 994 (25.4) | 0.2 |
| – Depression | 1111 (15.9) | 693 (17.7) | 4.8 | 1197 (17.1) | 651 (16.6) | 1.3 |
| – Anemia | 1065 (15.2) | 1173 (29.9) | 35.2 | 1481 (21.2) | 811 (20.7) | 1.1 |
| – Ethanol abuse | 871 (12.4) | 406 (10.4) | 6.6 | 827 (11.8) | 470 (12.0) | 0.5 |
| – Myocardial infarction | 819 (11.7) | 801 (20.4) | 23.8 | 1090 (15.6) | 602 (15.3) | 0.6 |
| – Previous bleeding | 805 (11.5) | 695 (17.7) | 17.6 | 998 (14.3) | 541 (13.8) | 1.3 |
| – COPD | 798 (11.4) | 523 (13.3) | 5.9 | 850 (12.1) | 485 (12.4) | 0.7 |
| – Hepatic disease | 651 (9.3) | 399 (10.2) | 3.0 | 724 (10.3) | 378 (9.6) | 2.4 |
| – Family history of CVD | 571 (8.2) | 272 (6.9) | 4.6 | 551 (7.9) | 304 (7.8) | 0.4 |
| – PAD | 490 (7.0) | 488 (12.4) | 18.4 | 660 (9.4) | 352 (9.0) | 1.5 |
| – Left ventricular dysfunction | 271 (3.9) | 243 (6.2) | 10.6 | 319 (4.6) | 181 (4.6) | 0.3 |
| – Transient ischemic attack | 231 (3.3) | 188 (4.8) | 7.6 | 322 (4.6) | 156 (4.0) | 3.1 |
| – Thrombocytopenia (low platelet count) | 208 (3.0) | 254 (6.5) | 16.5 | 346 (4.9) | 167 (4.3) | 3.2 |
| – Central venous catheter | 182 (2.6) | 464 (11.8) | 35.7 | 508 (7.3) | 245 (6.2) | 4.0 |
| – Peptic ulcer | 116 (1.7) | 74 (1.9) | 1.7 | 153 (2.2) | 58 (1.5) | 5.2 |
| – Coagulation defect | 53 (0.8) | 195 (5.0) | 25.3 | 153 (2.2) | 88 (2.2) | 0.3 |
| – Diathesis | 3 (0.0) | 3 (0.1) | 1.4 | 6 (0.1) | 3 (0.1) | 0.9 |
†
Evaluated during the 12 months prior to the index date, excluding the index date.
‡
For continuous variables, the standardized difference is calculated by dividing the absolute difference in means of the control and the case by the pooled standard deviation of both groups. The pooled standard deviation is the square root of the average of the squared standard deviations.
§
For dichotomous variables, the standardized difference is calculated using the following equation where P is the respective proportion of participants in each group: |(Pcase-Pcontrol)|/√[(Pcase(1-Pcase)+Pcontrol(1-Pcontrol))/2].
¶
[53].
Reproduced from [39].
AF: Atrial fibrillation; CAD: Coronary artery disease; COPD: Chronic obstructive pulmonary disease; CVD: Cardiovascular disease; NSAID: Nonsteroidal anti-inflammatory drug; PAD: Peripheral artery disease; SD: Standard deviation; Std diff: Standardized difference.
The weighted cohorts were also well-balanced with respect to baseline HRU and healthcare costs (Table 1). The mean (SD) total all-cause healthcare costs during the baseline period were US$47,174 (US$74,255) for the rivaroxaban cohort and US$46,192 (US$83,288) for the warfarin cohort.
Healthcare resource utilization
The mean rate of HRU was significantly lower in the rivaroxaban cohort compared with the warfarin cohort across all observed components, up to 12 months of follow-up (Figure 2A). Over the follow-up period (rivaroxaban: 9.9 months; warfarin: 9.7 months), patients in the rivaroxaban cohort had lower rates of all-cause hospitalizations (RR: 0.83; 95% CI: 0.77, 0.92; p < 0.001), ER visits (RR: 0.89; 95% CI: 0.82, 0.97; p = 0.004) and OP visits (RR: 0.71; 95% CI: 0.69, 0.74; p < 0.001) relative to those in the warfarin cohort (Figure 2A). Median all-cause length of stay per hospitalization was 4 and 5 days in the rivaroxaban and warfarin cohorts, respectively. The significantly lower rate of all-cause OP visits in the rivaroxaban cohort relative to the warfarin cohort included lower mean rates of office visits (RR: 0.89; 95% CI: 0.85, 0.94), OP hospital visits (RR: 0.61; 95% CI: 0.57, 0.65), and other visits (RR: 0.63; 95% CI: 0.60, 0.69; all p < 0.001) relative to patients in the warfarin cohort. Comparable results were observed for NVAF-related HRU, up to 12 months of follow-up (Figure 2A), with patients in the rivaroxaban cohort showing significantly lower rates of hospitalizations (RR: 0.88; 95% CI: 0.81, 0.97; p = 0.016), ER visits (RR: 0.81; 95% CI: 0.73, 0.90; p < 0.001) and OP visits (RR: 0.49; 95% CI: 0.47, 0.51; p < 0.001) relative to those in the warfarin cohort.
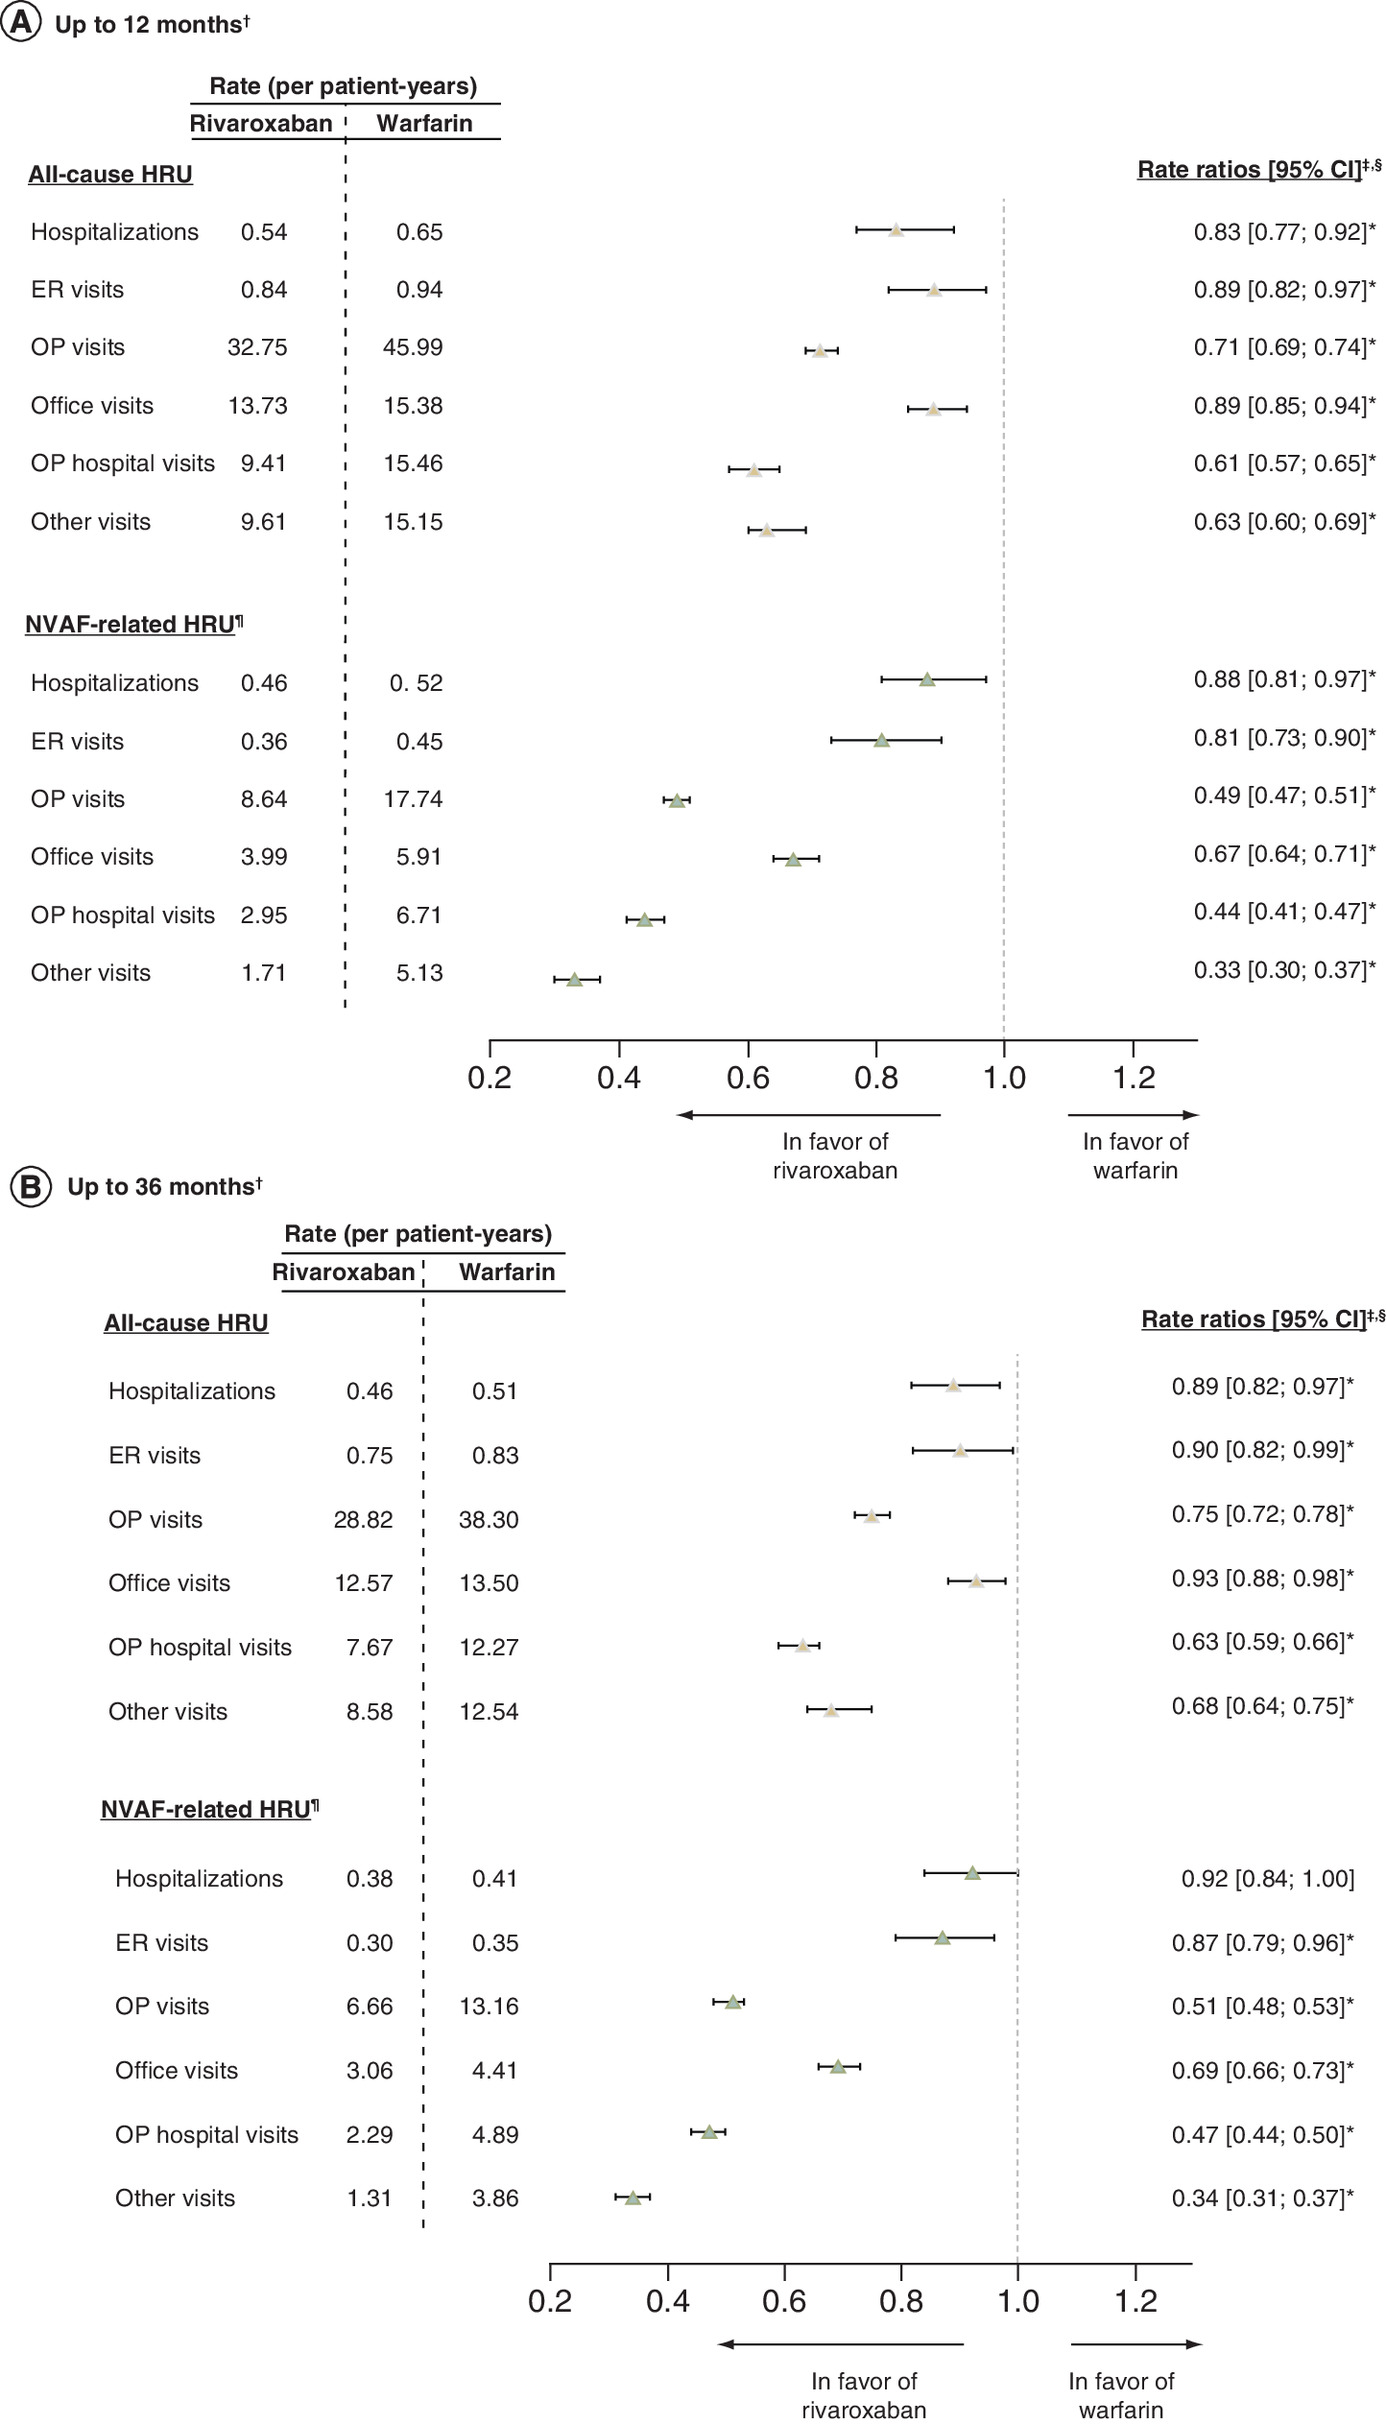
Figure 2. Healthcare resource utilization among nonvalvular atrial fibrillation patients patients with obesity and polypharmacy (≥5 medications) – rivaroxaban versus warfarin.
(A) Up to 12 months1; (B) up to 36 months1.
*p < 0.05.
†For the analysis up to 12 months, the mean (median) length of observation period was 9.9 (12) months for the rivaroxaban cohort and 9.7 (12) months for the warfarin cohort. For the analysis up to 36 months, the length of observation period was 20.3 (19) months for the rivaroxaban cohort and 19.5 (18) months for the warfarin cohort.
‡Rate ratios obtained from Poisson regression models.
§CIs and p-values were calculated using nonparametric bootstrap procedure (B = 499).
¶HRU was considered NVAF-related if it had been associated with a primary or secondary diagnosis of AF.
AF: Atrial fibrillation; ER: Emergency room; HRU: Healthcare resource utilization; NVAF: Nonvalvular atrial fibrillation; OP: Outpatient.
A similar pattern of results was observed for all-cause and NVAF-related HRU up to 36 months of follow-up (Figure 2B). During a mean follow-up period of 20.3 months and 19.5 months for the weighted rivaroxaban and warfarin cohorts, respectively, patients in the rivaroxaban cohort showed statistically significant decreases in HRU across all components, with the exception of NVAF-related hospitalizations, which showed a decrease that was numerically but not significantly lower when compared with warfarin-treated patients (Figure 2B).
Healthcare costs
Mean all-cause and NVAF-related healthcare costs PPY among patients with obesity and polypharmacy in the weighted rivaroxaban and warfarin cohorts are shown in Figure 3. During the 12-month follow-up period (Figure 3A), all-cause medical costs were significantly lower among patients in the rivaroxaban cohort compared with those in the warfarin cohort (mean difference: -US$6868, 95% CI: -US$10,628, -US$2954; p < 0.001), and this difference was driven by lower hospitalization costs (mean difference: -US$5450, 95% CI: -US$8741, -US$2077; p < 0.001). All-cause medical cost savings associated with rivaroxaban fully offset the higher pharmacy costs (mean difference: US$2435, 95% CI: US$2102, US$2794; p < 0.001), resulting in significantly lower total all-cause healthcare costs in the rivaroxaban cohort compared with the warfarin cohort (mean difference: -US$4433, 95% CI: -US$8136, -US$582; p = 0.028; Figure 3A). Among OP costs, patients in the rivaroxaban cohort had significantly reduced office visit costs (mean difference: -US$411, 95% CI: -US$647, -US$139; p < 0.001) and other visit costs (mean difference: -US$966, 95% CI: -US$1,387, -US$494; p < 0.001). During the 12-month follow-up period, NVAF-related hospitalization costs were significantly lower among patients treated with rivaroxaban (mean difference: -US$3435, 95% CI: -US$6567, -US$353; p = 0.040), resulting in total NVAF-related medical costs that were numerically but not significantly lower compared with patients treated with warfarin (mean difference: -US$2621, 95% CI: -US$5856, US$737; p = 0.136; Figure 3A).

Figure 3. Healthcare costs among nonvalvular atrial fibrillation patients patients with obesity and polypharmacy (≥5 medications) – rivaroxaban versus warfarin†.
(A) Up to 12 months; (B) up to 36 months.
*p < 0.05.
†Cost differences were calculated using a multivariable linear regression model controlling for the healthcare costs during baseline. CIs and p-values were calculated using nonparametric bootstrap procedure (B = 499).
‡Healthcare costs were considered NVAF-related if they had been associated with a primary or secondary diagnosis of atrial fibrillation.
ER: Emergency room; NVAF: Non-valvular atrial fibrillation; OP: Outpatient; PPY: Per person-years; US: United States.
In the 36-month follow-up analysis, all-cause and NVAF-related healthcare costs were generally lower with rivaroxaban, although the cohort differences were smaller in magnitude than those observed in the 12-month follow-up analysis (Figure 3B). Up to 36 months, rivaroxaban was associated with significantly lower all-cause total medical costs (mean difference: -US$4146, 95% CI: -US$6636, -US$1299; p < 0.001) driven by lower hospitalization costs (mean difference: -US$2843, 95% CI: -US$4897, -US$595; p = 0.004), resulting in numerically but not significantly lower total healthcare costs compared with warfarin (mean difference: -US$1969, 95% CI: -US$4601, US$1070; p = 0.196; Figure 3B). NVAF-related hospitalization costs and total medical costs were numerically but not significantly lower among rivaroxaban compared with warfarin-treated patients (Figure 3B).
Sensitivity analyses
The sensitivity analysis censored at switch to another anticoagulant yielded a similar pattern of results to the main analysis with a 12-month follow-up, and a more pronounced benefit with a 36-month follow-up. Consistent with the main analysis, all-cause and NVAF-related HRU were significantly lower among patients in the rivaroxaban cohort compared with those in the warfarin cohort with 12- and 36-month follow-up (Supplementary Table 4). Additionally, the decrease in NVAF-related hospitalizations among rivaroxaban-treated patients up to 36 months attained statistical significance upon censoring at switch to another anticoagulant (RR: 0.89; 95% CI: 0.81, 0.97; p = 0.008; Supplementary Table 4).
Consistent with the main analysis, rivaroxaban was associated with lower all-cause and NVAF-related healthcare costs up to 12 months, including significantly lower total medical costs and hospitalization costs compared with warfarin (Supplementary Table 5). At 36-month follow-up, rivaroxaban was associated with a slightly more pronounced decrease in healthcare costs than in the main analysis, including a significant reduction in all-cause total healthcare costs (mean difference: -US$3385; 95% CI: -US$6343, -US$192; p = 0.032) and OP costs (mean difference: -US$2001, 95% CI: -US$3334, -US$526; p = 0.004; Supplementary Table 5) relative to warfarin-treated patients.
Discussion
This US-based retrospective cohort study compared HRU and healthcare costs of rivaroxaban versus warfarin among NVAF patients with obesity and polypharmacy. In this patient population, rivaroxaban maintained its economic benefits compared with warfarin up to 12 months and 36 months of follow-up despite the use of multiple concurrent medications. In particular, rivaroxaban was associated with significantly lower HRU, including lower rates of hospitalization, compared with warfarin. This lower HRU translated into significantly reduced all-cause and NVAF-related total healthcare costs among polypharmacy patients treated with rivaroxaban compared with those treated with warfarin, with significant medical cost savings due to lower hospitalization fully offsetting higher pharmacy costs. These results provide further support for the persistent economic benefits of rivaroxaban compared with warfarin among commercially insured NVAF patients with obesity who are dependent on polypharmacy.
The results of the present study build upon prior findings in NVAF patients with obesity irrespective of polypharmacy status [49,50]. In a recent study by the present authors [50], NVAF patients with obesity initiated on rivaroxaban had significantly lower medical costs due to reduced hospitalizations, leading to significantly lower total healthcare costs PPY up to 12 months (mean adjusted cost difference: -US$4579, 95% CI: -US$7609, -US$1052; p < 0.05) and 36 months of follow-up (mean difference: -US$2731; 95% CI: -US$4889, -US$290; p = 0.032) compared with those initiated on warfarin. Similarly, a retrospective study of NVAF patients with morbid obesity (BMI ≥40 kg/m2) by Peterson et al. [49] found that rivaroxaban was associated with significantly lower annual total healthcare costs compared with warfarin (US$48,552 vs 52,418; p = 0.0025), primarily due to lower hospitalization rates. The present study findings suggest that this economic advantage of rivaroxaban over warfarin among NVAF patients with obesity may persist even among those with polypharmacy use.
The present findings could have important implications for clinical practice given that polypharmacy may add to the burden of AF by increasing the risk of drug–drug interactions, medication nonadherence, inappropriate medication use or medication errors, morbidity events, and mortality [8]. Among patients receiving anticoagulants, the use of polypharmacy has been linked to poorer anticoagulation control [14,58,59]. Warfarin-treated patients receiving polypharmacy may be particularly prone to drug–drug interactions that are associated with increased risk of bleeding complications [60]. Polypharmacy has also been shown to increase the risk of hospitalization among AF patients treated with anticoagulants [17,19]. In an analysis of data from the prospective multicenter thrombEVAL study (n = 2011) [17], the impact of polypharmacy on clinical outcomes was evaluated among patients treated with VKAs (predominantly phenprocoumon) up to 3 years of follow-up. In this population, there was an increased risk of hospitalization among patients with 5–8 medications (HR: 1.36; 95% CI: 1.08, 1.70) and ≥9 medications (HR: 1.60; 95% CI: 1.26, 2.03) relative to no polypharmacy. Moreover, a 4% increase in the risk of hospitalization was observed per additional medication used [17]. Based on the present study findings, rivaroxaban may reduce this heightened risk of hospitalization commonly associated with polypharmacy use, particularly among NVAF patients with obesity.
The economic advantage of rivaroxaban over warfarin in the present study may stem from different factors, including the lack of requirement for routine anticoagulation monitoring and fewer drug–drug interactions [48,49]. Although routine INR and other laboratory tests were not parsed out in the present analysis, significantly lower rates of all-cause and NVAF-related OP visits among rivaroxaban-treated patients may partly reflect a reduced frequency of visits related to these procedures. Rivaroxaban may also reduce the economic burden of disease by mitigating the risk of stroke/SE compared with warfarin. In Markov decisions models using clinical trial data [61,62], rivaroxaban was found to be cost-effective compared with warfarin based on its efficacy in reducing stroke/SE and intracranial hemorrhage in the pivotal ROCKET AF trial [27]. More recently, a retrospective cohort study by Milentijevic et al. [47] compared healthcare costs among NVAF patients before and after a first stroke over a mean follow-up period of 28 months. In this study, rivaroxaban was associated with fewer strokes compared with warfarin (2.0 vs 3.3%), respectively. Among patients who had stroke, increases in total all-cause costs during the poststroke period were significantly lower with rivaroxaban compared with warfarin (1.78 vs 3.07-fold increase compared with the prestroke period, respectively). Given the lower rate of stroke among rivaroxaban-treated patients, these smaller pre- to poststroke cost increases may have been partly due to fewer recurrent strokes in the rivaroxaban relative to the warfarin cohort [47]. Similarly, several observational studies have found that the effectiveness of rivaroxaban is improved compared with warfarin among complex NVAF patients with obesity and/or polypharmacy [16,35–37,39]. Thus, it is plausible that the economic advantages of rivaroxaban in the present study population may also reflect its greater protective effect against stroke/SE relative to warfarin. The present study findings and those of Milentijevic et al. [47] highlight the importance of anticoagulant selection for reducing the economic burden of NVAF, particularly due to stroke/SE, among different patient populations.
While the majority of patients with AF are of advanced age (mean age ≥70 years) [63–66], there is considerable evidence to suggest that the incidence and prevalence of the disease is increasing among all age subgroups [43,44,67]. Among younger individuals, the risk of incident AF is two- to threefold higher among those who present with obesity [68–71]. An additional concern is that high BMI appears to be more common among younger AF patients compared with those of older age based on the results of large cohort studies [7,72]. In light of this evidence, the societal and economic burden of younger patients with NVAF and obesity may not be trivial. Thus, the present study provides unique insight into the impact of polypharmacy among a distinct commercially insured cohort of younger patients, who may nonetheless contribute to the clinical and economic burden of the disease.
Factors contributing to the reduced HRU and costs among patients initiated on rivaroxaban versus warfarin may have included differences in routine safety monitoring. Among patients treated with warfarin, INR monitoring is required to maintain drug responses within the therapeutic range needed to achieve the benefits of anticoagulation, while avoiding the risk of major bleeding [73]. In real-world clinical practice, warfarin-treated patients undergo INR monitoring on a regular basis, although monitoring may become less frequent once patients have established a stable treatment regimen [49,74]. Routine INR monitoring is not required among DOAC users, which may have contributed to the lower rates of HRU, particularly OP visits in the present study.
This study was subject to a number of limitations. In particular, obesity was classified based on ICD diagnosis codes for high BMI. Since height and weight are not available in claims data, some patients with obesity may not have been captured in this analysis. Consistent with this, previous validation studies have shown that diagnostic codes for obesity may underestimate the true prevalence of obesity [75]. However, given the high specificity and modest to high positive predictive values, diagnosis codes may be considered a viable method of identifying obese patients [76–79]. Additional limitations, commonly associated with retrospective claims analyses, may include coding inaccuracies that could lead to misidentification and lack of availability of certain pharmacy-related information (i.e., medications administered in inpatient settings and over-the-counter medications). The impact of unmeasured confounders cannot be ruled out in the present analysis, although the use of inverse probability of treatment weighting minimized confounding due to observed baseline characteristics. Furthermore, this study only evaluated direct healthcare costs, whereas indicators of indirect costs, such as lost productivity, were not available in the database. As a result, the findings may under-represent the overall burden of NVAF, obesity and polypharmacy. Finally, results of the present study, based on data from commercial insurance plans in the US, may not be generalizable to other populations. Despite these limitations, the current research contributes to the existing literature by providing valuable information with real-life scenarios and a large sample size.
Conclusion
In this real-world study of NVAF patients with obesity and polypharmacy in the US, rivaroxaban was associated with significantly lower HRU, including lower rates of hospitalization, compared with warfarin. Additionally, rivaroxaban was associated with significantly lower total all-cause and NVAF-related healthcare costs compared with warfarin, with significant medical cost savings due to lower hospitalization rates fully compensating for higher pharmacy costs. These findings suggest that rivaroxaban may have long-term incremental economic benefits compared with warfarin among NVAF patients with obesity and polypharmacy in a commercially insured US population.
•
Polypharmacy may impact the economic burden of nonvalvular atrial fibrillation-treated patients with obesity.
•
In this population, rivaroxaban was associated with lower healthcare resource utilization compared with warfarin.
•
Rivaroxaban significantly reduced all-cause and nonvalvular atrial fibrillation patients-related total healthcare costs.
•
Rivaroxaban maintained its economic benefits up to 36 months of follow-up.
Author contributions
JS Berger, V Ashton, A Kharat and KT Moore made substantial contributions to the conception of the present study. All authors made substantial contributions to data curation and study design. F Laliberté, D Lejeune, Y Jung and P Lefebvre contributed to the formal analysis. All authors contributed to the drafting of the completed work or revised it critically for important intellectual content. All named authors meet the International Committee of Medical Journal Editors (ICMJE) criteria for authorship for this article, take responsibility for the integrity of the work as a whole, and have given their approval for this version to be published.
Financial & competing interests disclosure
The present study was funded by Janssen Scientific Affairs, LLC. The sponsor was involved in study design; in the collection, analysis and interpretation of data; in the writing of the report; and in the decision to submit the article for publication. JS Berger received consultancy fees from Janssen Scientific Affairs, LLC. V Ashton and A Kharat are employees of Janssen Scientific Affairs, LLC and KT Moore is an employee at Janssen Pharmaceuticals Inc. who may own stock or stock options. F Laliberté, D Lejeune, Y Jung and P Lefebvre are employees of Groupe d'analyse, Ltée, a consulting firm that received consulting fees from Janssen Scientific Affairs, LLC for the conduct of this study. The authors have no other relevant affiliations or financial involvement with any organization or entity with a financial interest in or financial conflict with the subject matter or materials discussed in the manuscript apart from those disclosed.
Medical writing assistance was provided by ML Chanda, an employee at Analysis Group, Inc. and funded by Janssen Scientific Affairs, LLC.
Open access
This work is licensed under the Attribution-NonCommercial-NoDerivatives 4.0 Unported License. To view a copy of this license, visit http://creativecommons.org/licenses/by-nc-nd/4.0/
Supplementary Material
File (suppl_file.docx)
- Download
- 59.30 KB
References
Papers of special note have been highlighted as: • of interest; •• of considerable interest
1.
Centers for Disease Control and Prevention. Atrial fibrillation (2020). www.cdc.gov/heartdisease/atrial_fibrillation.htm
2.
Andrade J, Khairy P, Dobrev D, Nattel S. The clinical profile and pathophysiology of atrial fibrillation: relationships among clinical features, epidemiology, and mechanisms. Circ. Res. 114(9), 1453–1468 (2014).
3.
Stewart S, Hart CL, Hole DJ, Mcmurray JJ. A population-based study of the long-term risks associated with atrial fibrillation: 20-year follow-up of the Renfrew/Paisley study. Am. J. Med. 113(5), 359–364 (2002).
4.
Wolf PA, Abbott RD, Kannel WB. Atrial fibrillation as an independent risk factor for stroke: the Framingham Study. Stroke 22(8), 983–988 (1991).
5.
Menke J, Luthje L, Kastrup A, Larsen J. Thromboembolism in atrial fibrillation. Am. J. Cardiol. 105(4), 502–510 (2010).
6.
Reiffel JA. Atrial fibrillation and stroke: epidemiology. Am. J. Med. 127(4), e15–e16 (2014).
7.
Vyas V, Lambiase P. Obesity and atrial fibrillation: epidemiology, pathophysiology and novel therapeutic opportunities. Arrhythm Electrophysiol. Rev. 8(1), 28–36 (2019).
8.
Shaikh F, Pasch LB, Newton PJ, Bajorek BV, Ferguson C. Addressing multimorbidity and polypharmacy in individuals with atrial fibrillation. Curr. Cardiol. Rep. 20(5), 32 (2018).
9.
Kantor ED, Rehm CD, Haas JS, Chan AT, Giovannucci EL. Trends in prescription drug use among adults in the United States from 1999–2012. JAMA 314(17), 1818–1830 (2015).
10.
Quinn KJ, Shah NH. A dataset quantifying polypharmacy in the United States. Sci. Data 4, 170167 (2017).
11.
Padula WV, Allen RR, Nair KV. Determining the cost of obesity and its common comorbidities from a commercial claims database. Clin. Obes. 4(1), 53–58 (2014).
12.
Lamori JC, Mody SH, Gross HJ et al. Burden of comorbidities among patients with atrial fibrillation. Ther. Adv. Cardiovasc. Dis. 7(2), 53–62 (2013).
13.
Gnjidic D, Hilmer SN, Blyth FM et al. Polypharmacy cutoff and outcomes: five or more medicines were used to identify community-dwelling older men at risk of different adverse outcomes. J. Clin. Epidemiol. 65(9), 989–995 (2012).
14.
Chen N, Alam AB, Lutsey PL et al. Polypharmacy, adverse outcomes, and treatment effectiveness in patients >/=75 with atrial fibrillation. J. Am. Heart Assoc. 9(11), e015089 (2020).
•• This retrospective claims study evaluated the impact of polypharmacy on atrial fibrillation (AF) treatments among elderly patients with AF.
15.
Masnoon N, Shakib S, Kalisch-Ellett L, Caughey GE. What is polypharmacy? A systematic review of definitions. BMC Geriatrics 17(1), 230 (2017).
16.
Martinez BK, Baker WL, Sood NA et al. Influence of polypharmacy on the effectiveness and safety of rivaroxaban versus warfarin in patients with nonvalvular atrial fibrillation. Pharmacotherapy 39(2), 196–203 (2019).
• This retrospective claims study evaluated the impact of polypharmacy on effectiveness and safety of rivaroxaban versus warfarin, regardless of obesity.
17.
Eggebrecht L, Nagler M, Göbel S et al. Relevance of polypharmacy for clinical outcome in patients receiving vitamin K antagonists. J. Am. Geriatrics Soc. 67(3), 463–470 (2019).
18.
Wang Y, Singh S, Bajorek B. Old age, high risk medication, polypharmacy: a ‘trilogy’ of risks in older patients with atrial fibrillation. Pharm. Pract. (Granada) 14(2), 706 (2016).
19.
Gallagher C, Nyfort-Hansen K, Rowett D et al. Polypharmacy and health outcomes in atrial fibrillation: a systematic review and meta-analysis. Open Heart 7(1), e001257 (2020).
20.
Piccini JP, Hellkamp AS, Washam JB et al. Polypharmacy and the efficacy and safety of rivaroxaban versus warfarin in the prevention of stroke in patients with nonvalvular atrial fibrillation. Circulation 133(4), 352–360 (2016).
• This post hoc study of the ROCKET-AF clinical trial evaluated the impact of polypharmacy on a subgroup of patients.
21.
American College of Cardiology Foundation, American Heart Association, European Society Of Cardiology et al . Management of patients with atrial fibrillation (compilation of 2006 ACCF/AHA/ESC and 2011 ACCF/AHA/HRS recommendations): a report of the American College of Cardiology/American Heart Association Task Force on practice guidelines. Circulation 127(18), 1916–1926 (2013).
22.
Bristol-Myers Squibb Company. ELIQUIS (apixaban) – labeling-patient package insert (2012). www.accessdata.fda.gov/drugsatfda_docs/label/2012/202155s000lbl.pdf
23.
Boehringer Ingelheim Pharmaceuticals, Inc. PRADAXA® (dabigatran etexilate) – labeling-patient package insert (2020). www.accessdata.fda.gov/drugsatfda_docs/label/2020/022512s039lbl.pdf
24.
Janssen Pharmaceuticals, Inc. XARELTO® (rivaroxaban) – labeling-patient package insert (2020). www.accessdata.fda.gov/drugsatfda_docs/label/2020/202439s031,022406s035lbl.pdf
25.
Giugliano RP, Ruff CT, Braunwald E et al. Edoxaban versus warfarin in patients with atrial fibrillation. N. Engl. J. Med. 369(22), 2093–2104 (2013).
26.
Granger CB, Alexander JH, Mcmurray JJ et al. Apixaban versus warfarin in patients with atrial fibrillation. N. Engl. J. Med. 365(11), 981–992 (2011).
27.
Patel MR, Mahaffey KW, Garg J et al. Rivaroxaban versus warfarin in nonvalvular atrial fibrillation. N. Engl. J. Med. 365(10), 883–891 (2011).
28.
Connolly SJ, Ezekowitz MD, Yusuf S et al. Dabigatran versus warfarin in patients with atrial fibrillation. N. Engl. J. Med. 361(12), 1139–1151 (2009).
29.
Saraiva JFK. Stroke prevention with oral anticoagulants: summary of the evidence and efficacy measures as an aid to treatment choices. Cardiol. Ther. 7(1), 15–24 (2018).
30.
Dzeshka MS, Lip GY. Non-vitamin K oral anticoagulants in atrial fibrillation: where are we now? Trends Cardiovasc. Med. 25(4), 315–336 (2015).
31.
Kirchhof P, Benussi S, Kotecha D et al. 2016 ESC Guidelines for the management of atrial fibrillation developed in collaboration with EACTS. Eur. J. Cardiothorac. Surg. 50(5), e1–e88 (2016).
32.
SPC. Warfarin 0.5mg tablets (2017). www.medicines.org.uk/emc/medicine/27651
33.
Martin K, Beyer-Westendorf J, Davidson BL, Huisman MV, Sandset PM, Moll S. Use of the direct oral anticoagulants in obese patients: guidance from the SSC of the ISTH. J. Thrombosis Haemostasis 14(6), 1308–1313 (2016).
34.
Balla SR, Cyr DD, Lokhnygina Y et al. Relation of risk of stroke in patients with atrial fibrillation to body mass index (from patients treated with rivaroxaban and warfarin in the rivaroxaban once daily oral direct factor Xa inhibition compared with vitamin K antagonism for prevention of stroke and embolism trial in atrial fibrillation trial). Am. J. Cardiol. 119(12), 1989–1996 (2017).
35.
Berger JS, Laliberté F, Kharat A et al. Real-world effectiveness and safety of rivaroxaban versus warfarin among non-valvular atrial fibrillation patients with obesity in a US population. Curr. Med. Res. Opin., 881–890 (2021) (Epub ahead of print).
36.
Perales IJ, San Agustin K, Deangelo J, Campbell AM. Rivaroxaban versus warfarin for stroke prevention and venous thromboembolism treatment in extreme obesity and high body weight. Ann. Pharmacother. 54(4), 344–350 (2020).
37.
Costa OS, Beyer-Westendorf J, Ashton V et al. Effectiveness and safety of rivaroxaban versus warfarin in obese nonvalvular atrial fibrillation patients: analysis of electronic health record data. Curr. Med. Res. Opin. 36(7), 1081–1088 (2020).
• This study compared rivaroxaban and warfarin users in obese nonvalvular atrial fibrillation patients (NVAF) with electronic health record.
38.
Mentias A, Heller E, Vaughan Sarrazin M. Comparative effectiveness of rivaroxaban, apixaban, and warfarin in atrial fibrillation patients with polypharmacy. Stroke 51(7), 2076–2086 (2020).
39.
Berger JS, Laliberte F, Kharat A et al. Comparative effectiveness and safety of rivaroxaban and warfarin among nonvalvular atrial fibrillation (NVAF) patients with obesity and polypharmacy in the United States (US). Adv. Ther. 38, 3771–3788 (2021).
•• This retrospective study used a design similar to the present study to evaluate stroke and major bleeding events among NVAF patients with obesity and polypharmacy.
40.
Kim MH, Johnston SS, Chu BC, Dalal MR, Schulman KL. Estimation of total incremental health care costs in patients with atrial fibrillation in the United States. Circ. Cardiovasc. Qual. Outcomes 4(3), 313–320 (2011).
41.
Fitch K, Broulette J, Kwong WJ. The economic burden of ischemic stroke and major hemorrhage in medicare beneficiaries with nonvalvular atrial fibrillation: a retrospective claims analysis. Am. Health Drug Benefits 7(4), 200–209 (2014).
42.
Patel NJ, Deshmukh A, Pant S et al. Contemporary trends of hospitalization for atrial fibrillation in the United States, 2000 through 2010: implications for healthcare planning. Circulation 129(23), 2371–2379 (2014).
43.
Jackson SL, Tong X, Yin X, George MG, Ritchey MD. Emergency department, hospital inpatient, and mortality burden of atrial fibrillation in the United States, 2006 to 2014. Am. J. Cardiol. 120(11), 1966–1973 (2017).
44.
Ball J, Carrington MJ, Mcmurray JJ, Stewart S. Atrial fibrillation: profile and burden of an evolving epidemic in the 21st century. Int. J. Cardiol. 167(5), 1807–1824 (2013).
45.
Laliberte F, Cloutier M, Crivera C et al. Effects of rivaroxaban versus warfarin on hospitalization days and other health care resource utilization in patients with nonvalvular atrial fibrillation: an observational study from a cohort of matched users. Clin. Ther. 37(3), 554–562 (2015).
46.
Laliberte F, Pilon D, Raut MK et al. Is rivaroxaban associated with lower inpatient costs compared to warfarin among patients with non-valvular atrial fibrillation? Curr. Med. Res. Opin. 30(8), 1521–1528 (2014).
47.
Milentijevic D, Lin JH, Chen YW et al. Healthcare costs before and after stroke in patients with non-valvular atrial fibrillation who initiated treatment with rivaroxaban or warfarin. J. Med. Econ. 24(1), 212–217 (2021).
48.
Mittal VS, Wu B, Song J, Milentijevic D, Ashton V, Mahajan D. Healthcare resource utilization and costs among nonvalvular atrial fibrillation patients initiating rivaroxaban or warfarin in skilled nursing facilities: a retrospective cohort study. Curr. Med. Res. Opin. 36(4), 529–536 (2020).
49.
Peterson ED, Ashton V, Chen YW, Wu B, Spyropoulos AC. Comparative effectiveness, safety, and costs of rivaroxaban and warfarin among morbidly obese patients with atrial fibrillation. Am. Heart J. 212, 113–119 (2019).
•• This retrospective claims study evaluated cost of rivaroxaban versus warfarin among NVAF with morbid obesity patients, but used a design different from that of the present study.
50.
Berger JS, Laliberte F, Kharat A et al. Healthcare resource utilization and costs of rivaroxaban versus warfarin among non-valvular atrial fibrillation (NVAF) patients with obesity in a US population. J. Med. Econ. 24(1), 550–562 (2021).
51.
Schroeder KM, Gelwicks S, Naegeli AN, Heaton PC. Comparison of methods to estimate disease-related cost and healthcare resource utilization for autoimmune diseases in administrative claims databases. Clinico. Econ. Outcomes Res. 11, 713–727 (2019).
52.
Austin PC, Stuart EA. Moving towards best practice when using inverse probability of treatment weighting (IPTW) using the propensity score to estimate causal treatment effects in observational studies. Stat. Med. 34(28), 3661–3679 (2015).
53.
Quan H, Sundararajan V, Halfon P et al. Coding algorithms for defining comorbidities in ICD-9-CM and ICD-10 administrative data. Med. Care 43(11), 1130–1139 (2005).
54.
Lip GY, Nieuwlaat R, Pisters R, Lane DA, Crijns HJ. Refining clinical risk stratification for predicting stroke and thromboembolism in atrial fibrillation using a novel risk factor-based approach: the Euro Heart Survey on Atrial Fibrillation. Chest 137(2), 263–272 (2010).
55.
Melgaard L, Gorst-Rasmussen A, Lane DA, Rasmussen LH, Larsen TB, Lip GY. Assessment of the CHA2DS2-VASc score in predicting ischemic stroke, thromboembolism, and death in patients with heart failure with and without atrial fibrillation. JAMA 314(10), 1030–1038 (2015).
56.
Pisters R, Lane DA, Nieuwlaat R, De Vos CB, Crijns HJ, Lip GY. A novel user-friendly score (HAS-BLED) to assess 1-year risk of major bleeding in patients with atrial fibrillation: the Euro Heart Survey. Chest 138(5), 1093–1100 (2010).
57.
Austin PC. Using the standardized difference to compare the prevalence of a binary variable between two groups in observational research. Comm. Stat. Sim. Comput. 38(6), 1228–1234 (2009).
58.
Rose AJ, Hylek EM, Ozonoff A, Ash AS, Reisman JI, Berlowitz DR. Patient characteristics associated with oral anticoagulation control: results of the Veterans AffaiRs Study to Improve Anticoagulation (VARIA). J. Thromb. Haemostas. 8(10), 2182–2191 (2010).
59.
Mohammed S, Aljundi AH, Kasem M, Alhashemi M, El-Menyar A. Anticoagulation control among patients with nonvalvular atrial fibrillation: a single tertiary cardiac center experience. J. Adv. Pharm. Technol. Res. 8(1), 14–18 (2017).
60.
Teklay G, Shiferaw N, Legesse B, Bekele ML. Drug–drug interactions and risk of bleeding among inpatients on warfarin therapy: a prospective observational study. Thromb. J. 12, 20 (2014).
61.
Lee S, Anglade MW, Pham D, Pisacane R, Kluger J, Coleman CI. Cost–effectiveness of rivaroxaban compared to warfarin for stroke prevention in atrial fibrillation. Am. J. Cardiol. 110(6), 845–851 (2012).
62.
Harrington AR, Armstrong EP, Nolan PE Jr, Malone DC. Cost–effectiveness of apixaban, dabigatran, rivaroxaban, and warfarin for stroke prevention in atrial fibrillation. Stroke 44(6), 1676–1681 (2013).
63.
Feinberg WM, Blackshear JL, Laupacis A, Kronmal R, Hart RG. Prevalence, age distribution, and gender of patients with atrial fibrillation. Analysis and implications. Arch. Intern. Med. 155(5), 469–473 (1995).
64.
Khairallah F, Ezzedine R, Ganz LI, London B, Saba S. Epidemiology and determinants of outcome of admissions for atrial fibrillation in the United States from 1996 to 2001. Am. J. Cardiol. 94(4), 500–504 (2004).
65.
Lane DA, Skjoth F, Lip GYH, Larsen TB, Kotecha D. Temporal trends in incidence, prevalence, and mortality of atrial fibrillation in primary care. J. Am. Heart Assoc. 6(5), (2017).
66.
Miyasaka Y, Barnes ME, Gersh BJ et al. Secular trends in incidence of atrial fibrillation in Olmsted County, Minnesota, 1980 to 2000, and implications on the projections for future prevalence. Circulation 114(2), 119–125 (2006).
67.
Williams BA, Chamberlain AM, Blankenship JC, Hylek EM, Voyce S. Trends in atrial fibrillation incidence rates within an integrated health care delivery system, 2006 to 2018. JAMA Netw. Open 3(8), e2014874 (2020).
68.
Berkovitch A, Kivity S, Klempfner R et al. Body mass index and the risk of new-onset atrial fibrillation in middle-aged adults. Am. Heart J. 173, 41–48 (2016).
69.
Schmidt M, Botker HE, Pedersen L, Sorensen HT. Comparison of the frequency of atrial fibrillation in young obese versus young nonobese men undergoing examination for fitness for military service. Am. J. Cardiol. 113(5), 822–826 (2014).
70.
Karasoy D, Bo Jensen T, Hansen ML et al. Obesity is a risk factor for atrial fibrillation among fertile young women: a nationwide cohort study. Europace 15(6), 781–786 (2013).
71.
Tedrow UB, Conen D, Ridker PM et al. The long- and short-term impact of elevated body mass index on the risk of new atrial fibrillation the WHS (women's health study). J. Am. Coll. Cardiol. 55(21), 2319–2327 (2010).
72.
Pandey A, Gersh BJ, McGuire DK et al. Association of body mass index with care and outcomes in patients with atrial fibrillation: results from the ORBIT-AF Registry. JACC Clin. Electrophysiol. 2(3), 355–363 (2016).
73.
Dlott JS, George RA, Huang X et al. National assessment of warfarin anticoagulation therapy for stroke prevention in atrial fibrillation. Circulation 129(13), 1407–1414 (2014).
74.
Barnes GD, Misirliyan S, Kaatz S et al. Barriers and facilitators to reducing frequent laboratory testing for patients who are stable on warfarin: a mixed methods study of de-implementation in five anticoagulation clinics. Implement. Sci. 12(1), 87 (2017).
75.
Samadoulougou S, Idzerda L, Dault R, Lebel A, Cloutier AM, Vanasse A. Validated methods for identifying individuals with obesity in health care administrative databases: a systematic review. Obes. Sci. Pract. 6(6), 677–693 (2020).
76.
Martin BJ, Chen G, Graham M, Quan H. Coding of obesity in administrative hospital discharge abstract data: accuracy and impact for future research studies. BMC Health Serv. Res. 14, 70 (2014).
77.
Lloyd JT, Blackwell SA, Wei II, Howell BL, Shrank WH. Validity of a claims-based diagnosis of obesity among Medicare beneficiaries. Eval. Health Prof. 38(4), 508–517 (2015).
78.
Ammann EM, Kalsekar I, Yoo A, Johnston SS. Validation of body mass index (BMI)-related ICD-9-CM and ICD-10-CM administrative diagnosis codes recorded in US claims data. Pharmacoepidemiol. Drug Saf. 27(10), 1092–1100 (2018).
79.
Jain R, Watzker A, Luo X et al. Validation of obesity coding among newly treated nonvalvular atrial fibrillation patients using an integrated electronic medical record and claims database. Curr. Med. Res. Opin. 1–9 (2019).
Information & Authors
Information
Published In
Pages: 1235 - 1250
PubMed: 34378989
Copyright
© 2021 Janssen Scientific Affairs, LLC. This work is licensed under the Attribution-NonCommercial-NoDerivatives 4.0 Unported License
History
Received: 18 June 2021
Accepted: 25 July 2021
Published online: 11 August 2021
Keywords:
Topics
Authors
Funding Information
Metrics & Citations
Metrics
Article Usage
Article usage data only available from February 2023. Historical article usage data, showing the number of article downloads, is available upon request.
Citations
How to Cite
Economic burden of rivaroxaban and warfarin among nonvalvular atrial fibrillation patients with obesity and polypharmacy. (2021) Journal of Comparative Effectiveness Research. DOI: 10.2217/cer-2021-0150
Export citation
Select the citation format you wish to export for this article or chapter.
Citing Literature
- Jaime P. Almandoz, Jamy D. Ard, Chellse Gazda, Shenelle Edwards‐Hampton, Healthcare Resource Utilisation and Cost of Obesity and Related Complications in the United States: A Systematic Literature Review, Diabetes, Obesity and Metabolism, 10.1111/dom.70602, 28, 5, (4121-4136), (2026).
- Mark Alberts, Jinghua He, Akshay Kharat, Christopher D. Pericone, Veronica Ashton, Health Care Resource Use and Costs of Rivaroxaban Versus Warfarin Among Nonvalvular Atrial Fibrillation Polypharmacy Patients With Obesity, Journal of the American Heart Association, 10.1161/JAHA.124.036401, 14, 2, (2025).
- Jeffrey S. Berger, Veronica Ashton, François Laliberté, Guillaume Germain, Brahim Bookhart, Dominique Lejeune, Julien Boudreau, Patrick Lefebvre, Matthew R. Weir, Healthcare Resource Utilization and Costs of Rivaroxaban Versus Warfarin Among Non-valvular Atrial Fibrillation (NVAF) Patients with Diabetes in a US Population, Advances in Therapy, 10.1007/s12325-022-02422-9, 40, 3, (1224-1241), (2023).
- Matthew R. Weir, Yen-Wen Chen, Jinghua He, Brahim Bookhart, Alicia Campbell, Veronica Ashton, Healthcare Resource Utilization and Costs of Rivaroxaban Versus Warfarin Among Nonvalvular Atrial Fibrillation Patients with Obesity and Diabetes, Diabetes Therapy, 10.1007/s13300-021-01161-4, 12, 12, (3167-3186), (2021).