Assessing direct costs of treating metastatic triple-negative breast cancer in the USA
Publication: Journal of Comparative Effectiveness Research
Abstract
Aim: Evaluation of monthly cost during metastatic triple-negative breast cancer (mTNBC) treatment. Patients & methods: Retrospective electronic medical record review of US females aged ≥18 years diagnosed with mTNBC between 1 January 2010 and 31 January 2016. Mean monthly costs per patient were evaluated from start of mTNBC treatment until transfer to hospice, end of record or 3 months prior to death. Results: The mean monthly cost of first line was $21,908 for 505 treated patients; 50.2% of cost was attributable to hospitalization and emergency department visits, and 32.7% to anticancer therapy. Similar patterns were observed for subsequent lines of therapy. Conclusion: The majority of costs were attributable to hospitalization and emergency department services, suggesting a need for effective interventions to reduce utilization of costly services.
Lay abstract
This study looked at monthly cost during metastatic triple-negative breast cancer (mTNBC) treatment. Medical records were reviewed for US females aged 18 years or older, diagnosed with mTNBC between January 2010 and January 2016. Average monthly costs per patient were looked at from the start of mTNBC treatment until transfer to end of life care, end of the medical record or 3 months before death. The average monthly cost of first-line treatment was $21,908 for 505 treated patients; about half of this cost was from hospitalization and emergency department visits, and about a third was from anticancer therapy. Similar patterns were seen for subsequent lines of therapy. Most of the costs were from hospitalization and emergency department services, pointing to a need for change to reduce the use of costly services.
Metastatic breast cancer (mBC) is a leading cause of cancer death in women [1]. In 2019, it is estimated that 41,760 women in the United States (US) will die of breast cancer, making it the second leading cause of cancer death for women after lung cancer [2]. Despite advances in treatment, the prognosis for mBC remains poor, with a median survival of approximately 20 months in first-line (1L) treatment in Phase III trials [3].
Triple-negative breast cancer (TNBC) is a phenotypic classification based on immunohistochemical markers, showing no expression of estrogen receptor (ER) and progesterone receptor (PR), and no overexpression or amplification of HER2. This histological subtype is estimated to account for 10–20% of breast cancers [4], and triple-negative tumors are often aggressive and have a less favorable prognosis compared with other breast cancers [5].
Prior to recently approved immunotherapy and sacituzumab govitecan-hziy, the median overall survival of patients with mTNBC was approximately 13 months and median duration of 1L therapy was approximately 12 weeks. Most (80%) patients received two lines of therapy with a median duration of 9 weeks, and about 50% received three lines of therapy with a median duration of 4 weeks [6]. Overall, the main challenge in treating mTNBC is that targeted anti-ER or anti-HER2 therapies used in other subtypes of breast cancer are ineffective due to the absence of the required target receptors. Despite an elevated risk of relapse and metastasis [7], there are limited specific treatments for mTNBC apart from those chemotherapy backbones (e.g., platinum agents, taxanes, anthracyclines and antimetabolites) recommended for other mBCs [8]. The current National Comprehensive Cancer Network (NCCN) guidelines for TNBC recommend adding atezolizumab, a PD-L1 checkpoint inhibitor, in combination with nab-paclitaxel for treatment of locally recurrent unresectable or mTNBC expressing PD-L1. The NCCN guidelines recently expanded to recommend treatment with sacituzumab govitecan-hziy for patients with mTNBC who have received at least two prior lines of therapy following metastatic diagnosis. The NCCN guidelines also support use of olaparib and talazoparib in any breast cancer subtype, if the patient has a germline BRCA1 or BRCA2 mutation [8].
Efforts are underway to address the limited treatments for mTNBC. A recent Phase III trial revealed that progression-free survival was significantly longer among patients with PD-L1 expression who received atezolizumab in combination with nab-paclitaxel compared with those who received a placebo in combination with nab-paclitaxel [9]; this led to the approval of atezolizumab + nab-paclitaxel for PD-L1-positive mTNBC. Atezolizumab blocks PD-L1. The SP142 assay is used to determine whether patients have PD-L1 in their tumor. The treatment combination of atezolizumab in combination with nab-paclitaxel is recommend for patients with TNBC whose tumor is PD-L1 positive [10]. Despite the recent efforts to identify treatment options for mTNBC, there is a lack of detailed information on the cost of treatment for these patients. Prior research for mBC suggests that roughly only one quarter of costs are attributable to chemotherapy [11]. The limited data thus far generally suggest that patients with TNBC utilize more services (e.g., annual hospitalizations and emergency department [ED] visits) and are costlier to treat (77% higher adjusted inpatient costs) than patients with non-TNBC. Prior research also indicates that the patients with TNBC incur higher treatment costs than those with non-TNBC [12]. To address this need, we undertook an investigation to evaluate the current treatment patterns and cost of care for patients treated for mTNBC.
Patients & methods
Study design
This was a retrospective, observational study based on electronic medical record (EMR) and billing data obtained from the Vector Oncology Data Warehouse, which is a repository of data from nine community oncology practices in the USA. The Vector Oncology Data Warehouse contains the complete oncology record for each patient including provider notes to support collection of key information, such as the date and occurrence of disease progression, which is not routinely available in the prespecified EMR data-entry fields.
Patients
To be eligible for inclusion, patients were females aged ≥18 years and diagnosed with mBC (ICD-9 code of 174.x or ICD-10 code of C50.x). All eligible patients were confirmed to have diagnosed triple-negative (ER-, PR- and HER2-negative) mBC between January 2010 and January 2016. Patients who received systemic anticancer treatment for another primary cancer following the diagnosis of mTNBC were excluded from the study.
Procedures
Data collection
Demographic and clinical characteristics were assessed for all patients. The demographic data included age, sex, race and insurance status. These demographics were used to match hospitalization events to the National (Nationwide) Inpatient Sample (NIS) subset of the Healthcare Cost and Utilization Project (HCUP). Healthcare Common Procedure Coding System/Current Procedural Terminology (HCPCS/CPT) codes were collected from the EMR data to assess outpatient procedures and physician office visits. Provider notes supported data collection for information not otherwise available in structured data fields, such as performance status, dates of disease progression and co-morbidities. These data were abstracted during thorough review of the EMR by experienced clinical research nurses.
Data were collected from the start of treatment following mTNBC diagnosis until the first of the following events: transfer to hospice, end of record or 3 months prior to death. This period was segmented into three time periods: 1L, second line (2L) and third or later line (3L+). The 1L period was defined as the time from the start of first treatment following mTNBC diagnosis until disease progression. The 2L period began with the start of the treatment following the disease progression on 1L therapy and ended with the subsequent disease progression. Participants who did not experience any disease progression following the start of 1L treatment remained in the 1L period for the study duration, and those with only one disease progression following the start of 1L treatment remained in the 2L period for the study duration. The 3L+ period started with the initiation of treatment following the second metastatic disease progression and ended with record of transfer to hospice, end of patient record or the date 3 months prior to death, whichever occurred first. The 3L+ period was defined as above to estimate the period of active treatment and exclude end of life care. In this study, the occurrence of disease progression signaled the end of a line of therapy, rather than the mere change of treatments. Documentation within the patient record, such as pathology reports, imaging report notes and statements about disease progression in the oncologist progress notes, were collectively used to determine the occurrence and date of disease progression. All regimens received during treatment of mTNBC were documented. Although receipt of treatment was not required for inclusion in the study, the cost analysis was limited to the subset of patients who received treatment.
Assessment of healthcare costs
Monthly paid costs were evaluated for 1L, 2L and 3L+. Costs were evaluated separately for patients according to the treatment-based grouping variable. Monthly costs were evaluated to adjust for variable durations of treatment periods. Total monthly costs included all expenditures attributable to inpatient hospitalization, physician office visits, infused supportive care drugs, systemic anticancer therapy, all other drugs provided and procedures delivered in the medical oncology setting. Hospitalization costs were estimated based on the median cost of case-matched hospitalizations for patients with cancer in the HCUP NIS. Key match criteria were used for diagnosis, length of stay, age range, sex and race. Costs for outpatient procedures and physician office visits were estimated by matching patient HCPCS/CPT codes from the EMR data to published national median paid amounts listed in the Centers for Medicare and Medicaid Services fee schedule. The mean wholesale price reported in Reimbursement Codes published by RJ Health Systems (subscription) was used to determine the cost for each medication. All costs were adjusted to the year 2017 price value using inflation rates from the US consumer price index.
Statistical methods
The study subsample of treated patients was stratified by treatment class. Patients were grouped based on the first regimen received in the 1L of therapy. Those who progressed were regrouped based on the first regimen received in each of the 2L and the 3L+ lines of therapy. The treatment groups were defined as follows: ‘Platinum’ was defined as a platinum-containing regimen without a taxane agent; ‘taxane’ was defined as a taxane-containing regimen without a platinum agent; ‘platinum+taxane’ was defined as a regimen that includes both a platinum agent and a taxane agent; and ‘other’ was defined as a regimen that did not include platinum or taxane agents (e.g., capecitabine, doxorubicin, gemcitabine, cyclophosphamide, etc.).
Descriptive methods were used to evaluate patient characteristics overall, and across treatment groups. Fisher’s Exact test or Chi-square, and t-test or Wilcoxon rank sum test were used to compare patient characteristics by treatment groups on categorical and continuous variables, respectively. Analyses of monthly costs were conducted separately for total monthly costs and individual cost components. Unadjusted comparisons across treatment groups were performed using analysis of variance (ANOVA) on log-transformed costs, assuming an underlying skewed distribution of cost data. Adjusted comparisons between treatment groups used generalized linear regression models with a log-link function and gamma distribution, controlling for demographic and clinical characteristics.
Results
Patient characteristics
Of 608 total eligible patients, 505 received systemic anticancer therapy. Among the 505 patients who received 1L therapy, 303 of these patients received subsequent 2L therapy. Of those who received 2L therapy, 178 patients advanced to receive 3L or more of therapy. Demographic characteristics of the treated patients are summarized in Table 1 by treatment class. Patients were classified in Table 1 based on the first regimen received in the 1L of therapy. The mean age at diagnosis of all 505 treated patients was 56.6 years, and 72.3% were under 65 years of age. The majority of treated patients were of White race (59.8%). Clinical characteristics were mostly consistent across treatment groups; however, among treated patients, stage of disease at initial diagnosis differed across groups (p < 0.001). The pattern of findings suggests that patients in the taxane or platinum+taxane groups (38.6, 44.4%, respectively) were more likely to be stage IV at initial diagnosis than those in the platinum group (9.4%).
| Variable/statistic | Treatment class | Overall (N = 505) | p-value | |||
|---|---|---|---|---|---|---|
| Platinum (n = 96) | Taxane (n = 220) | Platinum+taxane (n = 45) | Other (n = 144) | |||
| Age (years) at mTNBC diagnosis, mean (SD) | 53.6 (11.9) | 57.7 (12.4) | 58.5 (15.3) | 56.7 (13.9) | 56.6 (13.1) | 0.0470† |
| Age (years) at mTNBC diagnosis, n (%) | 0.0217‡ | |||||
| – <65 | 79 (82.3) | 152 (71.4) | 26 (57.8) | 103 (71.5) | 365 (72.3) | |
| – ≥65 | 17 (17.7) | 63 (28.6) | 19 (42.2) | 41 (28.5) | 140 (27.7) | |
| Race category, n (%) | 0.8979§ | |||||
| – White | 54 (56.3) | 130 (59.1) | 30 (66.7) | 88 (61.1) | 302 (59.8) | |
| – Black or African–American | 37 (38.5) | 77 (35.0) | 12 (26.7) | 49 (34.0) | 175 (34.7) | |
| – American–Indian or Alaskan Native | 0 (0.0) | 0 (0.0) | 0 (0) | 1 (0.7) | 1 (0.2) | |
| – Asian | 2 (2.1) | 4 (1.8) | 1 (2.2) | 2 (1.4) | 9 (1.8) | |
| – Hispanic or Latino | 1 (1.0) | 4 (1.8) | 1 (2.2) | 3 (2.1) | 9 (1.8) | |
| – Native Hawaiian or other Pacific Islander | 1 (1.0) | 0 (0.0) | 0 (0.0) | 0 (0.0) | 1 (0.2) | |
| – Undocumented | 1 (1.0) | 5 (2.3) | 1 (2.2) | 1 (0.7) | 8 (1.6) | |
| BMI (kg/m2) at mTNBC diagnosis | 0.8423† | |||||
| – Mean (SD) | 29.8 (7.5) | 29.8 (6.6) | 28.9 (7.0) | 29.3 (6.3) | 29.6 (6.7) | |
| Disease stage at diagnosis, n (%) | ||||||
| – 0–III | 80 (83.3) | 123 (55.9) | 20 (44.4) | 106 (73.6) | 329 (65.1) | <0.0001‡ |
| – IV | 9 (9.4) | 85 (38.6) | 20 (44.4) | 28 (19.4) | 142 (28.1) | <0.0001‡ |
| – Other/unknown/undocumented | 7 (7.3) | 12 (5.5) | 5 (11.1) | 10 (6.7) | 34 (6.7) | 0.5715‡ |
| Menopausal status prior to metastatic diagnosis (+30 days), n (%) | 0.0382§ | |||||
| – Pre/perimenopausal | 22 (22.9) | 30 (13.6) | 8 (17.8) | 33 (22.2) | 92 (18.2) | |
| – Postmenopausal | 54 (56.3) | 141 (64.1) | 19 (42.2) | 76 (52.8) | 290 (57.4) | |
| – Stated as unknown | 0 (0.0) | 1 (0.5) | 0 (0.0) | 0 (0.0) | 1 (0.2) | |
| – Undocumented | 20 (20.8) | 48 (21.8) | 18 (40.0) | 36 (25.0) | 122 (24.2) | |
| Number of metastatic sites at mTNBC diagnosis, n (%) | 0.0398‡ | |||||
| – 1 | 44 (45.8) | 115 (52.3) | 15 (33.3) | 81 (56.3) | 255 (50.5) | |
| – ≥2 | 52 (54.2) | 105 (47.7) | 30 (66.7) | 63 (43.8) | 250 (49.5) | |
| Composite performance status at mTNBC diagnosis, n (%) | 0.0555‡ | |||||
| – Impaired¶ | 4 (4.2) | 15 (6.8) | 5 (11.1) | 19 (13.2) | 43 (8.5) | |
| TNBC status at diagnosis, n (%) | 0.7031‡ | |||||
| – Yes | 82 (85.4) | 191 (86.8) | 36 (80.0) | 123 (85.4) | 432 (85.5) | |
| – No | 14 (14.6) | 29 (13.2) | 9 (20.0) | 21 (14.6) | 73 (14.5) | |
†
ANOVA – equal variances.
‡
Chi-square test.
§
Monte Carlo Exact test.
¶
Defined as ECOG performance status ≥2 or provider documented impairment.
ANOVA: Analysis of variance; BMI: Body mass index; ECOG: Eastern Cooperative Oncology Group; mTNBC: Metastatic triple-negative breast cancer; SD: Standard deviation.
Treatment patterns
The mean ± standard deviation (SD) duration of 1L therapy was 7.3 ± 9.3 months. The distribution of treatments during 1L is presented by regimen in Figure 1. The highest proportion of patients received a taxane-containing regimen without platinum in the first regimen of the 1L of therapy (taxane; n = 220; 43.6%), followed by treatment with an agent other than platinum or taxane agents (other; n = 144; 25.5%), platinum without taxane (platinum; n = 96; 19.0%) and platinum in combination with taxane (platinum+taxane; n = 45; 8.9%). This usage pattern appeared similar among the 58 patients who received a subsequent second regimen during 1L: Taxane (n = 26; 44.8%), Other (n = 20; 34.5%), platinum (n = 9; 15.5%), and platinum+taxane (n = 3; 5.2%). Only seven patients received three or more regimens during 1L.
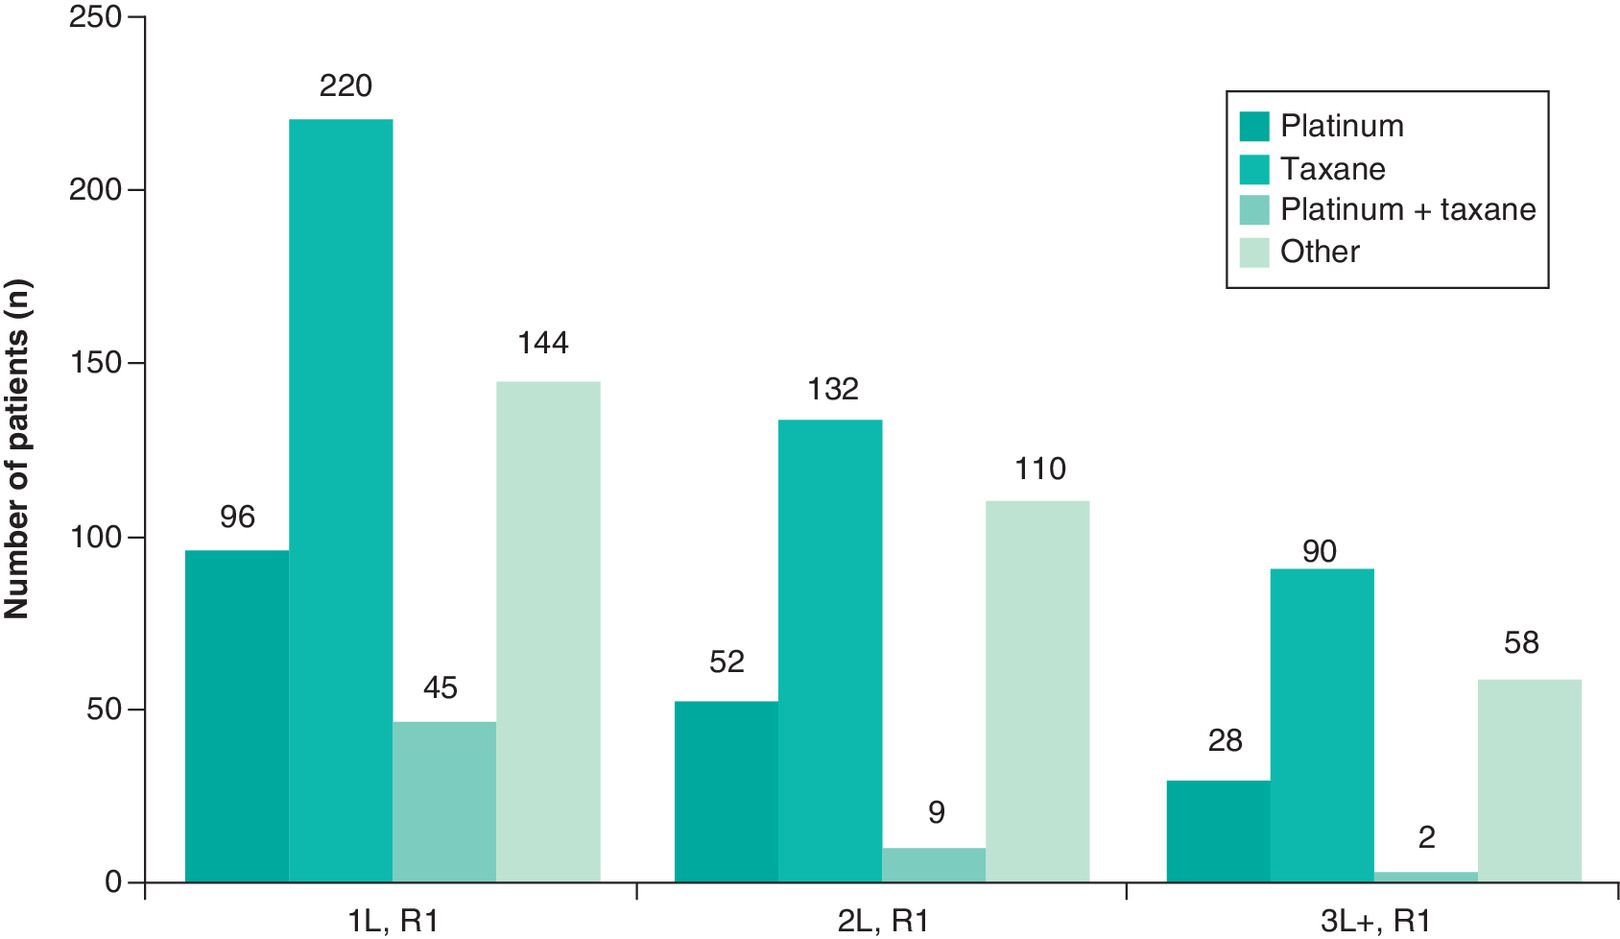
Figure 1. Distribution of treatments among 505 patients, by regimen 1 in each line of therapy.
1L: First line; 2L: Second line; 3L+: Third or later line through the first of transfer to hospice, end of record or 3 months prior to death; R1: Regimen 1.
Overall, 303 patients with progressive disease initiated 2L treatment. The mean ± SD duration of 2L therapy was 4.4 ± 5.0 months. The distribution of treatments for patients who received 2L therapy is presented by regimen in Figure 1. The distribution of treatments in the first regimen of 2L was similar to that observed in 1L. Taxane was the most common (n = 132; 43.6%), followed by Other (n = 110; 36.3%), platinum (n = 52; 17.2%) and platinum+taxane (n = 9; 3.0%). The same usage pattern was observed during the second regimen of 2L.
A subset of 178 patients who were treated in 2L had subsequent progressive disease and initiated 3L treatment. The mean ± SD duration of treatment for the 3L+ period was 5.9 ± 6.0 months. The distribution of treatments in the first regimen of 3L therapy is shown in Figure 1. Similar to 1L and 2L, the most common treatment received in the first regimen of 3L was Taxane (n = 90; 50.6%), followed by Other (n = 58; 32.6%). Only 11 patients received a subsequent second regimen in 3L, and only two received a third regimen in 3L.
Monthly healthcare costs: 1L
Monthly healthcare costs and individual components of costs during 1L, 2L and 3L+ lines of therapy are summarized in Figure 2. The total mean monthly cost of 1L therapy was $21,908 (median $8700) as described in Table 2. The greatest proportion of cost was attributable to hospitalizations ($10,448; median $0), followed by systemic anticancer therapy ($7166; median $1226). Among 505 patients who received 1L treatment, only 175 were hospitalized during this period. The total monthly cost of 1L therapy differed significantly across treatment groups (p = 0.011). The pattern of findings suggests that the Taxane group incurred the highest total monthly cost (median $10,414).
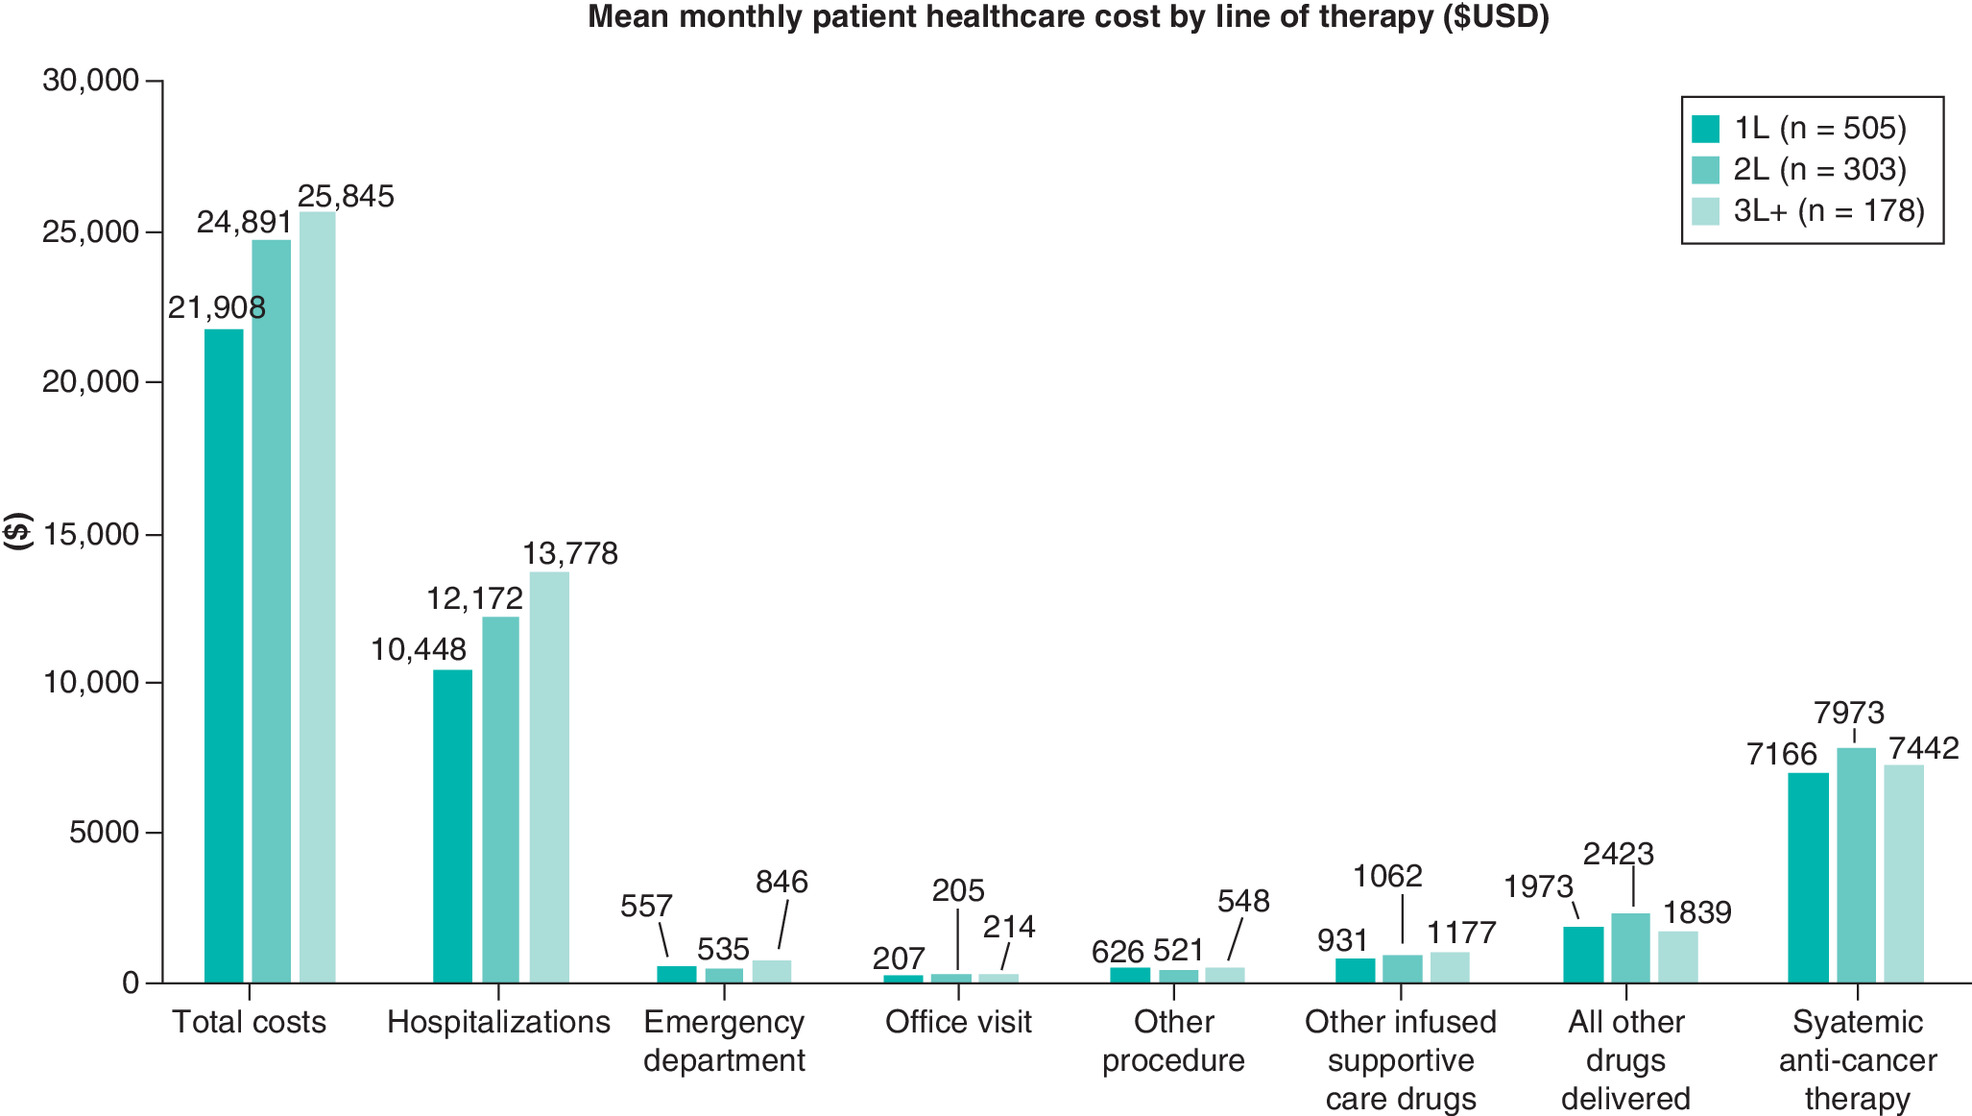
Figure 2. Mean monthly healthcare costs during first line, second line and third or later line through the first of transfer to hospice, end of record or 3 months prior to death.
1L: First line; 2L: Second line; 3L+: Third or later line through the first of transfer to hospice, end of record or 3 months prior to death.
| Treatment period | Treatment class | Overall | p-value† | |||
|---|---|---|---|---|---|---|
| Platinum | Taxane | Platinum + taxane | Other | |||
| 1L (n) | 96 | 220 | 45 | 144 | 505 | <0.001‡ |
| – Mean | $15,145 | $23,443 | $22,215 | $23,975 | $21,908 | |
| – SD | 25,547 | 39,892 | 51,069 | 50,242 | 42,064 | |
| – Median | $5934 | $10,414 | $11,613 | $7435 | $8700 | |
| 2L (n) | 52 | 132 | 9 | 110 | 303 | 0.011‡ |
| – Mean | $21,637 | $27,648 | $47,136 | $21,301 | $24,891 | |
| – SD | 42,485 | 43,679 | 90,369 | 40,701 | 44,399 | |
| – Median | $5835 | $13,612 | $11,915 | $8333 | $10,851 | |
| 3L+ (n) | 28 | 90 | 2 | 58 | 178 | 0.019§ |
| – Mean | $29,924 | $29,822 | $7441 | $18,340 | $25,845 | |
| – SD | 45,314 | 41,855 | 534 | 25,683 | 37,940 | |
| – Median | $8377 | $16,145 | $7441 | $7974 | $10,490 | |
Treatment cost for each time period includes the following cost components: hospitalizations, emergency department visits, office visits, procedures, infused supportive care, other drugs and systemic anticancer therapy.
†
p-values were based on log transformed costs. The platinum+taxane group was excluded from comparative analysis due to small-sample size.
‡
ANOVA – equal variances.
§
Kruskal–Wallis test.
1L: First line; 2L: Second line; 3L+: Third or later line through the first of transfer to hospice, end of record or 3 months prior to death; ANOVA: Analysis of variance; SD: Standard deviation.
Differences in cost across treatment groups were also evaluated for each cost component. The difference in cost across treatment groups was nonsignificant for each of hospitalizations and ED visits, which together composed the majority of cost. Some significant differences (p < 0.05) were observed across treatment groups for other cost components, such as office visits (p = 0.035), procedures (p = 0.012), infused supportive care (p < 0.001), systemic anticancer therapy (p < 0.001) and all other drugs (p < 0.001). However, the pattern did not favor one treatment group. The pattern of findings suggested that the platinum+taxane group incurred the highest cost for each of systemic anticancer therapy, and infused supportive care. Nominally, the platinum group incurred the highest cost for office visits and procedures, and the Taxane group for all other drugs.
A generalized linear regression model to evaluate predictors of total monthly cost of care revealed treatment class as a significant predictor (p = 0.017), specifically receipt of platinum-based treatment (platinum group) was predictive of lower costs than receipt of taxanes (taxane group) (Supplementary Table 1). Increasing age was also a significant predictor of lower cost (p < 0.001). African–American race was associated with higher cost than White race (p < 0.001), and stage IV at diagnosis was associated with higher cost than stages I–III (p = 0.016).
Monthly healthcare costs: 2L
The total mean monthly healthcare costs for patients receiving 2L therapy are summarized in Figure 2. Note that only patients who received systemic anticancer therapy were included in the cost analyses, and the platinum+taxane group was excluded from the comparative analyses due to small-sample size (n = 9). The total mean monthly cost for 2L therapy was $24,891 (median $10,851) as described in Table 2. Like 1L therapy, the greatest proportion of cost was attributed to hospitalizations ($12,172; median $0), followed by systemic anticancer therapy ($7973; median $3106). Among the 303 patients who received 2L treatment, 95 were hospitalized during the 2L period.
Neither the cost of hospitalizations nor the cost of office visits differed significantly across treatment groups. Some significant differences across treatment groups (p < 0.05) were observed for the remaining cost components, such as ED visits (p = 0.004), procedures (p = 0.002), infused supportive care (p = 0.002), other drugs (p < 0.001), and systemic anticancer therapy (p < 0.001). Consistent with 1L, the broader pattern of findings did not suggest a greater burden for one treatment group.
In the generalized linear regression analysis, both age and race were identified as significant predictors of monthly cost during 2L therapy (Supplementary Table 2). Increasing age was associated with lower total monthly cost (p = 0.039), and African American race was associated with increased total monthly cost compared with White race (p < 0.001).
Monthly healthcare costs: 3L+
Healthcare costs for the 3L+ period that began with initiation of 3L therapy until the occurrence of transfer to hospice, end of record or 3 months prior to death are described in Figure 2. Similar to 2L, there were very few patients classified as platinum+taxane (n = 2), and this group was excluded from comparative analyses. The total mean monthly cost of 3L+ therapy was $25,845 (median $10,490) as described in Table 2. Similar to the patterns observed in 1L and 2L, the greatest proportion of cost was attributed to hospitalizations ($13,778; median $0), followed by systemic anticancer therapy ($7442; median $2837). Overall, 178 patients received 3L treatment. Among these patients, 72 were hospitalized during the 3L+ period.
Less than half of patients incurred a hospitalization during the 3L+ period, and similar to the pattern observed in 1L and 2L, the difference in hospitalization costs across treatment groups was nonsignificant. The differences in cost for each of ED visits, office visits, other procedures and infused supportive care were also nonsignificant. However, significant differences (p < 0.05) were observed for each of systemic anticancer therapy (p = 0.010) and other drugs (p = 0.046), with the pattern suggesting that lower costs may have been incurred by the Other treatment group.
None of the demographic or clinical characteristics evaluated were found to be significant predictors of total monthly cost in the generalized linear regression analysis (Supplementary Table 3).
Discussion
This study was designed to describe treatment costs and drivers of cost for patients receiving treatment for mTNBC. Our findings indicate that greater than 50% of monthly cost in each of the three periods of interest was attributable to hospitalizations and ED visits combined, with less than a third of cost attributable to systemic anticancer therapy. The monthly cost of care after subsequent disease progression (2L, 3L+ therapy), nominally, appeared higher than the cost of care during 1L therapy, but the difference was not formally evaluated. Only approximately a third of cost was attributable to systemic anticancer treatment. Although the cost of systemic anticancer treatment differed across the treatment groups, these differences may have had only minimal impact on the overall cost of care. Notably, the cost of hospitalizations that composed the largest proportion of cost did not differ significantly across treatment groups.
We also used a generalized linear regression model to identify significant drivers of cost, revealing that in the 1L setting, treatment class (specifically platinum vs taxane) and increasing age were significant predictors of lower cost, while African–American race and de novo metastatic status were associated with higher costs. The effects of age and race on cost were similar during 2L treatment, but were not present in the subsequent 3L+ period.
To our knowledge, this is the first study providing specific evaluation of healthcare costs during treatment for mTNBC. Other studies have examined healthcare costs for the treatment of mBC and mTNBC; however, the diversity of methodologies used limits the generalizability of study results [12–16].
A recent investigation that evaluated treatment costs among nearly 16,000 patients with mBC revealed total 1-year medical costs of approximately $135,000 for stage IV patients and decreased by stage with cost of $61,000 for patients diagnosed as stage 0 [13]. These results are consistent with our findings that patients who were de novo metastatic incurred a higher cost of care than those who were diagnosed as stages I–III and later advanced to mTNBC.
Studies evaluating cost among mTNBC were limited, but other research suggests that the cost of treating hormone receptor negative (HR-) mBC incur significantly higher treatment costs than patients with HR+ mBC. The monthly cost to treat patients with HR- and HR+ breast cancer averaged $14,400 ($180,200 annually) and $11,900 ($167,100 annually), respectively [14].
Further research within HR+ mBC indicates that the cost of hormonal therapy is less than chemotherapy. Among patients with HR+/HER2- breast cancer, lower all-cause treatment costs were observed among patients treated with everolimus compared with chemotherapy for 1L through fourth-line therapy [17], and higher costs among patients treated with chemotherapy versus hormonal therapy in the 1L [14].
Baser et al. [12] conducted perhaps the most comprehensive investigation to date on the costs of treating mTNBC in the USA by examining claims data from 1999 to 2009 for patients with breast cancer segmented as TNBC (n = 450) and non-TNBC (n = 1807). The annual cost of cancer-related care among all patients with TNBC did not differ significantly from non-TNBC at approximately $58,000. The annual cost of care for the subset of patients with de novo stage IV disease (N = 290) was not reported. However, the cancer-related paid cost of inpatient stays among those with de novo stage IV TNBC was significantly higher than those with non-TNBC de novo stage IV disease (p = 0.009). The findings from this study suggest an increase in hospital resource utilization among those with TNBC.
Another important finding in our study was that the economic burden of care for mTNBC is greater among minority patients. Similar results were observed in prior analyses of breast cancer survivors that revealed greater economic burden among minority groups as measured by out of pocket costs [16] and medical debt [18]. Further research is needed to evaluate the reasons for this disparity.
This study had several limitations. First, the sample was limited to patients who received care in the community oncology setting; therefore, the results of this study may not be representative of patients treated in other settings such as research and academic centers, and costs incurred in these patients do not reflect costs incurred in all settings. Second, cost data were derived based on published sources of cost and record of utilization as documented in the record. It is possible that costs and resource utilization varied across hospitals. However, participants received care from a large number of hospitals, and it was not possible to accommodate this factor in the analysis. Finally, data sourced from the Vector Oncology Data Warehouse reflect real-world patients treated in the community oncology setting, and the completeness of each patient’s medical chart varies due to the nature of real-world data. Therefore, some measurements were not consistently available from patient records. However, data were abstracted as consistently as possible by a team of Clinical Research Nurses who participated in study-specific case report form training to minimize potential biases in chart interpretation.
Conclusion
In summary, this study examined healthcare cost patterns in patients who were treated for mTNBC. The majority of costs were attributed to hospitalization and ED services, while roughly a third was attributed to systemic anticancer therapy. These findings support a need for effective treatments to reduce utilization of costly services. Treatment class proved to be a significant driver of cost in 1L, but not after disease progression. Race was a significant driver of cost both in the 1L and 2L of therapy, which indicates greater economic burden in minority patients.
•
Breast cancer is the second leading cause of cancer death for women, after lung cancer.
•
Patients with metastatic triple-negative breast cancer (mTNBC) have a worse prognosis than those with hormone receptor-positive disease, due to limited treatment options being chemotherapy with a recent, 2019 recommendation from the National Comprehensive Cancer Network for the addition of atezolizumab in combination with nab-paclitaxel. In April 2020, sacituzumab govitecan-hziy was approved for third- or later-line use in patients with mTNBC.
•
Limited research is available regarding the cost of care for mTNBC, but existing studies suggest that roughly one quarter to a third of costs are attributable to systemic anticancer therapy, with the remaining attributable to hospitalizations and other service-related costs.
•
This retrospective, observational study examined 608 patients with mTNBC diagnosed between January 2010 and January 2016. Of these, cost of care was evaluated for 505 patients who received systemic anticancer therapy.
•
The cost of care during mTNBC treatment was evaluated and showed that the majority of cost was attributable to hospitalizations and emergency department visits, with only approximately a third attributable to systemic anticancer therapy.
•
The eligibility criteria for this study excluded patients who were diagnosed after January 2016, so it was not possible to observe use of the recently approved combination of atezolizumab and nab-paclitaxel, nor the use of sacituzumab govitecan-hziy.
•
These data provide a clear description of the cost of care for mTNBC patients during first line and following disease progression, which is important for understanding the treatment landscape.
•
This study found that the majority cost was attributable to hospitalizations and emergency department visits, which supports the need for new effective therapies to lessen the demand of resource utilization and associated economic burden.
Author contributions
KE Skinner contributed to the conception and design of the work, interpretation of data for the work, drafting the work and revising it critically for important intellectual content, final approval, agreement to be accountable. A Haiderali and M Huang were responsible for the conception and design of the work, interpretation of data for the work, revising it critically for important intellectual content, final approval, agreement to be accountable. LS Schwartzberg contributed to the interpretation of data for the work, revising it critically for important intellectual content, final approval, agreement to be accountable.
Acknowledgments
The authors thank Jan Sieluk (Merck & Co., Inc., NJ, USA) for his contributions toward the development of this manuscript.
Financial & competing interests disclosure
Merck Sharp & Dohme Corp., a subsidiary of Merck & Co., Inc., NJ, USA, sponsored the study reported in this paper and provided financial support to ConcertAI for the conduct of the research and for preparation of the article. KE Skinner was an employee of ConcertAI at the time of this research. A Haiderali is an employee of Merck Sharp & Dohme Corp., a subsidiary of Merck & Co., Inc., and has ownership interest in Merck & Co., Inc. M Huang is an employee of Merck Sharp & Dohme Corp., a subsidiary of Merck & Co., Inc. LS Schwartzberg is a consultant for Merck, Pfizer, AstraZeneca, Genentech and Spectrum Pharmaceuticals, Inc., and he is on a speaker’s bureau for Puma Biotechnology. The authors have no other relevant affiliations or financial involvement with any organization or entity with a financial interest in or financial conflict with the subject matter or materials discussed in the manuscript apart from those disclosed.
Medical writing and editing assistance was provided by Nate Connors, and was funded by ConcertAI.
Ethical conduct of research
This retrospective chart review study involving human participants was in accordance with the ethical standards of the institutional and/or national research committee and with the 1964 Helsinki Declaration and its later amendments or comparable ethical standards. This research was reviewed and approved by the Institutional Review Board of IntegReview, Austin, Texas, USA. This research study was conducted retrospectively from data obtained for clinical purposes. An IRB waiver of consent was granted from IntegReview.
Part of this research was presented at the International Society for Pharmacoeconomics and Outcomes Research (ISPOR) Europe, 10–14 November 2018 in Barcelona, Spain
Data sharing statement
ConcertAI does not make datasets publicly available because study data are used under license from source practices. ConcertAI will consider requests to access study datasets on a case-by-case basis.
Open access
This work is licensed under the Attribution-NonCommercial-NoDerivatives 4.0 Unported License. To view a copy of this license, visit http://creativecommons.org/licenses/by-nc-nd/4.0/
Supplementary Material
File (suppl_data.zip)
- Download
- 37.76 KB
References
Papers of special note have been highlighted as: • of interest
1.
Lin NU, Vanderplas A, Hughes ME et al. Clinicopathologic features, patterns of recurrence, and survival among women with triple-negative breast cancer in the National Comprehensive Cancer Network. Cancer 118(22), 5463–5472 (2012).
• Women diagnosed with triple-negative breast cancer (TNBC) have a worse prognosis than those diagnosed with hormone receptor-positive disease.
2.
Siegel RL, Miller KD, Jemal A. Cancer statistics, 2019. CA Cancer J. Clin. 69(1), 7–34 (2019).
3.
Saad ED, Katz A, Buyse M. Overall survival and post-progression survival in advanced breast cancer: a review of recent randomized clinical trials. J. Clin. Oncol. 28(11), 1958–1962 (2010).
4.
Ismail-Khan R, Bui MM. A review of triple-negative breast cancer. Cancer Control. 17(3), 173–176 (2010).
5.
Dent R, Trudeau M, Pritchard KI et al. Triple-negative breast cancer: clinical features and patterns of recurrence. Clin. Cancer Res. 13(15 Pt 1), 4429–4434 (2007).
6.
Kassam F, Enright K, Dent R et al. Survival outcomes for patients with metastatic triple-negative breast cancer: implications for clinical practice and trial design. Clin. Breast Cancer 9(1), 29–33 (2009).
7.
Haffty BG, Yang Q, Reiss M et al. Locoregional relapse and distant metastasis in conservatively managed triple negative early-stage breast cancer. J. Clin. Oncol. 24(36), 5652–5657 (2006).
8.
National Comprehensive Cancer Network. NCCN clinical practice guidelines in oncology: breast cancer. Version 4.2020. (2020). https://www.nccn.org/professionals/physician_gls/pdf/breast.pdf
• This reference describes current the National Comprehensive Cancer Network treatment guidelines in this population.
9.
Schmid P, Rugo HS, Adams S et al. Atezolizumab plus nab-paclitaxel as first-line treatment for unresectable, locally advanced or metastatic triple-negative breast cancer (IMpassion130): updated efficacy results from a randomised, double-blind, placebo-controlled, Phase III trial. Lancet Oncol. 21(1), 44–59 (2020).
10.
US FDA. VENTANA PD-L1 (SP142) assay - P160002/S009. (2020). https://www.fda.gov/medical-devices/recently-approved-devices/ventana-pd-l1-sp142-assay-p160002s009
11.
Vera-Llonch M, Weycker D, Glass A et al. Healthcare costs in women with metastatic breast cancer receiving chemotherapy as their principal treatment modality. BMC Cancer 11, 250 (2011).
• This reference reported the cost of care for women with metastatic breast cancer who received chemotherapy as their principal treatment modality. These patients had no record of receiving concomitant or subsequent hormonal therapy, or receipt of trastuzumab.
12.
Baser O, Wei W, Henk HJ, Teitelbaum A, Xie L. Patient survival and healthcare utilization costs after diagnosis of triple-negative breast cancer in a United States managed care cancer registry. Curr. Med. Res. Opin. 28(3), 419–428 (2012).
• This reference reported the cost of TNBC and non-TNBC based on an analysis of claims data. Patients with de novo stage IV TNBC incurred significantly higher costs attributable to inpatient stays than those with de novo stage IV non-TNBC.
13.
Blumen H, Fitch K, Polkus V. Comparison of treatment costs for breast cancer, by tumor stage and type of service. Am. Health Drug Benefits 9(1), 23–32 (2016).
• This reference reported the pattern of cost by stage of disease among all metastatic breast cancers. The pattern of findings showed greater cost for those with advanced disease.
14.
Burton T, Byfield SD, Smith GL et al. Clinical and economic outcomes by first-line treatment among women with HR+/HER2- metastatic breast cancer in a large US health plan database. Curr. Med. Res. Opin. 32(8), 1417–1423 (2016).
15.
Byfield SD, Buck PO, Blauer-Peterson C et al. ReCAP: treatment patterns and cost of care associated with initial therapy among patients diagnosed with operable early-stage human epidermal growth factor receptor 2-overexpressed breast cancer in the United States: a real-world retrospective study. J. Oncol. Pract. 12(2), 159–160 (2016).
16.
Pisu M, Azuero A, Meneses K, Burkhardt J, McNees P. Out of pocket cost comparison between Caucasian and minority breast cancer survivors in the Breast Cancer Education Intervention (BCEI). Breast Cancer Res. Treat. 127(2), 521–529 (2011).
17.
Hao Y, Li N, Fang AP et al. Real-world analysis of medical costs and healthcare resource utilization in elderly women with HR+/HER2- metastatic breast cancer receiving everolimus-based therapy or chemotherapy. Adv. Ther. 33(6), 983–997 (2016).
18.
Jagsi R, Pottow JA, Griffith KA et al. Long-term financial burden of breast cancer: experiences of a diverse cohort of survivors identified through population-based registries. J. Clin. Oncol. 32(12), 1269–1276 (2014).
• This reference reported that patients of minority race appeared to be most vulnerable to financial decline attributable to breast cancer.
Information & Authors
Information
Published In
Pages: 109 - 118
PubMed: 33167695
Copyright
© 2020 The authors. This work is licensed under the Attribution-NonCommercial-NoDerivatives 4.0 Unported License
History
Received: 29 September 2020
Accepted: 23 October 2020
Published online: 10 November 2020
Keywords:
Topics
Authors
Funding Information
Metrics & Citations
Metrics
Article Usage
Article usage data only available from February 2023. Historical article usage data, showing the number of article downloads, is available upon request.
Citations
How to Cite
Assessing direct costs of treating metastatic triple-negative breast cancer in the USA. (2020) Journal of Comparative Effectiveness Research. DOI: 10.2217/cer-2020-0213
Export citation
Select the citation format you wish to export for this article or chapter.
Citing Literature
- Ping Chen, Dan Qiao, Liping Xiao, Guiya Deng, Qing Yang, Rendi Tian, Cost-effectiveness analysis of toripalimab combined with nab-paclitaxel as a first-line treatment for advanced TNBC in the US, PLOS ONE, 10.1371/journal.pone.0320727, 20, 4, (e0320727), (2025).
- Matthew J. Monberg, Steve Keefe, Vassiliki Karantza, Konstantinos Tryfonidis, Sarper Toker, Jaime Mejia, Robert Orlowski, Amin Haiderali, Vimalanand S. Prabhu, Gursel Aktan, A Narrative Review of the Clinical, Humanistic, and Economic Value of Pembrolizumab-Based Immunotherapy for the Treatment of Breast and Gynecologic Cancers, Oncology and Therapy, 10.1007/s40487-024-00308-0, 12, 4, (701-734), (2024).
- Christina M. Zettler, Dilanka L. De Silva, Victoria S. Blinder, Mark E. Robson, Elena B. Elkin, Cost-Effectiveness of Adjuvant Olaparib for Patients With Breast Cancer and Germline BRCA1/2 Mutations , JAMA Network Open, 10.1001/jamanetworkopen.2023.50067, 7, 1, (e2350067), (2024).
- Sadeq Rezaei, Majid Babaei, A systematic literature review on direct and indirect costs of triple-negative breast cancer, Cost Effectiveness and Resource Allocation, 10.1186/s12962-023-00503-2, 21, 1, (2023).
- Luca Boscolo Bielo, Dario Trapani, Giuseppe Curigliano, Pharmacoeconomics of novel pharmacotherapies in triple-negative breast cancer, Expert Opinion on Pharmacotherapy, 10.1080/14656566.2023.2201372, 24, 7, (789-801), (2023).
- Rachel Jaber Chehayeb, Annette Hood, Xiaoliang Wang, Rebecca Miksad, Sarah Schellhorn Mougalian, Maryam B. Lustberg, Shi-Yi Wang, Rachel A. Greenup, Lajos Pusztai, Natalia Kunst, Treatment Sequencing Patterns and Associated Direct Medical Costs of Metastatic Breast Cancer Care in the United States, 2011 to 2021, JAMA Network Open, 10.1001/jamanetworkopen.2022.44204, 5, 11, (e2244204), (2022).
- Min Huang, Amin Haiderali, Grace E. Fox, Andrew Frederickson, Javier Cortes, Peter A. Fasching, Joyce O’Shaughnessy, Economic and Humanistic Burden of Triple-Negative Breast Cancer: A Systematic Literature Review, PharmacoEconomics, 10.1007/s40273-021-01121-7, 40, 5, (519-558), (2022).
- Ju-Yi Hsu, Chee-Jen Chang, Jur-Shan Cheng, Survival, treatment regimens and medical costs of women newly diagnosed with metastatic triple-negative breast cancer, Scientific Reports, 10.1038/s41598-021-04316-2, 12, 1, (2022).
- Laura Dormer, Celebrating 10 years of the Journal of Comparative Effectiveness Research, Journal of Comparative Effectiveness Research, 10.2217/cer-2021-0249, 11, 1, (1-6), (2021).
- Hospitalisation drives cost to treat metastatic triple-negative breast cancer, PharmacoEconomics & Outcomes News, 10.1007/s40274-020-7314-3, 867, 1, (17-17), (2020).