Adoption of video laryngoscopy by a major academic anesthesia department
Publication: Journal of Comparative Effectiveness Research
Abstract
Aim: To describe the adoption patterns of intubating devices used at a major teaching and research facility. Materials & methods: Retrospective analysis of 2012–2019 data on frequency and trends in airway management devices collected from our anesthesia information management system. Results: Use of direct laryngoscopy was more frequent, but there was a downward trend in use over time (p < 0.008) in favor of video laryngoscopy (VL), which increased significantly (p < 0.008). The largest growth among devices was the McGrath VL, which increased from 0.2% in 2012 to 36.2% of cases in 2019. Conclusion: Our study shows a clear increase in VL usage which has implications in quality of care and medical education.
Video laryngoscopy (VL) has recently seen wide-scale adoption, particularly in high-income countries [1]. Even in low-income and middle-income countries, progress is being made at providing lower cost video laryngoscope replacements [2,3]. Much of this transition in laryngoscope standard of care [4,5] has been facilitated as a direct result of technological improvements [3], personal computers [6] and smartphones [7].
Direct laryngoscopy (DL) remains a crucial skill given its extreme reliability; however, mastery of DL is a complicated technical skill with a substantial learning curve [8]. The experience of mastering VL is completely different, and in general, quicker to acquire and easier to maintain than DL [8]. The different types of video laryngoscopes have been discussed in detail [8–10]. The gradual replacement of DL by VL has been well documented among a range of locations, patients and procedures, including the university hospital [11], ambulatory surgery [12], obstetric surgery [13], thoracic surgery [14], for critically ill patients [15], the simulation laboratory [16] and nonoperating room anesthesia locations (NORA) [17]. VL performance characteristics have been shown superior to those of DL in meta-analysis [18], not only for the known or suspected difficult airway [19], but for all patients [1,20]. Intubation is no longer a ‘private’ experience, but may be observed, recorded and objectified by a second party, for educational purposes, as well as billing and risk management [1,17].
Herein, we performed a single center retrospective study of airway devices utilization rates at our institution, a major teaching and research facility in New York City, between 1 January 2012 and 31 December 2019. Our primary objective was to characterize the adoption patterns of intubation devices used at our institution. We hypothesized that DL usage would decrease and VL usage would increase temporally over the course of the study period.
Materials & methods
Throughout the period of the study, the lead author chaired the committee on equipment and supplies. No attempt was made to influence choice of device; it was felt that the preponderance of clinicians would favor the device with the most versatility. Intubation data was extracted from the anesthesia information management system, CompuRecord (Koninklijke Philips, NV, Amsterdam, the Netherlands) and airway device utilization rates were retrospectively analyzed between 1 January 2012 and 31 December 2019. All patients were included regardless of age, procedures types and procedure locations.
For each case, the date of service, airway device information and airway management location were extracted. Cases with multiple airway devices were dropped from analysis. All airway devices were classified into one of three categories: DL, VL or fiberoptic bronchoscope (FOB; Table 1). This work was the result of an internal quality improvement effort to track the use of laryngoscopes within our department. The analysis only used aggregated data that was non-identifiable and therefore was not considered human subjects research. No patients were consented and the data was collected completely retrospectively with no identifiers needed.
| Airway devices | Category |
|---|---|
| Rusch® TruLite® Secure Macintosh single-use laryngoscopes (NC, USA) | DL |
| RuschTruLite Secure Miller single-use laryngoscopes (NC, USA) | DL |
| Airtraq® Prodol Meditec SA (Vizcaya, Spain) | VL |
| GlideScope® Cobalt AVL (Verathon, MedPro, NY, USA) | VL |
| King Vision® VL (Ambu, Inc., MD, USA) | VL |
| McGrath® MAC VL (Medtronic, MN, USA) | VL |
| Bonfils® Retromolar Intubation FiberScope (Karl Storz Endoscopy, Tuttlingen, Germany) | VL |
| C-MAC® Storz VL (Karl Storz Endoscopy) | VL |
| Flexible Fiberoptic Bronchoscope Flexible Intubation Video Endoscope 6.5 and C-MAC tower (Karl Storz Endoscopy). All sites except thoracic ORs. | FOB |
| Flexible Fiberoptic Bronchoscope Olympus® CV-180 CLV-180 and tower (Olympus Corporation of the Americas, PA, USA). Thoracic ORs only. | FOB |
DL: Direct laryngoscopes; FOB: Fiberoptic bronchoscope; OR: Operating room; VL: Video laryngoscopes.
Statistical analysis
Descriptive statistics regarding the frequency of use for each device and device category were calculated on an annual basis. We used the Mann–Kendall trend test to determine whether there were significant changes over time at both the device category level and for the three most frequently used devices. The trends were tested on the yearly proportion of cases using each device category or individual device to account for a growth in the overall number of cases over time. To determine if the preference for different types of laryngoscopes changed overtime in different hospital locations, a sub-analysis was performed to measure whether hospital locations had significant changes in the category of airway device used over time. First, the data was divided by locations and then a multivariate Mann–Kendall trend test was used to compare the percentage of each device category on an annual basis. The possible locations for cases were the operating rooms, nonoperating room areas, including the gastroenterology suite (NORA), the labor and delivery suite, the reproductive endocrinology and infertility suite and unknown (missing). All statistical analyses were performed using RStudio (version 1.2.5042), R (version 4.0.0) and the trend package. We set the alpha at 0.05 when testing for significance.
Results
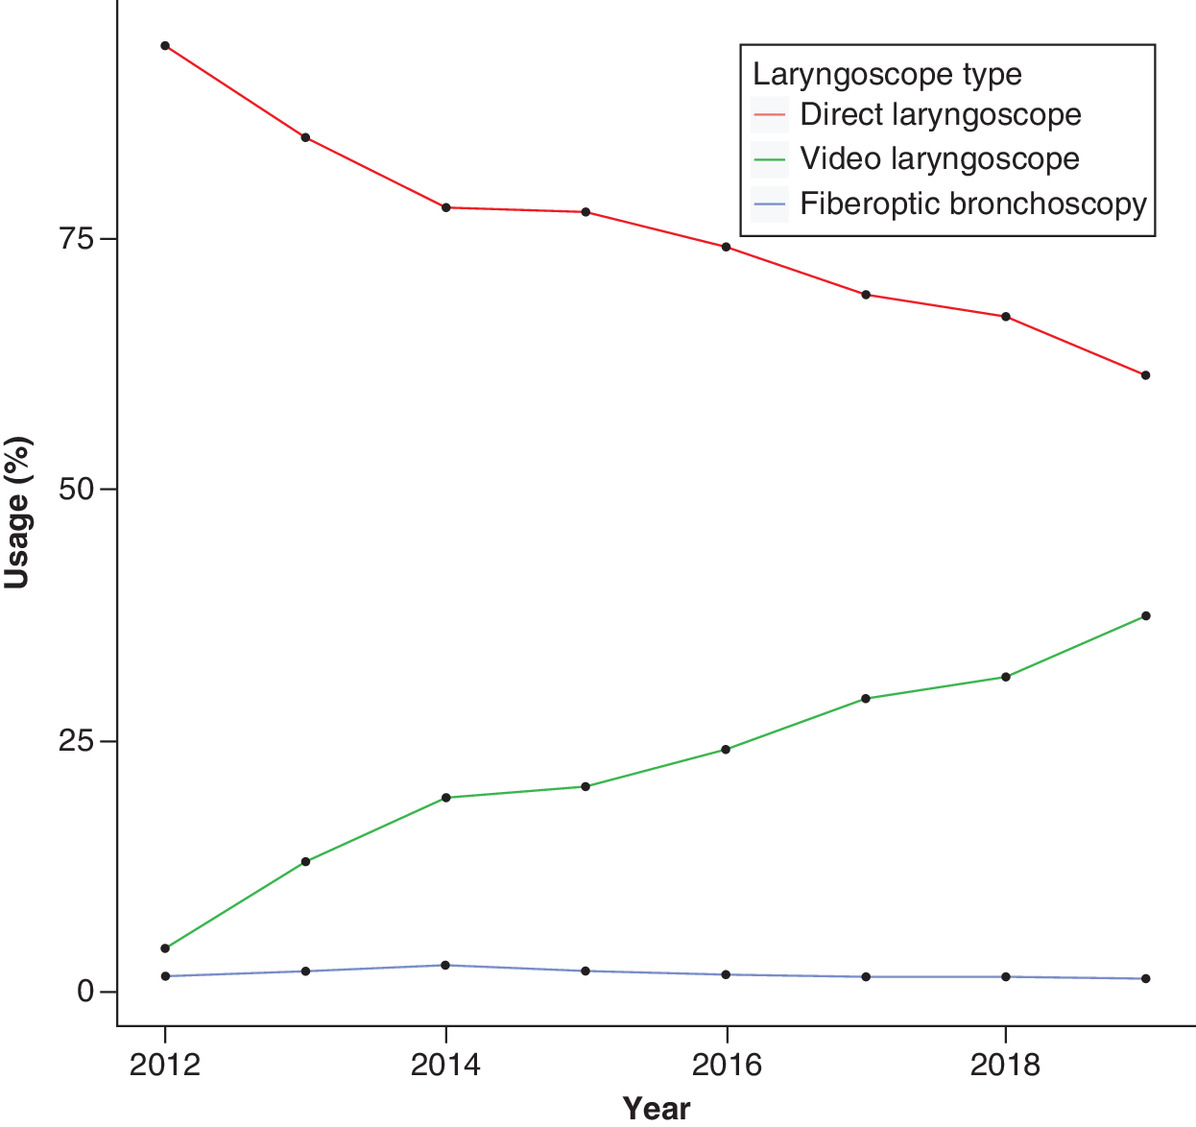
During the 8-year study period, there were a total of 159,447 cases where a laryngoscope was used. The intubation volume grew nearly 50% over the course of the study from nearly 16,500 intubations per year in 2012 to more than 24,000 intubations in 2019. During the entire study period, the most common category of airway device used was DL (74.6%), followed by VL (23.6%) and FOB (1.8%; Table 2). This ranking was the same in each year. When taking into consideration the increased volume of intubation cases; however, the data showed a significant increase in the percentage of cases using VL (τ = 1; p < 0.008; Figure 1). There was also a significant decrease in the percentage of cases using DL (τ = -1; p < 0.008). FOB devices did not have any significant upward or downward trends throughout the study period (τ = 0.5; p < 0.10).
| Year | DL count | DL annual % | DL yearly change | DL yearly change % | VL count | VL annual % | VL yearly change | VL yearly change % | FOB count | FOB annual % | FOB yearly change | FOB yearly change % | Yearly total | Yearly change | Yearly change % |
|---|---|---|---|---|---|---|---|---|---|---|---|---|---|---|---|
| 2012 | 15,090 | 94.1% | 698 | 4.4% | 254 | 1.6% | 16,040 | ||||||||
| 2013 | 13,932 | 85.0% | -1158 | -7.7% | 2124 | 13.0% | 1426 | 204.3% | 340 | 2.1% | 86 | 33.86% | 16,395 | 355 | 2.2% |
| 2014 | 13,591 | 78.0% | -341 | -2.4% | 3366 | 19.3% | 1242 | 58.5% | 462 | 2.7% | 122 | 35.88% | 17,419 | 1024 | 6.2% |
| 2015 | 15,606 | 77.5% | 2015 | 14.8% | 4112 | 20.4% | 746 | 22.2% | 423 | 2.1% | -39 | -8.44% | 20,141 | 2722 | 15.6% |
| 2016 | 16,376 | 74.1% | 770 | 4.9% | 5332 | 24.1% | 1220 | 29.7% | 389 | 1.8% | -34 | -8.04% | 22,096 | 1955 | 9.7% |
| 2017 | 15,269 | 69.3% | -1107 | -6.8% | 6428 | 29.2% | 1096 | 20.6% | 338 | 1.5% | -51 | -13.11% | 22,033 | -63 | -0.3% |
| 2018 | 15,046 | 67.1% | -223 | -1.5% | 7016 | 31.3% | 588 | 9.1% | 348 | 1.6% | 10 | 2.96% | 22,410 | 377 | 1.7% |
| 2019 | 14,041 | 61.3% | -1005 | -6.7% | 8563 | 37.4% | 1547 | 22.0% | 303 | 1.3% | -45 | -12.93% | 22,907 | 497 | 2.2% |
DL: Direct laryngoscope; FOB: Fiberoptic laryngoscope; VL: Video laryngoscope.
When breaking the data down by specific devices among all years, the three devices used most frequently were the Macintosh (DL) (67.8%), McGrath (VL) (19.9%) and the Miller (DL) (6.7%), respectively. The top three most frequently used devices accounted for 94.5% of all devices used each year on average (range 92.9–97.5%; Table 3, ‘top three percent column’). The Macintosh device was the single most used device, but saw a significant decrease in the proportion of use from the start of the study period to the end (τ = -1; p < 0.0008). The percentage of cases where the Macintosh device was used steadily dropped from 85.6% in 2012 to 55.1% in 2019. The McGrath device drove the dramatic rise in the use video laryngoscopes from 0.2% in 2012 to 36.2% of cases in 2019. The device also saw its own significant growth in proportional use over time (τ = 0.929; p < 0.002). The Miller device had no significant trend changes (τ = -00.5; p > 0.10) and the percentage of cases where the Miller device was used fluctuated between 8.5 and 5.6%.
| Year | Macintosh count | Macintosh percent | Annual change | % annual change | McGrath count | McGrath percent | Annual change | % annual change | Miller count | Miller percent | Annual change | % annual change | Top three count | Top three percent | Year total |
|---|---|---|---|---|---|---|---|---|---|---|---|---|---|---|---|
| 2012 | 13,725 | 85.6% | 39 | 0.2% | 1365 | 8.5% | 15,129 | 94.3% | 16040 | ||||||
| 2013 | 12,720 | 77.6% | -1005 | -7.3% | 1576 | 9.6% | 1537 | 3941.0% | 1212 | 7.4% | -153 | -11.2% | 15,508 | 94.6% | 16395 |
| 2014 | 12,300 | 70.6% | -420 | -3.3% | 2997 | 17.2% | 1421 | 90.2% | 1291 | 7.4% | 79 | 6.5% | 16,588 | 95.2% | 17419 |
| 2015 | 14,060 | 69.8% | 1760 | 14.3% | 3107 | 15.4% | 110 | 3.7% | 1546 | 7.7% | 255 | 19.8% | 18,713 | 92.9% | 20141 |
| 2016 | 15,124 | 68.4% | 1064 | 7.6% | 4014 | 18.2% | 907 | 29.2% | 1252 | 5.7% | -294 | -19.0% | 20,390 | 92.3% | 22096 |
| 2017 | 14,026 | 63.7% | -1098 | -7.3% | 5227 | 23.7% | 1213 | 30.2% | 1243 | 5.6% | -9 | -0.7% | 20,496 | 93.0% | 22033 |
| 2018 | 13,587 | 60.6% | -439 | -3.1% | 6454 | 28.8% | 1227 | 23.5% | 1459 | 6.5% | 216 | 17.4% | 21,500 | 95.9% | 22410 |
| 2019 | 12,629 | 55.1% | -958 | -7.1% | 8293 | 36.2% | 1839 | 28.5% | 1412 | 6.2% | -47 | -3.2% | 22,334 | 97.5% | 22907 |
Location data were available for cases starting in 2015. Analysis of device categories use within each location type showed significant changes in the breakdown of device type usage over time in the operating room (z = -2.2; p = 0.027), but not among NORA locations (z = 1.2; p = 0.22). The use of DL generally fell in both nonoperative areas and operating rooms, while the use of VL increased year over year in both non-operative areas and operating rooms (Table 4). Specifically, DL fell 7.3% from 2015 to 2019 in nonoperative areas and 10.9% over the same time period in operating rooms. During the same time period, the use of VL rose more than 2.8-times in the nonoperative area. In the operating room, VL usage nearly doubled from 3537 in 2015 to 6913 in 2019.
| DL | ||||||
|---|---|---|---|---|---|---|
| Location | 2015 | 2016 | 2017 | 2018 | 2019 | Location total |
| Unknown | 0 | 0 | 0 | 2 | 95 | 97 |
| IVF | 116 | 85 | 58 | 65 | 69 | 393 |
| NORA | 2332 | 2818 | 2657 | 2269 | 2161 | 12237 |
| Obstetrics | 26 | 21 | 39 | 20 | 18 | 124 |
| Operating rooms | 13132 | 13452 | 12515 | 12690 | 11698 | 63487 |
| Annual total | 15606 | 16376 | 15269 | 15046 | 14041 | |
| VL | ||||||
|---|---|---|---|---|---|---|
| 2015 | 2016 | 2017 | 2018 | 2019 | Location Total | |
| Unknown | 0 | 0 | 1 | 1 | 46 | 48 |
| IVF | 23 | 16 | 20 | 21 | 40 | 120 |
| NORA | 536 | 756 | 1139 | 1137 | 1523 | 5091 |
| Obstetrics | 16 | 23 | 48 | 42 | 41 | 170 |
| Operating rooms | 3537 | 4537 | 5220 | 5815 | 6913 | 26022 |
| Annual total | 4112 | 5332 | 6428 | 7016 | 8563 | |
| FOB | ||||||
|---|---|---|---|---|---|---|
| 2015 | 2016 | 2017 | 2018 | 2019 | Location total | |
| Unknown | 0 | 0 | 0 | 0 | 0 | 0 |
| IVF | 0 | 0 | 0 | 0 | 0 | 0 |
| NORA | 12 | 44 | 40 | 63 | 46 | 205 |
| Obstetrics | 0 | 0 | 0 | 0 | 0 | 0 |
| Operating rooms | 411 | 344 | 298 | 285 | 256 | 1594 |
| Annual total | 423 | 388 | 338 | 348 | 302 | |
DL: Direct laryngoscope; FOB: Fiberoptic laryngoscope; IVF: In vitro fertilization; NORA: Nonoperating room anesthesia; VL: Video laryngoscope.
Discussion
In this study, we described our teaching hospital’s 8-year experience with airway device adoption. We found that the McGrath® MAC VL has been widely adopted in our institution and is in the process of eclipsing DL usage; other VL devices remain at a low level of usage. We believe that our story might be instructive in charting the growth of these devices, determining which particular video laryngoscopes have been more successfully implemented into clinical practice and perhaps give some insight into where the future might lie.
The advent of VL has transformed the practice of airway management, particularly in high-income countries. Originating as an adjunct for the management of difficult airway in the operating theatre [21,22], VL has growth into virtually every location where airways are managed: NORA sites, the gastrointestinal suite, the labor and delivery suite, the adult and pediatric intensive care units, the emergency department, first responder applications, military applications and others. Over time and particularly after 2000, the quality and versatility of these devices have markedly improved at the same time that the price has dropped or remained unchanged. In some cases, the cost differential between DL and VL is negligible. There has been a movement toward the single-use device, often mounted on a reusable platform, hastened by the need to prioritize infection control for both the patient and the laryngoscopist. Recent work out of the UK showed that VL has a definite role in management of the difficult airway [23] and that early adoption in management of the unexpected difficult airway may be advisable [20,24]. Our findings demonstrate that when a major academic, tertiary care facility is left to its own devices, they will select the VL device that is most versatile.
Anesthesia-specific mortality has decreased significantly in the past decades to one per 100,000 cases, of which 40% are related to or caused by complications of airway management [1]. During this period, the use of video laryngoscopy has markedly increased, both for pre- and in-hospital airway management. Although the use of video laryngoscopes does not decrease the number of intubation attempts in most cases, they have been shown to improve the operator conditions, both in terms of lighting and visual angle [25]. Video laryngoscopes have improved performance characteristics compared with direct laryngoscopes [25], including improved luminance [26], measured in candles * meters-1. Video laryngoscopy is indeed an excellent bedside tool and has been shown to facilitate the acquisition of anatomic structure learning for novices. Novices learn faster and, with some video laryngoscopes, have higher retention rates [27]. Supervising physicians are able to instruct trainees in real time, as intubation becomes a public event [24]. Surprisingly, although first-pass intubation success rates are higher with video laryngoscopy than with direct laryngoscopy, over all intubation-related complication rates were not different [28]. Video laryngoscopy was listed as either a back-up or primary option in the 2013 iteration of the American Society of Anesthesiologists Practice Guidelines for Management of the Difficult Airway [22,25]. The 4th National Audit Project of the Royal College of Anaesthetists and the Difficult Airway Society [23] and the Difficult Airway Society 2015 guidelines for management of unanticipated difficult intubation [24] both extol video laryngoscopy for use in the known difficult airway and the unexpected difficult airway patient. Many experts believe that the advent of readily available [20], high-quality, affordable [29] video laryngoscopes contributed to lower complication rates in airway management. Video laryngoscopy is now considered standard of care for difficult airway management [1] and as a readily available back-up technique for routine airway management. Many authors believe that the video laryngoscope is now the new standard of care for routine airway management [20] as well. Even with large scale outcome studies [1], however, quantifying the degree of improvement and risk reduction afforded by video laryngoscopy compared with direct laryngoscopy has been elusive, mostly because of the myriad of factors involved [1].
Our retrospective study had several limitations. We did not fully account for the clinical decision making and patient related factors inherent in the choice of airway device. There are many factors that may influence choice of the device used, such as elective versus emergent surgery, aspiration risk, patient demographic, airway examination, past medical record patient experience, attending physician versus trainee, need to prioritize trainee education versus perceived patient safety, operating theatre versus NORA location, attending experience and preference, device availability and departmental budget. This study did not account for the use of cases in which more than one device was used on the same patient. We did not have data on the reason for the choice of device; it may well be that in certain cases there were deciding factors, such as patient anatomy (frozen neck), pathology (head and neck cancer) or surgical diagnosis (temporomandibular joint dysfunction syndrome) that favored a particular device. Similarly, cost of each device on a per case basis was not examined. Once acquired, the choice of usage is felt to be driven, at least partially, by nonfinancial factors. The single exception to this is the Airtraq device; the cost per use ($83.00) being substantially higher than the other VLs, this device was used sparingly. Assuming that VL has both a higher success rate and a lower incidence of adverse events than DL for both the anticipated and the unanticipated difficult airway, then a full cost analysis would be required to determine device cost efficiency [29]. This is beyond the scope of our study.
Conclusion
In summary, our retrospective analysis of 2012–2019 data on frequency and trends in airway management devices showed a clear temporal increase in VL usage and a downward trend in DL usage overtime at our institution. The largest growth among devices was the McGrath VL. Our findings are not surprising given the improved quality of VL over the past years and its relative price point in comparison to DL as well as recently published guidelines promoting VL as a viable solution for most patients presenting with difficulty airway management. Future research should explore reasons for choice of airway device and examine trends in airway management devices in relation to intubation outcomes across multiple institutions.
•
Video laryngoscopy (VL), which has been widely adopted over the last decade, presents many benefits compared with direct laryngoscopy (DL), including a shorter learning curve, better retention rates and superior performance characteristics.
•
We performed a retrospective, observational study to describe the adoption patterns of the intubating devices used at our institution, a major teaching and research facility in New York City.
•
Use of DL was more frequent throughout the study interval, but there was a downward trend in use over time (p < 0.008) in favor of VL, which increased significantly (p < 0.008).
•
VL usage nearly doubled in the operating rooms and increased 2.8-times in the nonoperating room anesthesia sites.
•
The largest growth among devices and the driver for VL growth, was the McGrath device, which increased from 0.2% in 2012 to 36.2% of cases in 2019.
•
Increased utilization of VL has implications in quality of care and medical education.
Financial & competing interests disclosure
The authors have no relevant affiliations or financial involvement with any organization or entity with a financial interest in or financial conflict with the subject matter or materials discussed in the manuscript. This includes employment, consultancies, honoraria, stock ownership or options, expert testimony, grants or patents received or pending, or royalties.
No writing assistance was utilized in the production of this manuscript.
Ethical conduct of research
The authors state that they have obtained appropriate institutional review board approval or have followed the principles outlined in the Declaration of Helsinki for all human or animal experimental investigations. In addition, for investigations involving human subjects, informed consent has been obtained from the participants involved.
References
1.
Hinkelbein J, Iovino I, De Robertis E, Kranke P. Outcomes in video laryngoscopy studies from 2007 to 2017: systematic review and analysis of primary and secondary endpoints for a core set of outcomes in video laryngoscopy research. BMC Anesthesiol. 19(1), 47 (2019).
2.
Nyrhinen E, Nyrhinen A. 3D-printed, $20 video laryngoscope designed for resource-constrained settings. Ann. Global Health 82(3), 593–594 (2016).
3.
Hasija N, Kale S, Girdhar KK. Digitizing the direct laryngoscopy experience: the economic way!! Korean J. Anesthesiol. 71(6), 486–487 (2018).
4.
Hurford WE. The video revolution: a new view of laryngoscopy. Resp. Care 55(8), 1036–1045 (2010).
5.
Zaouter C, Calderon J, Hemmerling T. Videolaryngoscopy as a new standard of care. Brit. J. Anaesth. 114(2), 181–183 (2015).
6.
Karippacheril JG, Umesh G, Ramkumar V. Inexpensive video-laryngoscopy guided intubation using a personal computer: initial experience of a novel technique. J. Clin. Monit. Comput. 28(3), 261–264 (2014).
7.
Karippacheril JG, Le Cong M. Videolaryngoscopy using an android smartphone: a direct digital technique. Indian J. Anaesth. 60(2), 143 (2016).
8.
Chemsian R, Bhananker S, Ramaiah R. Videolaryngoscopy. Int. J. Crit. Illness Injury Sci. 4(1), 35 (2014).
9.
Channa AB. Video laryngoscopes. Saudi J. Anaesth. 5(4), 357 (2011).
10.
Hagberg CA. Hagberg and Benumof's airway management e-book. Elsevier Health Science 4th Edition 417–427 (2017).
11.
Martin LD, Mhyre JM, Shanks AM, Tremper KK, Kheterpal S. 3,423 emergency tracheal intubations at a university hospitalairway outcomes and complications. Anesthesiology 114(1), 42–48 (2011).
12.
Gormley G, Mannion S. Airway management in ambulatory anesthesia. Curr. Anesth. Rep. 4(4), 342–351 (2014).
13.
Toker MK, Altıparmak B, Karabay AG. Comparison of the McGrath video laryngoscope and macintosh direct laryngoscope in obstetric patients: a randomized controlled trial. Pakistan J. Med. Sci. 35(2), 342 (2019).
14.
Wan L, Liao M, Li L et al. McGrath Series 5 videolaryngoscope vs Airtraq DL videolaryngoscope for double-lumen tube intubation: a randomized trial. Medicine 95(51), e5739 (2016).
15.
Jaber S, De Jong A, Pelosi P, Cabrini L, Reignier J, Lascarrou JB. Videolaryngoscopy in critically ill patients. Crit. Care 23(1), 1–7 (2019).
16.
Vanderbilt AA, Mayglothling J, Pastis NJ, Franzen D. A review of the literature: direct and video laryngoscopy with simulation as educational intervention. Adv. Med. Educ. Pract. 5, 15 (2014).
17.
Arulkumaran N, Lowe J, Ions R, Mendoza M, Bennett V, Dunser M. Videolaryngoscopy versus direct laryngoscopy for emergency orotracheal intubation outside the operating room: a systematic review and meta-analysis. Brit. J. Anaesth. 120(4), 712–724 (2018).
18.
Mihai R, Blair E, Kay H, Cook T. A quantitative review and meta-analysis of performance of non-standard laryngoscopes and rigid fibreoptic intubation aids. Anaesthesia 63(7), 745–760 (2008).
19.
Peterson GN, Domino KB, Caplan RA, Posner KL, Lee LA, Cheney FW. Management of the difficult airway: a closed claims analysis. Anesthesiology 103(1), 33–39 (2005).
20.
James E. Video laryngoscopes for all? Brit. J. Hosp. Med. 77(7), 434–434 (2016).
21.
Caplan RA, Benumof JL, Berry FA et al. Practice guidelines for management of the difficult airway. Anesthesiology 98(1269–1277), 2 (2003).
22.
Apfelbaum J, Hagberg C, Caplan R et al. Practice guidelines for management of the difficult airway: an updated report by the American Society of Anesthesiologists Task Force on Management of the Difficult Airway. Anesthesiology 118(2), 251 (2013).
23.
Katz JA, Avram MJ. 4th national audit project of the Royal College of Anaesthetists and the Difficult Airway Society: major complications of airway management in the United Kingdom: report and findings. Anesthesiology 116(2), 496–496 (2012).
24.
Frerk C, Mitchell VS, Mcnarry AF et al. Difficult Airway Society 2015 guidelines for management of unanticipated difficult intubation in adults. Brit. J. Anaesth. 115(6), 827–848 (2015).
25.
Lewis S, Butler A, Parker J, Cook T, Schofield-Robinson O, Smith A. Videolaryngoscopy versus direct laryngoscopy for adult patients requiring tracheal intubation: a Cochrane Systematic Review. Brit. J. Anaesth. 119(3), 369–383 (2017).
26.
Pieters BM, Van Zundert AA. Videolaryngoscopes differ substantially in illumination of the oral cavity: a manikin study. Indian J. Anaesth. 60(5), 325 (2016).
27.
Maharaj C, Costello J, Higgins B, Harte B, Laffey J. Retention of tracheal intubation skills by novice personnel: a comparison of the Airtraq® and Macintosh laryngoscopes. Anaesthesia 62(3), 272–278 (2007).
28.
Baek MS, Han M, Huh JW, Lim C-M, Koh Y, Hong S-B. Video laryngoscopy versus direct laryngoscopy for first-attempt tracheal intubation in the general ward. Ann. Intens. Care 8(1), 83 (2018).
29.
Alsumali A, Noppens R. Cost effectiveness of video laryngoscopy for routine use in the operating room. Trends Anaesth. Crit. Care 23, 10 (2018).
Information & Authors
Information
Published In
Pages: 101 - 108
PubMed: 33470849
Copyright
© 2021 Future Medicine Ltd.
History
Received: 24 August 2020
Accepted: 28 October 2020
Published online: 20 January 2021
Keywords:
Topics
Authors
Metrics & Citations
Metrics
Article Usage
Article usage data only available from February 2023. Historical article usage data, showing the number of article downloads, is available upon request.
Citations
How to Cite
Adoption of video laryngoscopy by a major academic anesthesia department. (2021) Journal of Comparative Effectiveness Research. DOI: 10.2217/cer-2020-0185
Export citation
Select the citation format you wish to export for this article or chapter.
Citing Literature
- Manuel Á. Gómez-Ríos, André A. J. Van Zundert, Videolaryngoscopy for all: A global proposal for safer airway management, Indian Journal of Anaesthesia, 10.4103/ija.ija_682_25, 69, 9, (858-861), (2025).
- Manuel Á. Gómez-Ríos, André A.J. Van Zundert, Alistair F. McNarry, J. Adam Law, Andy Higgs, Audrey De Jong, Samir Jaber, Kunal Karamchandani, Jan Hansel, Kemal Tolga Saracoglu, Robert Leach, Helio Penna Guimaraes, Alfredo Abad-Gurumeta, David Gómez-Ríos, Pavel Michalek, Lauren C. Berkow, Miguel Á. Fernández-Vaquero, Alfredo Serrano-Moraza, Luis Gaitini, Sonia Vaida, Mostafa Somri, Tomasz Gaszyński, David Brewster, Neel Desai, Ayten Saracoglu, Samuel Ern Hung Tsan, Vassilis Athanassoglou, Nobuyasu Komasawa, Rakesh Garg, Faisal Shamim, Rajkumar Rajendram, Uxía Gutierrez-Couto, Teresa López, Nekari De Luis-Cabezón, Daniel Tevar Flores, José Carlos Garzón, José A. Sastre, Andrés Roca de Togores López, Diego Meléndez-Salinas, José M. Fandiño-Orgeira, Rubén Casans-Frances, Marta Casalderrey-Rivas, Eva Romero-García, Clara Marín-Zaldívar, Ana Aroca-Tanarro, Oscar Alonso-Correa, Luis Jesús Rodríguez-Martín, Salvador Espinosa-Ramírez, Carin A. Hagberg, Guidelines on strategies for the universal implementation of videolaryngoscopy, European Journal of Anaesthesiology, 10.1097/EJA.0000000000002210, 42, 10, (872-888), (2025).
- M.Á. Gómez-Ríos, J.A. Sastre, X. Onrubia-Fuertes, T. López, A. Abad-Gurumeta, R. Casans-Francés, D. Gómez-Ríos, J.C. Garzón, V. Martínez-Pons, M. Casalderrey-Rivas, M.Á. Fernández-Vaquero, E. Martínez-Hurtado, R. Martín-Larrauri, L. Reviriego-Agudo, U. Gutierrez-Couto, J. García-Fernández, A. Serrano-Moraza, L.J. Rodríguez Martín, C. Camacho Leis, S. Espinosa Ramírez, J.M. Fandiño Orgeira, M.J. Vázquez Lima, M. Mayo-Yáñez, P. Parente-Arias, J.A. Sistiaga-Suárez, M. Bernal-Sprekelsen, P. Charco-Mora, Spanish Society of Anesthesiology, Reanimation and Pain Therapy (SEDAR), Spanish Society of Emergency and Emergency Medicine (SEMES) and Spanish Society of Otolaryngology, Head and Neck Surgery (SEORL-CCC) Guideline for difficult airway management. Part II, Revista Española de Anestesiología y Reanimación (English Edition), 10.1016/j.redare.2024.02.002, 71, 3, (207-247), (2024).
- M.Á. Gómez-Ríos, J.A. Sastre, X. Onrubia-Fuertes, T. López, A. Abad-Gurumeta, R. Casans-Francés, D. Gómez-Ríos, J.C. Garzón, V. Martínez-Pons, M. Casalderrey-Rivas, M.Á. Fernández-Vaquero, E. Martínez-Hurtado, R. Martín-Larrauri, L. Reviriego-Agudo, U. Gutierrez-Couto, J. García-Fernández, A. Serrano-Moraza, L.J. Rodríguez Martín, C. Camacho Leis, S. Espinosa Ramírez, J.M. Fandiño Orgeira, M.J. Vázquez Lima, M. Mayo-Yáñez, P. Parente-Arias, J.A. Sistiaga-Suárez, M. Bernal-Sprekelsen, P. Charco-Mora, Guía de la Sociedad Española De Anestesiología, Reanimación y Terapéutica del Dolor (SEDAR), Sociedad Española de Medicina de Urgencias y Emergencias (SEMES) y Sociedad Española de Otorrinolaringología y Cirugía de Cabeza y Cuello (SEORL-CCC) para el manejo de la vía aérea difícil. Parte II, Revista Española de Anestesiología y Reanimación, 10.1016/j.redar.2023.08.001, 71, 3, (207-247), (2024).
- Briana Lui, Spencer Walsh, Robert S White, Jon D Samuels, Letter to the Editor: video laryngoscopy – the new de facto standard in intubation, Journal of Comparative Effectiveness Research, 10.2217/cer-2021-0122, 10, 15, (1103-1104), (2021).