Complications and its impact in patients with closed and open tibial shaft fractures requiring open reduction and internal fixation
Publication: Journal of Comparative Effectiveness Research
Abstract
Aim: To evaluate the rates of infection and nonunion and determine the impact of infections on healthcare resource use and costs following open and closed fractures of the tibial shaft requiring open reduction internal fixation. Methods: Healthcare use and costs were compared between patients with and without infections following pen reduction internal fixation using MarketScan® databases. Results: For commercial patients, the rates of infection and nonunion ranged from 1.82 to 7.44% and 0.48 to 8.75%, respectively, over the 2-year period. Patients with infection had significantly higher rates of hospital readmissions, emergency room visits and healthcare costs compared with patients without infection. Conclusion: This real-world study showed an increasing rate of infection up to 2 years and infection significantly increased healthcare resource use and costs.
Fractures of the tibia and fibula bones are a common orthopedic injury, with an incidence of 492,000 per year, and result in approximately 77,000 hospitalizations and 825,000 physician visits annually in the USA [1]. In the elderly, this is even more daunting, with almost 70% of Medicare patients being hospitalized following fractures and 38% receiving follow-up home healthcare [1].
Surgical treatment of tibia shaft fractures with open reduction and internal fixation (ORIF) is often indicated for open fractures, unstable or segmental fractures, when accompanied by fibula fracture or significant soft tissue injury. Potential complications following ORIF include post-surgical infection, malunion, nonunion, knee pain, malrotation, compartment syndrome and nerve injury [2–5]. As far back as 1987, Moore et al. [6] reported a 19% overall complication rate over a median 3.7 years, while other older studies report infection-specific rates ranging from 2 to 11% [7], far higher than the 1 to 3% infection rate reported for all orthopedic surgical procedures [8]. In a study conducted within Johns Hopkins Health System, inpatient length-of-stay was double (10.56 vs 5.64 days), and 30-day readmission rates sixfold higher (52 vs 8%) for patients with post-ORIF infections compared with patients who do not develop these infections [9]. Another complication of ORIF, delayed union or nonunion, occurs in up to 8% of closed and 3–17% of open fractures [10]. Studies utilizing large claims databases also report a 12–14% nonunion rate after tibial shaft fractures [1,11].
One of the challenges in the management of tibial shaft fractures includes the lack of recent reliable, and nationally-representative, complication rates of infection and nonunion post-ORIF. Available studies addressing complication rates are based on center-specific, single-setting populations limited by small sample sizes [2,8,12]. Moreover, risk factors associated with complications like infection and nonunion after ORIF are not well-defined, and limited data are available on the rate of infection or nonunion with respect to time after the ORIF. Clinicians must better understand the risk and the temporal relationship of the complication, whether the rates increase, decrease, or remain the same, to better optimize a patient-specific post-operative care plan that will result in improved complication-free outcomes.
Thus, given that currently there is lack of information on nonunion and infection rates in the same population in a large-scale, nationally representative claims database at different follow-up periods. And only few studies address the resource utilization or economic impact of ORIF complications [13]. This study utilizes large, geographically representative administrative claims databases in the USA to ascertain the complication rate at different time points post-ORIF, identify associated risk factors in a real-world population, and estimate the economic burden of infection.
Objectives
The primary objective was to estimate the real-world short-term and mid-term rates of infection and nonunion in patients with open and closed tibial shaft fractures after ORIF. Secondary objectives were to:
•
Estimate potential healthcare resource use and economic impact of post-ORIF infection;
•
Identify patient-specific factors associated with increased post-surgical complication risk.
Methods
Study design & setting
This retrospective, observational cohort study was conducted using a US-based administrative claims data (January 2007–June 2017) from the nationally representative IBM MarketScan® Research Databases including the Commercial, Medicare Supplemental and Medicaid databases. These databases include administrative medical (inpatient, outpatient, emergency room) and pharmacy claims from employer-sponsored plans for approximately 40 million enrollees per year with commercial insurance (i.e., working-age adults, spouses and dependents), 8 million enrollees per year with Medicaid coverage (Medicaid provides health coverage to low-income adults, children, pregnant women, elderly adults and people with disabilities) and 3–4 million enrollees per year with Medicare Supplemental coverage (Medicare provide health insurance for people who are 65 years and older and certain younger people with disabilities or End-Stage Renal Disease). MarketScan databases comply with the Health Information Portability and Accountability Act of 1996 (HIPAA). This study utilized de-identified patient records and did not include any primary data collection; hence Institutional Review Board approval was not needed.
Participants
Adult patients (>18 years of age), with open or closed tibial shaft fractures requiring ORIF surgery during an out- or inpatient admission were identified through a comprehensive list of International Classification of Diseases, Ninth Revision, Clinical Modification (ICD-9-CM) and ICD-10-CM codes (Supplementary Material 1). Index date was defined as the date of the ORIF procedure, or the date of admission for the ORIF procedure in cases of inpatient admissions. All patients were required to have continuous enrollment for at least 180 days prior to index date (pre-index period) to reduce potential bias of prior fractures and a minimum of 30 days of follow-up. Patients were followed for a maximum of 2 years.
Patients were excluded if they met any of the following:
1.
Any fractures, surgical interventions for fractures, hospitalizations, or emergency room visits during the pre-index period up to 30 days prior to the index date (i.e., Day -180 to Day -30). In some instances, the fracture may be treated with a 1–2 week delay hence Day -30 to Day 0 buffer for diagnosis of fracture was allowed;
2.
Any ORIF procedures for tibia during the pre-index period; and,
3.
Any infections, osteomyelitis or nonunion diagnosis in the 180-day pre-index period and up to 2 days post the index date or from date of discharge, whichever was greater (Figure 1).

Figure 1. Process of sample attrition.
ORIF: Open reduction and internal fixation.
Study cariables
Patient characteristics assessed at index date included age, gender, region, health insurance plan type and place of service. Patient history was identified using ICD-9-CM or ICD-10-CM codes, and comorbidities included in the Charlson Comorbidity Index (CCI) were identified during the pre-index period and a composite CCI score was calculated for each patient. Patients were identified as having an ‘open’ fracture if they had the corresponding diagnosis at any point during the 30 days pre- and post- index. This was true even in cases where the first diagnosis was that of ‘closed’ fracture.
The primary outcome measure was rate of infection or nonunion. Infection and nonunion were each categorized as a binary variable (‘Yes’/’No’), based on the presence of diagnostic or procedural codes (Supplementary Material 1), identified at least 2 days post-index date or from date of discharge, whichever was greater. The date of first-diagnosed infection or nonunion was recorded to identify the short-term (at 30, 60, 90, 180 days) and mid-term (at 365 days, 18 and 24 months) rates. Other clinical measures identified during the pre-index period included obesity, alcohol abuse, drug use disorder, smoking, diabetes and rheumatoid arthritis, and were based on ICD-9 and ICD-10 codes (Supplementary Material 2) were included for risk factors assessments.
Resource use during follow-up was recorded as all-cause hospitalizations and emergency room visits. Total estimated health care costs included all-cause hospitalizations, emergency room visits, outpatient visits and prescriptions during the follow-up period. All costs were inflated to the year 2017.
Data analysis & statistical methods
Demographic and comorbidity data were summarized using descriptive statistics for each insured group (commercial, Medicare and Medicaid). Infection and nonunion rates were calculated, separately and as a composite, for each follow-up period, and included only those patients that had the corresponding minimum follow-up duration. The proportion of patients with any hospitalizations and emergency room visits were compared between groups with and without infections, across all payer type databases. Similarly, total health care costs were estimated by summing the total net payments made by payers and compared between patients with and without infection. Chi-square tests were used to compare the proportions while the Wilcoxon rank sum tests were used to compare cost data. Logistic regressions were used to examine associations between infection, and separately, nonunion and various independent risk factor variables; models were run for 1-year follow-up period. Independent variables evaluated in the logistic regressions included gender, age groups, region, obesity, smoking status, drug and alcohol use, diabetes, CCI score, place of service and fracture type.
Results
The study included 19,383 commercially insured, 2654 Medicare and 2299 Medicaid patients (Figure 1). There was a greater proportion of women in the Medicare (67%) and Medicaid groups (57%) compared with the commercially insured group (47%; Table 1). The majority (64%) of commercially insured patients were under PPO (Preferred Provider Organization) plans. The Medicare population, overall, had the highest mean comorbidity score based on the Charlson Comorbidity Index (1.03 [SD: 1.46], followed by the Medicaid population (0.83 [1.43], and commercial (0.29 [0.78]).
| Demographic | Database | |||||
|---|---|---|---|---|---|---|
| Commercial | Medicare | Medicaid | ||||
| n | % | n | % | n | % | |
| n | 19,383 | 100.00% | 2654 | 100.00% | 2299 | 100.00% |
| Gender | ||||||
| Female | 9070 | 46.79% | 1768 | 66.62% | 1299 | 56.50% |
| Male | 10,313 | 53.21% | 886 | 33.38% | 1000 | 43.50% |
| Age | ||||||
| 18−24 | 2294 | 11.84% | − | − | 289 | 12.57% |
| 25−45 | 6642 | 34.27% | − | − | 710 | 30.88% |
| 46−64 | 10,447 | 53.90% | − | − | 919 | 39.97% |
| 65−74 | − | − | 1435 | 54.07% | 215 | 9.35% |
| 75+ | 1219 | 45.93% | 166 | 7.22% | ||
| Payer | ||||||
| Data n/a | 685 | 3.53% | 78 | 2.94% | 30 | 1.30% |
| CDHP | 1017 | 5.25% | 19 | 0.72% | − | − |
| Comprehensive | 578 | 2.98% | 1134 | 42.73% | 1461 | 63.55% |
| EPO | 281 | 1.45% | 12 | 0.45% | − | − |
| HDHP | 676 | 3.49% | 3 | 0.11% | − | − |
| HMO | 2177 | 11.23% | 237 | 8.93% | 655 | 28.49% |
| POS | 1434 | 7.40% | 101 | 3.81% | − | − |
| POS with capitation | 103 | 0.53% | 6 | 0.23% | 147 | 6.39% |
| PPO | 12,432 | 64.14% | 1064 | 40.09% | 6 | 0.26% |
| Type of fracture | ||||||
| Closed | 17,820 | 91.94% | 2439 | 91.90% | 2106 | 91.61% |
| Open | 1563 | 8.06% | 215 | 8.10% | 193 | 8.39% |
| Year of ORIF | ||||||
| 2007 | 1824 | 9.41% | 156 | 6.79% | 212 | 7.99% |
| 2008 | 1949 | 10.06% | 170 | 7.39% | 223 | 8.40% |
| 2009 | 1967 | 10.15% | 190 | 8.26% | 259 | 9.76% |
| 2010 | 2085 | 10.76% | 197 | 8.57% | 276 | 10.40% |
| 2011 | 2498 | 12.89% | 162 | 7.05% | 379 | 14.28% |
| 2012 | 2427 | 12.52% | 213 | 9.26% | 295 | 11.12% |
| 2013 | 1928 | 9.95% | 293 | 12.74% | 311 | 11.72% |
| 2014 | 1937 | 9.99% | 312 | 13.57% | 291 | 10.96% |
| 2015 | 1151 | 5.94% | 376 | 16.35% | 174 | 6.56% |
| 2016 | 1141 | 5.89% | 230 | 10.00% | 174 | 6.56% |
| 2017 | 476 | 2.46% | n/a | n/a | 60 | 2.26% |
| Place of service | ||||||
| Emergency care | 6515 | 33.61% | 866 | 32.63% | 1119 | 48.67% |
| Inpatient | 8627 | 44.51% | 1215 | 45.78% | 435 | 18.92% |
| Other | 3669 | 18.93% | 389 | 14.66% | 724 | 31.49% |
| Outpatient | 572 | 2.95% | 184 | 6.93% | 21 | 0.91% |
| Region | ||||||
| Data NA | 2526 | 13.03% | 216 | 8.14% | 382 | 16.62% |
| North Central | 4182 | 21.58% | 819 | 30.86% | − | − |
| Northeast | 2501 | 12.90% | 390 | 14.69% | − | − |
| South | 6927 | 35.74% | 764 | 28.79% | − | − |
| Unknown | 207 | 1.07% | 26 | 0.98% | − | − |
| West | 3040 | 15.68% | 439 | 16.54% | − | − |
| CCI score | ||||||
| 0 | 15,974 | 82.41% | 1359 | 51.21% | 1393 | 60.59% |
| 1 | 2118 | 10.93% | 581 | 21.89% | 424 | 18.44% |
| 2−3 | 1074 | 5.54% | 534 | 20.12% | 357 | 15.53% |
| 4−5 | 143 | 0.74% | 129 | 4.86% | 75 | 3.26% |
| 5+ | 74 | 0.38% | 51 | 1.92% | 50 | 2.17% |
| Smoking event in baseline period of 180 days | 128 | 0.66% | 24 | 1.04% | 19 | 0.72% |
| Obesity event in baseline period of 180 days | 612 | 3.16% | 124 | 5.39% | 58 | 2.19% |
| Rheumatoid arthritis event in baseline period of 180 days | 154 | 0.79% | 28 | 1.22% | 60 | 2.26% |
| Alcohol abuse | 282 | 1.45% | 101 | 4.39% | 16 | 0.60% |
| Drug abuse | 115 | 0.59% | 95 | 4.13% | 4 | 0.15% |
| Diabetes event in baseline period of 180 days | 1586 | 8.18% | 376 | 16.35% | 599 | 22.57% |
| CCI 01 Myocardial infarction | 58 | 0.30% | 17 | 0.74% | 23 | 0.87% |
| CCI 02 Congestive heart failure | 146 | 0.75% | 87 | 3.78% | 150 | 5.65% |
| CCI 03 Periphral vascular disease | 185 | 0.95% | 108 | 4.70% | 185 | 6.97% |
| CCI 04 Cerebrovascular disease | 179 | 0.92% | 92 | 4.00% | 195 | 7.35% |
| CCI 05 Dementia | 8 | 0.04% | 49 | 2.13% | 59 | 2.22% |
| CCI 06 Chronic pulmonary disease | 908 | 4.68% | 320 | 13.92% | 289 | 10.89% |
| CCI 07 Connective tissue disease-rheumatic disease | 192 | 0.99% | 31 | 1.35% | 83 | 3.13% |
| CCI 08 Peptic ulcer disease | 30 | 0.15% | 12 | 0.52% | 14 | 0.53% |
| CCI 09 Mild Liver Disease | 230 | 1.19% | 58 | 2.52% | 28 | 1.06% |
| CCI 10 Diabetes without complications | 1536 | 7.92% | 367 | 15.96% | 577 | 21.74% |
| CCI 11 Diabetes with complications | 328 | 1.69% | 95 | 4.13% | 175 | 6.59% |
| CCI 12 Paraplegia and hemiplegia | 64 | 0.33% | 71 | 3.09% | 12 | 0.45% |
| CCI 13 Renal disease | 203 | 1.05% | 99 | 4.31% | 176 | 6.63% |
| CCI 14 Cancer | 432 | 2.23% | 55 | 2.39% | 210 | 7.91% |
| CCI 15 Moderate or severe liver disease | 15 | 0.08% | 4 | 0.17% | 4 | 0.15% |
| CCI 16 Metastatic carcinoma | 36 | 0.19% | 10 | 0.43% | 27 | 1.02% |
| CCI 17 AIDS/HIV | 24 | 0.12% | 29 | 1.26% | 4 | 0.15% |
CCI: Charlson comorbidity index; CDHP: Consumer directed health plan; EPO: Exclusive provider organization; HDHP: High deductible health plan; HMO: Health maintenance organization; n/a: Not applicable; ORIF: Open reduction and internal fixation; POS: Point-of-service; PPO: Preferred provider prganization.
Across all payer groups, there was a greater proportion of closed tibial shaft fractures compared with open (commercial: 91.9 vs 8.1%; Medicare: 91.9 vs 8.1%; Medicaid: 91.6 vs 8.4%).
Table 2 shows the rates of infection and nonunion, by payer and time of follow-up, in which rates for both outcomes increased over study follow-up. Within the first 30 days after index, almost 3% of patients developed infection, with the lowest infection rate (1.8%) observed in patients under commercial insurance, followed by 2.7% in Medicaid, and 2.9% under Medicare. At day 180, infection rates rose almost threefold, to 4.8% (commercially insured), 9.3% (Medicare) and 7.3% (Medicaid), whereas at 365 days, these rates rose to 6.2, 10.1 and 9.2%, respectively.
| Database | |||||||||
|---|---|---|---|---|---|---|---|---|---|
| Commercial | Medicare | Mediciad | |||||||
| Patients (n) | Patients with enrollment (n) | Rate | Patients (n) | Patients with enrollment (n) | Rate | Patients (n) | Patients with enrollment (n) | Rate | |
| Infection | |||||||||
| 30-day follow-up | 352 | 19,383 | 1.82% | 78 | 2654 | 2.94% | 62 | 2299 | 2.70% |
| 60-day follow-up | 589 | 18,770 | 3.14% | 143 | 2557 | 5.59% | 102 | 2219 | 4.60% |
| 90-day follow-up | 697 | 18,101 | 3.85% | 188 | 2482 | 7.57% | 114 | 2140 | 5.33% |
| 180-day follow-up | 773 | 15,969 | 4.84% | 208 | 2245 | 9.27% | 140 | 1908 | 7.34% |
| 12-month follow-up | 783 | 12,589 | 6.22% | 187 | 1858 | 10.06% | 139 | 1515 | 9.17% |
| 18-month follow-up | 704 | 10,094 | 6.97% | 176 | 1530 | 11.50% | 123 | 1212 | 10.15% |
| 24-month follow-up | 607 | 8159 | 7.44% | 157 | 1274 | 12.32% | 113 | 1002 | 11.28% |
| Nonunion | |||||||||
| 30-day follow-up | 94 | 19,383 | 0.48% | 10 | 2654 | 0.38% | NR | 2299 | NR |
| 60-day follow-up | 195 | 18,770 | 1.04% | 19 | 2557 | 0.74% | 20 | 2219 | 0.90% |
| 90-day follow-up | 362 | 18,101 | 2.00% | 43 | 2482 | 1.73% | 31 | 2140 | 1.45% |
| 180-day follow-up | 955 | 15,969 | 5.98% | 101 | 2245 | 4.50% | 89 | 1908 | 4.66% |
| 12-month follow-up | 1027 | 12,589 | 8.16% | 108 | 1858 | 5.81% | 106 | 1515 | 7.00% |
| 18-month follow-up | 867 | 10,094 | 8.59% | 92 | 1530 | 6.01% | 93 | 1212 | 7.67% |
| 24-month follow-up | 714 | 8159 | 8.75% | 76 | 1274 | 5.97% | 80 | 1002 | 7.98% |
| Infection or nonunion | |||||||||
| 30-day follow-up | 437 | 19,383 | 2.25% | 88 | 2654 | 3.32% | 67 | 2299 | 2.91% |
| 60-day follow-up | 763 | 18,770 | 4.06% | 159 | 2557 | 6.22% | 118 | 2219 | 5.32% |
| 90-day follow-up | 1024 | 18,101 | 5.66% | 220 | 2482 | 8.86% | 139 | 2140 | 6.50% |
| 180-day follow-up | 1613 | 15,969 | 10.10% | 286 | 2245 | 12.74% | 207 | 1908 | 10.85% |
| 12-month follow-up | 1643 | 12,589 | 13.05% | 271 | 1858 | 14.59% | 215 | 1515 | 14.19% |
| 18-month follow-up | 1421 | 10,094 | 14.08% | 243 | 1530 | 15.88% | 187 | 1212 | 15.43% |
| 24-month follow-up | 1190 | 8159 | 14.59% | 211 | 1274 | 16.56% | 169 | 1002 | 16.87% |
Nonunion rates were lower than infection rates across payer types within the first 30 days post-index (range 0.3–0.5). At day 180, the rates of nonunion exceeded infection rates specifically in the commercial insurance population (6%), 4.5% under Medicare and 4.7% under Medicaid. At the 365-day time point, these rates were as high as 8.2% for commercially insured patients, 5.8% for the Medicare population and 7% for the Medicaid patients.
By study end (24 months), the rate of infection was 7.4% in 8159 commercially insured patients, 12.3% in 1274 Medicare patients and 11.3% in 1002 Medicaid patients. Nonunion rates were 8.8% in commercially insured, 6.0% in Medicare and 8.0% in Medicaid.
Patients with a diagnosed infection post-ORIF had significantly higher (p < 0.0001 for all) rates of hospital readmissions as well as emergency room visits across every time period during study follow-up, compared with patients with no diagnosed infection (Figure 2). At the 90-day time point, 55% of patient (commercially insured) with diagnosed infection had readmissions compared with only 4% of those without the infection diagnosis. At 365 days, 60% of patients with infection were rehospitalized compared with those without infection (9%). Within the Medicare population, 26% of patients with an infection diagnosis were re-hospitalized within 3 months compared with 6% of those without infections; and 44% in the Medicaid subsample with infection compared with 8% without infection.
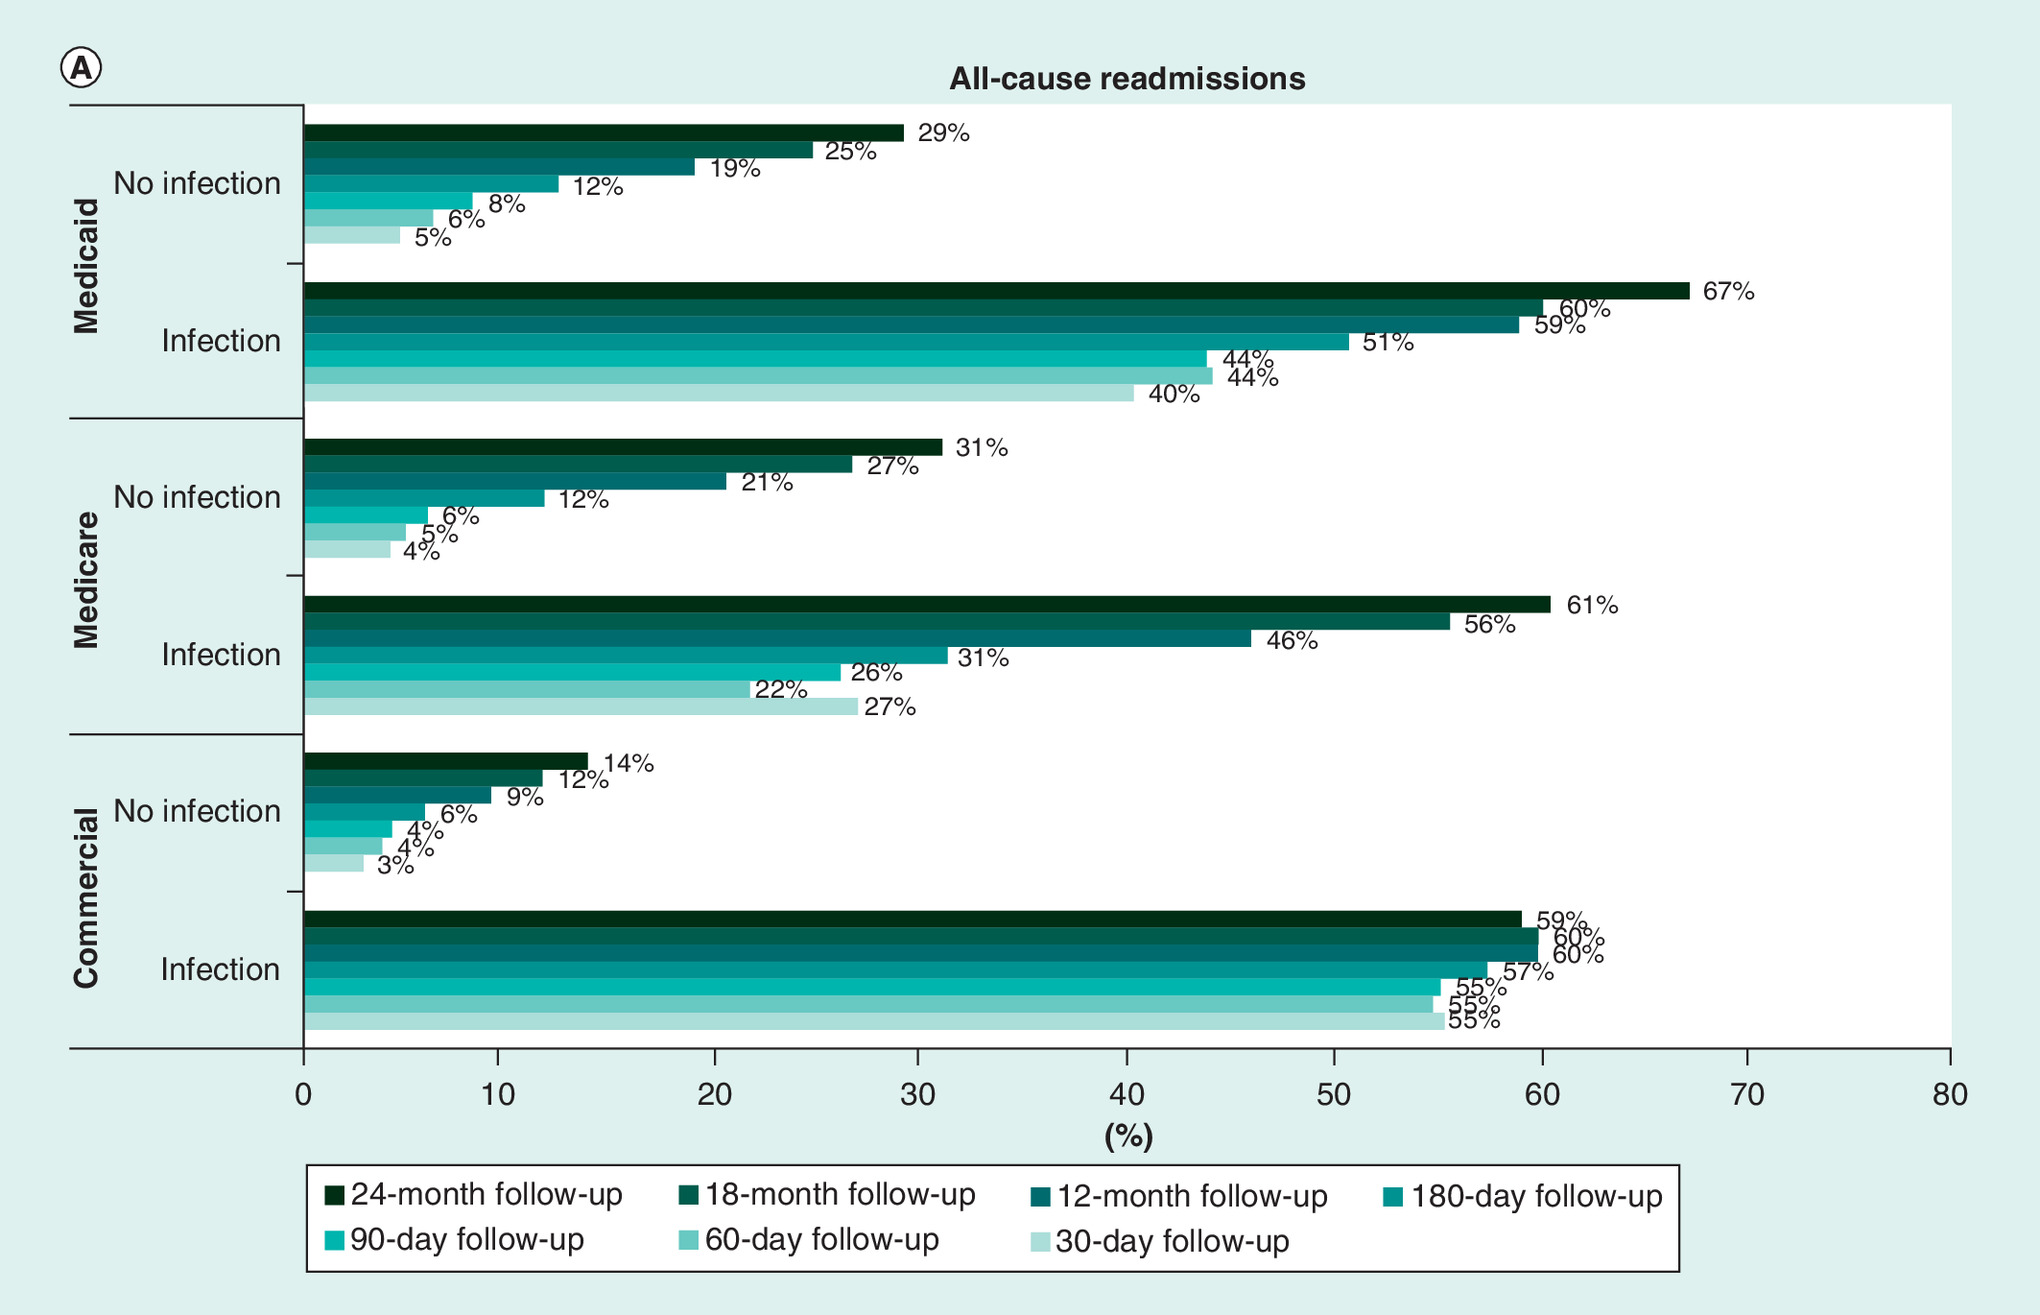

Figure 2. Hospital readmissions and emergency room visits rates across every time period during study follow-up, compared with patients with no diagnosed infection.
Percentage of patients with resource use were compared between those with infections and no infections. All comparisons were made using Chi-square tests and all results were statistically significant at p < 0.0001.
The total healthcare cost to the payer incurred was significantly higher for the group developing infections during follow-up (Table 3). At day 30, the average healthcare expenditure for commercially insured patients with infection was US$25,942 (SD: 38,278) which is 11-times greater than the group without infections (US$2360 [SD:8053]; p < 0.0001). At the end of day 365, the average cost incurred by patients with infections rose to as much as US$67,494 (SD: 94,657), more than five-times higher than the group without infections (US$13,434 [SD: 27,436]; p < 0.0001). At 1 year follow-up, younger commercially insured patients were less likely to develop infections, compared with those aged 46–64 years (vs 18–24 years, odds ratio (OR): 0.63; 95% CI: 0.48–0.83; vs 25–45 years, OR: 0.74; 95% CI: 0.63–0.88). Patients with open fractures were 69% more likely to develop infections compared with closed fractures (OR: 1.69; 95% CI: 1.35–2.12). Similarly, patients with open fractures were significantly more likely to develop nonunions compared with those with closed fractures (OR: 1.67; 95% CI: 1.36–2.04) Commercially insured patients diagnosed with diabetes in the pre-index period had a 45% increased likelihood of nonunion (OR: 1.45; 95% CI: 1.08–2.96), whereas Medicare patients with diabetes had an 85% increased likelihood of nonunion (OR: 1.85; 95% CI: 1.03–3.33; Supplementary Material 2)
| ALL cost | SSI cost | Non-SSI cost | ||||||||
|---|---|---|---|---|---|---|---|---|---|---|
| Commercial | Medicare | Medicaid | Commercial | Medicare | Medicaid | Commercial | Medicare | Medicaid | ||
| 30-day follow-up | N | 19,383 | 2654 | 2299 | 352 | 78 | 62 | 19,031 | 2576 | 2237 |
| Mean | 2789 | 7928 | 2540 | 25,942 | 17,647 | 10,262 | 2360 | 7634 | 2326 | |
| Median | 729 | 2231 | 417 | 14,492 | 10,272 | 2002 | 710 | 2131 | 399 | |
| StdDev | 10,007 | 15,046 | 19,288 | 38,278 | 21,726 | 17,608 | 8054 | 14,703 | 19,292 | |
| 60-day follow-up | N | 18,770 | 2557 | 2219 | 589 | 143 | 102 | 18,181 | 2414 | 2117 |
| Mean | 4670 | 12,492 | 4233 | 31,559 | 25,102 | 18,662 | 3799 | 11,745 | 3538 | |
| Median | 1537 | 3966 | 818 | 17,793 | 17,796 | 3590 | 1480 | 3674 | 770 | |
| StdDev | 14,520 | 20,280 | 23,918 | 46,520 | 26,165 | 59,184 | 11,113 | 19,632 | 20,541 | |
| 90-day follow-up | N | 18,101 | 2482 | 2140 | 697 | 188 | 114 | 17,404 | 2294 | 2026 |
| Mean | 6291 | 16,064 | 5425 | 36,115 | 33,431 | 20,170 | 5097 | 14,641 | 4595 | |
| Median | 2448 | 6023 | 1237 | 21,498 | 24,126 | 6171 | 2344 | 5073 | 1171 | |
| StdDev | 17,460 | 26,782 | 19,096 | 50,825 | 36,371 | 56,497 | 13,293 | 25,326 | 13,933 | |
| 180-day follow-up | N | 15,969 | 2245 | 1908 | 773 | 208 | 140 | 15,196 | 2037 | 1768 |
| Mean | 10,463 | 22,739 | 10,287 | 51,023 | 47,104 | 29,170 | 8400 | 20,251 | 8792 | |
| Median | 4424 | 10,923 | 2433 | 30,528 | 30,778 | 13,853 | 4189 | 9264 | 2138 | |
| StdDev | 25,943 | 36,321 | 27,820 | 67,920 | 54,962 | 58,899 | 19,621 | 32,864 | 23,063 | |
| 12-month follow-up | N | 12,589 | 1858 | 1515 | 783 | 187 | 139 | 11,806 | 1671 | 1376 |
| Mean | 16,796 | 33,161 | 19,601 | 67,494 | 66,884 | 48,571 | 13,434 | 29,387 | 16,675 | |
| Median | 7165 | 17,548 | 5886 | 40,445 | 41,324 | 24,797 | 6605 | 15,299 | 4874 | |
| StdDev | 37,855 | 52,527 | 39,118 | 94,657 | 75,096 | 73,675 | 27,436 | 47,942 | 32,353 | |
| 18-month follow-up | N | 10,094 | 1530 | 1212 | 704 | 176 | 123 | 9390 | 1354 | 1089 |
| Mean | 22,217 | 42,621 | 29,462 | 82,193 | 85,233 | 62,072 | 17,721 | 37,082 | 25,778 | |
| Median | 9568 | 24,435 | 10,125 | 46,304 | 56,712 | 33,139 | 8756 | 21,432 | 8670 | |
| StdDev | 47,605 | 60,957 | 52,735 | 125,433 | 84,796 | 83,762 | 31,116 | 54,792 | 46,636 | |
| 24-month follow-up | N | 8159 | 1274 | 1002 | 607 | 157 | 113 | 7552 | 1117 | 889 |
| Mean | 26,455 | 50,263 | 43,055 | 82,306 | 96,344 | 91,852 | 21,966 | 43,786 | 36,853 | |
| Median | 12,139 | 30,377 | 13,396 | 50,706 | 63,307 | 58,260 | 10,885 | 25,955 | 11,224 | |
| StdDev | 48,698 | 65,411 | 79,302 | 102,387 | 108,054 | 113,101 | 38,077 | 53,923 | 71,653 | |
All values in USD. All p-values comparing SSI to non-SSI were p < 0.0001.
SSI: Surgical site infections.
Discussion
Tibial shaft fractures, apart from directly adding to the healthcare burden, can be complicated by nonunion and infections. These complications significantly increase the rates of emergency room visits and readmissions with significantly increased total healthcare costs. Small, single setting, studies allow hypothesis generation related to nonunion and infection risk factors, while large real-world data (data relating to patient health status and/or the delivery of healthcare routinely collected from a variety of sources, for example, registries, collections of electronic health records and administrative healthcare claims databases) [14] studies expand our understanding of risks post-ORIF and test the hypothesis. To our knowledge this study is the first to assess nonunion and infection rates in the same population in a large-scale, nationally-representative claims database. This is also the first study to measure these outcomes at different follow-up periods and assess the risk within each timeframe thus, can assist in developing the surgical and post-surgical treatment plan. The study further validates the need to address this patient population to help control costs and improve outcomes.
Recent studies reported post-surgical infection-specific rates of 2–3% at 30 days [9] and about 8% at 7 years [8]. Shepard et al. conducted a retrospective analysis at four Johns Hopkins Health System acute care hospitals and found the surgical site infection rate was 2.76 per 100 surgical procedures; the length-of-stay for patients with infection was almost twice that for patients without infection (10.56 vs 5.64 days in hospital, respectively) with statistically higher 30-day readmission rate (51.94 vs 8.19%, p < 0.001, respectively) [9]. Our nationwide claims-based study showed similar results, with an average 3% infection rate in the 30-day post-ORIF; 30-day readmission rates were 55% for patients with infection and 3% for those without infections. Another center-specific retrospective study of patients treated at a Level 1 trauma center reported a 7-year infection rate of 7.8% (20 out of 256 cases) [8], very similar to our 2-year infection rate of 7.4%, although their 4-week infection rate of 4.7% was higher than our 3% 30-day rate.
Antonova and colleagues [1] conducted a retrospective US managed care claims study of 853 patients with tibial shaft fractures, and reported an overall nonunion rate of 12% over the 2-year follow-up, with a higher rate observed among patients with open fractures (23%) compared with closed (10%). For a similar follow-up duration, we observed a 9% rate of nonunion among patients with both closed and open tibial shaft fractures.
Our study found an 11-fold difference between the mean 30-day total healthcare costs for tibial shaft fractures post-ORIF for those experiencing an infection (US$25,942) compared with those without infection (US$2360); there was a fivefold difference at 1 year. In contrast, the Johns Hopkins Health System study [9] of multiple inpatient surgical procedures (not including tibial shaft fracture [TSF]), reported average post-surgery hospital charges (as opposed to costs) to be 1.8-fold higher for those experiencing infection compared with those who do not (US$79,134/10.56 day median length of stay [LOS] vs US$44,727/5.64 day median LOS), and the average duration of follow-up is unclear. In another cost analysis of nonunion after TSF, Antonova et al. [1] found median 2-year total healthcare costs to be more than twice as high compared with those without nonunion (median US$25,556 vs US$11,686).
Despite study design differences, mainly in case-finding criteria, these closely aligned results offer good external validity to our infection, nonunion and readmission rates. For example, Lin et al. [8] limited study inclusion to patients who had treatment for an infection within 6 months post-surgery, while our study assessed infection rates up to 24 months. Other study design factors provide a rationale for differences in costs between our research and others. Shepard et al. [9] evaluated multiple inpatient surgical procedures, not including TSF, in a single center analysis involving multiple surgical procedure hospital charges over a maximum period of 4 years. Antonova et al. [1] specifically assessed nonunion rates and costs, in an analysis based on treatment approaches from 2006 to 2008, while our cost analysis was specific to surgical infections. Further, our findings are consistent with other literature suggesting greater hospitalization and higher healthcare costs in individuals experiencing surgical complications, including infection [15,16]. This research also provides insight into patient characteristics that may be associated with more intense healthcare utilization immediately post-surgery. Within the acute timeframe, it was observed that males and the elderly patient population were more likely to develop infections and therefore probably require more individualized postoperative/postprocedure care. This care should extend beyond acute management as similar result trends are observed even at a longer follow-up duration (results not reported). Patients with open fractures also need alternative therapy management because their risk of developing infection and nonunion is consistently much higher, across all time frames.
The findings of our study should be considered notwithstanding a few limitations. The inclusion criteria and database used for analysis is limited to individuals with medical and prescription benefit coverage, thereby limiting generalizability to those without health insurance or coverage. The diagnosis codes for infection may lack specificity regarding the exact anatomy of the surgical site and there could be under-reporting or missed diagnoses, based on patient’s choice (not to seek care) or access challenges. In this study, postoperative infection may not have been at the site of the ORIF, however the clinicians on the team reviewed and included codes to limit this potential bias. The presence of postoperative infection was identified based on ICD-9-CM, ICD-10-CM diagnosis and CPT codes, without the availability of laboratory confirmation. Results have been mixed regarding the accuracy of ICD-9-CM diagnosis codes for infection after various procedures [17]. However, administrative data using ICD-10-CM codes have shown reasonable test performance characteristics for identification of complex infections after surgery [18]. Future research using newer data with ICD-10 codes and laboratory confirmation is warranted to validate study findings [19]. Patients with adherence problems may be less likely to seek or comply with care, causing under-reporting of outcomes, and contribute to a selection bias among the sampled population. Additionally, the identification of patients and outcomes relied upon on clinician’s use of diagnosis codes for billing purposes and therefore cannot completely exclude the likelihood of reporting errors or biases. This study is the first, to our knowledge, to investigate differences in rates of infection, nonunion and readmission, as well as healthcare costs by insurance type (commercial, Medicaid, Medicare); however, the association between fracture-related variables (e.g., compound, displaced, comminuted, among others) or patient characteristics (e.g., smoking, gender, age) on the outcome measures deserves further investigation. Productivity costs and indirect costs were not assessed; other studies have suggested that these costs may be substantial, with indirect costs exceeding direct medical healthcare costs by a factor of two in patients with tibia fractures [20]. This finding may be exacerbated by the fact that many trauma patients are young otherwise productive adults that may see substantial drop in productivity as a result of trauma. Future studies should evaluate this as well as explore other patient-reported outcomes related to health-related quality of life. Despite these limitations, this study provides essential and needed perspective on post-surgical tibial shaft fracture complication rates and specific medical costs associated with infection over specific time periods and by type of insured population.
Conclusion
In this nationwide retrospective real-world analysis of patients with tibial shaft fractures undergoing ORIF, an increasing rate of infection up to 2 years was determined. These post-surgical complications are accompanied by added healthcare resource use and expenditure.
•
Potential complications following open reduction and internal fixation (ORIF) include post-surgical infection, malunion, nonunion, knee pain, malrotation, compartment syndrome and nerve injury.
•
The objectives of this study were to estimate the real-world short-term and mid-term rates of infection and nonunion in patients with open and closed tibial shaft fractures after ORIF, as well as to estimate potential healthcare resource use and economic impact of post-ORIF infection.
•
IBM MarketScan® Research Databases including the Commercial, Medicare Supplemental and Medicaid databases were used to identify patients with open and closed tibial shaft fractures requiring ORIF.
•
Logistic regressions were used to examine associations between infection, and separately, nonunion and various independent risk factor variables; models were run for 1-year follow-up period.
•
At the 365-day time point, the rates for infections were to 6.2% (commercially insured), 10.1% (Medicare) and 9.2%(Medicaid), nonunion rates were as high as 8.2% for commercially insured patients, 5.8% for the Medicare population and 7% for the Medicaid patients.
•
This is the first study to investigate rates of infection, nonunion and healthcare resource use as well as costs by insurance type (commercial, Medicaid, Medicare) over different follow-up periods.
•
This study found that the patients with tibial shaft fractures undergoing ORIF are under risk of developing infections and nonunion for up to 2 years.
Supplementary data
To view the supplementary data that accompany this paper please visit the journal website at: Supplementary Material
Financial & competing interests disclosure
This study was funded by Johnson and Johnson. ASC, MV, CS, JM and CEH are employees and stock holders of Johnson & Johnson. The authors have no other relevant affiliations or financial involvement with any organization or entity with a financial interest in or financial conflict with the subject matter or materials discussed in the manuscript apart from those disclosed.
Writing assistance for the initial draft was provided by eMAX Health, White Plains, NY, which received funding from Johnson and Johnson.
Ethical conduct of research
IBM MarketScan database is in compliance with the Health Information Portability and Accountability Act of 1996 (HIPAA). Only de-identified patient records from IBM MarketScan database were used in this study; hence Institutional Review Board approval was not required.
Open access
This work is licensed under the Attribution-NonCommercial-NoDerivatives 4.0 Unported License. To view a copy of this license, visit http://creativecommons.org/licenses/by-nc-nd/4.0/
Supplementary Material
File (suppl_file.docx)
- Download
- 40.98 KB
References
Papers of special note have been highlighted as: • of interest; •• of considerable interest
1.
Antonova E, Le TK, Burge R, Mershon J. Tibia shaft fractures: costly burden of nonunions. BMC Musculoskelet. Disord. 14, 42 (2013).
• Compares healthcare use and costs with tibial shaft fractures in patients with and without nonunion.
2.
Metsemakers WJ, Handojo K, Reynders P, Sermon A, Vanderschot P, Nijs S. Individual risk factors for deep infection and compromised fracture healing after intramedullary nailing of tibial shaft fractures: a single centre experience of 480 patients. Injury 46(4), 740–745 (2015).
•• Provides risk factors associated with infection in tibial shaft fractures.
3.
Auston DA, Meiss J, Serrano R et al. Percutaneous or open reduction of closed tibial shaft fractures during intramedullary nailing does not increase wound complications, infection or nonunion rates. J. Orthop. Trauma 31(4), 215–219 (2017).
• Compares complications rates amongst different reduction methods in tibial shaft fractures.
4.
Johal H, Bhandari M, Tornetta P 3rd. Cochrane in CORR (®): Intramedullary nailing for tibial shaft fractures in adults (Review). Clin. Orthop. Relat. Res. 475(3), 585–591 (2017).
•• Provides importance of the topic by summarizing prevalence of tibial shaft fractures, associated treatment and complications.
5.
Sheth U, Bomberg J, Szatkowski J. Tibial shaft fractures (2019). https://www.orthobullets.com/trauma/1045/tibial-shaft-fractures
6.
Moore TM, Patzakis MJ, Harvey JP. Tibial plateau fractures: definition, demographics, treatment rationale, and long-term results of closed traction management or operative reduction. J. Orthop. Trauma 1(2), 97–119 (1987).
7.
Waddell JP, Johnston DW, Neidre A. Fractures of the tibial plateau: a review of ninety-five patients and comparison of treatment methods. J. Trauma 21(5), 376–381 (1981).
8.
Lin S, Mauffrey C, Hammerberg EM, Stahel PF, Hak DJ. Surgical site infection after open reduction and internal fixation of tibial plateau fractures. Eur. J. Orthop. Surg. Traumatol. 24(5), 797–803 (2014).
• Identifies risk factors for surgical site infections.
9.
Shepard J, Ward W, Milstone A et al. Financial impact of surgical site infections on hospitals: the hospital management perspective. JAMA Surg. 148(10), 907–914 (2013).
10.
Kuhn S, Hansen M, Rommens PM. Extending the indication of intramedullary nailing of tibial fractures. Eur. J. Trauma Emerg. Surg. 33(2), 159–169 (2007).
11.
Zura R, Xiong Z, Einhorn T et al. Epidemiology of fracture nonunion in 18 human bones. JAMA Surg. 151(11), e162775 (2016).
12.
Papagelopoulos PJ, Partsinevelos AA, Themistocleous GS, Mavrogenis AF, Korres DS, Soucacos PN. Complications after tibia plateau fracture surgery. Injury 37(6), 475–484 (2006).
13.
Olesen UK, Pedersen NJ, Eckardt H et al. The cost of infection in severe open tibial fractures treated with a free flap. Int. Orthop. 41(5), 1049–1055 (2017).
14.
Use of Real-World Evidence to Support Regulatory Decision-Making for Medical Devices. Guidance for Industry and Food and Drug Administration Staff (2017). https://www.fda.gov/regulatory-information/search-fda-guidance-documents/use-real-world-evidence-support-regulatory-decision-making-medical-devices
15.
Dahabreh Z, Calori GM, Kanakaris NK, Nikolaou VS, Giannoudis PV. A cost analysis of treatment of tibial fracture nonunion by bone grafting or bone morphogenetic protein-7. Int. Orthop. 33(5), 1407–1414 (2009).
16.
Dahabreh Z, Dimitriou R, Giannoudis PV. Health economics: a cost analysis of treatment of persistent fracture non-unions using bone morphogenetic protein-7. Injury 38(3), 371–377 (2007).
17.
Olsen MA, Ball KE, Nickel KB, Wallace AE, Fraser VJ. Validation of ICD-9-CM diagnosis codes for surgical site infection and noninfectious wound complications after mastectomy. Infect. Control Hosp. Epidemiol. 38(3), 334–339 (2017).
18.
Rennert-May E, Manns B, Smith S et al. Validity of administrative data in identifying complex surgical site infections from a population-based cohort after primary hip and knee arthroplasty in Alberta, Canada. Am. J. Infect. Control 46(10), 1123–1126 (2018).
19.
Metsemakers WJ, Morgenstern M, McNally MA et al. Fracture-related infection: a consensus on definition from an international expert group. Injury 49(3), 505–510 (2018).
20.
Heckman JD, Sarasohn-Kahn J. The economics of treating tibia fractures. The cost of delayed unions. Bull. Hosp. Jt Dis. 56(1), 63–72 (1997).
•• Provides the costs associated with delayed union in tibial fractures.
Information & Authors
Information
Published In
Pages: 1405 - 1416
PubMed: 31755297
Copyright
© 2019 Abhishek S Chitnis.
History
Received: 30 July 2019
Accepted: 8 October 2019
Published online: 22 November 2019
Keywords:
Topics
Authors
Metrics & Citations
Metrics
Article Usage
Article usage data only available from February 2023. Historical article usage data, showing the number of article downloads, is available upon request.
Citations
How to Cite
Complications and its impact in patients with closed and open tibial shaft fractures requiring open reduction and internal fixation. (2019) Journal of Comparative Effectiveness Research. DOI: 10.2217/cer-2019-0108
Export citation
Select the citation format you wish to export for this article or chapter.
Citing Literature
- Peter V. Giannoudis, Jean-Baptiste Trouiller, Mesut Kocaman, Alicyia Walczyk-Mooradally, Suzanne Battaglia, Sarah Kane, Cindy Tong, Michael Blauth, Willem-Jan Metsemakers, The environmental impact of tibial fracture-related infections, Injury, 10.1016/j.injury.2026.113191, 57, 6, (113191), (2026).
- Benjamin Conover, David Ferguson, Brandon Wood, Simon Tiziani, Bingchun Wan, Joshua Sun, Drew Sanders, Dane Wukich, Adam Starr, Ashoke Sathy, Ishvinder Grewal, Postoperative outcomes based on timing of definitive fixation and flap coverage in Gustilo-Anderson 3B open tibia fractures, Injury, 10.1016/j.injury.2025.113013, 57, 2, (113013), (2026).
- O.Ie. Oliinyk, O.Ie. Loskutov, S.O. Yakushev, D.A. Syniehubov, Patient-Dependent Risk Factors for Nonunion of Long Bone Fractures After Metal Osteosynthesis, TERRA ORTHOPAEDICA, 10.37647/2786-7595-2025-127-4-28-36, 4(127), (28-36), (2025).
- Ada Hoffmann, Jörgen Hoffmann, Tamara Ruegamer, Norma Jung, Ronald Man Yeung Wong, Volker Alt, Peer Eysel, Jonathan Jantsch, New diagnostic techniques for diagnosing facture-related infections, Injury, 10.1016/j.injury.2024.111898, 55, (111898), (2024).
- Zakaria Chakrani, Carolina Stocchi, Husni Alasadi, Nicole Zubizarreta, Brocha Z. Stern, Jashvant Poeran, David A. Forsh, Prolonged Opioid Use and Associated Factors After Open Reduction and Internal Fixation of Tibial Shaft Fractures, Orthopedics, 10.3928/01477447-20240605-02, 47, 4, (2024).
- Christian Ehrnthaller, Klevin Hoxhaj, Kirsi Manz, Yunjie Zhang, Julian Fürmetz, Wolfgang Böcker, Christoph Linhart, Preventing Atrophic Long-Bone Nonunion: Retrospective Analysis at a Level I Trauma Center, Journal of Clinical Medicine, 10.3390/jcm13072071, 13, 7, (2071), (2024).
- Augustine M. Saiz, Dustin Stwalley, Philip Wolinsky, Anna N. Miller, Patient Comorbidities Associated With Acute Infection After Open Tibial Fractures, JAAOS: Global Research and Reviews, 10.5435/JAAOSGlobal-D-22-00196, 6, 9, (2022).
- Saiganesh Shetty, Prabhu Ethiraj, Arun H Shanthappa, C-reactive Protein Is a Diagnostic Tool for Postoperative Infection in Orthopaedics, Cureus, 10.7759/cureus.22270, (2022).
- Madeleine C. Stevenson, Julia C. Slater, H. Claude Sagi, Federico Palacio Bedoya, Margaret V. Powers-Fletcher, Diagnosing Fracture-Related Infections: Where Are We Now?, Journal of Clinical Microbiology, 10.1128/JCM.02807-20, 60, 2, (2022).
- S. Venkatesh Babu, S. Venkatesh Babu, Safe Leg Surgery, Safe Orthopaedic Surgery, 10.1007/978-981-16-2846-7_12, (95-106), (2021).