Factors associated with evidence-based decision-making among patients and providers
Publication: Journal of Comparative Effectiveness Research
Abstract
Aim: For comparative effectiveness research to achieve its purpose, providers and patients must use research evidence to make medical decisions. Therefore, this study examined factors associated with evidence-based decision-making by patients and providers. Methods: Data were collected via cross-sectional online surveys of patients (n = 603) and providers (n = 628) between November 2011 and January 2012. Results: For both patients and providers, evidence-based medical decision-making is associated with perceptions, that is, some combination of self efficacy, attitudes and opinions. However, whereas knowledge is the most consistent factor associated with decision-making for providers, it is not associated at all for patients. Conclusion: Efforts to promote evidence-based medical decision-making among patients and providers should focus on skills training to improve self efficacy, and messages that highlight the benefits of patient engagement in medical decisions.
The purpose of comparative effectiveness research (CER) and patient-centered outcomes research (PCOR) is to ensure that providers and patients have the information they need to make evidence-based medical decisions. With the passage of the Affordable Care Act, the federal government invested funds in pursuit of this goal, including establishing the PCOR Institute (PCORI). The institute's grants help to expand the knowledge base for researchers, providers and patients to help increase CER use.
Existing research finds that most patients lack a basic understanding of the concepts around CER. Arriving at the point where patients commonly use evidence from CER is complicated by several factors, including diversity of patient opinion, with some patients desiring to be involved in CER to help improve clinician understanding of the patient perspective and access to research findings [1], and others being unaware of or misunderstanding the concepts around CER [2]; barriers to accessing CER, such as research that does not address patient priorities or information that is presented in impenetrable, academic-style jargon writing [3]; trust of providers over CER when presented with conflicting information [2,4,5]; and belief among some patients [6] that the use of evidence from CER could potentially limit treatment options.
Although provider engagement has progressed further than patient engagement [4,5], providers’ experiences with and opinions of CER are not monolithic. The literature documents challenges for integrating PCOR/CER into providers’ clinical practice, including the heterogeneity of providers’ backgrounds, practice environments, training, as well as external factors, such as the market environment and policy [3,7]; study results that are not clear-cut, with the potential for interpretation based on existing beliefs or biases [8]; and providers finding that decision aids or other tools they would use in face-to-face interactions with patients can be a barrier rather than a facilitator to engaging with patients or integrating them into the clinic visit [8].
With so much existing research documenting barriers and challenges to the uptake of evidence-based information from CER among patients and providers, we seek to improve understanding within the field of the factors associated with evidence-based medical decision-making for patients and providers. To do so, we conducted online surveys of patients and providers to assess how knowledge, skills and attitudes are associated with engaging in evidence-based decision-making by providers and patients. The goal of our exploratory study was to identify factors associated with the use of CER in medical decision-making, using multivariate linear regression. We were guided by a conceptual framework that we developed, based on a generic knowledge-attitudes-behavior (KAB) approach.
Methods
Patient survey procedure & sampling
We contracted with Marketing Systems Group to conduct an online survey through the vendor Luth Research, which maintains an opt-in online panel of approximately 2 million people. Luth drew a sample of 1678 adults who self-reported having one or more of the four conditions most commonly reported in the Luth panel – hypertension, Type II diabetes, high cholesterol or fibromyalgia. Patients with chronic conditions are currently under medical care, and therefore CER is relevant for them. Luth sent invitation emails and up to three reminder emails to the sample. The invitations and reminders informed prospective respondents that participation in the survey was voluntary, survey responses would be kept confidential and survey participation would be anonymous; the survey instrument reiterated the assurances of confidentiality and anonymity. We fielded the online survey between November 2011 and January 2012, collecting data from 603 respondents; the response rate was 36%. The sample was 67% female; had a mean age of 52 years; and was predominantly white (86% white, 5% African–American, 4% Latino/a, 1% Asian and 5% multiple). Respondents were sent a US$20 check after completing the questionnaire.
Provider survey procedure & sampling
The sample list for providers was leased from the vendor SK&A, a company that manages databases compiled from such sources as company and corporate directories, websites, state licensing information, telephone directories (white and yellow pages), and professional associations. SK&A staff conducts telephone verification calls to maximize the accuracy of the information. SK&A drew a sample of 5,670 physicians, nurse practitioners and physician assistants. We sent invitation letters by postal mail, invitation emails and up to three reminder emails to the sample. The invitations and reminders informed prospective respondents that participation in the survey was voluntary, survey responses would be kept confidential and survey participation would be anonymous; the survey instrument reiterated the assurances of confidentiality and anonymity. We fielded the online survey between November 2011 and January 2012, collecting data from 628 respondents; the response rate was 9%. The broader project also included a sample of healthcare administrators drawn by SK&A. Respondents were initially classified as patients, providers or healthcare administrators based on classification by the sample providers. 507 of those in the provider sample responded, resulting in a 9% response rate. However, respondents were realigned based on self-identification in the survey as healthcare administrators, providers (not also healthcare administrators) and patients (neither healthcare administrators nor providers). The final 628 providers in our analytic sample included 446 from the provider sample, 163 from the healthcare administrator sample and 19 from the patient sample. The sample was 42% female and had a mean age of 48 years. Respondents were sent a US$20 check after completing the questionnaire.
Sample size determination
Because we collected the data for a broader project that examined differences among CER stakeholder groups, sample size was determined by a statistical power analysis of ability to detect differences between patients and providers. To enhance our ability to detect statistically significant effects, we conducted our power analysis using conservative assumptions, and therefore, did not need to conduct a power analysis for the current study's analyses. To have an 80% power to detect a difference of 0.083 at a 0.05 significance level for a variable that is a proportion of 0.5, the minimum sample sizes are 600 for patients and 553 for providers.
Sample weighting
Because these were online surveys, we limited the sample frames to people for whom the sample vendors had an email address on file. After the data collection period ended, we calculated weights for the survey data to account for the probability of being selected into the sample. Weighting for the probability of selection accounts for the variation in selection probabilities in the sample. Because respondents may be different from nonrespondents on important variables of interest, weighting for nonresponse corrects for potential bias that may result. The probability of selection is the number of sampled cases divided by the sample frame size. The weight is calculated by dividing one over the probability of selection. For providers, the weight was calculated separately for each provider type because the sample frame differed for physicians, nurse practitioners and physician assistants. In addition to the weighting for selection probability, the sample weights also included poststratification adjustments for age, race and gender. Poststratification adjusts the sampling weights so that the joint distribution of a set of poststratifying variables matches the known population joint distribution. When the full joint distribution is not available, we use a raking (or iterative) procedure so that the final distribution of each weighting variable in the dataset matches the distribution of that variable in the population. Because of the relatively low response rates, we did not calculate weights for differential nonresponse. In addition, a distribution of chronic diseases in the US population is not available; therefore, although we poststratified both samples for age, race and gender, we could not poststratify the patient sample to reflect the age-race-gender distribution of patients with chronic diseases, which may be different from the distribution in the broader population.
Survey instrument
In developing our survey instrument, we were guided by a conceptual framework that we developed, based on a generic KAB approach. The framework identified our domains – CER-related knowledge, self efficacy/skills, attitudes, opinions and behaviors – and key constructs within each domain. Our constructs were then refined based on feedback from a technical advisory panel composed of medical decision-making experts representing a diverse range of disciplines and professional affiliations.
We developed the English-language survey instrument following a review of existing literature and survey instruments, which yielded no existing items suitable or adaptable for our domains. Therefore, our survey items were newly developed but in a few cases informed by wording of phrases or terms in existing items. For many items, we developed parallel versions tailored to patients and providers; patient versions were designed to be appropriate for those with a lower reading level and avoided terminology familiar to providers but not to patients. Once we developed the draft survey instrument, our technical advisory panel provided focused feedback to address two challenges we had identified – ensuring that the parallel versions of items had the same meaning and ensuring that our knowledge items reflected consensus among experts and yet would result in a wide distribution of responses. We then cognitively tested the survey with seven individuals identified through leads from colleagues. The final instrument took 15–20 min for respondents to complete and received Office of Management and Budget approval (control number 201105-0990-004, expiration date 08/31/2014).
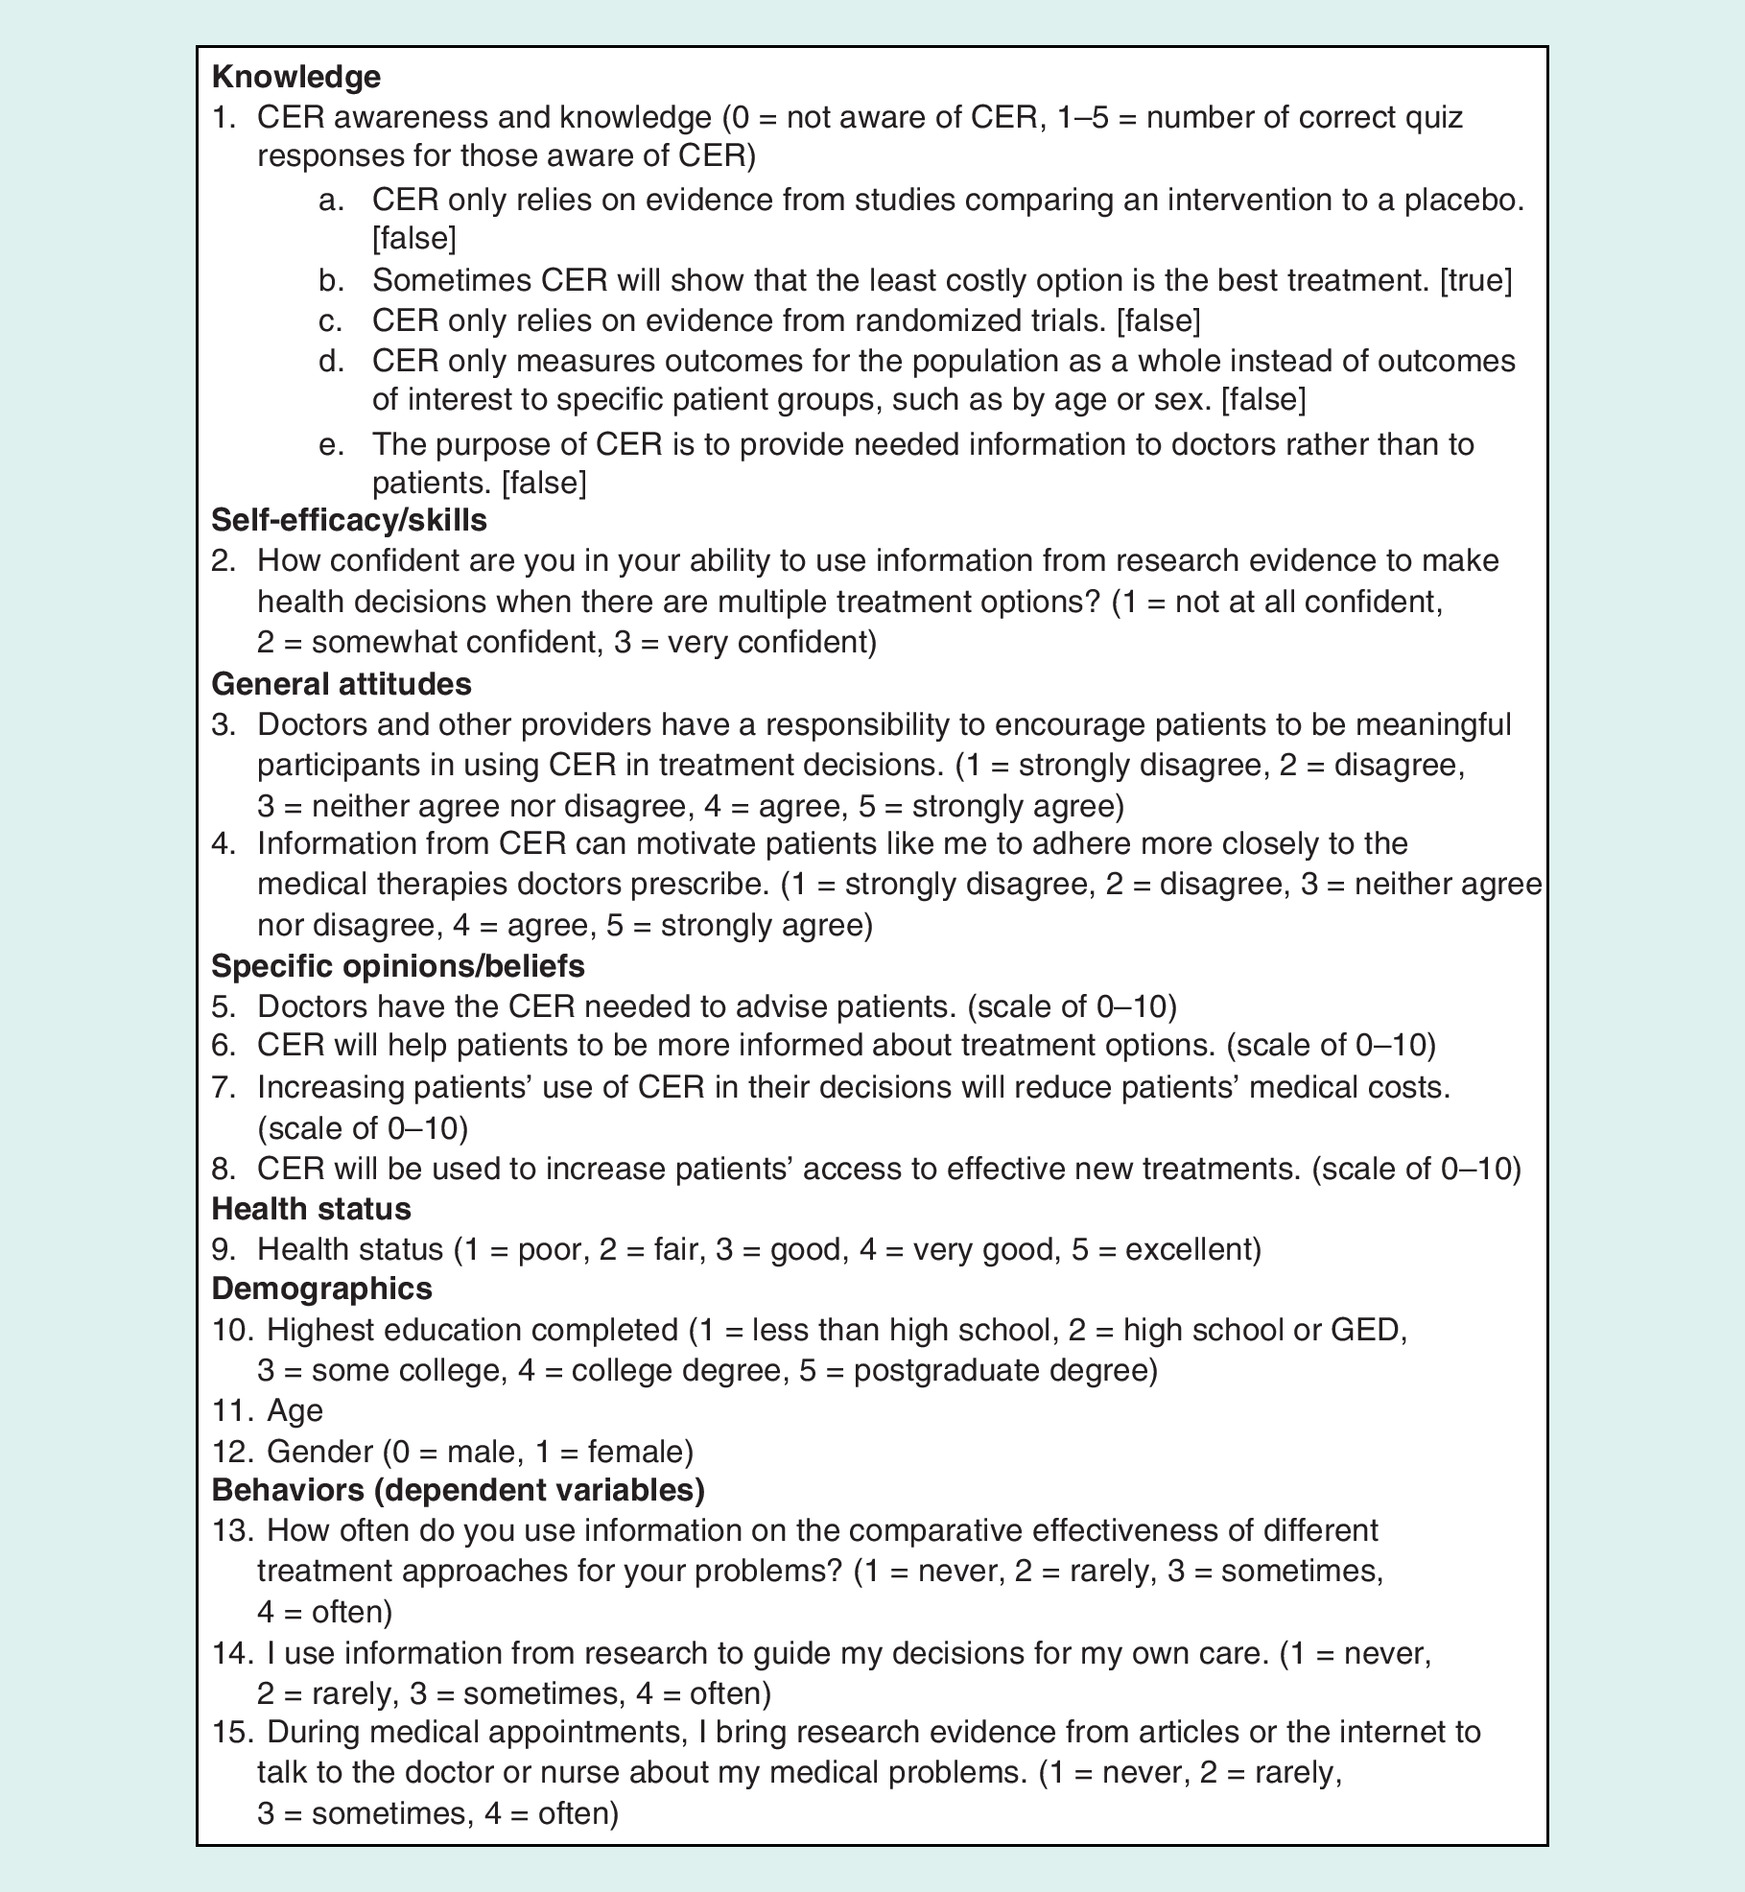
The patient version of the survey instrument assessed knowledge (one composite item), self efficacy/skills (one item), general attitudes (two items), specific opinions/beliefs (four items) and behaviors pertinent to CER (three items), as well as health status and demographics (education, age and gender). Figure 1 presents all of the variables used in the patient analysis.
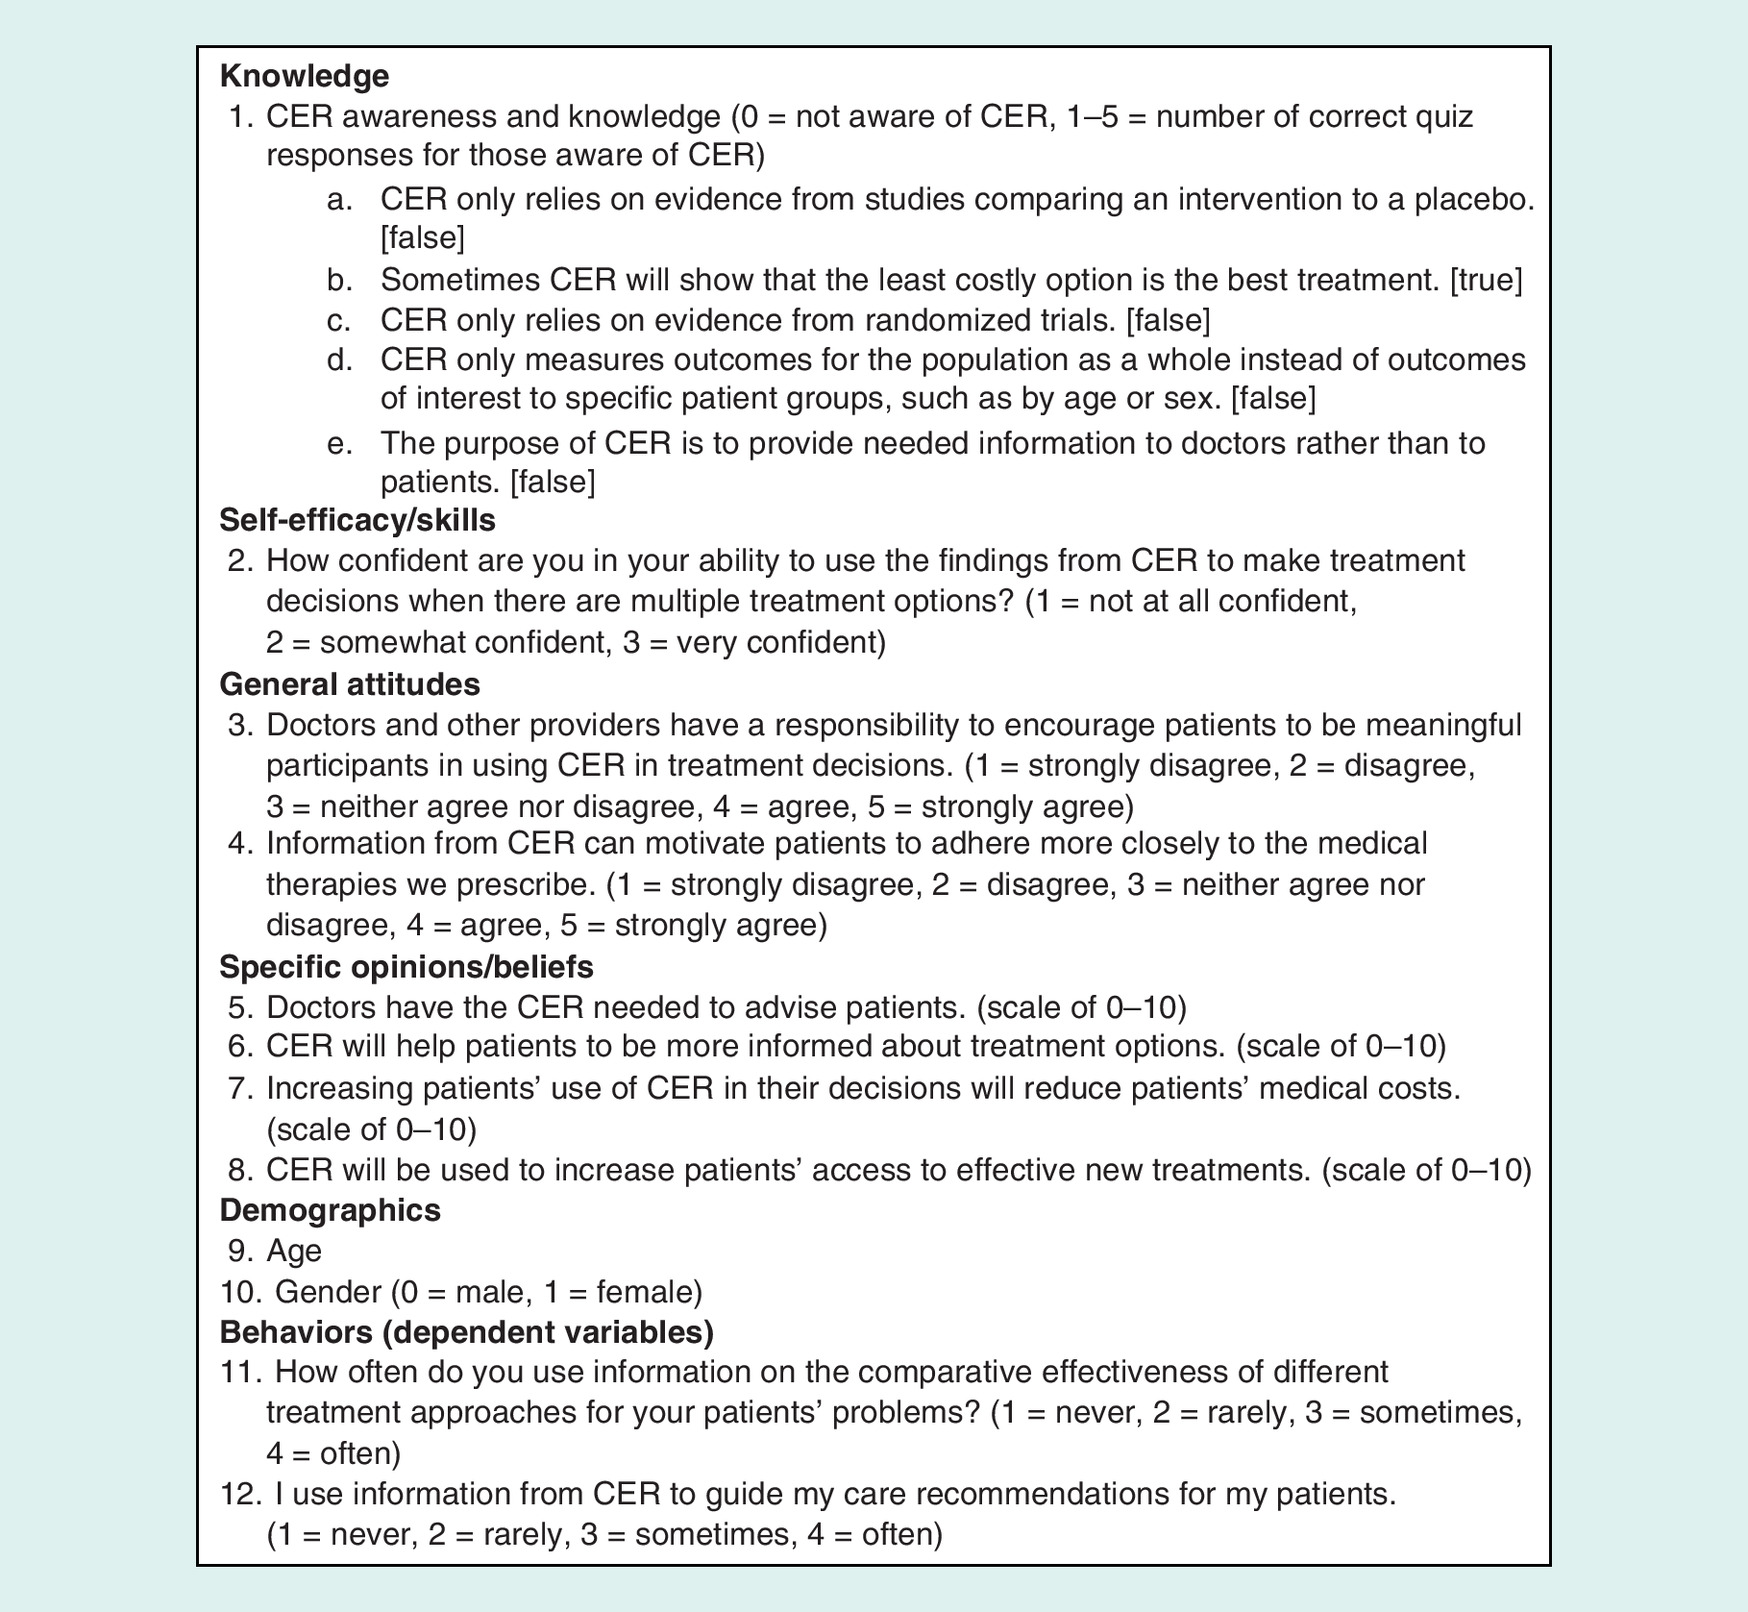
The provider version of the survey instrument assessed knowledge (one composite item), self efficacy/skills (one item), general attitudes (two items), specific opinions/beliefs (four items) and behaviors pertinent to CER (two items), as well as demographics (age and gender). Figure 2 presents all of the variables used in the provider analysis.
Data analysis
We conducted data analysis using the IBM SPSS Statistics Version 22 software Complex Samples General Linear Model procedure, to apply the weighting for selection probability with poststratification adjustments for age, race and gender for the multivariate linear regressions. Separately for patients and providers, we regressed each behavior item on the remaining survey items using backward stepwise elimination, with the criterion for inclusion set at 0.05, listwise deletion of missing data, and two-tailed tests of statistical significance.
Although pairwise deletion of missing data would have retained more respondents in each regression model, using pairwise deletion in a multivariate analysis can be problematic, because different respondents contribute to different coefficients within the same model. Furthermore, the Ns in the results tables show that using listwise deletion did not greatly reduce the number of respondents included in each regression model, because relatively few respondents had any missing data.
We selected the backward elimination procedure specifically because it is well-suited to exploratory research, effectively eliminating the least informative variables and retaining the strongest variables in the regression model. However, the procedure is vulnerable to multicollinearity, resulting in unstable regression results. Therefore, we conducted checks to assess multicollinearity and stability of the results.
•
To assess multicollinearity, we examined correlations among all of the independent variables. For the patient analysis, only two of 66 correlations among the 12 independent variables qualified as moderate (greater than or equal to ±0.4) and none as strong (greater than or equal to ±0.6); for the provider analysis, none of the 45 correlations among the ten independent variables even qualified as moderate.
•
To assess stability of the results, we examined the univariate relationships between the independent and dependent variables using univariate linear regressions. Most important, all variables that are significant in our five multivariate models are also significant in the univariate regressions. For each model, a few additional variables are significant in the univariate regressions, but otherwise, variables not significant in the multivariate regressions are not significant in the univariate regressions.
We also conducted standard checks to assess the extent to which the data met the nonautocorrelation, noncollinearity and normality assumptions of the linear regression procedure:
•
We used the Durbin–Watson test to assess noncorrelation. Test statistics for the five regressions (three for patients and two for providers) ranged from 1.88 to 2.08, well within the recommended 1.5–2.5 range;
•
We used the Tolerance and Variance inflation factors (VIF) tests to assess non-collinearity. Minimum Tolerance test statistics for the five regressions ranged from 0.56 to 0.63, well above the recommended threshold of ten. Maximum VIF test statistics ranged from 1.58 to 1.80, well below the recommended threshold of ten;
•
We assessed normality for all of the analytic variables with the Kolmogorov–Smirnov and Shapiro–Wilk goodness-of-fit tests. Both tests were significant for all variables at p < 0.001, indicating a potential lack of normality. However, as recommended, we also examined the Q-Q plots for all of the variables. Visual inspection of those plots showed that deviations from normality were small for all variables except knowledge for patients (for which the distribution was very right-skewed), and gender (which is a dummy coded variable, and so would not be expected to have a normal distribution).
Results
Results from the patient analysis
Tables 1, 2 and 3 present the regression results for each of the three behaviors (dependent variables). For all three behaviors, after eliminating variables not significant in the first step, all remaining variables were significant in the second step, so no further backward elimination was required. Among the three, the regressions show stronger associations for ‘use of information on different treatment approaches (R2 = 0.20)’ and ‘use of research information to guide care decisions (R2 = 0.23) than for bringing evidence to medical appointments (R2 = 0.14)'.
| Step 1: All variables (n = 578; R2 = 0.205) | |
| Awareness and knowledge (knowledge) | 0.06 |
| Confidence can use information (self efficacy) | 0.26** |
| Doctors responsible for involving patients (attitude) | 0.12* |
| Information motivates patient adherence (attitude) | 0.24*** |
| Doctors have CER needed (opinion) | 0.01 |
| CER will lead to more informed decisions (opinion) | 0.06* |
| CER will reduce medical costs (opinion) | 0.02 |
| CER will increase access to new treatments (opinion) | -0.02 |
| Health status | -0.01 |
| Educational attainment | -0.05 |
| Age | -0.00 |
| Gender | -0.07 |
| Step 2: Variables significant in step 1 (n = 587; R2 = 0.195) | |
| Confidence can use information (self efficacy) | 0.28*** |
| Doctors responsible for involving patients (attitude) | 0.12* |
| Information motivates patient adherence (attitude) | 0.25*** |
| CER will lead to more informed decisions (opinion) | 0.05* |
*
p < 0.05.
**
p < 0.01.
***
p < 0.001.
CER: Comparative effectiveness research.
| Step 1: All variables (n = 577; R2 = 0.259) | |
| Awareness and knowledge (knowledge) | 0.02 |
| Confidence can use information (self efficacy) | 0.19* |
| Doctors responsible for involving patients (attitude) | 0.12 |
| Information motivates patient adherence (attitude) | 0.12 |
| Doctors have CER needed (opinion) | -0.05** |
| CER will lead to more informed decisions (opinion) | 0.09** |
| CER will reduce medical costs (opinion) | 0.08*** |
| CER will increase access to new treatments (opinion) | 0.00 |
| Health status | -0.02 |
| Educational attainment | 0.13** |
| Age | -0.01*** |
| Gender | 0.00 |
| Step 2: Variables significant in step 1 (n = 590; R2 = 0.231) | |
| Confidence can use information (self efficacy) | 0.22*** |
| Doctors have CER needed (opinion) | -0.06** |
| CER will lead to more informed decisions (opinion) | 0.12*** |
| CER will reduce medical costs (opinion) | 0.09*** |
| Educational attainment | 0.15*** |
| Age | -0.01*** |
*
p < 0.05.
**
p < 0.01.
***
p < 0.001.
CER: Comparative effectiveness research.
| Step 1: All variables (n = 576; R2 = 0.184) | |
| Awareness and knowledge (knowledge) | 0.01 |
| Confidence can use information (self efficacy) | 0.15 |
| Doctors responsible for involving patients (attitude) | 0.25*** |
| Information motivates patient adherence (attitude) | 0.13 |
| Doctors have CER needed (opinion) | -0.07*** |
| CER will lead to more informed decisions (opinion) | 0.02 |
| CER will reduce medical costs (opinion) | 0.00 |
| CER will increase access to new treatments (opinion) | 0.01 |
| Health status | 0.05 |
| Educational attainment | 0.08 |
| Age | -0.00 |
| Gender | -0.06 |
| Step 2: Variables significant in step 1 (n = 594; R2 = 0.137) | |
| Doctors responsible for involving patients (attitude) | 0.38*** |
| Doctors have CER needed (opinion) | -0.06*** |
*
p < 0.05.
**
p < 0.01.
***
p < 0.001.
CER: Comparative effectiveness research.
All three behaviors are associated with patient perceptions, that is, some combination of self efficacy, attitudes and opinions.
•
‘Use of information on different treatment approaches' is associated with self efficacy, attitude that doctors are responsible for involving patients, attitude that information motivates patient adherence and belief that CER will lead to more informed decisions;
•
‘Use of research information to guide care decisions’ is associated with self efficacy, belief that CER will lead to more informed decisions and belief that CER will reduce medical costs;
•
‘Bringing evidence to medical appointments' is associated with attitude that doctors are responsible for involving patients.
Neither knowledge nor belief that CER will increase access to new treatments is associated with any of the three behaviors. These findings are not surprising, given that respondents had very low levels of CER-related awareness or knowledge, and therefore also likely did not have an informed belief regarding the impact of CER on access to new treatments.
Belief that doctors have the CER needed is associated with less frequent ‘use of research information to guide care decisions' and less frequent ‘bringing evidence to medical appointments’. That is, those who believe that doctors have the CER needed are less engaged, perhaps because they perceive evidence-based decision-making to be part of the physician's role rather than the patient's role.
For the most part, health status and demographics is not associated with any of the three behaviors; however, more educated respondents were more likely to ‘use research information to guide care decisions’, and older respondents were less likely to do so.
Results from the provider analysis
Tables 4 and 5 present the regression results for each of the two behaviors (dependent variables). For both behaviors, after eliminating variables not significant in the first step, all remaining variables were significant in the second step, so no further backward elimination was required. The regressions show strong associations for both ‘use of information on different treatment approaches' (R2 = 0.36) and ‘use of CER to guide care recommendations' (R2 = 0.29).
| Step 1: All variables (n = 578; R2 = 0.369) | |
| Awareness and knowledge (knowledge) | 0.09*** |
| Confidence can use CER findings (self efficacy) | 0.54*** |
| Doctors responsible for involving patients (attitude) | 0.15** |
| Information motivates patient adherence (attitude) | 0.03 |
| Doctors have CER needed (opinion) | 0.05* |
| CER will lead to more informed decisions (opinion) | 0.05* |
| CER will reduce medical costs (opinion) | 0.02 |
| CER will increase access to new treatments (opinion) | -0.01 |
| Age | -0.00 |
| Gender | 0.01 |
| Step 2: Variables significant in step 1 (n = 597; R2 = 0.357) | |
| Awareness and knowledge (knowledge) | 0.09*** |
| Confidence can use CER findings (self efficacy) | 0.53*** |
| Doctors responsible for involving patients (attitude) | 0.16*** |
| Doctors have CER needed (opinion) | 0.04* |
| CER will lead to more informed decisions (opinion) | 0.05** |
*
p < 0.05.
**
p < 0.01.
***
p < 0.001.
CER: Comparative effectiveness research.
| Step 1: All variables (n = 575; R2 = 0.297) | |
| Awareness and knowledge (knowledge) | 0.15*** |
| Confidence can use CER findings (self efficacy) | 0.37*** |
| Doctors responsible for involving patients (attitude) | 0.16** |
| Information motivates patient adherence (attitude) | 0.14* |
| Doctors have CER needed (opinion) | 0.02 |
| CER will lead to more informed decisions (opinion) | 0.02 |
| CER will reduce medical costs (opinion) | 0.01 |
| CER will increase access to new treatments (opinion) | 0.00 |
| Age | 0.00 |
| Gender | -0.07 |
| Step 2: Variables significant in step 1 (n = 590; R2 = 0.291) | |
| Awareness and knowledge (knowledge) | 0.15*** |
| Confidence can use CER findings (self efficacy) | 0.40*** |
| Doctors responsible for involving patients (attitude) | 0.16** |
| Information motivates patient adherence (attitude) | 0.16** |
†
p < 0.05.
‡
p < 0.01.
§
p < 0.001.
CER: Comparative effectiveness research.
Both behaviors are associated with knowledge. Both are also associated with provider perceptions, that is, some combination of self efficacy, attitudes and opinions.
•
‘Use of information on different treatment approaches' is associated with self efficacy, attitude that doctors are responsible for involving patients, belief that doctors have the CER needed and belief that CER will lead to more informed decisions;
•
‘Use of CER to guide care recommendations' is associated with self efficacy, attitude that doctors are responsible for involving patients and belief that information motivates patient adherence.
Neither belief that CER will reduce medical costs nor belief that CER will increase access to new treatments is associated with either behavior. In addition, neither age nor gender is associated with either behavior.
Discussion
For CER to achieve its purpose, providers and patients must use research evidence to make medical decisions. This study contributes to the body of knowledge around evidence-based decision-making because it improves our understanding of the characteristics or factors that are associated with using information from CER. This understanding can inform how policymakers approach both target groups to promote using information from CER. In addition, this understanding aligns with PCORI's focus on expanding access to evidence for decision-making and the Agency for Healthcare Research and Quality's focus on dissemination and implementation of evidence.
From our online surveys of patients and providers, we learned that there are both overlapping and unique factors for patients and providers associated with the use of information from CER. Perceptions, including self efficacy, attitudes and opinions, are associated with use of information from CER for both patients and providers. Patients’ belief that providers are responsible for collaborating with patients on their care is associated with an increased likelihood of the use of evidence-based decision-making among both patients and providers. The result may be a positive feedback loop – providers believe they ought to involve patients and then do so. Furthermore, once patients are collaborators in the treatment process with their providers, they may be more likely to remain active, requesting information on evidence-based treatment options and bringing evidence to medical appointments, which in turn may increase the provider's likelihood of continuing to engage patients and use information from CER to guide treatment.
Although knowledge of CER is associated with evidence-based decision-making for providers, it is not for patients. This is not surprising because most patients had low scores on the knowledge portion of the online survey and are mostly unaware of CER. This finding is consistent with existing research that shows that patients have low awareness of CER and understanding of the related concepts [2]. However, among patients with higher knowledge scores, knowledge may not be associated with CER use for other reasons described elsewhere in this paper, such as the belief that use of CER may limit their treatment options or that their providers’ opinions are of greater import than CER when they conflict.
The belief that doctors have the CER that they need to guide treatment decisions is associated with different behaviors in patients and providers. Providers with this belief are more likely to use information from CER to guide their treatment approaches. However, patients with this belief will less frequently use research information to guide their care decisions and will less frequently bring evidence to their appointments with providers. These patients may believe that their providers are sufficiently informed around CER and that they neither need nor want patient input. It is also possible that these patients may trust their providers’ judgment, assuming that, if relevant, their providers will enlist CER to guide their decision-making regarding treatment options.
As noted above, one key takeaway from the survey results is that patient perceptions are associated with evidence-based decision-making for both patients and providers. This finding suggests that by improving patient perceptions of evidence-based information and CER, both patients and providers may be more likely to use information from CER. Messaging that targets patients could emphasize the benefits of CER, evidence-based decision-making and patient engagement in care. Identifying the messages to shift perceptions, improve self efficacy and increase engagement among patients would be a helpful area for further study.
For providers, future efforts could focus on increasing awareness and knowledge, skills training to improve self efficacy and the benefits of engaging patients as partners in their treatment. Furthermore, given that patient perceptions are important drivers for provider behaviors, promoting patient engagement and belief in the utility of information from CER is important.
The survey data we collected are based on patient and provider self-report, and therefore have some limitations. Responses regarding perceptions, skills and behaviors may be inflated or underreported (note that we measured provider and patient knowledge using a brief quiz on CER, and therefore knowledge scores are not subject to the same limitation). The patient sample frame came from an opt-in panel sample for people with email addresses. Therefore another limitation is that this opt-in panel may be more engaged than the general population, and thus the results may not be generalizable. The cross-sectional design is a limitation, precluding prediction of behavior at one point in time from perspectives assessed at an earlier time. Response rates differed for providers and patients, with patients responding at a higher rate than providers, at 36 and 9%, respectively. The panel sample may have contributed to the higher response rate among patients because panelists may be inclined to participate in research. The low response rate for the provider survey is a limitation; however, it may not indicate bias, because research has found few differences among responding versus nonresponding physicians or their patients [9]. We took response rates into account with weighting and poststratified for age, race and gender, but a limitation is that we could not poststratify to reflect the age-race-gender distribution among people with the chronic conditions that we sampled. Finally, our use of the term CER for the provider survey is a limitation, given evolving understandings of the terms CER and PCOR [10].
Conclusion
For both patients and providers, evidence-based decision-making is associated with perceptions, that is, some combination of self efficacy, attitudes and opinions. However, whereas knowledge is the most consistent factor associated with evidence-based decision-making for providers, it is not associated at all for patients.
Among the three patient behaviors studied, associations were stronger for ‘use of information on different treatment approaches' and for ‘use of research information to guide care decisions' than for ‘bringing evidence to medical appointments'. Demographics (not amenable to intervention) and health status (generally requires intensive intervention) were weakly or inconsistently associated. Taken together, the results suggest that efforts to promote evidence-based decision-making among patients should focus on skills training to improve CER self efficacy and messages that highlight the benefits to the patient of engagement in treatment decisions to improve CER attitudes and opinions.
For providers, demographics (not amenable to intervention) and beliefs that CER will reduce medical costs or increase access to new treatments (potential benefits to healthcare more broadly rather than to point-of-care decisions) are not associated with either behavior. Taken together, the results suggest that efforts to promote evidence-based decision-making among providers should focus on education and skills training to improve CER knowledge and self efficacy, and messages that highlight the benefits of using CER and of engaging patients to improve CER attitudes and opinions.
•
For comparative effectiveness research (CER) to achieve its purpose, providers and patients must use research evidence to make medical decisions; therefore, this study examined factors associated with evidence-based decision-making by patients and providers.
•
Data were collected via online surveys of patients (n = 603) and providers (n = 628) fielded between November 2011 and January 2012.
•
Patients were adults who self-reported having one of four commonly-reported conditions – hypertension, Type II diabetes, high cholesterol or fibromyalgia.
•
Providers were physicians, nurse practitioners and physician assistants.
•
Data analysis was conducted using linear regression, separately for patients and providers; each evidence-based decision-making behavior item was regressed on the remaining survey items, using backward stepwise elimination.
•
For both patients and providers, evidence-based medical decision-making is associated with perceptions, that is, some combination of self efficacy, attitudes and opinions.
•
However, whereas knowledge is the most consistent factor associated with decision-making for providers, it is not at all for patients.
•
Efforts to promote evidence-based decision-making among patients should focus on skills training to improve CER self efficacy, and messages that highlight the benefits to the patient of engagement in treatment decisions to improve CER attitudes and opinions.
•
Efforts to promote evidence-based decision-making among providers should focus on education and skills training to improve CER knowledge and self efficacy, and messages that highlight the benefits of using CER and of engaging patients to improve CER attitudes and opinions.
Acknowledgments
The authors thank S Frost for her assistance preparing the analytic files, N Graves for her assistance identifying pertinent references, D Miller for conducting a code review, L Ringwood for conducting quality checks of reported results and L Hackleman-Good for editing this article.
Financial & competing interests disclosure
The data for the research reported in this article were collected by Mathematica Policy Research, as part of a broader project funded by a contract with the Office of Assistant Secretary for Planning and Evaluation of the U.S. Department of Health and Human Services. The analysis of the data and preparation of this article were conducted by Mathematica Policy Research, with no additional external support. The views expressed are those of the authors. The authors take full responsibility for the accuracy of material presented herein. The authors have no other relevant affiliations or financial involvement with any organization or entity with a financial interest in or financial conflict with the subject matter or materials discussed in the article.
No writing assistance was utilized in the production of this article.
Ethical conduct of research
The authors state that they have obtained appropriate institutional review board approval or have followed the principles outlined in the Declaration of Helsinki for all human or animal experimental investigations. In addition, for investigations involving human subjects, informed consent has been obtained from the participants involved.
References
Papers of special note have been highlighted as: • of interest; •• of considerable interest
1.
Forsythe L, Frank L, Workman T, Hilliard T, Harwell D, Fayish L. Patient, caregiver, and clinician views on engagement in comparative effectiveness research. J. Comp. Eff. Res. 6(3), 231–244 (2017).
2.
Cornwell D, Hu M, Esposito D. Public perceptions of comparative effectiveness research and use of evidence in health care decision-making. J. Comp. Eff. Res. 3(6), 623–634 (2014).
•• Describes qualitative research the authors conducted seeking to understand the general public's understanding, experience, skills, beliefs and attitudes around comparative effectiveness research (CER)/patient-centered outcomes research.
3.
Law E, Harrington R, Alexander GC, Saha S, Oehrlein E, Perfetto E. Increasing uptake of comparative effectiveness and patient-centered outcomes research among stakeholders: insights from conference discussion. J. Comp. Eff. Res. 7(2), 181–191 (2018).
• This report is a conference summary that brought together stakeholders, including clinicians, patients and payers, to identify ways to increase the use of CER/patient-centered outcomes research.
4.
Williams S, Esposito D, Rich E. Patients and clinicians as stakeholders in comparative effectiveness research: multiple perspectives and evolving roles. J. Comp. Eff. Res. 3(6), 573–575 (2014).0
•• Describes findings from focus groups, interviews and patient and clinician surveys around beliefs and attitudes regarding CER, describing challenges and recommendations for CER uptake among these stakeholder groups.
5.
Carman K, Maurer M, Yegian JM et al. Evidence that consumers are skeptical about evidence-based health care. Health Aff. 29(7), 1400–1406 (2010).
•• Reviews how consumer-friendly language might engage patients with evidence-based practices. The study identified multiple challenges emanating from patients’ attitudes and beliefs around CER.
6.
Gerber A, Patashnik E, Doherty D, Dowling C. A national survey reveals public skepticism about research-based treatment guidelines. Health Aff. 29(10), 1882–1884 (2010).
7.
Contreary K, Collins A, Rich E. Barriers to evidence-based decision-making at the point of care: a narrative literature review. J. Comp Eff. Res. 6(1), 51–63 (2017).
8.
Timbie J, Fox DS, Van Busum K, Schneider E. Five reasons that many comparative effectiveness studies fail to change patient care and clinical practice. Health Aff. 31(10), 2168–2175 (2012).
•• Uses existing research to identify five reasons why CER does not change patient care: financial incentives; study results that are not clear-cut; existing biases that prevent the uptake of new evidence; research that does not address patients’ needs or priorities; and patients and clinicians who do not adopt decision-making support tools.
9.
Ziegenfuss J, Shah N, Fan J et al. Patient characteristics of provider survey respondents: no evidence of nonresponse bias. Eval. Health. Prof. 35(4), 507–516 (2012).
10.
Rich E. Past as prologue: how comparative effectiveness research became patient-centered outcomes research. J. Comp. Eff. Res. 1(6), 475–477 (2012).
Information & Authors
Information
Published In
Pages: 709 - 719
PubMed: 31290682
Copyright
© 2019 Future Medicine Ltd.
History
Received: 31 December 2018
Accepted: 3 April 2019
Published online: 10 July 2019
Keywords:
Topics
Authors
Metrics & Citations
Metrics
Article Usage
Article usage data only available from February 2023. Historical article usage data, showing the number of article downloads, is available upon request.
Citations
How to Cite
Factors associated with evidence-based decision-making among patients and providers. (2019) Journal of Comparative Effectiveness Research. DOI: 10.2217/cer-2018-0152
Export citation
Select the citation format you wish to export for this article or chapter.
Citing Literature
- Mekiayla C. Singleton, Elissa Kozlov, M. Reul Friedman, Susan M. Enguidanos, Planning for the Future: Advance Care Planning Knowledge, Discussion and Decision-Making Among Older, Sexual Minority Adults, American Journal of Hospice and Palliative Medicine®, 10.1177/10499091241309670, 43, 1, (12-21), (2024).
- Pongsaton Silangirn, Sarinthorn Thummayot, Uratcha Sadjapong, Sakesun Thongtip, Association between Health Literacy and Self-care Behaviors with Traditional Thai Medicine during the COVID-19 Pandemic, The Open Public Health Journal, 10.2174/0118749445324196240626103826, 17, 1, (2024).
- Jaimie Meyer, Carolina Price, DeShana Tracey, Laurel Sharpless, Yue Song, Lynn Madden, Glyn Elwyn, Frederick Altice, Preference for and Efficacy of a PrEP Decision Aid for Women with Substance Use Disorders, Patient Preference and Adherence, 10.2147/PPA.S315543, Volume 15, (1913-1927), (2021).
- Yajing Gao, Yan Shan, Shuolin Wang, Xue Li, Tingting Jiang, Li Cai, Xinxin Jiang, Hong Wang, Decisional control preference among Chinese patients with advanced kidney disease: the role of mastery, perceived social support and self-efficacy, Psychology, Health & Medicine, 10.1080/13548506.2021.1952282, 27, 10, (2126-2137), (2021).