Efficiency of acute public hospitals in the region of Murcia, Spain
Publication: Journal of Comparative Effectiveness Research
Abstract
Aim: To evaluate the level of efficiency of public acute hospitals situated in the region of Murcia (Spain). Materials & methods: Data from nine acute general hospitals of Murcia’s Health Service (SMS by its Spanish acronym) were analyzed over the 2012–2014 period. The data were extracted from the In-patient Health Establishment Statistics of the Ministry of Health, Social Services and Equality, from the National Health Service (SNS) portal and the SMS portal. To this end, the data envelopment analysis (DEA)-window method was used, since this extension of the basic DEA model allows to compare the efficiency of a small number of units over different years and analyze changes in efficiency over time. In addition, the model was complemented by smooth bootstrapping and a superefficiency analysis to improve the quality of the data interpretation. Four inputs were used (number of beds, number of operating rooms, personnel costs and operating costs), two undesirable outputs (average stay and rate of return) and three desirable outputs (weighted discharges, emergencies and surgical interventions). Results: The average level of inefficiency was 1.58% over the study period, with a good evolution between 2012 (3.53%) and 2014 (0.20%). This improvement was also reflected in the number of efficient hospitals that rose from two in 2012 to eight in 2014. Moreover, the slack levels detected were small. Conclusion: The management of the public hospitals analyzed was favorable, both regarding average level of efficiency and the number of hospitals qualified as efficient. However, the analysis revealed several ways to increase efficiency by reducing specific inputs and nondesirable outputs (mainly operating and personnel costs as well as average length of stay) while increasing desirable outputs (mostly the number of surgical interventions). To finish, specific policy measures are suggested to improve the performance of these hospitals.
The number of studies on the efficiency of the healthcare sector has been on the rise in specialized literature. There are a number of reasons for this flourishing interest. On the one hand, attempts are being made to address the sector’s sustainability challenge, in reaction to the pressures of an increasingly aging population with a higher incidence of chronic diseases. On the other hand, rising costs associated with technological innovation inherent to the sector have led to studies and management initiatives aimed at optimizing the use of the financial resources available [1]. In fact, in the specific case of Spain, the national health system’s total expenditure amounts to 100,000 million euros a year, that is, 9.3% of GDP (gross domestic product). Public health expenditure was 71,000 million euros of that total (6.6% GDP). The major item is hospital and specialized services, representing 62.4% of total expenditure and showing the highest growth rates over the 2012–2016 period [2]. Given that public resource management is a pillar of the welfare state, these data justify the growing interest in optimizing the management efficiency of Spanish public hospitals. In Spain, according to the principle of decentralization included in the Constitution, health competence is transferred to the Autonomous Communities (independent regions), while the central government is responsible for coordination tasks. Each Autonomous Community has a Health Service, that is, an administrative and management structure that integrates all the centers, services and entities within the community itself. Hence, the importance of analyzing hospital efficiency across the different Spanish Autonomous Communities. In this way, some studies have evaluated the efficiency of public hospitals in certain Autonomous Communities, such as Catalonia, the Valencian Community, Madrid and Andalusia. There are other regions, however, whose public hospital efficiency has not been analyzed, as is the case of the Autonomous Community of the Region of Murcia. The purpose of this work is to address this gap and evaluate the efficiency of the hospitals of Murcia’s Health Service (hereon SMS by its Spanish acronym). The data that underlie this regional analysis reveal the large volume of public resources allocated to finance the activity of public hospitals in this region. In 2016, the total expenditure of public hospitals in the Region of Murcia amounted to 1358.89 million euros (4.7% of regional GDP), with an expenditure per capita of 925.21 euros. It is also worth noting that more than 98% of hospital activity is publicly funded in these public hospitals [3]. Based on all the above, the present study aims at analyzing SMS’s efficiency when addressing the problem of rising costs and, at the same time, highlighting any courses of action that could improve the public hospital’s performance in the region and guide its health policy.
To conduct the analysis, though several possible methods exist, the most commonly used (as detailed in the literature review) is data envelopment analysis (DEA). This method is ideally adapted to the sector’s specific conditions. Some specific features make DEA a particularly appropriate technique for the objective of the study, notably: the nonexistence of prices for services rendered in the public sector (or even that of some resources); not having to know or define ad hoc a production function that relates resources with generated products; or the generation of multiple outputs from several inputs.
This article is structured as follows: first, the literature is reviewed; the variables used are then described and justified; next, the method used to analyze the data is detailed, the results are obtained and discussed and, finally, conclusions are drawn.
Literature review
The analysis of healthcare sector efficiency has attracted growing interest in recent decades. However, analyzing the efficiency of health organizations generally and that of hospitals in particular, is not an easy task due to the large number of inputs and outputs involved. Although efficiency in the healthcare sector has been analyzed with both parametric and nonparametric techniques [4], the prevailing methodology used to perform analyses has been DEA, a nonparametric and deterministic technique, initially proposed by Charnes et al. [5] to measure the relative efficiency of homogeneous decision-making units (DMUs). However, due to the complexity of healthcare processes, the traditional DEA has been combined with different statistical methods and techniques to provide better efficiency assessment of the healthcare system [6].
Ever since the appearance of the first studies to evaluate the efficiency of a hospital service [7] and a group of teaching hospitals [8], extensive literature on healthcare efficiency has built-up [9–13]. Although hospitals have been the major subject under study in this field [14,15], the efficiency of other organizations in the sector, such as primary care centers, has also been evaluated [16–19]. In hospital settings, some studies examine the efficiency of one or more hospital services, on the basis that individual hospital service assessments offer more accurate information than that of overall hospital efficiency [7,20–23]. However, it is worth noting studies on the overall efficiency of hospitals and the latter constitutes the subject of this research. A review of these works can be found in the Supplementary Table 1.
Although most of the literature analyzes the efficiency of healthcare organizations in a given country, there has been growing interest in cross-country comparisons of different national healthcare system efficiencies [24–30]. In the area of hospitals, some studies compare the efficiency of hospitals between several countries (between France and the USA [31], Germany and Switzerland [32], Norway and Finland [33], among the four Nordic countries [34–36], among 31 OECD countries [37], among four European countries – United Kingdom, Portugal, Spain and Slovenia – [38] and between Italy and Germany [39]). Other studies have also compared hospital efficiency at the regional level [40–42], provincial level [43,44] and at the district level [45].
Moreover, specialized literature has compared efficiency across hospital types. Some studies have examined the relationship between ownership and efficiency, comparing the efficiency of public, private nonprofit and private for-profit hospitals [9,10,46–50], or differentiating groups of hospitals reflecting ownership as well as complexity [51]. Other studies evaluate how reforms, changes in management or hospital policy affect efficiency [44,52,53]. In this context, several studies have analyzed the relationship between health information technology applications use and efficiency [54–56].
In the specific case of Spain, following several pioneering works [57–59], the most recent analyses of hospital efficiency focus on hospitals within an autonomous community (Catalonia [60,61], Valencian Community [23], Madrid [48], Andalusia [62]) or compare the 17 autonomous communities, either based on hospital data [40], or on data from regional healthcare systems [63,64]. The present study evaluates the efficiency of hospitals in a region whose hospital efficiency has never been analyzed, the Region of Murcia.
To evaluate the efficiency of hospitals, selecting appropriate variables are crucial to achieve a meaningful analysis. Based on a review of the variables used in studies on hospital efficiency [14,15], the main categories of inputs regarding hospital efficiency are as follows: physical capital, labor and goods and services expenditure [13].
As a proxy for physical capital, the most frequently used variable is the number of beds, which also serves as a proxy for hospital size. This latter variable was present in all the reviewed works (Supplementary Table 1), except for some studies that used operating cost [33,34,36] and other variables in monetary terms [65,66] as the only inputs. Although the total number of beds is usually used, some studies consider occupied beds [31], beds for inpatients [16,67], beds setup and staffed [54], licensed beds [55] or differentiate between bassinets, acute beds and other beds [68]. Equipment such as operating rooms, x-ray rooms, computed tomography (CT) devices, magnetic resonance devices or a number of devices have also been used as a proxy for physical capital [40,41,67]. In fact, capital assets have been reflected in an index based on the number and types of services offered in a hospital (burn care, airborne infection isolation room, pediatric intensive care unit, gamma knife and CT scanner, among others) [52,54].
Regarding the labor proxy, it is recommended to distinguish between different types of personnel [15]. Differentiations between health personnel – physicians, nurses and other health personnel – and nonhealth personnel were commonly found in the literature. While amount of medical staff, physicians and nurses were the most commonly used categories in the literature (Supplementary Table 1), other health personnel were less frequent [43,44,51,57,69,70], and in some cases was included in nonhealth personnel [31]. However, the latter was also used as an independent input [57,60,61,69], in some cases restricted to administrative personnel [32,67]. Moreover, some studies included the total human resources input, in some cases in addition to doctors and nurses [37,38,40] and in other cases as the only working proxy [62,71]. Regarding the measure, it was usual to express staff as equivalent to full-time (Supplementary Table 1). In other cases, labor was estimated based on human resources expenditure [40,65,66].
Regarding the third input category, one or more variables related to operating costs or purchases [32–34,36,40,42,43,49,50,52,54,57,60,62,66,69,70,72,73] are often included along with physical capital and labor proxies.
Other variables, infrequently used in the literature as input, include: technology inputs [56] and building area [53], the latter being used to measure the complexity and size of hospitals. Furthermore, undesirable inputs are rarely used, though inpatient discharge rate [45] has been used as such.
As far as outputs were concerned, the ultimate goal of health organizations is to improve healthcare based on the human, material and physical capital resources they dispose of. However, given the difficulties in quantifying improvements to health, intermediate outputs were usually used to make approximate estimations of final output, the most recommended and used being related to inpatients and outpatients [13]. In terms of inpatients, the use of admissions, stays based on the number of days in the hospital or hospitalized patients per day and hospital discharges were very frequent in the literature. Concerning outpatients, outpatient visits were worthy of note. All the variables above were included in a large part of the reviewed works (Supplementary Table 1). Other variables used for output in the literature consisted in: emergencies [40,42,49,55,57,62,74] and surgeries [23,31,40,42,44,49,59,67–69,73], differentiating in some cases between inpatient surgeries and outpatient surgeries [31,55]. The number of treated cases [32,74], first consultations [23,62], births [68], emergency beds [53], bed occupancy rate [41,75], number of medical appointments [42,76], satisfaction index [50] and medical and health service income [75] were less frequently used. Some authors disaggregated the variables mentioned above by medical specialty [32,57,59]. Usually, outputs were case-mix adjusted to control for differences between hospitals using hospital’s average weights [23,32–34,38,39,42,48,51,55,60,62,70,72].
Beyond desirable outputs, some works incorporated undesirable outputs, on the basis that including only desirable outputs did not allow to correctly reflect the technical efficiency of DMUs, the most representative being mortality rate [37,43–45,48,56,69] and readmission rate [48,56,66,72]. The prevalence of nosocomial infections [61,68], total wait in days, wait in emergency room and patients referred to higher levels [66] were also used as undesirable output.
The studies frequently include context variables to analyze how these variables influence hospital efficiency levels [45,68,73,75–77].
It is worth noting that the selection of inputs and outputs needs to be conditioned by the sample size of each study [78].
Methods
As shown in the literature review above, DEA is the prevailing methodology of hospital efficiency analysis. The technique is based on obtaining an efficiency frontier using a set of observations, based on the resolution of a linear optimization program that enables to obtain the maximum level of relative efficiency of each of the units or DMUs under analysis. A key advantage is that of being a nonparametric technique that conveniently dispenses from having to define the form of the production function arbitrarily. Furthermore, it can also evaluate activities in which several inputs are used and produce multiple outputs simultaneously, without having to necessarily know their market prices [79], making it suitable to evaluate public entity efficiency. The method, however, has its downsides. Its deterministic nature, the need for homogeneity among the DMUs, the results’ sensitivity to sample variations or the necessary size ratio between the total number of variables to be used and the number of units to analyze can all be regarded as setbacks [78]. Nevertheless, its drawbacks can be neutralized in many instances (e.g., by adequately selecting the units to be compared with achieve homogeneity or including a sufficiently large number of DMUs in the analysis to ensure results are suitably ranked).
As far as output orientation is concerned, a unit is considered efficient if it can obtain the maximum quantity of product from a given amount of inputs [80]. Based on the characteristics of the DMUs analyzed in this paper (explained in the section below), efficiency results can be obtained using the following linear program oriented to output and with constant returns to scale [79]:
(Eq. 1)
where φ0 is the parameter that measures the efficiency of the analyzed unit (with subscript 0), n would be the total number of DMUs with j: 1, ..., n; Yrj represents the r-th output of the j-th DMU; r:1,…,R, j:1,…,n, Xij symbolizes the i-th output of the j-th DMU; i:1,…,I, j:1,…,n, λj are the weights of each DMU belonging to the comparison group of the analyzed unit; Si− y Sr+ are the respective input and output slack variables and ϵ is a small positive real number (usually 10-6 in empirical formula) [81].
Given that DEA provides the same efficiency result for efficient units, Andersen and Petersen’s superefficiency model was used to rank them [82]. The technique consists in eliminating the unit that is analyzed from the comparison set. The program can thus no longer offer that unit as a solution and is forced to provide a solution based on the rest. When unable to find a DMU (or a linear combination of several DMUs) among the rest providing the same or higher level of output than the analyzed DMU, the output-oriented model provides an efficiency value that is lower than the unit so as to adapt to restrictions (for the units that are not efficient, exactly the same level of inefficiency will be obtained). In this way, the program would be identical to (Equation 1) but without including the inputs or outputs of DMU0 on the left of the first two restrictions.
However, two drawbacks related to the DEA method can lead to difficulties. First, nonparametric DEA estimators come from finite samples, they are therefore sensitive to value variations [83]. Second, the deterministic nature of the model and, therefore, the noninclusion of any type of randomness in the process means no indicator of any kind is given regarding the statistical significance of the efficiency estimates [84]. Bootstrapping, however, is a statistical procedure that eliminates both types of problems. It was introduced by Efron [85] and is based on the simulation of the data-generating process (DGP) to obtain estimates for newly simulated samples, which would follow the same distribution as the estimator obtained from the real population [83]. This way it is possible to obtain confidence intervals for the estimated efficiency parameters that allow knowing whether they are statistically significant [86].
In this work, we used smoothed bootstrapping [83], a specific type of bootstrap that provides better estimates by incorporating the reflection method [87]. This avoids problems generated by the existence of value limits proper to efficiency estimates (e.g., with output orientation, a level below that of the unit), while providing better data-generating process simulations than others based on direct sampling using the original data (naive bootstrap). In such cases, the natural domain of the density function to be estimated could not be the whole real line, since the efficiency values on which the estimate would be based would be inferiorly bounded by the unit. This could generate the problem of producing estimates of density functions whose integral from -∞ to +∞ would not be equal to one [87]. The reflection method solves the situation by increasing the number of data by adding the reflections of all points (φj) to the original set. That is, for each φj ≥ 1, it calculates its symmetric 2 − φj ≤ 1, j:1,...,n thus obtaining a set of size 2n with which it is possible to estimate the desired density function. Thus, if the kernel density estimate obtained with the set of 2n points ĝh(z) is:
(Eq. 2)
where ϕ(·) is the standard normal density function and h the bandwidth parameter, the consistent estimator of would be:
(Eq. 3)
The algorithm implemented for smoothed bootstrapping includes the following steps [83]:
(a)
Obtain the efficiency results of each DMU using the DEA model (1): , j:1,...,n
(b)
Generate a random sample of size using kernel estimation and the reflection method, with being the efficiency of unit j generated by the smoothed bootstrap.
(c)
Obtain a new dataset (Xj, Y* jb) where for j:1,…,n with Y* jb being the new output vector of unit j and Xj its original vector of inputs.
d)
Calculate the estimate for solving the following linear program for unit 0:
(Eq. 4)
where Y* jb is the output vector of step c.
(e)
Repeat steps b–d, B times to obtain a set of estimates, , b:1,...,B for o: 1, .., n. With B = 1000 an estimate of the appropriate confidence intervals is ensured [88].
In addition, to obtain a sufficient amount of DMUs for the analysis, the DEA-window method was used, based on considering each hospital as a different unit depending on the moment in time the information was obtained from the data. In this way, a hospital’s efficiency in a specific year is assessed based on its own performance and that of other hospitals’ in other years. A window of time had to be selected for this type of analysis and, given the sample’s limitations, the only possible window was 3 years (any other smaller window would fail to provide the necessary number of DMUs and 3 years was the widest window permitted by the original DMU sample) [79].
Finally, in order to identify any context variables having an influence on the detected efficiency levels, the Kruskal–Wallis test was implemented. The nonparametric nature of the test coincides with DEA in this respect. To this end, the hospitals were classified into distinct categories according to different context factors that could affect their performance. Assuming homoscedasticity and normality, it was possible to test the following hypotheses:
H0:
The samples were derived from the same population.
H1:
Some samples were derived from different populations.
If the p-value was under or equal to 0.05, the null hypothesis (H0) could be rejected. Consequently, that result would point to the existence of a relationship between efficiency levels and different hospital groups.
Data & variables
The variable selection process represents a major methodological problem when intending to estimate any DMU productive behavior using DEA models [11,89]. For this reason, added to the lack of parametric tests allowing to compare their significance, it was necessary to select and justify them adequately. In this sense, the selection criteria were based on their previous usage in related scientific literature, their statistical availability and their relevance according to experts in the field [90,91]. In short, the selection process was conducted while continually ensuring that the chosen variables involved all the relevant inputs and outputs for the sector under study [4,92].
According to the literature, the main categories of inputs in hospital efficiency are: physical capital, labor and goods and services expenditure. In this study, the number of beds and the number of operating rooms were used as a proxy for hospital fixed capital. The labor factor was approximated based on human resource costs (Chapter I costs). The goods and services costs were approximated based on hospital-operating costs (Chapter II costs). These two latter expenditure variables were expressed in constant 2011 prices, based on the deflator of the Autonomous Community of the Region of Murcia.
Regarding undesirable outputs, length of average stay and the rate of hospital readmissions were taken into account, since any higher value would imply less efficient management of that DMU (hospital). These undesirable outputs would be treated as inputs so they be included in the subsequent DEA analysis [93,94]. Finally, we incorporated the discharges weighted by the case-mix index, the number of emergencies and the number of surgical interventions as desirable outputs.
All data refer to the 2012–2014 period and were extracted from the information published by the Spanish Ministry of Health, Social Services and Equality (Statistics of Health Establishments with Boarding Facilities), the catalog of hospitals published in Spain’s National Health Service’s statistics portal (www.msssi.gob.es/estadisticas), and the Minimum Basic Data Set (CMBD by its Spanish acronym) of Murcia’s Health Service portal (www.murciasalud.es). Table 1 shows the main descriptive statistics of the variables used in this work.
| 2012 | 2013 | 2014 | |||||
|---|---|---|---|---|---|---|---|
| Average | Standard deviation | Average | Standard deviation | Average | Standard deviation | ||
| Inputs | – Beds | 336.44 | 262.34 | 336.11 | 260.87 | 336.11 | 265.59 |
| – Operating rooms | 11.78 | 9.36 | 11.78 | 9.36 | 12.00 | 9.79 | |
| – Personnel costs | 74,202,168.00 | 62,690,640.00 | 67,144,267.00 | 56,153,566.00 | 67,854,431.00 | 56,816,447.00 | |
| – Operating costs | 52,715,547.00 | 50,474,510.00 | 46,312,270.00 | 44,969,720.00 | 46,237,246.00 | 45,899,187.00 | |
| Undesirable outputs | – Average stay | 6.32 | 0.90 | 6.34 | 1.00 | 6.34 | 0.96 |
| – Rate of return | 4.48 | 0.50 | 4.47 | 0.56 | 4.60 | 0.57 | |
| Desirable outputs | – Weighted discharges | 12,731.73 | 12,015.98 | 13,016.72 | 12,330.00 | 13,109.48 | 12,284.55 |
| – Emergencies | 82,669.78 | 56,657.76 | 84,317.89 | 56,881.79 | 86,864.22 | 58,700.54 | |
| – Surgical interventions | 9376.33 | 6805.27 | 9980.33 | 7223.02 | 9976.78 | 7148.41 | |
| Environmental variables | – Size | 1.78 | 0.83 | 1.78 | 0.83 | 1.78 | 0.83 |
| – Age | 2.56 | 1.13 | 2.56 | 1.13 | 2.56 | 1.13 | |
Size: value based on the number of beds. 1: <250, 2: from 250 to 500, 3: >500. Age: 1: <5, 2: from 5 to 10, 3: from 11 to 25, 4: >25 years. The coding of the environmental variables took into account both the similar distribution across the different categories of the sample cases and the levels usually used in the Murcia’s Health Service (SMS by its Spanish acronym).
Given there was a total of nine variables (four inputs, two undesirable outputs and three desirable outputs) and 27 DMUs, the criteria of Cooper et al. [78] were met, that is: number of DMUs ≥ max (inputs × outputs, 3 × [inputs + outputs]). In the present case, 27 ≥ max (20, 27).
In addition to information on inputs, desirable and undesirable outputs, it was also possible to obtain data on environmental variables that could potentially affect each hospital’s level of efficiency, hospital size and age in particular. These data are also listed in Table 1.
Results
The results were obtained using the R program version 2.12.2 with the package FEAR 1.15, as well as with version 3.5.1 of the R program together with the packages Benchmarking 0.27, lpSolveAPI 5.5.2.0-17 and ucminf 1.1-4.
First, we proceeded to calculate efficiency results. To ensure that there was a sufficient number of DMUs based on the number of variables used in the analysis, the DEA-window method was implemented whereby each unit was considered a different unit at each moment in time. In addition, as the number of DMUs considered this way coincided exactly with the recommended limit for the analysis (DMUs ≥ max [inputs × outputs, 3 × (inputs + outputs)] = 27), the appropriate window size was considered to be precisely the number of periods for which the necessary information was available, in other words, 3 years.
In any case, before proceeding to the obtention of results, the bootstrap-based scale detection test was used [95], resulting in the value - Cα = 0.0290399, indicating the existence of constant returns to scale. The subsequent study was thus entirely based on this fact.
Table 2 shows the results of the efficiency ratios (ER) for each DMU. We can observe that 16 among the 27 DMUs (59%) were efficient because their efficiency parameters obtained a value of one. In addition, the average efficiency value was 1.0158, that is, an average inefficiency of 1.58%, ranging from 1.1001 of DMU1 to 1.0699 of DMU8.
| DMU | ER |
|---|---|
| DMU 1 | 1.1001 |
| DMU 2 | 1.0293 |
| DMU 3 | 1.0347 |
| DMU 4 | 1.0016 |
| DMU 5 | 1.0228 |
| DMU 6 | 1.0000 |
| DMU 7 | 1.0000 |
| DMU 8 | 1.0699 |
| DMU 9 | 1.0594 |
| DMU 10 | 1.0469 |
| DMU 11 | 1.0268 |
| DMU 12 | 1.0167 |
| DMU 13 | 1.0000 |
| DMU 14 | 1.0000 |
| DMU 15 | 1.0000 |
| DMU 16 | 1.0000 |
| DMU 17 | 1.0000 |
| DMU 18 | 1.0000 |
| DMU 19 | 1.0000 |
| DMU 20 | 1.0000 |
| DMU 21 | 1.0000 |
| DMU 22 | 1.0000 |
| DMU 23 | 1.0000 |
| DMU 24 | 1.0000 |
| DMU 25 | 1.0000 |
| DMU 26 | 1.0184 |
| DMU 27 | 1.0000 |
| Average efficiency | 1.0158 |
DMU: Decision-making unit; ER: Efficiency ratio.
For its part, Table 3 shows the values of the slack variables for both inputs and outputs.
| SBE | SOP | SC1 | SC2 | SAS | SRE | SDI | SEM | SIN | |
|---|---|---|---|---|---|---|---|---|---|
| DMU 1 | 0.00 | 0.00 | 1,488,111.00 | 1,442,205.00 | 0.31 | 0.37 | 0.00 | 0.00 | 0.00 |
| DMU 2 | 0.00 | 0.42 | 4,833,525.00 | 2,707,123.00 | 0.03 | 0.50 | 69.25 | 0.00 | 0.00 |
| DMU 3 | 0.00 | 0.00 | 1,647,694.00 | 6,263,157.50 | 0.24 | 0.30 | 49.06 | 0.00 | 546.39 |
| DMU 4 | 0.00 | 0.00 | 4,206,659.00 | 7,358,782.60 | 0.65 | 0.00 | 115.35 | 0.00 | 903.23 |
| DMU 5 | 0.00 | 0.00 | 4,384,062.00 | 3,423,201.20 | 0.00 | 0.00 | 328.42 | 0.00 | 920.39 |
| DMU 6 | 0.00 | 0.00 | 0.00 | 0.00 | 0.00 | 0.00 | 0.00 | 0.00 | 0.00 |
| DMU 7 | 0.00 | 0.00 | 0.00 | 0.00 | 0.00 | 0.00 | 0.00 | 0.00 | 0.00 |
| DMU 8 | 0.00 | 0.00 | 0.00 | 1,596,172.10 | 0.29 | 0.00 | 89.66 | 965.10 | 0.00 |
| DMU 9 | 0.00 | 0.29 | 11,437,302.00 | 4,904,643.50 | 0.05 | 0.00 | 0.00 | 0.00 | 75.36 |
| DMU 10 | 0.14 | 0.00 | 0.00 | 0.00 | 0.53 | 0.05 | 0.00 | 414.67 | 235.43 |
| DMU 11 | 1.51 | 0.65 | 0.00 | 349,217.40 | 0.19 | 0.00 | 0.00 | 0.00 | 0.00 |
| DMU 12 | 1.66 | 0.06 | 0.00 | 1,704,923.50 | 0.05 | 0.15 | 23.90 | 0.00 | 172.32 |
| DMU 13 | 0.00 | 0.00 | 0.00 | 0.00 | 0.00 | 0.00 | 0.00 | 0.00 | 0.00 |
| DMU 14 | 0.00 | 0.00 | 0.00 | 0.00 | 0.00 | 0.00 | 0.00 | 0.00 | 0.00 |
| DMU 15 | 0.00 | 0.00 | 0.00 | 0.00 | 0.00 | 0.00 | 0.00 | 0.00 | 0.00 |
| DMU 16 | 0.00 | 0.00 | 0.00 | 0.00 | 0.00 | 0.00 | 0.00 | 0.00 | 0.00 |
| DMU 17 | 0.00 | 0.00 | 0.00 | 0.00 | 0.00 | 0.00 | 0.00 | 0.00 | 0.00 |
| DMU 18 | 0.00 | 0.00 | 0.00 | 0.00 | 0.00 | 0.00 | 0.00 | 0.00 | 0.00 |
| DMU 19 | 0.00 | 0.00 | 0.00 | 0.00 | 0.00 | 0.00 | 0.00 | 0.00 | 0.00 |
| DMU 20 | 0.00 | 0.00 | 0.00 | 0.00 | 0.00 | 0.00 | 0.00 | 0.00 | 0.00 |
| DMU 21 | 0.00 | 0.00 | 0.00 | 0.00 | 0.00 | 0.00 | 0.00 | 0.00 | 0.00 |
| DMU 22 | 0.00 | 0.00 | 0.00 | 0.00 | 0.00 | 0.00 | 0.00 | 0.00 | 0.00 |
| DMU 23 | 0.00 | 0.00 | 0.00 | 0.00 | 0.00 | 0.00 | 0.00 | 0.00 | 0.00 |
| DMU 24 | 0.00 | 0.00 | 0.00 | 0.00 | 0.00 | 0.00 | 0.00 | 0.00 | 0.00 |
| DMU 25 | 0.00 | 0.00 | 0.00 | 0.00 | 0.00 | 0.00 | 0.00 | 0.00 | 0.00 |
| DMU 26 | 1.67 | 0.00 | 0.00 | 0.00 | 0.42 | 0.15 | 0.00 | 0.00 | 0.00 |
| DMU 27 | 0.00 | 0.00 | 0.00 | 0.00 | 0.00 | 0.00 | 0.00 | 0.00 | 0.00 |
SBE, SOP, SC1, SC2, SAS, SRE, SDI, SEM, SIN are the slack variables for beds, operating rooms, personnel costs, operating costs, average stay, readmissions, weighted discharges, emergencies and surgical interventions.
DMU: Decision-making unit.
These results offer the necessary variation of each variable to correct the detected inefficiencies (in addition to the relevant corrections indicated by inefficiency levels – see Table 2). In this way, they represent the total changes of inputs and undesirable outputs as well as the additional variations of desirable outputs necessary for inefficient DMUs to cease to be inefficient. Thus, globally (adding values from each column in Table 3), the total additional increase for each desirable output was: 675.64 for discharges, 1379.78 for emergencies and 2853.13 for interventions. Regarding the inputs, the reductions were: 4.99 for beds, 1.43 operating rooms, 27,997,353.00 for personnel costs, 29,749,425.80 for operating costs and, finally, the reductions for undesirable outputs: 2.75 for average stay and 1.52 for the readmission rate. In relative terms, that is, in relation to the average values of the whole period under study, the percentage variations for the outputs were: 2.27% for discharges, 1.63% for emergencies and 29.18% for interventions. In the same way, for the inputs: 0.48, 12.06, 40.15 and 61.44% for beds, operating rooms, personnel costs and operating costs, respectively. Finally, for undesirable outputs: 43.42% for the average stay and 6.20% for the rate of return.
Ordering each hospital’s efficiency results for each year under study enables to clearly illustrate each hospital’s efficiency value obtained over the different periods (Table 4).
| Hospital | DMU | 2012 | 2013 | 2014 |
|---|---|---|---|---|
| Hospital 1 | DMU1, DMU10, DMU19 | 1.1001 | 1.0469 | 1.0000 |
| Hospital 2 | DMU2, DMU11, DMU20 | 1.0293 | 1.0268 | 1.0000 |
| Hospital 3 | DMU3, DMU12, DMU21 | 1.0347 | 1.0167 | 1.0000 |
| Hospital 4 | DMU4, DMU13, DMU22 | 1.0016 | 1.0000 | 1.0000 |
| Hospital 5 | DMU5, DMU14, DMU23 | 1.0228 | 1.0000 | 1.0000 |
| Hospital 6 | DMU6, DMU15, DMU24 | 1.0000 | 1.0000 | 1.0000 |
| Hospital 7 | DMU7, DMU16, DMU25 | 1.0000 | 1.0000 | 1.0000 |
| Hospital 8 | DMU8, DMU17, DMU26 | 1.0699 | 1.0000 | 1.0184 |
| Hospital 9 | DMU9, DMU18, DMU27 | 1.0594 | 1.0000 | 1.0000 |
| Average technical efficiency per year | 1.0353 | 1.0100 | 1.0020 | |
| Minimum efficiency | 1.1001 | 1.0469 | 1.0184 | |
| Number of efficient hospitals | 2 | 6 | 8 | |
| % of efficient hospitals | 22.22% | 66.67% | 88.89% | |
DMU: Decision-making unit.
The first noticeable point is the favorable evolution of hospitals’ average efficiency over time, dropping from a value of 1.0353 to a lower (less inefficient) value of 1.0020. Furthermore, two hospitals (6 and 7) were always classified as efficient, and hospitals during the last period also had high efficiency levels. Moreover, no hospital was inefficient over all periods. Two stood out for their evolution over time (1 and 9): their initial data showed high levels of inefficiency, but significant improvements were found in the data in the last period. All in all, the data supported both a positive evolution of efficiency levels during the period analyzed, as well as low levels of inefficiency throughout the period.
The results presented in Table 4 are in fact unsurprising given the evolution of the average values of the inputs, outputs and undesirable outputs collected in Table 1. Specifically, the average variation rate of the set of inputs over the whole period under study was -2.38%, of 0.75% for the undesirable outputs and 2.41% for the desired outputs. In this sense, given the evolution of the amounts of inputs used and outputs generated, improvements in average efficiency levels reflected in Table 4 are consistent. If we breakdown the changes over the whole period into two subperiods, results are also similar. Thus, from 2012 to 2013, the average variation of the total inputs was -5.44% and amounted to 0.05% for the undesirable outputs and 3.56% for the desirable outputs. All these imply a drop in the inefficiency level of 2.43 percentage points. In the following period (2013–2014), a similar evolution could be observed though the inefficiency drop was not as pronounced (0.8%). In the latter case, the undesirable inputs and outputs grew slightly (by 0.69 and 1.45%, respectively), partly compensating the increase of the series of outputs (by 1.23%).
Once the efficiency levels for each DMU were obtained, it was possible to find out whether these values had some kind of relation to each hospital’s specific context variables (age and size). For this, the Kruskal–Wallis test was applied to each year in the period under study: 2012, 2013 and 2014. The R 3.5.1 programme was used to implement the test. As a result, the p-values for each year and for both context variables (age and size) were found to all be greater than 0.05 (age: 0.59, 0.13, 0.57 and size: 0.41, 0.09 and 0.54, for each year, respectively). Consequently, no significant relationship (95%) was found between levels of efficiency, size and age of hospitals.
To increase the results’ ranking power, superefficiency levels were also calculated [82]. Results obtained are shown in Table 5.
| Hospital | 2012 | 2013 | 2014 |
|---|---|---|---|
| Hospital 1 | 0.8798 | ||
| Hospital 2 | 0.9086 | ||
| Hospital 3 | 0.8916 | ||
| Hospital 4 | 0.9452 | 0.9424 | |
| Hospital 5 | 0.9842 | 0.9814 | |
| Hospital 6 | 0.9498 | 0.9323 | 0.9934 |
| Hospital 7 | 0.9355 | 0.9433 | 0.9818 |
| Hospital 8 | 0.9093 | ||
| Hospital 9 | 0.9394 | 0.9266 |
Values below the unit reveal levels of superefficiency: the higher the efficiency, the further away they were. When ranking efficiency levels, it was observed that Hospital 1 in 2014 presented the best performance over the whole triennium (0.8798), followed by Hospital 3, also in 2014, with (0.8916).
Following these superefficiency calculations, we proceeded to compute the results with bootstrapping to obtain an indicator of the statistical significance of the efficiency estimates. A second objective was to circumvent the problem of DEA result sensitivity to sample variations. The method’s results are shown in Table 6.
| DMU | Bias | Lower (95%) | Upper (95%) | ||
|---|---|---|---|---|---|
| DMU 1 | 1.1002 | 1.1122 | -0.0120 | 1.1011 | 1.1414 |
| DMU 2 | 1.0293 | 1.0401 | -0.0108 | 1.0297 | 1.0685 |
| DMU 3 | 1.0347 | 1.0444 | -0.0097 | 1.0350 | 1.0650 |
| DMU 4 | 1.0016 | 1.0108 | -0.0092 | 1.0021 | 1.0299 |
| DMU 5 | 1.0228 | 1.0329 | -0.0101 | 1.0233 | 1.0538 |
| DMU 6 | 1.0000 | 1.0195 | -0.0195 | 1.0006 | 1.0644 |
| DMU 7 | 1.0000 | 1.0205 | -0.0205 | 1.0006 | 1.0722 |
| DMU 8 | 1.0700 | 1.0811 | -0.0111 | 1.0706 | 1.1044 |
| DMU 9 | 1.0595 | 1.0704 | -0.0109 | 1.0603 | 1.0973 |
| DMU 10 | 1.0469 | 1.0583 | -0.0114 | 1.0474 | 1.0842 |
| DMU 11 | 1.0268 | 1.0377 | -0.0109 | 1.0275 | 1.0634 |
| DMU 12 | 1.0168 | 1.0271 | -0.0103 | 1.0172 | 1.0529 |
| DMU 13 | 1.0000 | 1.0192 | -0.0192 | 1.0006 | 1.0672 |
| DMU 14 | 1.0000 | 1.0156 | -0.0156 | 1.0006 | 1.0465 |
| DMU 15 | 1.0000 | 1.0200 | -0.0200 | 1.0007 | 1.0741 |
| DMU 16 | 1.0000 | 1.0193 | -0.0193 | 1.0008 | 1.0680 |
| DMU 17 | 1.0000 | 1.0199 | -0.0199 | 1.0006 | 1.0762 |
| DMU 18 | 1.0000 | 1.0191 | -0.0191 | 1.0007 | 1.0655 |
| DMU 19 | 1.0000 | 1.0199 | -0.0199 | 1.0006 | 1.0792 |
| DMU 20 | 1.0000 | 1.0204 | -0.0204 | 1.0006 | 1.0731 |
| DMU 21 | 1.0000 | 1.0202 | -0.0202 | 1.0006 | 1.0756 |
| DMU 22 | 1.0000 | 1.0200 | -0.0200 | 1.0006 | 1.0670 |
| DMU 23 | 1.0000 | 1.0163 | -0.0163 | 1.0005 | 1.0446 |
| DMU 24 | 1.0000 | 1.0135 | -0.0135 | 1.0007 | 1.0368 |
| DMU 25 | 1.0000 | 1.0157 | -0.0157 | 1.0005 | 1.0463 |
| DMU 26 | 1.0184 | 1.0293 | -0.0109 | 1.0191 | 1.0559 |
| DMU 27 | 1.0000 | 1.0215 | -0.0215 | 1.0007 | 1.0771 |
DMU: Decision-making unit.
The first column shows the ratio of analyzed units while the second column collects the values of the DEA estimates without bootstrap ( ) already obtained in Table 1 to facilitate the comparison. The third column displays the efficiency values corrected by the bias given by the bootstrap ( ). The fourth column collects those bias and, finally, the fifth and sixth columns show the lower and upper limits of the 95% confidence intervals generated for the efficiency parameters, respectively. As can be seen, the third column is obtained by subtracting the values of the fourth (estimates of biases) from the second column (initial DEA values).
The results in Table 6 show that the results previously obtained with the initial DEA estimates ( ) should be carefully considered since the estimates corrected by the bias ( ) reveal notable differences (e.g., the DMU20 with values of 1.0000 and 1.0204, respectively). We could even say that the units that would have been classified as efficient initially, at present may not be. In addition, the DMU4, which would not have been efficient according to the initial results, would now present one of the greatest levels of efficiency (coming second after DMU24 that had been classified as efficient). Furthermore, the confidence intervals provided in the fifth and sixth columns are especially useful to draw conclusions on each unit’s efficiency values. In this way, when the intervals of two units do not overlap, it is possible to affirm that the efficiency level of one of them is better than that of the other with a statistical significance of 95%. In the opposite case, no conclusion can be drawn. For clarity, Figure 1 presents these confidence intervals to better visualize the overlapping.
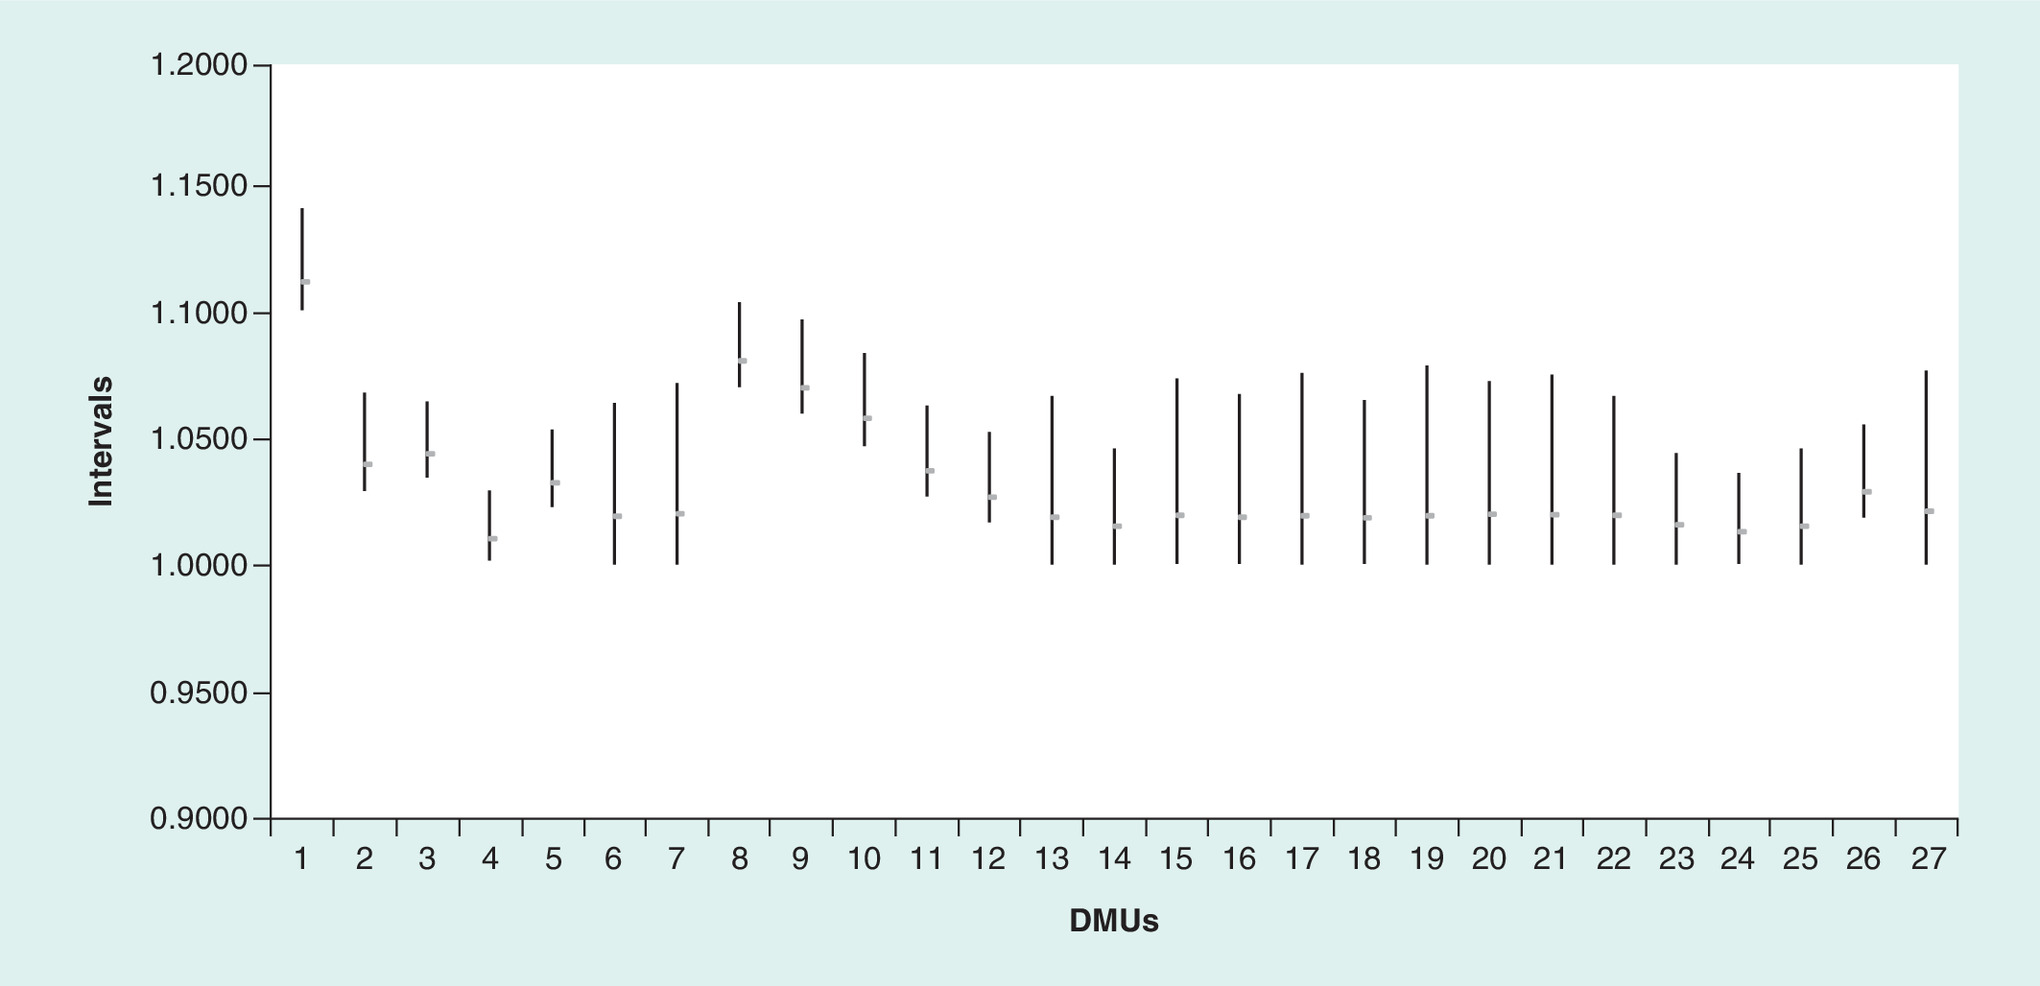
Figure 1. Confidence intervals: 95%.
DMU: Decision-making unit.
Clearly, the DMU 1 (Hospital 1 in 2012) performed better than the rest, except for DMU8 (Hospital 8 in 2012) whose interval was the only one to overlap with that of DMU1.
Finally, the results of the Kruskal–Wallis test, this time obtained with the bootstrap efficiency values for the 2012–2014 period under study, again failed to produce significant levels, whether for hospital age or size (age: 0.36, 0.25, 0.34 and size: 0.083, 0.088, 0.25, for each year, respectively).
Discussion
The results of this study showed a good efficiency level and evolution in the Murcia region (Spain). Over the period under study, average inefficiency of the group was only 1.58% and the number of nonefficient hospitals dropped from seven in 2012 to one in 2014. In addition, no significant relationship was found between hospital age or size and efficiency levels. Nonetheless, certain variables, when corrected, seemed to have a greater relative weight in the improvement of results, in particular: costs of personnel and operations (inputs), average stay (undesirable outputs) and the number of interventions (outputs). Finally, and based on the results of the bootstrap analysis, Hospital 1 showed better performance levels during 2012 than the rest (except Hospital 8 in the same year).
Comparison with other previous works on hospital efficiency
Although abundant prior literature has evaluated the efficiency of hospitals, few have done so using the window analysis method based on DEA. One such work is that of Gannon [51] who analyzed the efficiency of 60 hospitals in Ireland between 1995 and 2000, broken down into two groups of 22 (county hospitals) and 11 (regional and general hospitals) using a variable returns to scale (VRS) input-oriented DEA model obtaining high average efficiency levels (around 0.95). The work of Stefko et al. [41] is also worthy of note: they evaluated the efficiency of hospitals in eight regions of Slovakia using constant returns to scale (CRS) and VRS output-oriented DEA models based on window analysis. The efficiency levels were also close to the unit with the VRS specification of the model (and were somewhat worse for the CRS, which is always the case when comparing both types of results). The present work would be more similar to the second work mentioned above regarding the number of units analyzed (nine hospitals), although it differs from both in that our study included the effect of undesirable outputs in the efficiency results (average stay and rate of return). In addition, our work also tested the relationship between the efficiency levels obtained and certain context variables (hospital age and size); it organized the efficient ones in a hierarchy by means of the superefficiency evaluation model and used bootstrap to obtain confidence intervals amounting to 95% of the performance levels.
Studies based on other types of models are much more numerous and wide-ranging. Logically, the greater the availability of DMUs, the greater the range of feasible analysis procedures. Along with the bigger amount of studies based on other procedures than window analysis, there is also a larger number of geographical areas involved. In this sense, two notable groups of works can be distinguished: those that evaluate the efficiency of hospitals internationally, comparing hospital centers in different countries, and those that limit themselves to a national and/or regional scope.
The consulted bibliography included several studies that aimed at comparing hospital efficiency levels across different countries [30–34,36–39]. Generally, the results obtained in terms of efficiency oscillated around 0.7 in the case of input orientation and 1.3 in the case of output, with ranges between (0.64, 0.86) in the first case [33,34] and between (1.27, 1.36) in the second [39]. The number of units analyzed was usually high, from 31 [30] to 2301 [39]. Logically, there was a wide range of methods of analysis, including several variants of DEA (order-m [39], boostrap [30], CRS [32–34,36], VRS [30,33,34,37]), stochastic frontier [30,38] or directional distance function [31]. Differences between the number of variables could also be found, ranging from 4 [36,39] to 11 [31,32]. Given the notable heterogeneity of the studies regarding their scope, number of DMUs and analysis models, it was difficult to compare these studies with the present work. The reason is that DEA results are sensitive to the number of units analyzed, the selected variables and even the DEA variant used to carry out the analysis. However, keeping these reservations in mind, hospitals studied in the Murcia region (1016) presented a better behavior regarding efficiency compared with that found in the international comparison studies mentioned above. Similar difficulties in comparing efficiency results were encountered when contrasting different possible means of improvement, a difficulty that has also been recognized in other works [33,34,38]. Nevertheless, there seems to be some agreement regarding means of improvements through certain resources (number of beds [31,33,39], labor costs [31,38]), as well as the generation of certain outputs (number of outpatients [31]). In addition, the studies point to certain contextual factors such as: the number of outlier days, [33], the length of stay [30,36] or healthcare expenditure per capita and income inequality [30]. In this sense, our work agrees with prior studies concerning the need to reduce personnel costs and average length of stay, but it differs in not having found a significant relationship between efficiency levels and context variables.
Similar conclusions were obtained based on the consulted works that had a national or regional scope of analysis [40,42–45,49,50,52,53,55,56,58–62,65–67,69–77]. In this context, average efficiency results ranged between 0.07 [69] and 0.94 [59] in the input orientation and between 1.1 [58] and 1.25 [40] in the output orientation. The average number of DMUs analyzed was also high (around 245) though with a broad oscillation range (from 12 [73] to 1071 [67]).
Again, methods of analysis were eclectic. The main methods used were: DEA alone [42,43,71,75,76] or combined with other options such as truncated regression with or without bootstrap [45,58,59,73–77], log regression [60], automatic interaction detector decision tree [56], productivity index (Malmquist, Luenberger) [44,45,49,50,53,55,61,62,66,73], static window analysis [65] or genetic matching and difference-in-difference regression [70]. Only one reviewed study obtained superefficiency results [40] similar to ours. Regarding the variables involved, consulted studies with a national or regional scope appeared to make a more frequent use of undesirable outputs as variables to be considered, which were specified as mortality rates [43–45,69] and readmissions [72].
Unlike the series of works with an international scope mentioned above, this second group did not show a major interest in determining what inputs and/or outputs should be improved to raise efficiency levels. These works generally focused on analyzing how specific aspects affected efficiency, such as the adoption of management agreements [53,72], the health system entry [70], technology [56], the type of hospital studied [67], the use of electronic management methods [55,65] or the business-oriented or public nature of their management [50,62]. In addition, other studies focused on determining a hierarchy of hospital centers based on their efficiency results [40,44,45,61,71,73,75]. Some articles described the variables whose levels it would be advisable to improve to increase efficiency levels. In this sense, regarding inputs, some works recommended reducing the level of operation resources [43,52,66], the number of specialists [44,66,69,73], nurses [44,52,60,66,73,76] or the number of beds [44,52,55,73]. In the same way, other studies suggested to improve the level of concrete outputs such as mortality [43], outpatient visits [43,52,73], patient discharges [43,52,60], days of stay in intensive care units [60], ambulatory visits [60], bed occupancy rate [66], level of satisfaction [66] and number of surgical interventions [60,73,74,77]. Finally, others considered contextual variables: increase in the number of competitors [60,77], size [59,77], rate of hospital use [59], location [42,53,76,77], economic aspects and demographics of the area [45,75] as well as the increase in diversification and presence of specialty departments [58]. A more exhaustive detail of results and recommendations can be found in Supplementary Table 1.
To conclude, as in the case of the first group of works, studies in this second group varied greatly. Nevertheless, keeping in mind similar reservations as in the former case, inefficiency levels obtained in our study in the case of the Murcia region were below the average of that described in the other consulted studies (1.6% compared with a range of 5 [76] to 37.6% [50]) Furthermore, despite the heterogeneity of study objectives and specific variables considered, some agreement with the conclusions of our study was found. In particular, regarding the variables requiring most relative changes, it is worth noting that certain resources (operational and personnel costs) underwent reductions and certain outputs (number of interventions) increased. However, again, the same did not apply to contextual variables, since no significant relationship with efficiency levels was obtained.
Limitations & strengths
The first series of limitations of our work stems from the limitations of the DEA model itself, more specifically those relating to the selection of the type and number of variables, the nonparametric nature of the model and the requirement of homogeneity among the units to be analyzed. All limitations were, however, taken into account in the study to minimize their effect. The literature was reviewed in order to select the variables appropriately: the rule in Cooper et al. [78] was followed, the hospitals were chosen to form a group that was as homogeneous as possible, and parametric limitations were reduced by bootstrap.
Second, there were other limitations due to the characteristics of our study. Thus, on the one hand, a greater availability of temporal data and a larger set of variables would have been advisable. In particular, additional information over a longer period would have allowed increasing the number of windows, improving results and strengthening the validity of our conclusions. A larger number of hospitals in the sample would also have contributed to a similar end. The sample used, however, did include all the acute public hospitals of the Murcia region. Nevertheless, although it would have been appropriate to dispose of more complete statistical information, the requirements and hypotheses of the models and tests were met at all times to ensure the conclusions were valid.
Regarding the strengths of the work, it is worth noting that this is the first study to conduct a complete evaluation of all acute public hospitals in the Murcia region. Additionally, our model included undesirable outputs, which is not usual in this type of analysis. Moreover, the existence of constant returns to scale was tested, thus discarding problems relating to the specification of the model to be used and the variability of the results. The absence of influence of context variables (size and age) on efficiency levels was also tested. Additionally, political measures related to the necessary changes of inputs and outputs have been suggested to continue improving the efficiency of the SMS in the future.
Conclusion
The efficiency of the public hospital sector of Murcia’s Health Service (SMS) was analyzed for the first time in this study. The chosen study period was conditioned by the data available and corresponded to the 2012–2014 triennium. The method of DEA-window analysis was selected because of the limited amount of acute public hospitals in the region in relation to the number of relevant usable variables. In addition, the bootstrap technique was also applied to achieve more consistent results than those usually provided by DEA. The Kruskal–Wallis test was also used to determine the influence of context variables on the efficiency levels obtained.
Based on the results, the average level of inefficiency during the study period was 1.58%. Furthermore, the evolution was positive as it followed a downward trend from 3.53% of average inefficiency in 2012, to 1.00% in 2013 and, finally, to 0.20% in 2014. This favorable evolution was also reflected in the number of efficient hospitals, from two in the first year to six in the second and eight in the third, which, in percentage terms, means it went from 22.22% efficient units to 88.89%.
Regarding the levels detected for the slack variables, the system was also found to perform well. Nevertheless, there is still room for improvement. Thus, slack levels relating to beds were almost irrelevant (below 0.5%), while the resources dedicated to operating rooms, personnel and operating costs were higher and should be reduced (by 12.06, 40.15 and 61.44%, respectively). In terms of desired outputs, emergencies and weighted discharges should, on average, have increased, though not substantially, in other words, only by 1.63 and 2.27%, respectively. The number of interventions, however, should have increased by 29.18%. Finally, undesirable outputs followed the same logic. Average stays and readmissions should have been reduced, but these reductions amounted to 43.42% for stays and only 6.20% for readmissions.
Additionally, concerning bootstrapping results, one unit had an efficiency behavior that seemed greater than the rest, with a statistical significance of 95% (unit 1).
In the light of all the results above, a clearly favorable evolution was found in hospital management both from the perspective of efficiency levels and the number of hospitals classified as efficient. Nevertheless, certain aspects should be corrected to ensure this trend continues or even improves further.
Specifically, the only hospital classified as inefficient in the last year of the study presented slack levels in both inputs and undesirable outputs. Though not worrisome, they could be corrected to improve management.
We must bear in mind, however, that DEA results must always be interpreted from a relative viewpoint, since the efficiency levels it provides are relative. Therefore, although the temporary evolution was positive with hardly any improvement options in the last period, it is not possible to infer that levels of functioning should not continue to improve in the future. Improvements should be based on the implementation of management strategies that differ from that of the group of hospitals under study. Comparing the management of these hospitals with that of others in different geographical areas would thus provide useful information in this sense.
Logically, all the conclusions mentioned above are conditioned by the window of time in which the study was conducted. This study period could not be extended because there was no more available information regarding the necessary variables. It would also have been useful to dispose of disaggregated information per hospital services and units to offer comparative results. Unfortunately, this was not possible either. In the future, it would be interesting to expand the information used in both temporal and vertical directions. Additionally, comparisons with other private hospitals in the same area could be conducted to compare the results between both management models as well as with others from other geographical areas and to incorporate alternative means of improvement.
•
There is growing interest in the specialized literature in studying the efficiency of the healthcare sector overall and that of hospitals in particular.
•
The relevance of the studies on hospital efficiency is explained by the need to guarantee the sector’s future sustainability, given rising cost pressures and the population’s increasing life expectancy.
•
This is the first work to analyze the efficiency of public hospitals in the Region of Murcia (Spain). It used data envelopment analysis-window analysis combined with superefficiency analysis and bootstrapping.
•
The acute public hospitals of Murcia’s Health Service show good levels of efficiency and a good evolution over time.
•
However, on the whole, it would be advisable to decrease the level of some inputs and undesirable outputs while raising the amount of specific outputs. In particular, the variables with the highest correction percentages presented according to the results offered by the slacks: personnel and operating costs (inputs), average stay (undesirable outputs) and number of interventions (outputs).
•
No relationship was found between age and size of hospitals and their levels of efficiency.
•
Individually, only one hospital showed a less favorable evolution than the rest, but this did not imply the need for substantial improvement.
Financial & competing interests disclosure
The authors have no relevant affiliations or financial involvement with any organization or entity with a financial interest in or financial conflict with the subject matter or materials discussed in the manuscript. This includes employment, consultancies, honoraria, stock ownership or options, expert testimony, grants or patents received or pending, or royalties.
No writing assistance was utilized in the production of this manuscript.
Supplementary Material
File (suppl_file.docx)
- Download
- 62.19 KB
References
1.
Nuño-Solinís R. Desarrollo e implementación de la Estrategia de Cronicidad del País Vasco: lecciones aprendidas. Gac. Sanit. 30(S1), 106–110 (2016).
2.
Ministerio de Sanidad, Servicios Sociales e Igualdad. Estadística de Gasto Sanitario Público 2016. Principales resultados, Secretaría General de Sanidad y Consumo, Ministerio de Sanidad, Servicios Sociales e Igualdad (2018).
3.
León J, Palomar JA. Indicadores de los Hospitales Públicos. Región de Murcia 2016. Consejería de Salud, Murcia, Spain (2018).
4.
Jacobs R, Smith P, Street A. Measuring Efficiency in Health Care: Analytic Techniques and Health Policy. Cambridge University Press, Cambridge, UK, (2006).
5.
Charnes A, Cooper WW, Rhodes E. Measuring the efficiency of decision-making units. Eur. J. Oper. Res. 2(6), 429–444 (1978).
6.
Cantor VJ, Poh KL. Integrated analysis of healthcare efficiency: a systematic review. J. Med. Syst. 42(8), (2018) (Epub ahead of print).
7.
Nunamaker TR. Measuring routine nursing service efficiency: a comparison of cost per patient day and data envelopment analysis models. Health Serv. Res. 18(2), 183–208 (1983).
8.
Sherman D. Hospital efficiency measurement and evaluation: empirical test of a new technique. Med. Care 22(10), 922–938 (1984).
9.
Hollingsworth B, Dawson P, Maniadakis N. Efficiency measurement of healthcare: a review of non-parametric methods and applications. Health Care Manag. Sci. 2(3), 161–172 (1999).
10.
Hollingsworth B. Non-parametric and parametric applications measuring efficiency in healthcare. Health Care Manag. Sci. 6(4), 203–218 (2003).
11.
Hollingsworth B. The measurement of efficiency and productivity of healthcare delivery. Health Econ. 17, 1107–1128, (2008).
12.
Worthington A. Frontier efficiency measurement in health care: a review of empirical techniques and selected applications. Med. Care Res. Rev. 61(2), 1–36 (2004).
13.
Ozcan A. Health care benchmarking and performance evaluation. An Assessment Using Data Envelopment Analysis (DEA), (2nd Edition). Springer, Berlin, Germany (2014).
14.
O´Neill L, Rauner M, Hiedenberger K, Kraus M. A cross-national comparison and taxonomy of DEA-based hospital efficiency studies. Socio-Econ. Plan. Sci. 42, 158–189 (2008).
15.
Kohl S, Schoenfelder J, Fügener A, Brunner J. The use of data envelopment analysis (DEA) in healthcare on a focus on hospitals. Health Care Manag. Sci. (2018) (Epub ahead of print).
16.
Puig-Junoy J. Eficiencia en la atención primaria de salud: Una revisión crítica de las medidas de frontera. Rev. Esp. Salud Pública 74, 483–495 (2000).
17.
Giuffrida A, Gravelle H. Measuring performance in primary care: econometric analysis and DEA. Appl. Econ. 33, 163–175 (2001).
18.
Amado CAF, Dyson R. On comparing the performance of primary care providers. Eur. J. Oper. Res. 185, 915–932, (2008).
19.
Pelone F, Kringos DS, Romaniello A, Archibugi M, Salsiri C, Ricciardi W. Primary care efficiency measurement using data envelopment analysis: a systematic review. J. Med. Syst. 39(1), 1–14, (2015).
20.
Kontodinopoulos N, Niakas D. Efficiency measurement of hemodialysis units in Greece with data envelopment analysis. Health Policy 71, 195–204 (2005).
21.
Özgen H, Sahin I. Measurement of efficiency of the dialysis sector in Turkey using data envelopment analysis. Health Policy 95, 185–193 (2010).
22.
Katharaki G, Katharaki M, Katostaras T. An empirical study of comparing DEA and SFA methods to measure hospital units’ efficiency. IJOR 21(3), 341, (2014).
23.
Caballer-Tarazona M, Moya-Clemente I, Vivas-Consuelo D. A model to measure the efficiency of hospital performance. Math. Comput. Model 52, 1095–1102 (2010).
24.
Puig-Junoy J. Measuring health production performance in the OECD. Appl. Econ. Lett. 5(4), 255–259, (1998).
25.
Spinks J, Hollingsworth B. A cross-country comparison off technical efficiency of health production: a demonstration of pitfalls. Appl. Econ. 41, 417–427 (2009).
26.
Moran V, Jacobs R. An international comparison of efficiency of inpatient mental healthcare system. Health Policy 112, 88–99 (2013).
27.
Asandului L, Roman M, Fatulescu P. The efficiency of healthcare systems in Europe: a data envelopment analysis approach. Procedia Economics and Finance 10, 261–268 (2014) .
28.
Cheng G, Zervopoulos PD. Estimating the technical efficiency of healthcare systems: A cross-country comparison using the directional distance function. European Journal of Operational Research. Eur. J. of Opera. Res. 238(3), 899–910 (2014).
29.
Popescu C, Asandului L, Fatulescu P. A data envelopment analysis for evaluating Romania’s health system. Procedia. Soc. Behav. Sci. 109, 1185–1189 (2014).
30.
Varabyova Y, Müller JM. The efficiency of healthcare production in OECD countries: a systematic review and meta-analysis of cross-country comparisons. Health Policy 120(3), 252–263 (2016).
31.
Dervaux B, Ferrier GD, Leleu H, Valdmanis V. Comparing French and US hospital technologies: a directional input distance function approach. Appl. Econ. 36, 1065–1081 (2004).
32.
Steinmann I, Dittrich G, Karmann A, Zweifel P. Measuring and comparing the efficiency of German and Swiss hospitals. Eur. J. Health Econ. 5(3), 216–26 (2004).
33.
Linna M, Häkkinen U, Magnussen J. Comparing hospital cost efficiency between Norway and Finland. Health Policy 77, 268–278 (2006).
34.
Linna M, Häkkinen U, Peltola M et al. Measuring cost efficiency in the Nordic hospitals, a cross-sectional comparison of public hospitals in 2002. Health Care Manag. Sci. 13(4), 346–357 (2010).
35.
Medin E, Häkkinen U, Linna M, Anthun KS, Kittelsen SAC, Rehnberg C. International hospital productivity comparison: experiences from the Nordic countries. Health Policy 112, 80–87 (2013).
36.
Kittelsen EAC, Winsnes BA, Anthun KS et al. Descomposing the productivity differences between hospitals in the Nordic countries. J. Prod. Anal. 43, 281–293 (2015).
37.
Varabyova Y, Schreyögg J. International comparisons of the technical efficiency of the hospital sector: panel data analysis of OCDE countries using parametric and non-parametric approaches. Health Policy 112, 70–79 (2013).
38.
Mateus C, Joaquim I, Nunes C. Measuring hospital efficiency-comparing four European countries. Eur. J. Public Health 25(Suppl. 1), 52–58 (2015).
39.
Varabyova Y, Blankart CR, Torbika A, Schreyögg J. Comparing the efficiency of Hospitals in Italy and Germany: nonparametric conditional approach based on partial frontier. Health Care Manag. Sci. 20(3), 379–394, (2017).
40.
Cabello PA, Hidalgo A. Análisis de la eficiencia hospitalaria por Comunidad Autónoma en el ámbito del Sistema Nacional de Salud. Investigaciones Regionales 28, 147–158 (2014).
41.
Stefko R, Gavurova B, Kocisova K. Healthcare efficiency assessment using DEA analysis in the Slovak Republic. Health Econ. Rev. 8(1), 6 (2018).
42.
Cunha SC, Nunes AM. Techical efficiency of Portuguese public hospitals: a comparative analysis across the five regions of Portugal. Int. J. Health Plann. Mgmt. 34, e411–e422 (2019).
43.
Shain I, Ozcan YA. Public sector hospital efficiency for provincial markets in Turkey. J. Med. Syst. 24(6), 307–320 (2000).
44.
Sahin B, İlgün G. Assessment of the impact of public hospital associations (PHAs) on the efficiency of hospitals under the ministry of health in Turkey with data envelopment analysis. Health Care Manag. Sci. http://doi.org/10.1007/s10729-018-9463-5 (2018) (Epub ahead of print).
45.
Guo H, Zhao Y, Niu T, Tsui KL. Hong Kong hospital authority resourde efficiency evaluation: vis a novel DEA-Malmquist model and Tobit regression model. PLoS ONE 12(9), e0184211, (2017).
46.
Kruse FM, Stadhouders NW, Adang EM, Groenewoud S, Jeurissen PPT. Do private hospitals outperform public hospitals regarding efficiency, accessibility, and quality of care in the European Union? A literature review. Int. J. Health Plann. Mgmt. 33, e434–e453 (2018).
47.
Tiemann O, Schreyögg J, Busse R. Hospital ownership and efficiency: a review of studies with particular focus on Germany. Health Policy 104, 163–171 (2012).
48.
Alonso JM, Clifton J, Díaz-Fuentes D. The impact of new public management on efficiency: an analysis of Madrid´s hospitals. Health Policy 119(3), 333–340 (2015).
49.
Franco JL, Fullana C, Rúa A. Analysis of the technical efficiency of the forms of hospital management based on public-private collaboration of the Madrid Health Service, as compared with the traditional management. Int. J. Health Plann. Mgmt. 34, 414–442, https://doi.org/10.1002/hpm.2678 (2019).
50.
Franco JL, Fullana C. Los nuevos modelos de gestión hospitalaria como alternative para la sostenibilidad del sistema hospitalario público: un análisis de eficiencia en gasto sanitario. J. Healthc. Qual. Res. (2019) (Epub ahead of print).
51.
Gannon B. Testing for variation in technical efficiency of hospitals in Ireland. Econ. Soc. Rev. 36(3), 273–294 (2005).
52.
Chern JY, Wan TTH. The impact of the prospective payment system on the technical efficiency of hospitals. J. Med. Syst. 24(3), 159–172 (2000).
53.
Zhang X, Tone K, Lu Y. Impact of the local public hospital reform on the efficiency of medium-sized hospitals in Japan: an improved slacks-based measure data envelopment analysis approach. Health Serv. Res. 53(2), 896–918 (2018).
54.
Kazley AS, Ozcan YA. Electronic medical record use and efficiency: a DEA and windows analysis of hospitals. Socio-Econ. Plann. Sci. 43, 209–2016 (2009).
55.
Huerta TR, Thompson MA, Ford EW, Ford WF. Implementing electronic lab order entry management in hospitals: incremental strategies lead to better productivity outcomes. Int. J. Inf. Manage. 33, 40–47 (2013).
56.
Williams C, Asi Y, Raffenaud A, Bagwell M, Zeini I. The effect of information technology on hospital performance. Health Care Manag. Sci. 19, 338–346 (2016).
57.
Ley E. Eficiencia productiva: un estudio aplicado al sector hospitalario. Investig. Econ. 15(1), 71–88 (1991).
58.
Prior D. Technical efficiency and scope economies in hospitals. Appl. Econ. 28, 1295–1301 (1996).
59.
González López-Valcarcel B, Barber P. Changes in the efficiency of Spanish public hospitals after the introduction of program-contracts. Investig. Econ. 20(3), 377–402 (1996).
60.
Puig-Junoy J. Partitioning input cost efficiency into its allocative and technical components: an empirical DEA application to hospitals. Socio-Econ. Plann. Sci. 34, 199–218 (2000).
61.
Solà M, Prior D. Measuring productivity and quality changes using data envelopment analysis: an application to Catalan hospitals. Financ. Account. Manage. 17(3), 219–245, (2001).
62.
Herrero L, Martín JJ, López MP. Eficiencia técnica de los hospitales públicos y de las empresas públicas hospitalarias de Andalucía. Gac. Sanit. 29(4), 274–281 (2015).
63.
Campos MS, Fernández-Montes A, Gavilan JM, Velasco F. Public resource usage in health systems: a data envelopment analysis of the efficiency of health systems of autonomous communities in Spain. Public Health 138, 33–40 (2016).
64.
Carrillo M, Jorge JM. DEA-like efficiency ranking of regional health system in Spain. Soc. Indic. Res. 133(3), 1133–1149 (2017).
65.
Al-Amin M, Makarem SC, Rosko M. Efficiency and hospital effectiveness in improving hospital consumer assessment of healthcare providers and systems ratings. Health Care Manage. Rev. 41(4), 296–305 (2016).
66.
Giménez V, Prieto W, Prior D, Tortosa-Ausina E. Evaluation of efficiency in Colombian hospitals: an analysis for the post-reform period. Socio-Econ. Plan. Sci. 65, 20–35 (2019).
67.
Yildiz M, Heboyan V, Khan MM. Estimating technical efficiency of Turkish hospitals: implications for hospital reform initiatives. BMC Health Serv. Res. 18(1), 401 (2018).
68.
Valdmanis VG, Rosko MD, Mutter RL. Hospital quality, efficiency and input slack differentials. Health Serv. Res. 43(5p2), 1830–1848, (2008).
69.
Bilsel M, Davutyan N. Hospital efficiency with risk adjusted mortality as undesirable output: the Turkish case. Ann. Oper. Res. 221, 73–88 (2014).
70.
Büchner VA, Hinz V, Schreyögg J. Health systems: changes in hospital efficiency and profitability. Health Care Manag. Sci. 19, 130–143 (2016).
71.
Li Y, Lei X, Morton A. Performance evaluation of nonhomogeneous hospitals: the case of Hong Kong hospitals. Health Care Manage. Sci. (2018) (Epub ahead of print).
72.
Arocena P, García-Prado A. Accounting for quality in the measurement of hospital performance: evidence from Costa Rica. Health Econ. 16, 667–685 (2007).
73.
Ali M, Bebela M, Bamud T. Technical efficiency of selected hospitals in Eastern Ethiopia. Health Econ. Rev. 7(24), 1–13 (2017).
74.
Kounetas K, Papathanassopoulos F. How efficient are Greek hospitals? A case study using a double bootstrap approach. Eur. J. Health Econ. 14, 979–994 (2013).
75.
Zheng W, Sun H, Zhang P, Zhou G, Jin Q, Lu X. A four-stage DEA-based efficiency evaluation of public hospitals in China after the implementation of new medical reforms. PLoS ONE 13(10), e0203780, (2018).
76.
Cunha-Ferreira D, Morais-Nunes A, Cunha-Marques R. Doctors, nurses, and the optimal scale size in the Portuguese public hospitals. Health Policy 122, 1093–1100 (2018).
77.
Sultan WIM, Crispim J. Measuring the efficiency of Palestinian public hospitals during 2010-2015: an application of two-stage DEA method. BMC Health Serv. Res. 18(381), 1–17 (2018).
78.
Cooper WW, Seiford LM, Tone K. Data Envelopment Analysis: A Comprehensive Text with Models, Applications, References and DEA-Solver Software. Springer, NY, USA (2007).
79.
Charnes A, Cooper WW, Lewin AY, Seiford LM (Eds). Data Envelopment Analysis: Theory, Methodology and Applications, 2nd Edition. Kluwer Academic Publishers, NY, USA (1997).
80.
Charnes A, Cooper WW, Rhodes E. Evaluating program and managerial efficiency: an application of data envelopment analysis to program follow through. Manage. Sci. 27(6), 668–697 (1981).
81.
Norman M, Stoker B. DEA: The Assessment of Performance. John Wiley and Sons, 239, Chichester, UK, 239 (1991).
82.
Andersen P, Petersen NC. A procedure for ranking efficient units in DEA. Manage. Sci. 39(10), 1261–1264 (1993).
83.
Simar L, Wilson PW. Sensitivity analysis of efficiency scores: how to bootstrap in nonparametric frontier models. Manage. Sci. 44(1), 49–61 (1998).
84.
Löthgren M, Tambour M. Bootstrapping the data envelopment analysis Malmquist productivity index. Appl. Econ. 31, 417–425 (1999).
85.
Efron B. Bootstrap methods: another look at the jackknife. Ann. Stat. 7(1), 1–26 (1979).
86.
Tortosa-Ausina E, Grifell-Tatjé E, Armero C, Conesa D. Sensitivity analysis of efficiency and Malmquist productivity indices: an application to Spanish savings Banks. Eur. J. Oper. Res. 184, 1062–1084 (2008).
87.
Silverman BW. Density Estimation for Statistics and Data Analysis. Chapman and Hall, London, UK (1986).
88.
Simar L, Wilson PW. Statistical inference in nonparmetric frontier models: the state of the art. J. Prod. Anal. 13(1), 49–78 (2000).
89.
Newhouse JP. Frontier estimation: how useful a tool for health economics? J. Health Econ. 13(3), 317–322 (1994).
90.
Barros CP. Measuring efficiency in the hotel sector. Ann. Touris. Res. 32(2), 465–477 (2005).
91.
Fuentes R, Lillo-Bañuls A. Smoothed bootstrap Malmquist index based on DEA model to compute productivity of tax offices. Expert Syst. Appl. 42(5), 2442–2450 (2015).
92.
Bates L, Mukherjee JK, Santerre R. Market structure and technical efficiency in the hospital services industry: a DEA approach. Med. Care Res. Rev. 63(4), 499–524 (2006).
93.
Hailu A, Veeman TS. Non-parametric productivity analysis with undesirable outputs: an application to the Canadian pulp and paper industry. Am. J. Agr. Econ. 83(3), 605–616 (2001).
94.
Mandal S, Madheswaran S. Environmental efficiency of the Indian cement industry: an interstate analysis. Energy Policy 38(2), 1108–1118 (2010).
95.
Simar L, Wilson P. Non-parametric tests of returns to scale. Eur. J. Oper. Res. 139(1), 115–132 (2002).
Information & Authors
Information
Published In
Pages: 929 - 946
PubMed: 31464149
Copyright
© 2019 Future Medicine Ltd.
History
Received: 26 December 2018
Accepted: 24 May 2019
Published online: 29 August 2019
Keywords:
Topics
Authors
Metrics & Citations
Metrics
Article Usage
Article usage data only available from February 2023. Historical article usage data, showing the number of article downloads, is available upon request.
Citations
How to Cite
Efficiency of acute public hospitals in the region of Murcia, Spain. (2019) Journal of Comparative Effectiveness Research. DOI: 10.2217/cer-2018-0150
Export citation
Select the citation format you wish to export for this article or chapter.
Citing Literature
- Shengjiao Zhu, Jinsi Liu, Zhihua Wang, Shixiang Chen, Study on regional disparities and influencing factors of public health service supply in China from the perspective of fairness, BMC Health Services Research, 10.1186/s12913-025-13292-6, 25, 1, (2025).
- Anteneh Lamesgen, Belayneh Mengist, Elyas Melaku Mazengia, Bekalu Endalew, Level of technical efficiency and associated factors among health centers in East Gojjam Zone, Northwest Ethiopia: an application of the data envelopment analysis, BMC Health Services Research, 10.1186/s12913-024-10843-1, 24, 1, (2024).
- Dinesh R. Pai, Fatma Pakdil, Nasibeh Azadeh-Fard, Applications of data envelopment analysis in acute care hospitals: a systematic literature review, 1984–2022, Health Care Management Science, 10.1007/s10729-024-09669-4, 27, 2, (284-312), (2024).
- Nam Hyok Kim, Feng He, O Chol Kwon, Combining common-weights DEA window with the Malmquist index: A case of China’s iron and steel industry, Socio-Economic Planning Sciences, 10.1016/j.seps.2023.101596, 87, (101596), (2023).
- Wanmin Su, Liulin Du, Yujun Fan, Peixi Wang, Equity and efficiency of public hospitals’ health resource allocation in Guangdong Province, China, International Journal for Equity in Health, 10.1186/s12939-022-01741-1, 21, 1, (2022).
- Mohammed A. AlKhars, Ahmad H. Alnasser, Taqi AlFaraj, A Survey of DEA Window Analysis Applications, Processes, 10.3390/pr10091836, 10, 9, (1836), (2022).
- Pejman Peykani, Elaheh Memar-Masjed, Nasim Arabjazi, Mirpouya Mirmozaffari, Dynamic Performance Assessment of Hospitals by Applying Credibility-Based Fuzzy Window Data Envelopment Analysis, Healthcare, 10.3390/healthcare10050876, 10, 5, (876), (2022).
- Ivana Vaňková, Iveta Vrabková, Productivity analysis of regional-level hospital care in the Czech republic and Slovak Republic, BMC Health Services Research, 10.1186/s12913-022-07471-y, 22, 1, (2022).
- Pejman Peykani, Reza Farzipoor Saen, Fatemeh Sadat Seyed Esmaeili, Jafar Gheidar‐Kheljani, Window data envelopment analysis approach: A review and bibliometric analysis, Expert Systems, 10.1111/exsy.12721, 38, 7, (2021).
- Tao Liu, Jixia Li, Juan Chen, Shaolei Yang, Regional Differences and Influencing Factors of Allocation Efficiency of Rural Public Health Resources in China, Healthcare, 10.3390/healthcare8030270, 8, 3, (270), (2020).