

Translating clinical trial efficacy data into population-level impact: a microsimulation model to compare APOC3 RNA inhibition on lowering triglycerides
Abstract
Aim: Familial chylomicronemia syndrome (FCS) is a rare disorder caused by severe hypertriglyceridemia which increases risk for life-threatening acute pancreatitis (AP). The aim of this study was to indirectly compare the effectiveness of two novel triglyceride (TG)-lowering APOC3 RNA inhibitors in these patients. Materials & methods: An individual patient simulation model was developed and implemented using Monte Carlo sampling to assess the impact of novel FCS treatments, plozasiran versus olezarsen, on serum TG levels. Patient-level heterogeneity was captured through a distribution of pre-treatment TG levels matching the PALISADE trial cohort in the base case. Uncertainty in treatment response (percent reduction of TG levels) was modeled using beta distributions with parameters based on the pivotal PALISADE and BALANCE trials for plozasiran and olezarsen, respectively. The proportion of patients who achieved TG levels of <500 mg/dl and absolute TG levels were simulated at different timepoints. Three scenario analyses were conducted to assess the robustness of results to key modeling assumptions: the pre-treatment cohort was matched to the BALANCE trial (scenario 1); the pre-treatment range of TG values was expanded (scenario 2); the pre-treatment cohort was matched to patients with genetically confirmed FCS from the PALISADE trial (scenario 3). Results: In the base case model, simulated patients in the plozasiran group were more likely to achieve TG levels <500 mg/dl at 10 months post-treatment compared with patients treated with olezarsen (56.8% vs 18.2%). A similar pattern was seen across all scenarios and across all time-points evaluated. The microsimulation model was found to be stable with regard to the primary outcome when the number of simulated patients was between 10 and 100,000; results were validated by congruence with reference clinical trial data. Conclusion: This microsimulation model suggests plozasiran’s greater efficacy in TG level reduction, compared with olezarsen, in FCS. Greater reductions in TG levels may reduce exposure to TG concentrations associated with an increased risk of AP.
Plain language summary: Comparing two new triglyceride-lowering drugs for familial chylomicronemia syndrome using a computer simulation model
What is this article about?
Familial chylomicronemia syndrome (FCS) is a rare, inherited condition that causes very high triglyceride (TG) levels in the blood, putting patients at risk for a serious complication called acute pancreatitis (inflammation of the pancreas). Two new medications, plozasiran and olezarsen, have been developed to lower TG levels in people with FCS.
What methodology is described?
This article describes a study that aimed to estimate how these two treatments compare using a computer simulation model, since no head-to-head clinical trial exists.
What were the results?
The model predicted that about 57 out of 100 patients on plozasiran would reach a safe TG level (under 500 mg/dl) after 10 months of treatment. For olezarsen, only about 18 out of 100 patients would reach that same level. This pattern – plozasiran outperforming olezarsen – held up consistently across all the different versions of the model tested and at multiple time points.
What do the results mean?
This study suggests that plozasiran may lower blood TG levels more than olezarsen in people with FCS. High TG levels increase the risk of painful pancreatitis attacks, so lowering TGs more may provide greater protection. However, because the medicines were not compared directly in the same clinical trial, the results should be interpreted with caution and seen as an early indication rather than definitive proof.
FCS, a rare hereditary disorder affecting 1 to 10 individuals per million, is characterized by sustained and severely elevated serum triglyceride (TG) levels (>880 mg/dl) [1,2]. FCS is associated with an increased risk of acute pancreatitis (AP), a life-threatening condition whose risk increases as TG levels increase [2–4]. An important goal of FCS management is to prevent occurrence of AP [5]. FCS is typically managed by adhering to a strict low-fat diet and avoiding alcohol [6,7]. Lipid-lowering treatments like statins, niacin, fibrates and fish oils, are often added to treatment regimens, although they produce only modest reductions in TG levels. A new generation of therapies has emerged which inhibit apolipoprotein C-3 (APOC3) production and reduce plasma TG levels with a goal to lower serum TGs to levels below those that increase the risk for AP (TG <500 mg/dl). APOC3 plays a central role in TG metabolism [8]. Thus, APOC3 inhibitors that directly address the biological mechanism driving high TG levels offer new treatment options by modifying lipoprotein lipase-dependent and -independent pathways of TG-rich lipoprotein metabolism and clearance.
Two novel APOC3 inhibitors, plozasiran and olezarsen, have been evaluated in placebo-controlled Phase III trials of patients with FCS [9,10]; however, their comparative effectiveness has not been evaluated in a head-to-head trial. Given the rarity of FCS and the novelty of plozasiran and olezarsen, generating robust evidence directly comparing outcomes in comparable patient groups treated with these therapies is a challenge. In this paper, we present a microsimulation model that may offer an alternative approach to comparing the effectiveness of the two treatments. First, microsimulation allows for patient-level modeling; thus, using a common synthetic cohort can remove the confounding due to baseline differences in trial populations [11,12]. Second, by generating individual level outcomes across a large cohort, microsimulation allows estimation of full outcome distributions, including tail probabilities relevant to the risk of AP.
Materials & methods
Model population
This study used an individual patient simulation modeling approach to compare post-treatment TG levels in patients with FCS when treated with plozasiran and olezarsen, respectively. The model was calibrated based on study participants (the patient population) and results from the pivotal PALISADE [9] and BALANCE trials [10] of plozasiran and olezarsen in patients with FCS. The model used the Monte Carlo method to simulate TG levels for individual patients selected from a pre-treatment cohort. A paired design was applied, i.e., the model simulated post-treatment TG levels associated with both plozasiran and olezarsen for each randomly selected patient from the model population. The simulation model was programmed in Excel using Visual Basic for Applications.
Pre-treatment cohort
The population of interest for this model is patients with FCS. Neither an FCS disease registry nor a validated algorithm to identify patients with FCS in claims data were found in the literature. However, summary statistics for baseline TG values from various clinical trial cohorts have been published and was used to calibrate a synthetic pre-treatment cohort (N = 6000). Given that individual patient data from these trials were not available, a distributional assumption was made. Based on discussions with clinical experts and tractability, pre-treatment TG values were assumed to follow a truncated log-normal distribution.
Three pre-treatment FCS cohorts were generated, one calibrated against baseline TG levels in the PALISADE trial, another calibrated against baseline TG levels of patients included in the BALANCE trial, and a third one calibrated against patients in the PALISADE trial with genetically confirmed FCS (Table 1). The first cohort was used in the model base case while the other cohorts were used for scenario analyses (Please see below for more details). The cohorts were generated externally to the model.
| Pre-treatment cohorts | TG level (mg/dl), median | TG level (mg/dl), mean | TG level (mg/dl), SD | Range (mg/dl) | Source | Ref. |
|---|---|---|---|---|---|---|
| PALISADE | 2044.0 | 2369.1 | 1353.3 | 746.7–6597.3 | Watts et al. (2025) | [9] |
| BALANCE | NR | 2630.0 | 1315.0 | 334.0–6898.0 | Stroes et al. (2024) | [10] |
| PALISADE genetically confirmed FCS | 2368.0 | 2375.0 | NR | 798.4–4944.7 | Watts et al. (2025), Data on File, Arrowhead Pharmaceutical (2025) | [13,14] |
Mean and SD for the PALISADE cohort as derived from the study arm-level data published in Watts 2025 [9]; range was provided by Arrowhead Pharmaceuticals. For the PALISADE trial, additional descriptives such as median and IQR were available and considered in the calibration.
Cohort Size: 6000 patients; FCS: Familial chylomicronemia syndrome; IQR: Interquartile range; SD: Standard deviation; TG: Triglyceride.
Model structure & inputs
The study simulation relied on the Monte Carlo method to model both variation in baseline TG values for patients with FCS as well as uncertainty in treatment response. A simulation cohort of hypothetical patients with FCS was generated through repeated random sampling with replacement from the pre-treatment cohort. The model then calculated TG levels for individual patients at various timepoints based on pre-treatment value and treatment response. This was later conceptualized as the percent change in TG levels from baseline and modeled stochastically, randomly selected from a transformed beta distribution. The model aimed to compare two treatments with different dosing schedules, the monthly-dosed antisense oligonucleotide (ASO) olezarsen versus the quarterly-dosed small interfering RNA (siRNA) plozasiran. To account for the peaks and troughs in the outcomes due to variation in dosing, the model considered outcomes at four different timepoints. As described above, the model used Monte Carlo methods to represent variation in individual characteristics and treatment effect; thus, the estimated outcomes vary between individuals. Once execution of the model for a sufficiently large number of individuals was completed, a population distribution of outcomes was achieved for the primary outcomes, i.e., the proportions of patients who achieved TG levels <500 mg/dl at 1 month (initial maximal response post-dose), 6 months (BALANCE primary end point), 10 months (PALISADE primary end point) and 12 months post-treatment (PALISADE AND BALANCE secondary end points). Secondary outcomes included the mean and median post-treatment TG levels at each timepoint of interest. The 500 mg/dl threshold was chosen because it is an indicator of severe hypertriglyceridemia and increased risk of AP, according to current ACC/AHA guidelines on the treatment of blood cholesterol [6].
We used graphical diagnostics to show how outcomes produced using the microsimulation model converge. A plot of the mean simulation estimates as a function of the number of individuals run in the microsimulation model (i.e., microsimulation sample size) was generated for this purpose (see Supplementary Methods for details).
Similar clinical responses with APOC3 reductions, TG reductions and changes in other lipid parameters following treatment with an APOC3 inhibitor [13] in the two studies allowed us to move forward with our comparison. The distributions for treatment effects used in the model were parametrized at each time point of interest to match the mean and standard deviation of responses observed in PALISADE trial (25 mg quarterly plozasiran doses) and BALANCE trial (80 mg monthly olezarsen doses) (Table 2). Note that the two studies reported slightly different outcome measures; while the BALANCE trial reported mean responses, the published results for the PALISADE study are expressed as medians. To ensure consistency, the authors obtained values for mean and standard deviation of effect from the PALISADE study for use in this model (Table 2).
| Month 1 | Month 6 | Month 10 | Month 12 | ||
|---|---|---|---|---|---|
| Plozasiran | Mean SD | 81.40 14.30 | 68.10 23.90 | 74.50 20.30 | 67.70 29.30 |
| Olezarsen | Mean SD | 40.69 42.67 | 40.00 33.82 | 36.90 35.84 | 41.03 34.83 |
Mean and SD of % change from baseline in TG levels for plozasiran were provided by Arrowhead Pharmaceuticals [14]; corresponding data for olezarsen was extracted from Figure 1 of the BALANCE trial [10] using WebPlotDigitalizer (https://automeris.io/).
TG: Triglyceride.
Since TGs from patients with FCS are extremely variable, the trial averages could not be compared.
Scenario analyses
The pretreatment cohort of FCS patients for this model was generated based on patient cohorts in available clinical trials. Additional to the base case model, three scenarios were run.
In the base case, a synthetic pre-treatment cohort of 6000 patients with FCS was constructed to match the distribution of TG levels (range: 1000–7000 mg/dl) among patients enrolled in PALISADE. In scenario 1, the pre-treatment cohort was based on pre-treatment TG levels in BALANCE. In scenario 2, the pre-treatment cohort was based on PALISADE with a maximum TG level of 10,000 mg/dl. In scenario 3, the pre-treatment cohort and treatment responses were based on the genetically confirmed subgroup (59%) of patients enrolled in PALISADE instead of all patients (base case) in the trial [6]. The additional rationale for each scenario and a description of the model’s stability and interpretability of statistical significance testing can be found in the supplement. The results were a distribution that represents a treatment with modest TG reductions (39%–41%) and a distribution that represents a treatment with larger TG reductions (68%–81%) (see table and figures Supplementary Methods).
Results
In the base case model, patients treated with plozasiran were more likely to achieve TG levels <500 mg/dl at 10 months post-treatment initiation compared with patients treated with olezarsen (56.8% vs 18.2%) (Figure 1A). Reductions in TGs were apparent at 1 month and sustained thereafter – at all timepoints – within the thresholds of AP risk (Figure 1A). Across scenarios, the proportion of patients treated with plozasiran versus olezarsen who achieved TG levels <500 mg/dl at 10 months post-treatment initiation were similar to those in the base case model: scenario 1 (53.2% vs 15.2%), scenario 2 (56.5% vs 17.9%) and scenario 3 (61.4% vs 14.2%) (Figure 1B–E). Similar proportions were seen at the 1, 6 and 12-month end points in all scenarios (Figure 1).
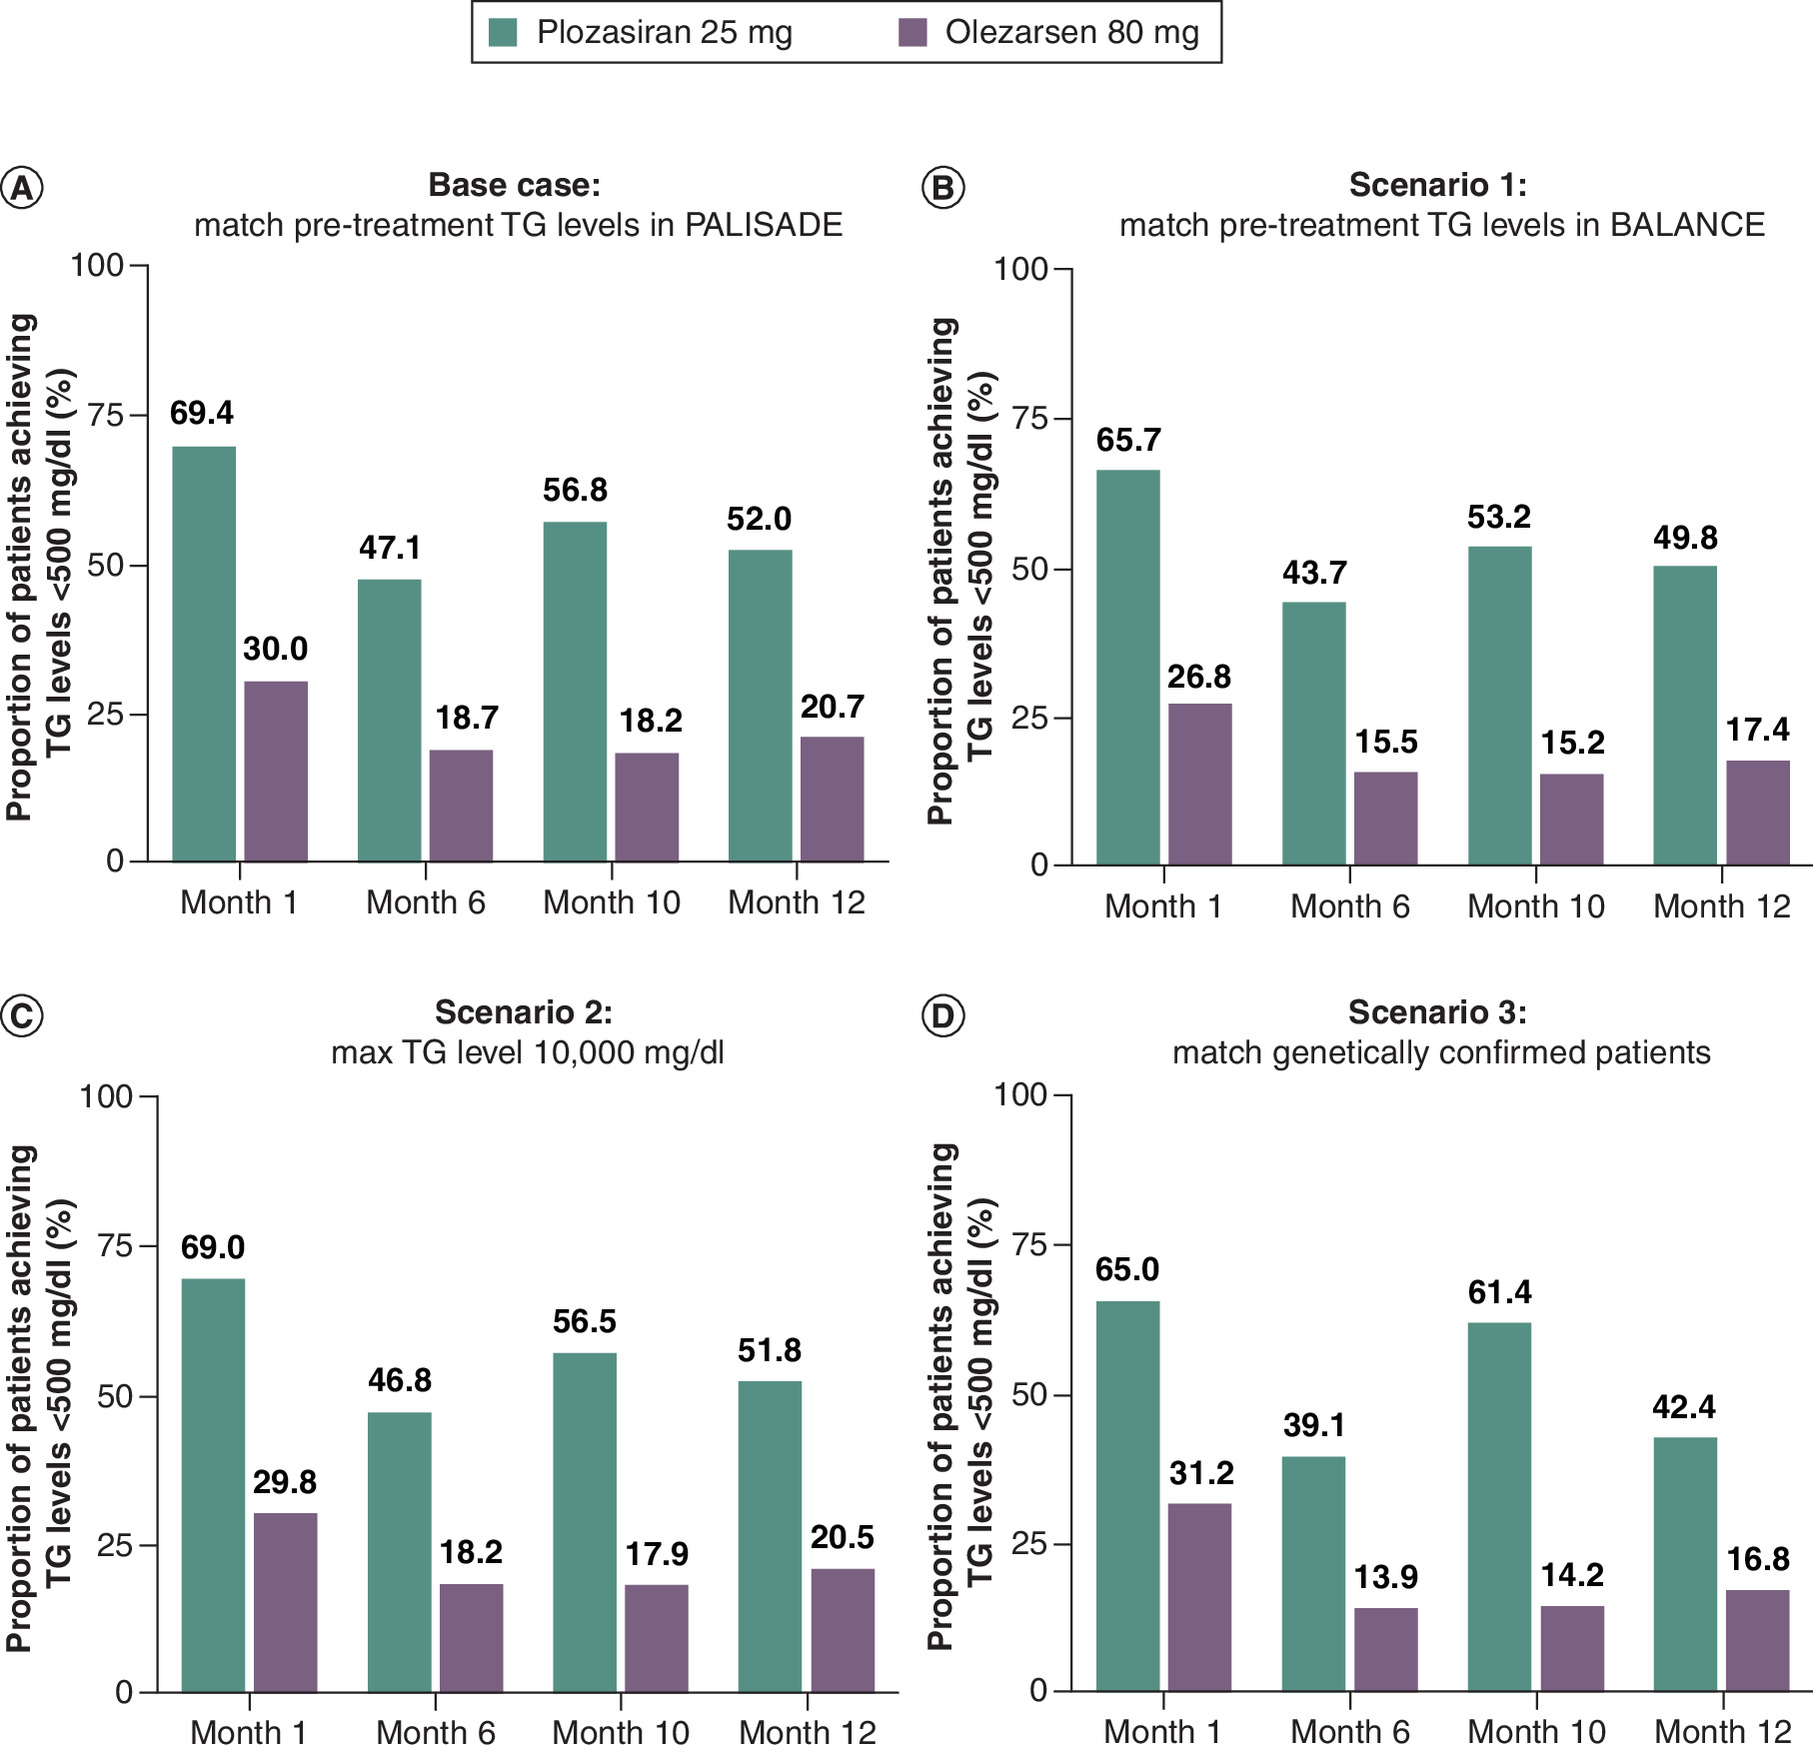
Figure 1. Proportion of patients achieving triglyceride levels <500 mg/dl post-treatment with plozasiran or olezarsen.
(A) The base case model uses a pre-treatment cohort constructed based on PALISADE. Pre-treatment TG levels were between 1000–7000 mg/dl and simulated patients with FCS were either clinically diagnosed or genetically confirmed. (B) Scenario 1 changes the pre-treatment cohort to one based on the BALANCE trial cohort. (C) Scenario 2 expands the range of pre-treatment TG levels to 1000–10,000 mg/dl. (D) Scenario 3 changes the pre-treatment cohort to one based on only patients with genetically confirmed FCS within PALISADE.
FCS: Familial chylomicronemia syndrome; TG: Triglyceride.
Simulated patients treated with plozasiran achieved lower post-treatment mean (Figure 2) and median (Figure 3) TG levels when compared with patients treated with olezarsen both in the base case model and in all scenarios, across all timepoints. In the base case model, the overall pre-treatment mean (median) TG level was 2425 mg/dl (2039 mg/dl) and 10-month post-treatment mean (median) TG levels were lower than pre-treatment TG levels for both plozasiran (620 mg/dl [414 mg/dl]) and olezarsen (1530 mg/dl [1188 mg/dl] (Figures 2A & 3A). Similar results were found across all scenarios and at the 1, 6 and 12-month end points (Figures 2 & 3).
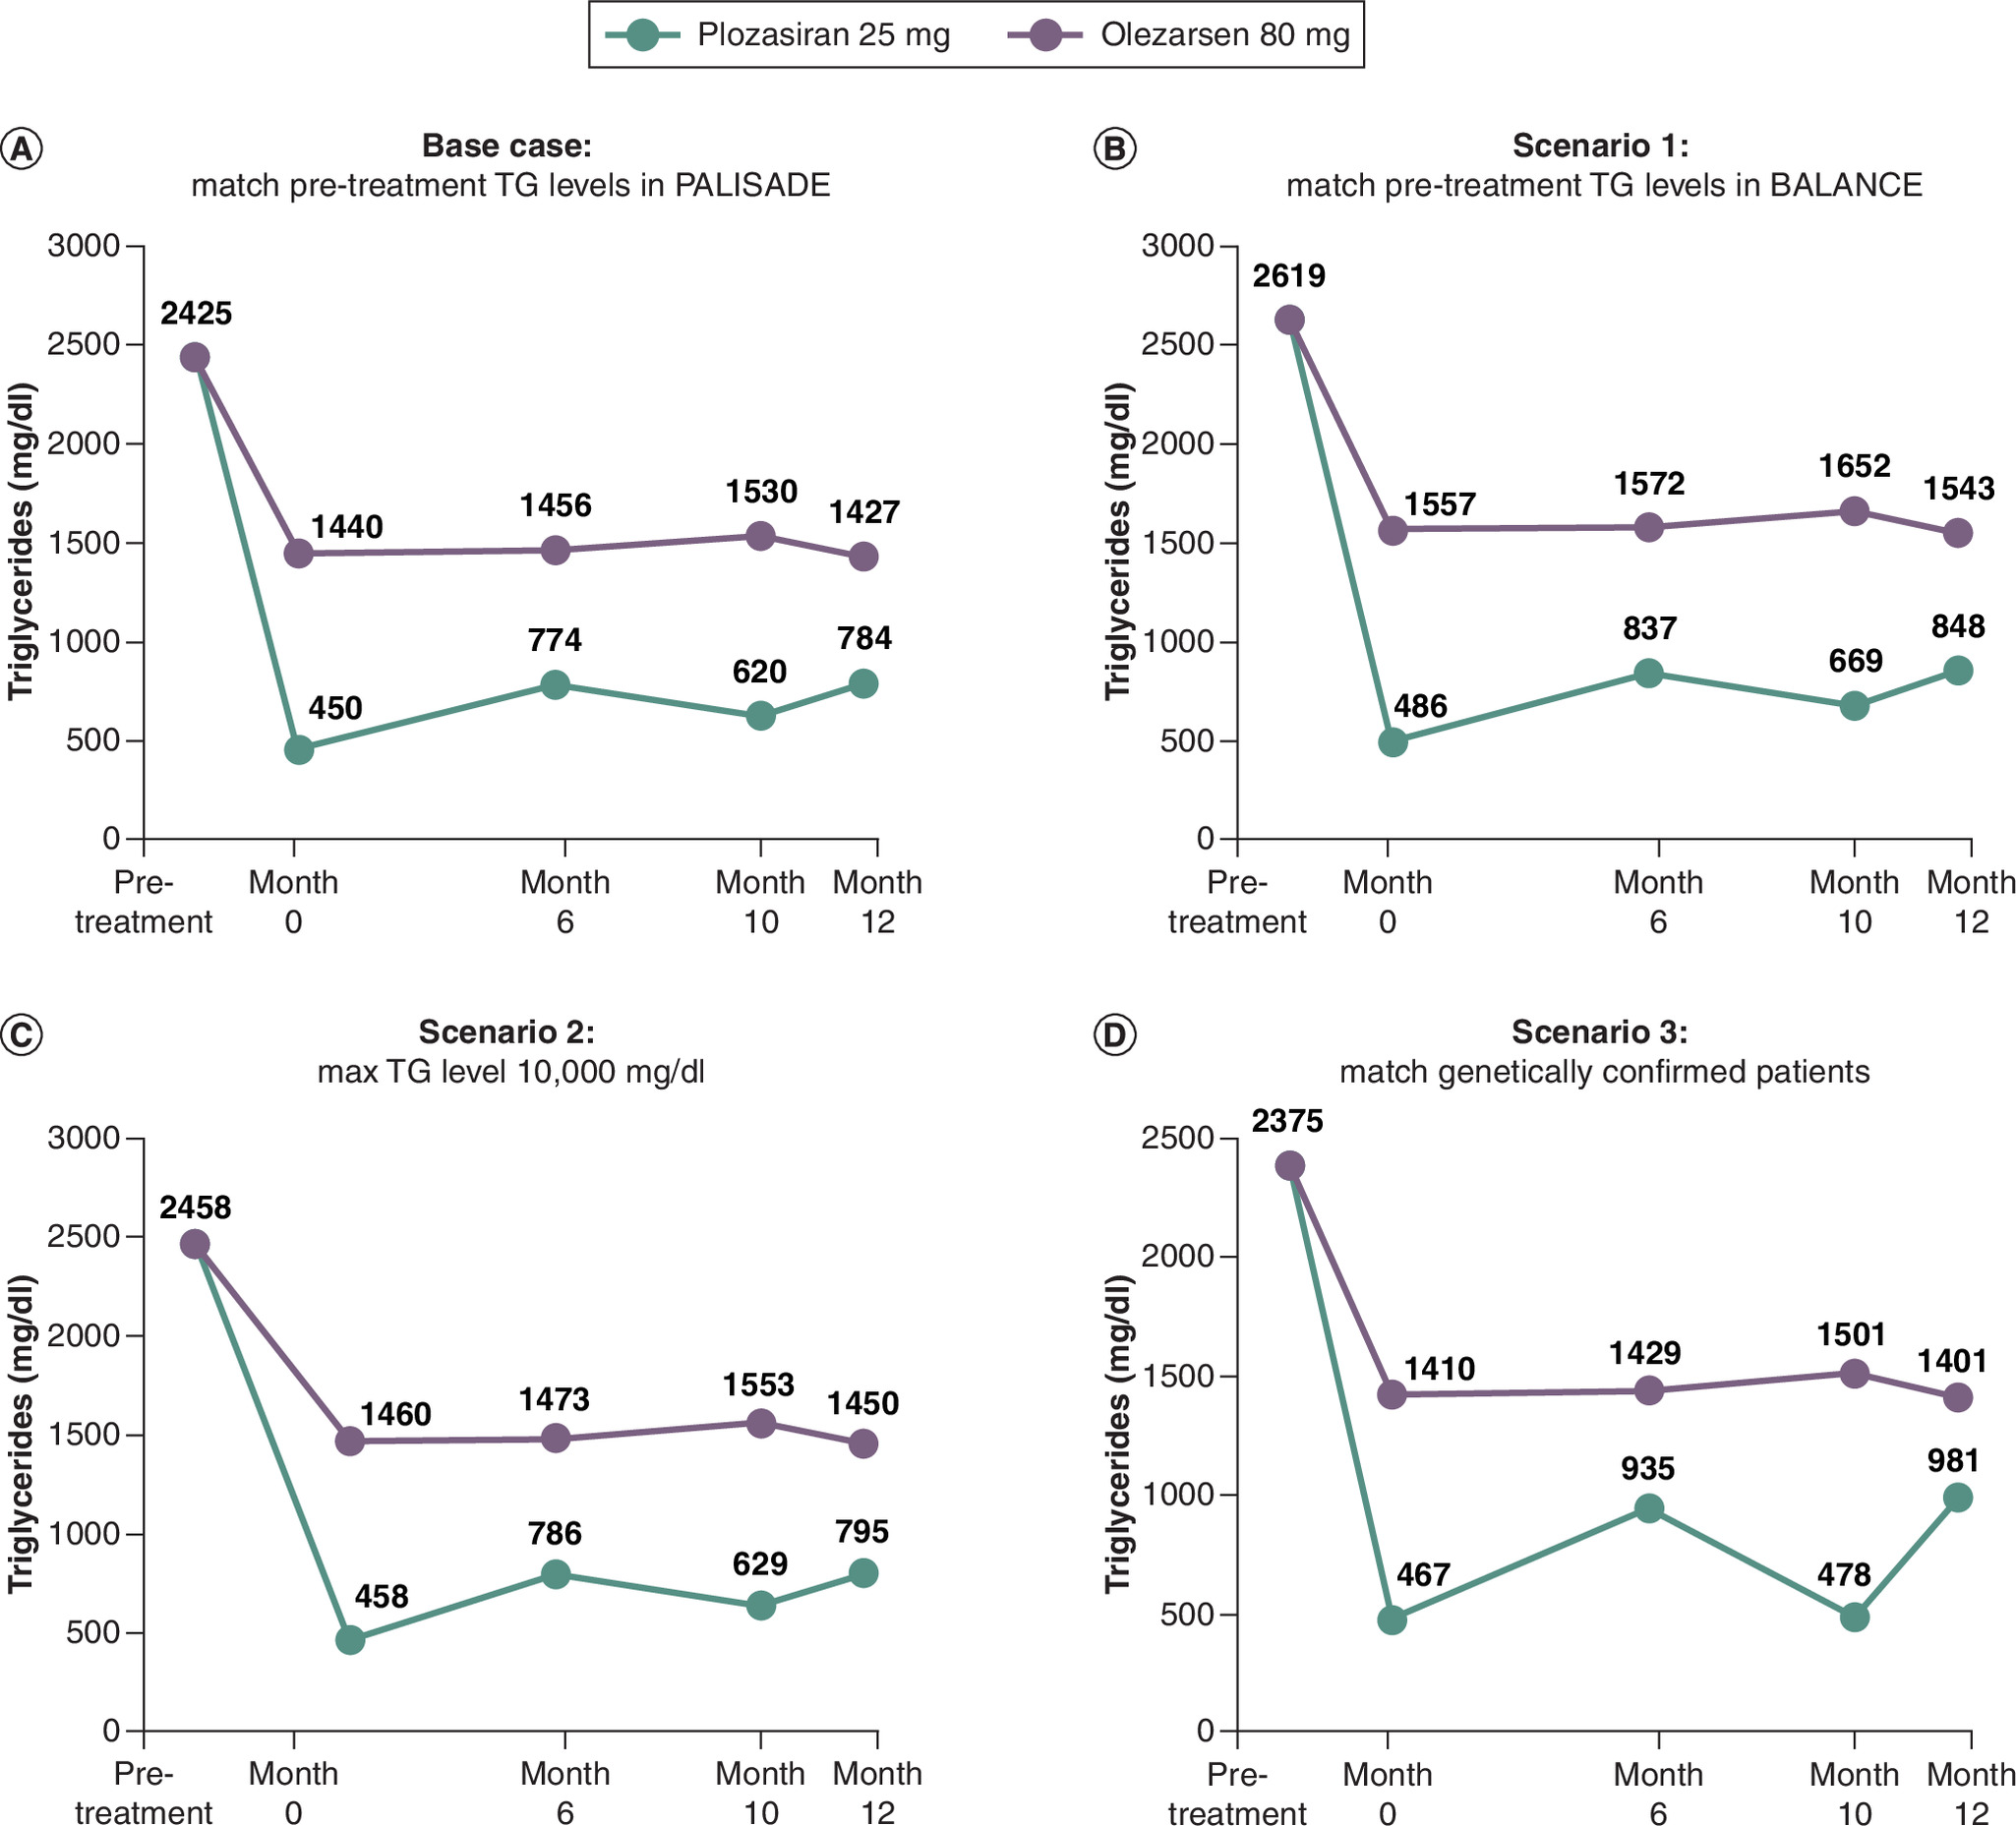
Figure 2. Mean pre-treatment and post-treatment triglyceride levels among simulated patients treated with plozasiran and olezarsen.
(A) The base case model uses a pre-treatment cohort constructed based on PALISADE. Pre-treatment TG levels were between 1000 and 7000 mg/dl and simulated patients with FCS that was either clinically diagnosed or genetically confirmed. (B) Scenario 1 changes the pre-treatment cohort to one based on the BALANCE trial cohort. (C) Scenario 2 expands the range of pre-treatment TG levels to 1000–10,000 mg/dl. (D) Scenario 3 changes the pre-treatment cohort to one based on only patients with genetically confirmed FCS within PALISADE.
FCS: Familial chylomicronemia syndrome; TG: Triglyceride.
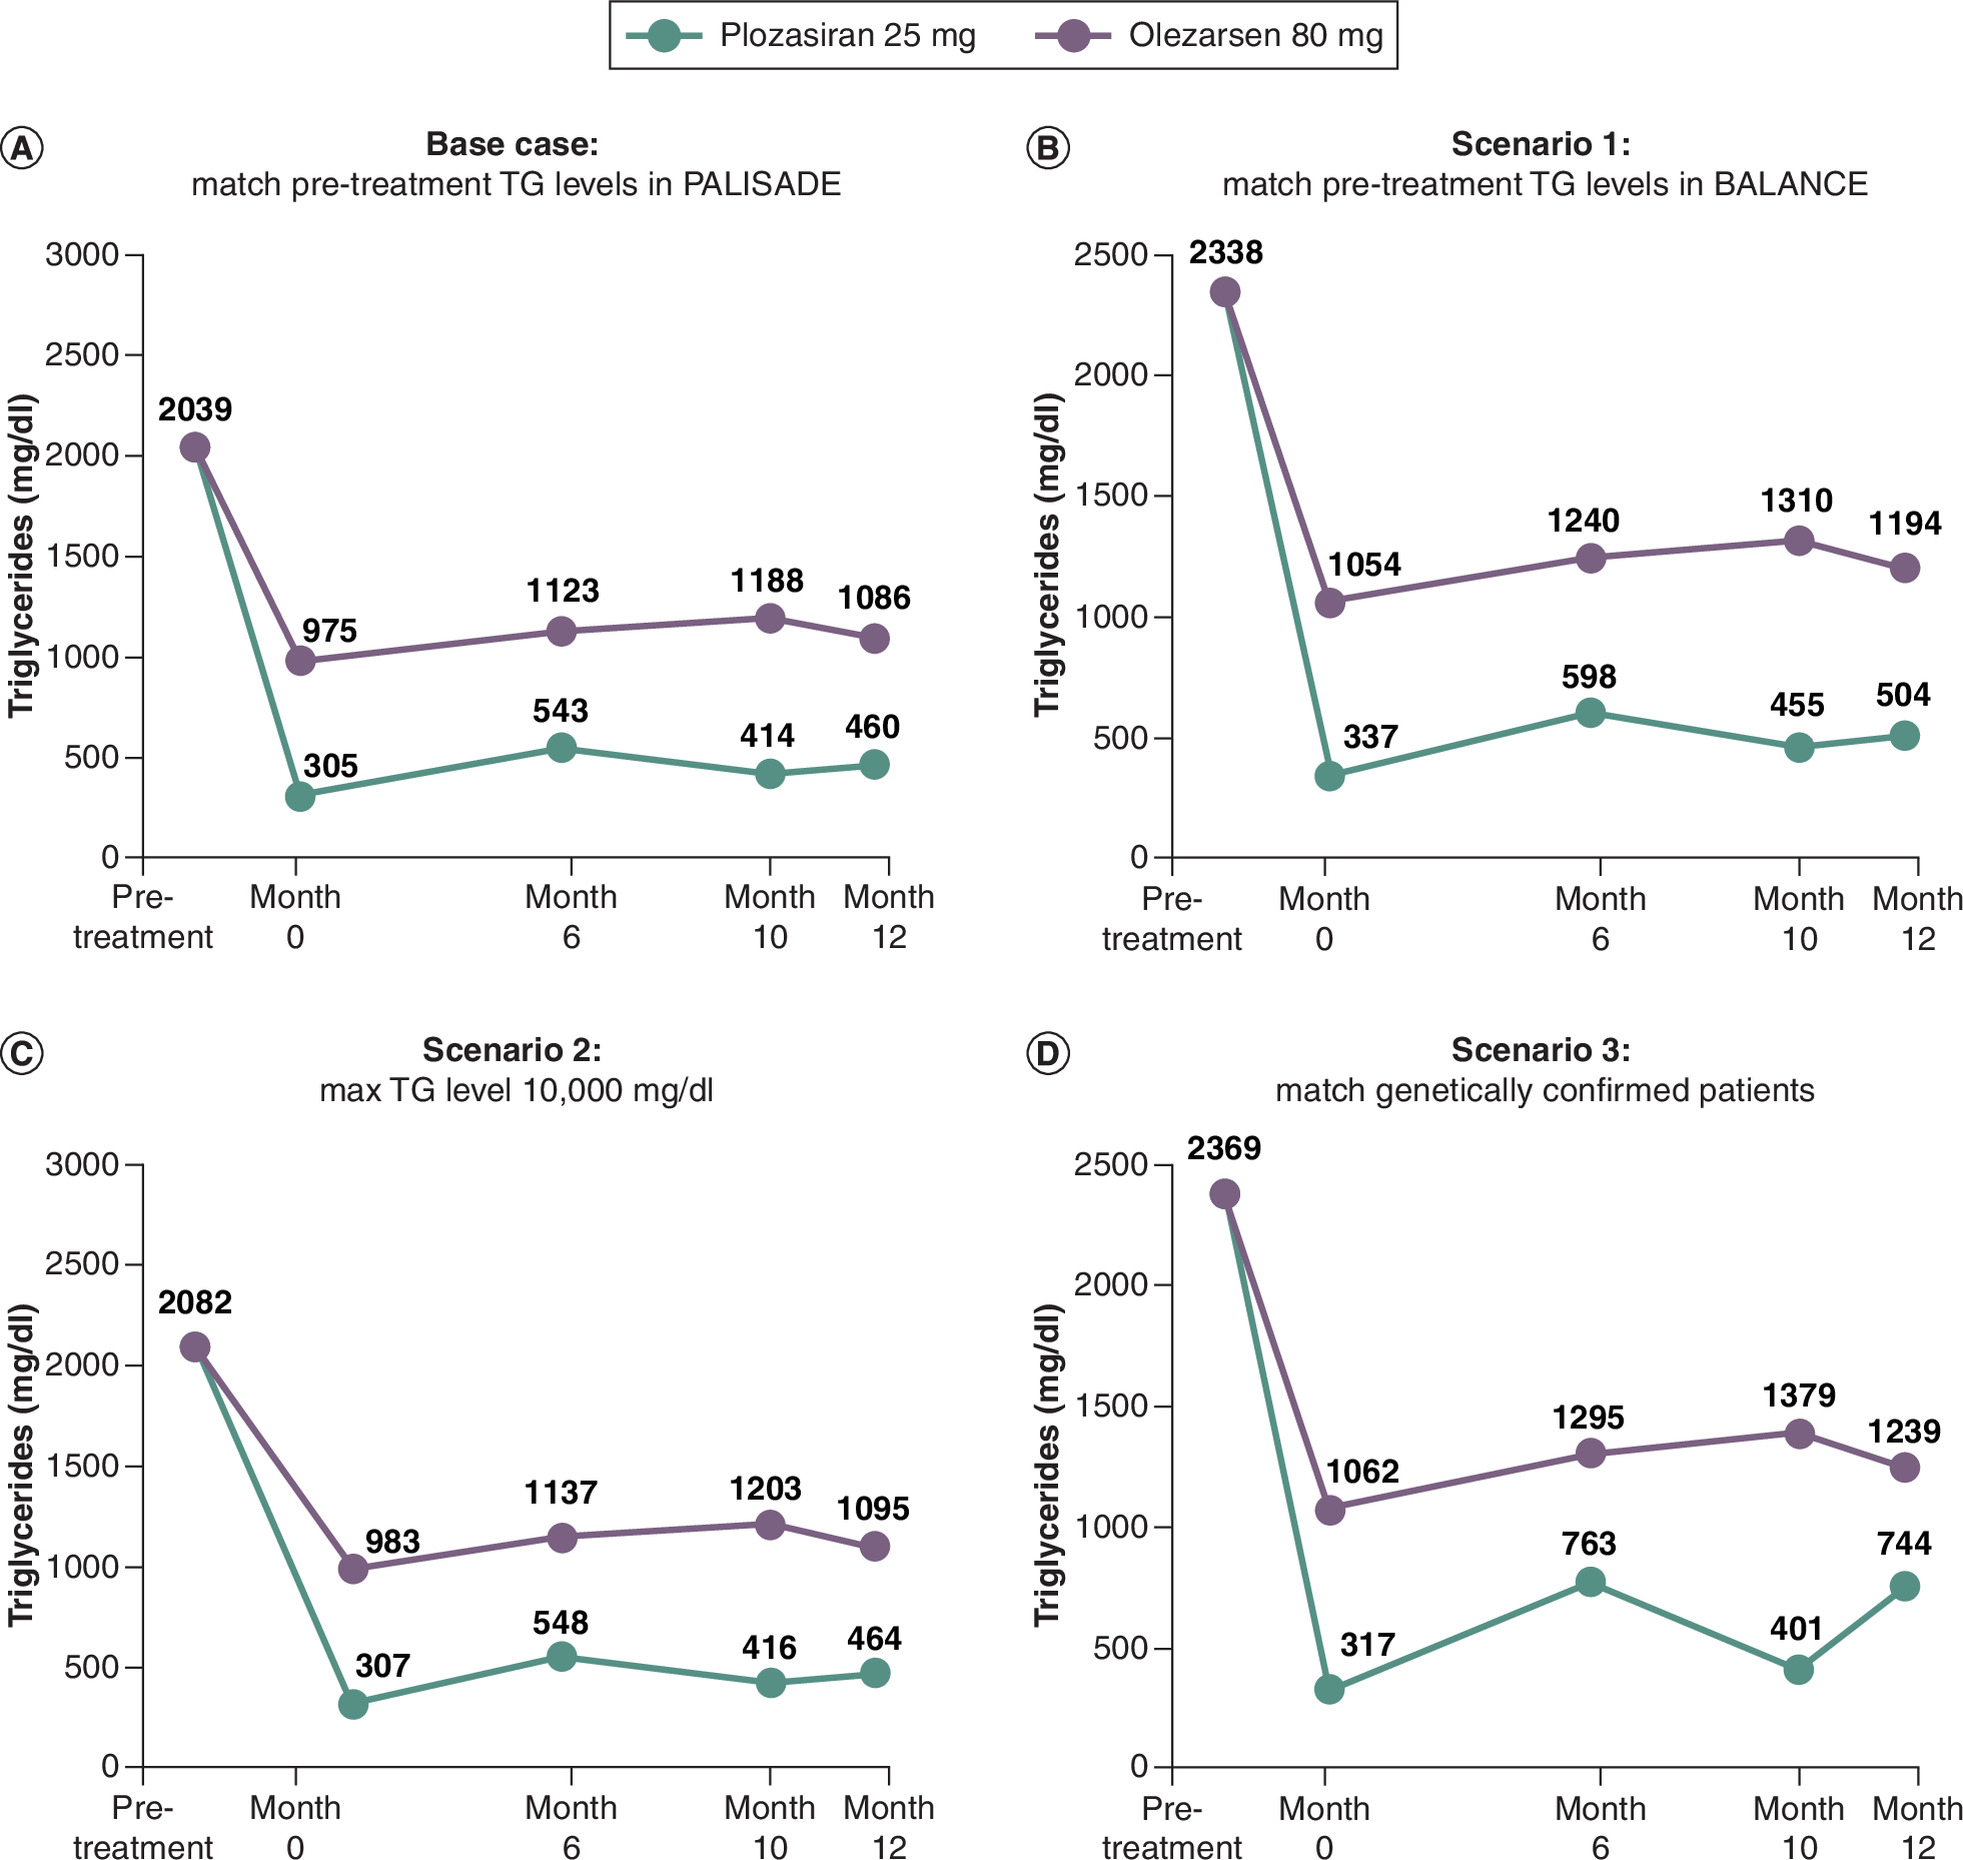
Figure 3. Median pre-treatment and post-treatment triglyceride levels among simulated patients treated with plozasiran and olezarsen.
(A) The base case model uses a pre-treatment cohort constructed based on PALISADE. Pre-treatment TG levels were between 1000 and 7000 mg/dl and simulated patients with FCS that was either clinically diagnosed or genetically confirmed. (B) Scenario 1 changes the pre-treatment cohort to one based on the BALANCE trial cohort. (C) Scenario 2 expands the range of pre-treatment TG levels to 1000–10,000 mg/dl. (D) Scenario 3 changes the pre-treatment cohort to one based on only patients with genetically confirmed FCS within PALISADE.
FCS: Familial chylomicronemia syndrome; TG: Triglyceride.
The model’s primary outcome was stable when the number of simulated patients was between 10 and 100,000.
The full distribution of simulated post-treatment TG levels for each scenario and time point are shown in Supplementary Figures 1–4, where the simulated post-treatment TG distributions are displayed. The post treatment TG distributions show which treatment is more likely to bring TG levels below clinically meaningful thresholds of 500 and 1000 mg/dl, how much overlap exists between treatments, what range of TG levels are expected in practice, after a given treatment, how wide the range of outcomes can be for any individual patient, the median TG levels expected to be achieved, and how the treatments compare when accounting for real-world variability.
Discussion
Despite the lack of a head-to-head clinical trial, this analysis suggests clinically important differences between plozasiran and olezarsen, with plozasiran being more effective in achieving TG levels <500 mg/dl in patients with FCS. Within the clinical trials, at the primary timepoint, all patients treated with plozasiran 25 mg (100%, n = 26 of 26 patients) saw reductions in TG levels compared with about three-quarters of patients treated with olezarsen 80 mg (77%, n = 17 of 22) [9,10]. Within the modeling scenario that was restricted to genetically confirmed FCS (59% of the PALISADE cohort) [15], the results were robust, suggesting that the difference in TG lowering between plozasiran and olezarsen was not due to differences in this specific inclusion criterion. For clinicians and patients making treatment decisions, these findings suggest that the modeled treatment outcomes with plozasiran were generally consistent across both genetically confirmed and clinically diagnosed patient populations.
Among simulated FCS patients treated with plozasiran, the proportion of patients who achieved TG levels <500 mg/dl was greater at months 1 and 10 compared with months 6 and 12. However, the difference in the proportion of patients (plozasiran vs olezarsen) who achieved TG levels <500 mg/dl was qualitatively similar across time points. The variation in TG levels across time points among those treated with plozasiran likely reflects the peaks and troughs that occur prior to the next scheduled dose, as plozasiran is a quarterly administered agent. Despite these fluctuations, plozasiran sustained a durable treatment response.
In designing the model for this comparative effectiveness study, many considerations were applied including the differences in outcomes reporting of TGs in each study – medians (in the case of PALISADE) and means (in the case of BALANCE) of TGs and differences in the dosing schedule per intervention – monthly dosed antisense oligonucleotide (ASO) in the BALANCE study versus the quarterly dosed small interfering RNA (siRNA) in the PALISADE study. To account for the peaks and troughs in the outcomes due to the dosing schedule and the differences in timing of the primary and secondary end points in the two trials, four timepoints were considered in our analysis to ensure overlap. Finally, while the inclusion criteria in both studies were different – BALANCE only enrolled patients who were genetically confirmed to have FCS and PALISADE enrolled a broader population of patients with either clinically and/or genetically confirmed FCS – as noted above, similarity in responses with the two agents in the two reference studies allowed for this comparison. The model’s findings depend on the validity of the modeling assumptions which were tested through the scenario analyses and found to be robust. The model was further validated by examining congruence of simulated data with data from the two reference clinical trials (Supplementary Table 1).
A recent matching-adjusted indirect comparison provides a comparative assessment of plozasiran and olezarsen based on the PALISADE and BALANCE trials [16]. The study found no statistically significant differences between the efficacy and safety of plozasiran versus olezarsen. Matching-adjusted indirect comparison is an appropriate methodology in this context, however, the effective sample size in this particular analysis is small which may result in unstable estimates susceptible to undue influence from individual observations. Additionally, differences between the findings of that analysis and the present study may reflect differences in methodology, study assumptions, end point definitions, outcome assessment timing and analytic objectives. Our microsimulation approach was designed to evaluate treatment effects within a common synthetic cohort and to estimate the likelihood of achieving clinically relevant TG thresholds over time. Taken together, these analyses highlight both the value and uncertainty of indirect treatment comparisons in the absence of randomized head-to-head evidence.
This study has several limitations. First, the model relies on inputs from two clinical trials which differ in their design, trial sites and inclusion criteria. Second, the model relies on aggregate trial data. The absence of individual-level covariates reduces the model’s ability to adjust for differences between the treatment groups (aside from outcome differences in patients with and without genetic confirmation of FCS, tested in scenario 3). While the consistency of results across the trial-based synthetic cohorts suggests that the findings were generally robust to the evaluated model assumptions, residual confounding between the PALISADE and BALANCE trials may remain because important patient-level characteristics and study differences could not be fully accounted for. Consequently, the results should be interpreted as exploratory and hypothesis-generating and should not be considered equivalent to evidence derived from a randomized head-to-head comparison of plozasiran and olezarsen. Third, measures of statistical significance were not used because microsimulations with a sufficiently large sample size will converge around the expected value, with 95% CIs near zero. In such settings, p-values offer limited interpretability because they can become arbitrarily small. Finally, a common limitation of simulation studies is sensitivity to model assumption and input parameters. In the present analysis, percentage changes in TG levels from baseline were assumed to follow a modified beta distribution, consistent with prior studies [17]. Although this approach provides a flexible framework for modeling TG responses, it cannot be excluded that alternative distributional assumptions or uncertainty in treatment-effect estimates may influence the results. Given these limitations, the model should be interpreted as a simplified, population-level approximation.
Elevated TG levels >500 mg/dl are a well-established risk factor for AP [18]. AP is associated with substantial mortality, morbidity, hospitalization and healthcare costs [19]. Because elevated TG levels are a recognized risk factor for AP, achieving and maintaining lower TG concentrations may be clinically relevant; however, the present analysis did not directly evaluate AP outcomes.
Conclusion
This microsimulation model suggests that plozasiran is more potent at reducing TG levels compared with olezarsen in patients with FCS. This study contributes to the limited evidence base evaluating comparative treatment outcomes in FCS, through a transparent and reproducible modeling framework.
Summary points
•
Familial chylomicronemia syndrome (FCS) is a serious disorder characterized by severe hypertriglyceridemia, which is a risk factor for life-threatening acute pancreatitis.
•
This study aimed to indirectly compare the effectiveness of two novel APOC3 RNA inhibitors – plozasiran and olezarsen – in lowering triglyceride (TG) levels in FCS patients.
•
An individual patient microsimulation model was developed using Monte Carlo sampling to simulate TG level outcomes for both treatments across a synthetic patient cohort.
•
Treatment response was modeled using a modified beta distribution, with parameters derived from the two pivotal clinical trials – the PALISADE trial (plozasiran) and the BALANCE trial (olezarsen).
•
The key outcome of interest was the proportion of patients achieving TG levels below 500 mg/dl, a clinically meaningful threshold for reduced pancreatitis risk.
•
At 10 months post-treatment, 56.8% of simulated plozasiran-treated patients achieved TG levels <500 mg/dl, compared with only 18.2% of olezarsen-treated patients.
•
The superiority of plozasiran over olezarsen was consistent across all three scenario analyses and all evaluated timepoints, supporting the robustness of the findings.
•
The microsimulation model demonstrated strong stability, and was validated against reference clinical trial data.
•
The model suggests that plozasiran has greater efficacy than olezarsen in reducing TG levels in FCS patients, with potential clinical benefits in preventing acute pancreatitis episodes.
•
As this was an indirect, simulation-based comparison rather than a head-to-head randomized clinical trial, the findings should be considered exploratory and interpreted with appropriate caution.
Author contributions
NR Desai: conceptualization, methodology, writing – review and editing. K Bognar: conceptualization, methodology, writing – reviewing and editing, software, validation, formal analysis, visualization. A Speller: conceptualization, methodology, writing – original draft, writing – reviewing and editing, formal analysis, visualization, project administration. AK Das: conceptualization, methodology, writing – reviewing and editing.
Financial disclosure
This study was sponsored by Arrowhead Pharmaceuticals Inc. (CA, USA).
Competing interests disclosure
NR Desai works under contract with the Centers for Medicare and Medicaid Services to develop and maintain performance measures used for public reporting and pay for performance programs. He reports research grants and consulting for Amgen, Arrowhead, Astra Zeneca, Bayer, Boehringer Ingelheim, Bristol Myers Squibb, CSL Behring, CSL Vifor, Cytokinetics, Merck, Milestone, Novartis, scPharmaceuticals, Verve Therapeutics. K Bognar, AK Das and A Speller are employed by ADVI Health LLC. The authors have no other competing interests or relevant affiliations with any organization or entity with the subject matter or materials discussed in the manuscript apart from those disclosed.
Writing disclosure
Financial support for writing, editing and materials was provided by Arrowhead Pharmaceuticals.
Open access
This work is licensed under the Attribution-NonCommercial-NoDerivatives 4.0 Unported License. To view a copy of this license, visit https://creativecommons.org/licenses/by-nc-nd/4.0/
References
Papers of special note have been highlighted as: • of interest; •• of considerable interest
1.
Davidson M, Stevenson M, Hsieh A et al. The burden of familial chylomicronemia syndrome: results from the global IN-FOCUS study. J. Clin. Lipidol. 12, 898–907 e892 (2018).
2.
Regmi M, Rehman A. Familial hyperchylomicronemia syndrome. In: StatPearls. StatPearls Publishing, FL, USA (2023).
3.
Saadatagah S, Larouche M, Naderian M et al. Recognition and management of persistent chylomicronemia: a joint expert clinical consensus by the National Lipid Association and the American Society for Preventive Cardiology. Am. J. Prev. Cardiol. 22, 100978 (2025).
4.
Garg PK, Singh VP. Organ failure due to systemic injury in acute pancreatitis. Gastroenterology 156, 2008–2023 (2019).
5.
Javed F, Hegele RA, Garg A et al. Familial chylomicronemia syndrome: an expert clinical review from the National Lipid Association. J. Clin. Lipidol. 19, 382–403 (2025).
• Comprehensive clinical review of familial chylomicronemia syndrome.
6.
Blumenthal RS, Morris PB, Gaudino M et al. 2026 ACC/AHA/AACVPR/ABC/ACPM/ADA/AGS/APhA/ASPC/NLA/PCNA guideline on the management of dyslipidemia: a report of the American College of Cardiology/American Heart Association Joint Committee on Clinical Practice Guidelines. J. Am. Coll. Cardiol. 87(19), 2624–2757 (2026).
7.
Handelsman Y, Jellinger PS, Guerin CK et al. Consensus statement by the American Association of Clinical Endocrinologists and American College of Endocrinology on the management of dyslipidemia and prevention of cardiovascular disease algorithm – 2020 Executive Summary. Endocr. Pract. 26, 1196–1224 (2020).
8.
Packard CJ, Pirillo A, Tsimikas S, Ference BA, Catapano AL. Exploring apolipoprotein C-III: pathophysiological and pharmacological relevance. Cardiovasc. Res. 119, 2843–2857 (2024).
9.
Watts GF, Rosenson RS, Hegele RA et al. Plozasiran for managing persistent chylomicronemia and pancreatitis risk. N. Engl. J. Med. 392, 127–137 (2025).
•• Publication reporting on the pivotal, randomized, placebo-controlled trial of ploazsiran.
10.
Stroes ESG, Alexander VJ, Karwatowska-Prokopczuk E et al. Olezarsen, acute pancreatitis, and familial chylomicronemia syndrome. N. Engl. J. Med. 390, 1781–1792 (2024).
•• Publication reporting on the pivotal, randomized, placebo-controlled trial of olezarsen.
11.
Caglayan C, Terawaki H, Chen Q, Rai A, Ayer T, Flowers CR. Microsimulation modeling in oncology. JCO Clin. Cancer Inform. 2, 1–11 (2018).
12.
Rutter CM, Zaslavsky AM, Feuer EJ. Dynamic microsimulation models for health outcomes: a review. Med. Decis. Making 31, 10–18 (2011).
•• Overview of simulation methodology.
13.
Watts GF, Hegele RA, Rosenson RS et al. Temporal effects of plozasiran on lipids and lipoproteins in persistent chylomicronemia. Circulation 151, 733–736 (2025).
14.
Arrowhead Pharmaceuticals Inc. Data on File. (2025).
15.
Watts GF, Hegele RA, Rosenson RS et al. PALISADE: plozasiran decreases the risk of acute pancreatitis and may improve the quality of life in familial chylomicronemia syndrome. Am. J. Prev. Cardiol. 23, 101140 (2025).
16.
Sikora Kessler A, Serafini P, Pushkarna D et al. Comparative efficacy and safety of olezarsen vs plozasiran for familial chylomicronemia syndrome: a matching-adjusted indirect comparison. J. Clin. Lipidol. 20, 1503–1507 (2026).
17.
Cannon CP, Khan I, Klimchak AC, Reynolds MR, Sanchez RJ, Sasiela WJ. Simulation of lipid-lowering therapy intensification in a population with atherosclerotic cardiovascular disease. JAMA Cardiol. 2, 959–966 (2017).
18.
Gelrud A, Williams KR, Hsieh A, Gwosdow AR, Gilstrap A, Brown A. The burden of familial chylomicronemia syndrome from the patients' perspective. Expert Rev. Cardiovasc. Ther. 15, 879–887 (2017).
19.
Broder MS, Chang E, Villa KF, Wong ND. Health outcomes and survival among patients with severe hypertriglyceridemia after acute pancreatitis. J. Clin. Lipidol. 19, 1687–1696 (2025).
Information & Authors
Information
Published In
Copyright
© 2026 Arrowhead Pharmaceuticals. This work is licensed under the Attribution-NonCommercial-NoDerivatives 4.0 Unported License
History
Received: 23 June 2026
Accepted: 30 September 2026
Published online: 18 November 2026
Keywords:
Topics
Authors
Metrics & Citations
Metrics
Article Usage
Article usage data only available from February 2023. Historical article usage data, showing the number of article downloads, is available upon request.
Citations
How to Cite
Translating clinical trial efficacy data into population-level impact: a microsimulation model to compare APOC3 RNA inhibition on lowering triglycerides. (2026) Journal of Comparative Effectiveness Research. DOI: 10.57264/cer-2026-0095
Export citation
Select the citation format you wish to export for this article or chapter.