A process to validate prognostic factors for unanchored matching-adjusted indirect comparison of single-arm trials in oncology: a proof-of-concept study
Publication: Journal of Comparative Effectiveness Research
Abstract
Aim: The choice of covariates in unanchored matching-adjusted indirect comparisons (MAICs) of single-arm cancer trials with time-to-event outcomes remains a challenge. Currently, there is a lack of a systematic approach for validating the selection of covariates for bias reduction in unanchored MAIC. Materials & methods: This study proposes a validation framework to evaluate the appropriateness of selected prognostic factors before their use in unanchored MAIC. The process involves identifying potential prognostic factors from individual patient data and calculating risk scores using the prognostic factors with regression; artificially creating two groups that are unbalanced in risk such that a predetermined hazard ratio (HR) between the two groups is achieved; creating weights based on the prognostic factors; running a re-weighted Cox regression to assess the HR, the value of which should suggest balanced risks across groups to indicate the sufficiency of prognostic factors being included. We also conducted a proof-of-concept analysis using a simulated dataset to showcase this process. Results: The process successfully stratified the sample into two risk groups with a pre-determined HR of 1.8. When all covariates were included in the weighting, the HR was 0.9157 (95% CI: 0.5629–2.493), which was close to one. When one of the critical prognostic factors was omitted from the covariates, the HR became 1.671 (95% CI: 1.194–2.340), which was significantly different from one. Conclusion: Filling a gap in the existing evidence synthesis literature, the study introduces a structured data-driven approach for covariate prioritization in unanchored MAIC. The process may be a useful tool for quantitative covariate selection.
Plain language summary: a new method to make better comparisons between cancer treatments when direct comparisons are not possible
What is this article about?
Sometimes health technology assessment researchers need to compare different cancer treatments, but they do not have studies that directly compare them. Instead, they might only have separate studies of each treatment. This article presents a new method to help researchers make these indirect comparisons more accurately. The method helps identify which patient characteristics (like age or disease severity) need to be considered when comparing treatments to ensure the comparison is fair and reliable.
What were the results?
The researchers tested their new method using simulated patient data designed to mimic real-world scenarios. They created two groups of patients with known differences and then tested if their method could properly account for these differences. The method successfully showed that when all important patient characteristics were included, the comparisons were accurate. However, when they left out important characteristics (like patient age), the comparisons became less reliable.
Why is this important?
When comparing cancer treatments using data from separate studies, researchers need to carefully choose which patient characteristics to consider in their analysis. Including too many characteristics can make the results less precise, while missing important ones can lead to incorrect conclusions. Until now, researchers did not have a systematic way to validate their choices. This new method helps solve this problem by providing a data-driven approach to confirm whether the chosen patient characteristics are appropriate for making reliable treatment comparisons. This improves the quality of indirect treatment comparisons, which is crucial when direct comparison studies are not available. By helping researchers validate their choices of which patient characteristics to include, this method makes the comparison of different cancer treatments more reliable and trustworthy.
In recent years, matching-adjusted indirect comparison (MAIC) has gained popularity as an important tool in the comparative effectiveness research of cancer therapies [1]. MAIC was proposed to facilitate evidence synthesis in the absence of common comparators, a scenario where traditional methods like network meta-analysis are not applicable and naive comparisons are not permissible [1,2]. The application of MAIC is particularly relevant when dealing with single-arm trials, which are often excluded from traditional network meta-analysis due to the lack of a common control group with other trials [3].
The MAIC methodology involves several key steps, starting with the identification of relevant studies and the extraction of individual patient data (IPD) for one treatment arm. Subsequently, propensity scores are calculated based on observed covariates, and these scores are used to re-weight the IPD to match the aggregate data (AgD) of the comparator arm [1,4,5]. The re-weighted IPD is then compared with the AgD with respect to the outcomes to estimate the treatment effect [1]. The data requirements for MAIC are stringent, necessitating access to IPD for at least one treatment arm and AgD for the comparator arm [3]. The quality of the MAIC analysis is directly proportional to the comprehensiveness of these datasets. The more complete the covariate information, the more accurate and reliable the MAIC estimates can become [6].
A critical issue in MAIC is that hazard ratios (HRs), which are commonly used to quantify comparative effectiveness of time-to-event outcomes like progression-free survival (PFS) and overall survival are noncollapsible effect measures [7]. This issue is further complicated in unanchored MAIC, where the absence of a common comparator can easily introduce bias into the estimates of HRs on top of the bias due to noncollapsibility [8,9].
The challenges to the validity of MAIC involving single-arm trials can be posed by at least two types of variables. Namely, they are effect modifiers and prognostic factors [10]. Effect modifiers are variables that interact with the treatment to influence the outcome, while prognostic factors are variables that are associated with the outcome irrespective of the treatment. The unbiasedness of comparisons based on single-arm trials are highly vulnerable to the omission of prognostic factors. This omission can result in biased estimates and may compromise the validity of the comparative effectiveness results [5]. Specifically, the MAIC estimates may reflect the imbalance in prognostic factors rather than the true treatment effect when the former are not accounted for [4,11].
The challenge of including the correct set of prognostic factors is further complicated by the trade-off between statistical power and covariate specification. The UK National Institute for Health and Care Excellence (NICE) Technical Support Document 18 recommends including all prognostic factors and treatment effect modifiers in the matching process of unanchored MAIC [12]. However, in practice, the determination of appropriate specification is not always straightforward. Overspecification can lead to a loss of power, while underspecification can result in biased estimates [13]. This trade-off is particularly acute when dealing with time-to-event outcomes, where the confidence intervals (CIs) can be wide and less informative due to the incomplete follow-up of a fraction of individuals [8]. While a regression can identify statistically significant prognostic factors, it does not address the question of whether the chosen set of covariates is sufficient to mitigate bias in unanchored MAIC. Furthermore, including all significant covariates from a regression may lead to overfitting and loss of statistical power, particularly when dealing with limited sample sizes. Given these challenges, there is an urgent need for a methodological framework that can validate or identify the minimum set of prognostic factors required for a reliable unanchored MAIC. Building upon insights from the existing literature this study aims to propose a novel process for prioritizing the covariates used in unanchored MAIC based on single-arm trials with time-to-event outcomes. The method can both validate a prespecified set of covariates and iteratively reduce an initial list to a minimal sufficient set. Researchers may start with all plausible prognostic factors and sequentially remove nonessential covariates if validation shows no loss of balance.
Our proposed method deliberately creates an imbalance in the hazards within the IPD of a single-arm trial. By creating artificial groups within the IPD, we introduce a controlled imbalance to test the sufficiency of the chosen set of covariates. The purpose of this step is to ensure that the selected covariates can effectively balance the hazards within the arm, which is a necessary condition for reducing bias in unanchored MAIC. We then assess whether the reweighting mechanisms, based on these covariates, can successfully rebalance the hazards. This internal validation step is crucial because it demonstrates that the selected covariates are capable of mitigating within-arm imbalances, thereby providing confidence that they will also be effective in balancing the IPD against the AgD from the comparator study in practical applications of unanchored MAIC. For any practical application of unanchored MAIC, access to IPD for at least one treatment arm is a prerequisite. This available IPD can be exploited to validate the sufficiency of prognostic factors by ensuring that they balance within-arm hazards. By doing so, we offer an additional tool for conducting comparative effectiveness research of cancer therapies.
Materials & methods
Bias caused by omitted prognostic factors
The standard unanchored MAIC often assumes that the prognostic factors are sufficiently captured without testing this assumption. When this assumption is violated, the estimates can be biased [14]. Prognostic factors are variables that are predictive of the outcome but do not affect the relative effectiveness of treatment. In the context of time-to-event outcomes, which are inherently noncollapsible, the omission of these factors can disproportionately increase bias because the outcomes are not linear combinations of the covariates. For simplicity, we use PFS as an example, but the rationale can extend to other outcomes of this nature.
The Cox proportional hazard model, the leading approach to analyze time-to-event outcomes, allows us to estimate the baseline cumulative hazard function, the hazard at each time point, and the hazard after adjusting for a specific set of covariate values. However, the omission of important prognostic factors in the model can introduce bias into these estimates. More formally, the hazard function can be represented as
(Equation 1)
where h0(t) is the baseline hazard function, represents the vector of coefficients, and is the matrix of covariates. If an important prognostic factor Xk is omitted, the hazard function is misspecified as
(Equation 2)
Since unanchored MAIC relies on the prediction of the absolute outcomes using the covariates, omitting Xk does not recover the same predicted value of the outcome as when it is included, thereby leading to bias due to misspecification [6].
Rationale of the proposed process
To address this issue, we propose a process to guide the choice of covariates to reduce the bias caused by the omission of prognostic factors by splitting the IPD available to the researchers. The process involves: using the IPD from a single-arm trial to run a regression and determine how the candidate covariates contribute to the outcome; splitting the sample of the single-arm trial IPD into two groups based on these covariates to create artificial imbalance in the outcomes between the two groups; creating weights based on the covariates; and performing re-weighted analyses across these two groups to test the adequacy of the chosen set of covariates in adjusting for confounding caused by the covariates. The proposed method aims to iteratively test and refine the minimum set of covariates required to mitigate bias in unanchored MAIC involving time-to-event outcomes by starting from a broader candidate list of prognostic factors. This process ensures the selected covariates achieve relatively adequate adjustment for confounding while avoiding substantial loss of statistical power, thereby balancing unbiasedness and statistical power. The objective is not to incorporate as many prognostic factors as possible, but rather to identify a parsimonious model that balances the trade-off between unbiasedness and statistical power.
Consider two individuals, one from each of the artificially created groups A and B. The hazard function for an individual i in group A and an individual j in group B can be represented as
(Equation 3)
(Equation 4)
Here, h0|(t) is the common baseline hazard for both groups, as they come from the same trial. The covariates X1iA, X2iA, …, XpiA, and X1jB, X2jB, …, XpjB, are specific to each individual. If the hazards across the two groups converge to the same value after reweighting based on the covariates, it would imply that the chosen set of covariates is adequate for adjusting the confounding caused by the covariates. This can be expressed as
(Equation 5)
Here, WA and WB represent the vectors of the weights of groups A and B created using the covariates, respectively. If this equality holds, it validates the minimum set of covariates required for unbiased estimation.
Steps of implementing the process
Step 1: Cox regression for risk score calculation
Calculate the risk score R for each individual using a Cox regression model. The risk score R is not a simple linear combination of the covariates X but is derived from the Cox regression model itself. It can be interpreted as the HR relative to the sample average for all p predictor variables. Specifically, for an individual with covariate values ,
(Equation 6)
(Equation 7)
where is the IPD sample mean of the kth predictor.
Step 2: Splitting the IPD into two groups with unbalanced risks
Based on the created risk scores, we further create two internally split groups using the IPD. The HR between the two groups should be at least as large as the unadjusted HR between the IPD and the target trial of interest. The choice of the HR threshold between the two artificially created groups is somewhat arbitrary. However, to effectively test the robustness of the selected covariates in reducing bias, it is desirable to create a nontrivial HR. Setting the HR between the two groups to be at least as large as the unadjusted HR between the IPD and the target trial of interest serves as a reasonable starting point. This approach ensures that the artificial imbalance created is substantial enough to assess the effectiveness of the covariate selection process. This can be achieved in numerous different ways. A procedure that is relatively easy to implement is introduced in steps 2–4. To begin with, we split the individuals into quartiles based on the calculated risk scores . The first and third quartiles are combined into one group (Group A, supposed to be the higher risk group), and the rest into another group (Group B, supposed to be the lower risk group).
Step 3: Initial HR estimation
The third step is to estimate the initial HR between Group A and Group B using a Cox regression model with the group indicator as the only explanatory variable. Notice that covariates should not be included in this analysis:
(Equation 8)
Step 4: Iterative adjustment
•
Draw one individual from each group (Group A and Group B).
•
Starting with in the first iteration, if , place the higher-risk individual in Group B; if , swap the higher-risk individual to Group A.
•
Re-estimate the HR and iterate until .
While we used 0.001 in our illustration, we recommend setting the tolerance to at least match the number of decimal places typically used when reporting HRs in the disease area of interest. For example, if HRs in the field of interest are typically reported to two decimal places, a tolerance of 0.01 would be appropriate.
Step 5: Propensity score estimation & weight calculation
Next, estimate the propensity scores, p, using a logistic regression:
(Equation 9)
Then, calculate the weights w as follows:
(Equation 10)
It is important to note that the approach of IPD-level inverse probability weighting using propensity scores to balance the covariates between the two artificially created groups described here is used specifically for the purpose of validating the chosen set of covariates within the IPD and does not directly reflect the weighting methodology employed in a typical MAIC analysis. In actual MAIC, aggregate-level methods such as entropy balancing or method-of-moments are used to achieve covariate balance between the IPD and the target trial. However, the fundamental principle of balancing on observed covariates remains consistent.
Step 6: Re-weighted Cox regression
Finally, a weighted Cox regression is conducted using the calculated weights to estimate the adjusted HR.
(Equation 11)
The adjusted HR should be close to one if the included covariates sufficiently represented prognostic factors. If the initial unadjusted HR was greater (less) than one and the adjusted HR stayed substantially above (below) one after reweighting, then the covariate list is missing important prognostic factors.
A proof-of-concept example
To test the proposed process, we conducted a proof-of-concept example using simulated data. The dataset comprised 200 observations, each representing a hypothetical patient. Four covariates were generated. Namely, they were age, tumor size, previous therapy and the Eastern Cooperative Oncology Group (ECOG) performance score. The definitions, ranges and coefficients of the values (in the linear component) are presented in Table 1.
| Covariate | Definition | Range | Coefficient |
|---|---|---|---|
| Age (years) | Age of the patient | 40–80 | 0.06 |
| Tumor size (cm) | Size of the tumor in cm | 1–10 | 0.12 |
| Previous therapies (n) | Previous lines of therapy received (n) | 0–3 | 0.11 |
| ECOG score | ECOG performance status score | 0–4 | 0.1 |
To be consistent with the previous explanation of the process, we engaged PFS as the outcome in the simulation. PFS was simulated using a Weibull distribution with a shape parameter of 1.5. The scale parameter was determined by the exponential of the linear combination of the covariates and their respective coefficients. Censoring times were uniformly distributed between 0 and the maximum survival time.
A Cox proportional hazards model was fitted to the simulated data by incorporating all the covariates. The risk scores were calculated based on this Cox model. The calculated risk scores were then used to categorize the patients into quartiles. Patients were divided into two groups based on the corresponding quartiles of risk scores. Specifically, patients in the 1st and 3rd quartiles of risk scores were combined into one group (labeled ‘HighRisk’), and the rest were placed in another group (labeled ‘LowRisk’). Following this crude grouping, the initial HR between the two groups was calculated. An iterative adjustment loop was employed to bring this HR closer to a predetermined target HR of 1.8, with a tolerance level of 0.001. During each iteration, one individual was randomly selected from each group, and their risk scores were compared. Based on the comparison and the current HR, individuals were either swapped between the groups to move the HR closer to the target or maintained in the current groups. The iteration process was repeated until the desired HR of 1.8 was achieved.
Upon the creations of the two groups, propensity scores were estimated using a logistic regression model, where the dependent variable was the binary group indicator (1 = ‘HighRisk’, 0 = ‘LowRisk’), and the independent variables were the covariates. Weights were then calculated as the inverse of the propensity scores (or inverse of 1- the propensity scores) for each individual.
Finally, a weighted Cox regression model was fitted to the data using the calculated weights. This re-weighted analysis aimed to check if the hazards had been adequately balanced across the two groups after the weight adjustments.
On the other hand, the HR should be substantially above one if the prognostic factors were not sufficiently adjusted for when creating the weights. Therefore, we also conducted Cox regressions using weights based on the alternative specification of omitting age from the predictors in the preceding logistic regression. This proof-of-concept example serves as a practical demonstration of the proposed method, elucidating its steps and showcasing its applicability in a simulated setting.
To further insight into the utility of the proposed process, we bootstrapped the HR estimates by including and not including age in the covariate list, respectively. The hypothesis was that the bootstrapped estimates based on the full list of covariates using our proposed process had smaller relative bias, which was measured as .
Results
The methodology employed for splitting the sample into two distinct risk groups – Group A (high-risk) and Group B (low-risk) – was successful in achieving a predetermined HR of 1.8 for the group indicator (Table 2). This confirms the feasibility of the iterative adjustment algorithm in creating risk-stratified groups that meet a specific HR target.
| Hazard ratio | 95% confidence interval | |
|---|---|---|
| Unweighted | 1.800 | 1.296–2.501 |
| Weighted with all covariates | 0.916 | 0.563–1.493 |
| Weighted with age omitted | 1.671 | 1.194–2.340 |
In the re-weighted Cox regression analysis, the HR for the risk group indicator was found to be 0.916 with a 95% CI of 0.563–1.493 (Table 2). This result is not significantly different from one, suggesting that the reweighting process effectively balanced the two risk groups in terms of their covariates, thereby eliminating the confounding effect of the risk group indicator.
When age was omitted from the logistic regression model used for weight creation, the HR for the risk group indicator increased to 1.671 with a 95% CI of 1.194–2.340. This result is statistically significant and indicates that omitting important prognostic factors from the weight creation process can introduce bias and affect the validity of the re-weighted analysis.
The bootstrapping analysis echoed the findings of the base-case analysis (depicted in Figure 1). When all covariates were included in the logistic regression model for weight creation, the mean of the bootstrapped HRs was 0.9872 with a 95% CI of 0.6094–1.576. The distribution of relative bias across the repetitions was predominantly concentrated around the region close to zero. This result is consistent with the HR obtained from the re-weighted Cox regression analysis in the base case and suggests that the reweighting process is an efficient way to rebalance the outcomes of the two artificially created groups when all prognostic factors were considered. On the other hand, when age was omitted, the mean of the bootstrapped HRs increased to 1.727 with a 95% CI of 1.217–2.385. This result highlights the vulnerability of the reweighting process to the omission of relevant prognostic factors. In addition, the distribution of relative bias was skewed away from zero.
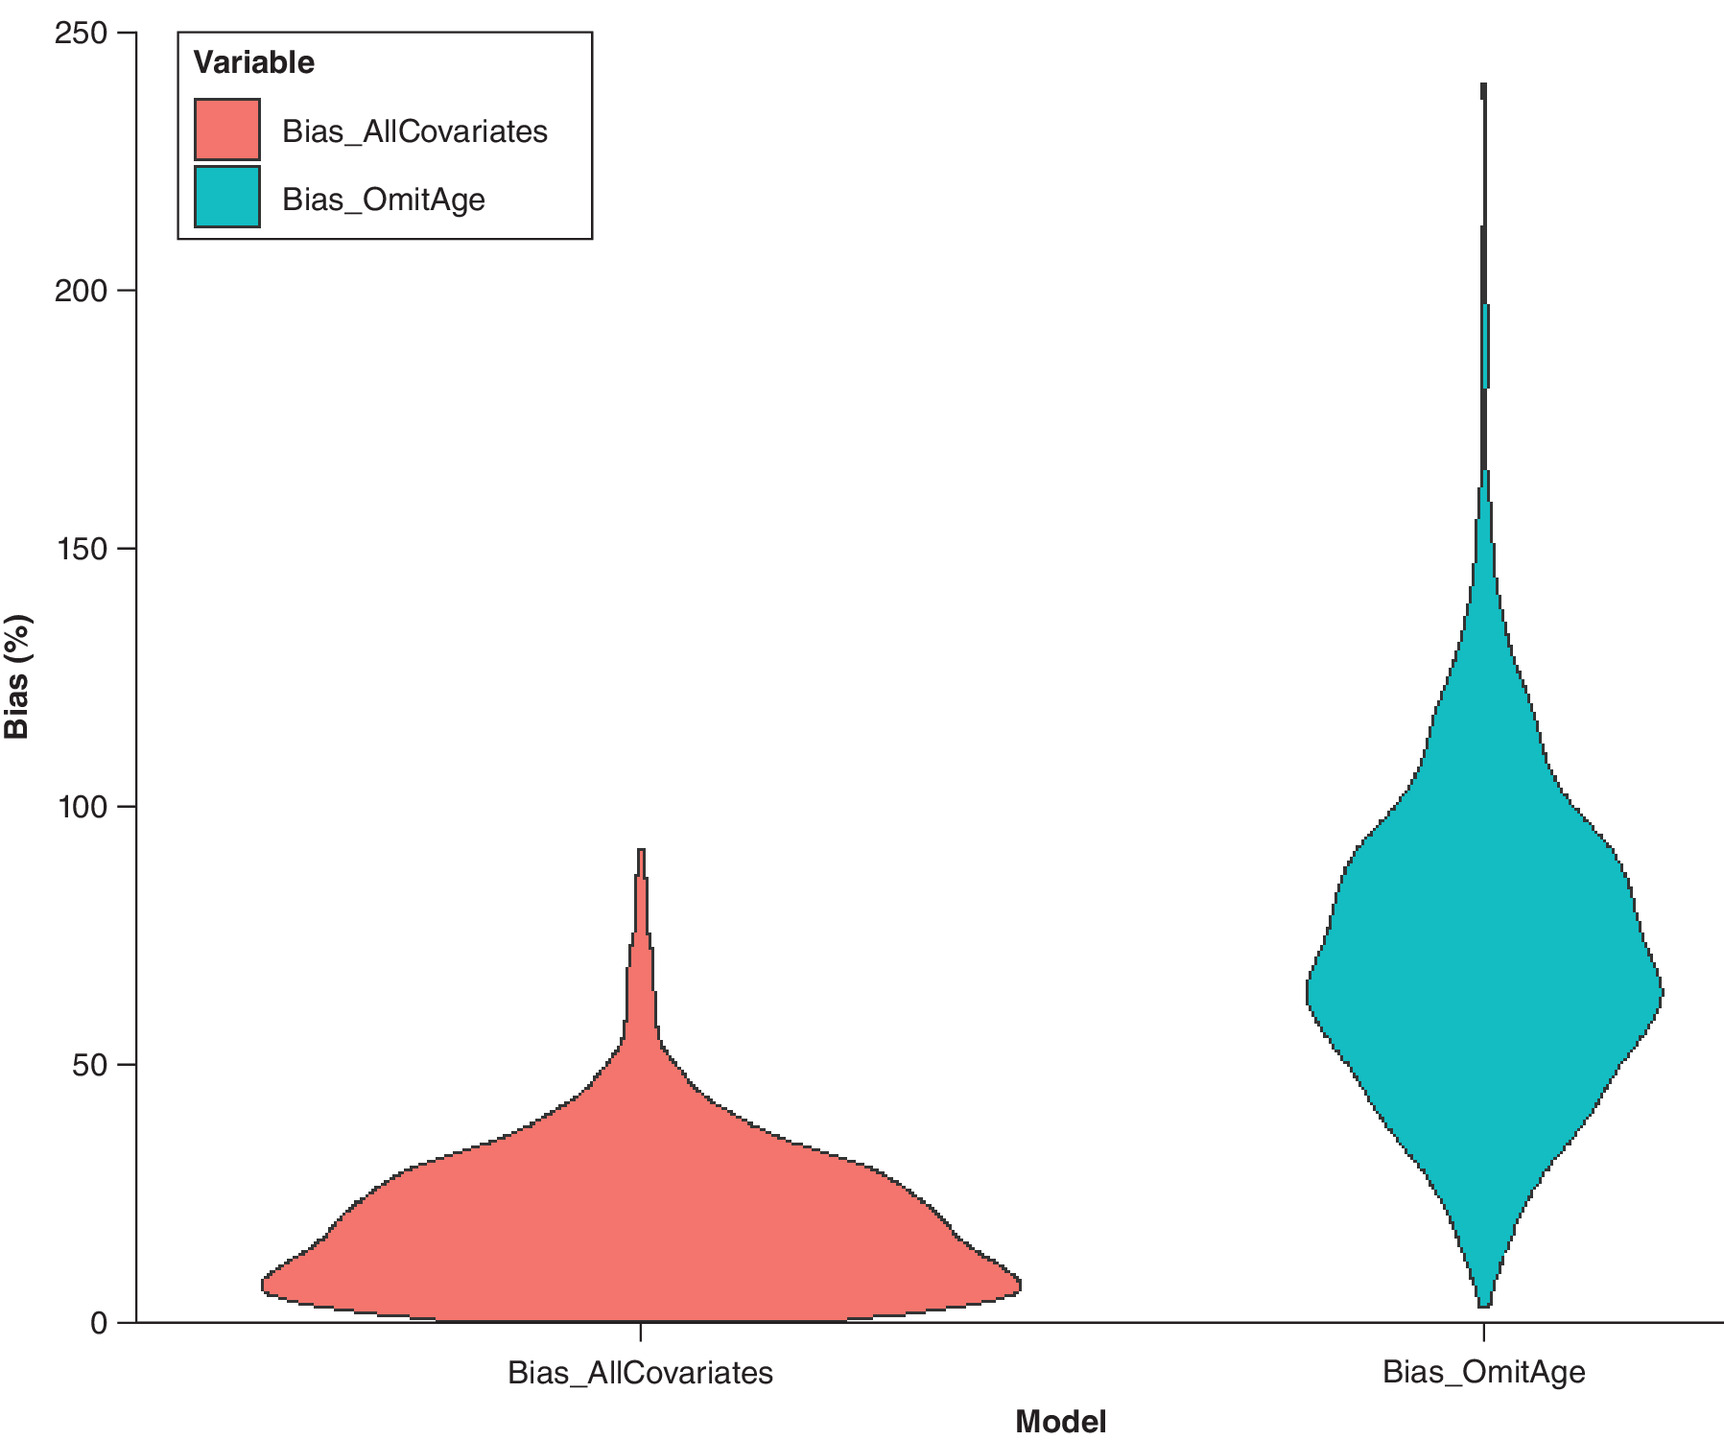
Figure 1. Distribution of bias (%) in hazard ratio estimates from bootstrap samples.
Comparison between models using all covariates versus omitting age.
To confirm the trade-off between the enhanced capability for bias reduction and the preservation of statistical power in our analyses, we computed the effective sample sizes (ESS) under distinct weighting schemes post hoc [3]. The ESS was 124.6 when all covariates were incorporated into the weighting process, as opposed to 186.2 when age was deliberately omitted. This observed decrement in ESS with the inclusion of additional covariates is consistent with theoretical expectations.
We also illustrate the kernel density curves of the weights generated under these alternative specifications in Figure 2. These curves suggest that the inclusion of age in the weighting process resulted in a distribution of weights that were lower on average, which naturally led to a reduced ESS. Despite this cost in statistical power, the inclusion of age achieved substantially better balance between the groups, as evidenced by the HR moving closer to 1 (0.916 vs 1.671). This clearly demonstrates the fundamental trade-off in MAIC between achieving better balance through more comprehensive covariate adjustment and maintaining statistical power.
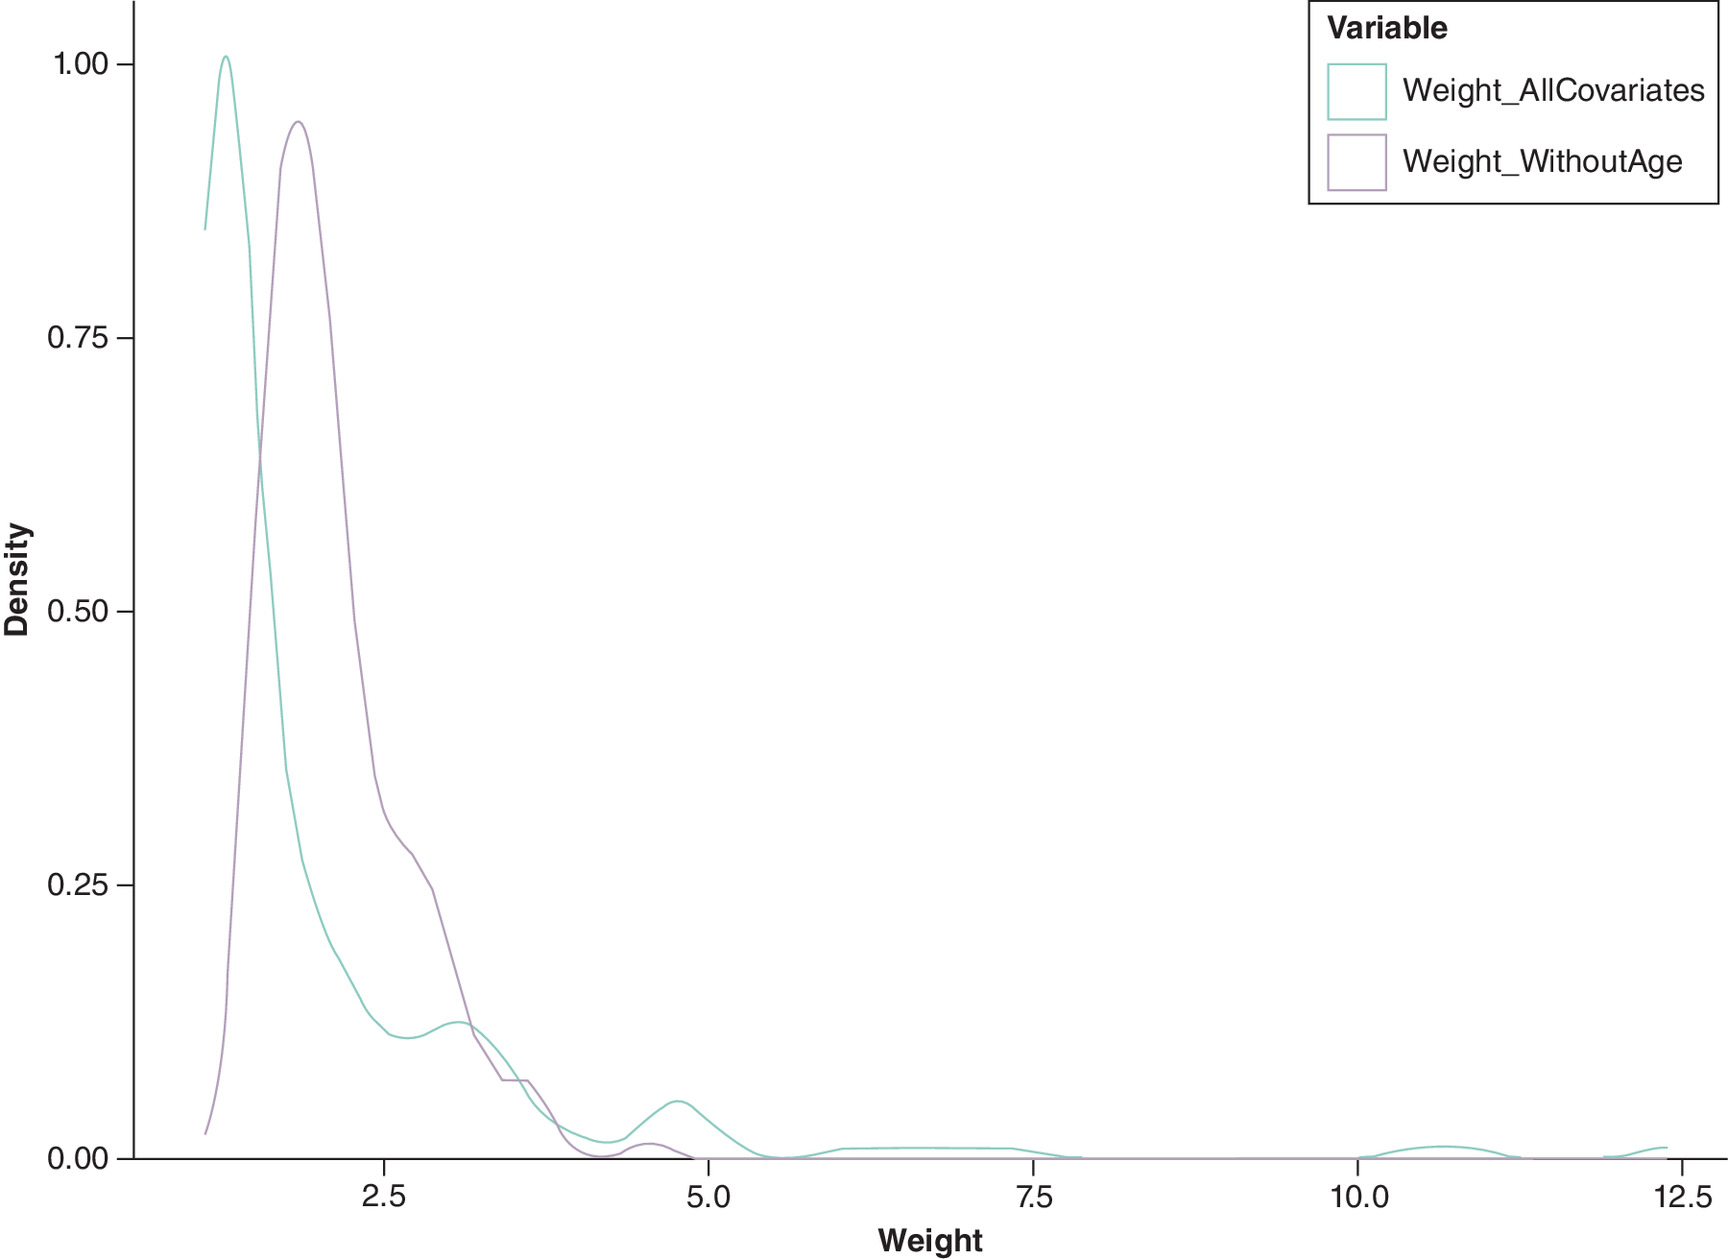
Figure 2. Kernel density plots of individual weights.
Comparison between models using all covariates versus omitting age.
Discussion
The issue of covariate selection in the MAIC of single-arm trials has long been a subject of considerable debate, primarily due to its consequential impact on both the ESS and the overall statistical power of the analysis [14,15]. In an attempt to address this challenge, the present study introduces a methodical process for identifying the minimum set of covariates that should be considered as prognostic factors in unanchored MAIC, specifically when dealing with time-to-event outcomes. Our proof-of-concept analysis yielded results that were consistent with theoretical expectations, thereby affirming the practical utility and feasibility of the proposed process. The validation process we describe is intended to be conducted using the available IPD to ensure that the selected covariates are sufficient for reducing potential bias in the subsequent MAIC analysis. In practice, researchers can apply this validation process to their available IPD dataset, and once the set of prognostic factors is validated, they can proceed with the standard MAIC methodology to compare their treatment with the comparator’s AgD.
Our findings suggest that the process we have proposed could serve as a robust tool for systematically determining a parsimonious set of covariates that balances bias and precision in the application of unanchored MAIC. The current landscape of MAIC is characterized by methodological vacuum in which the selection of covariates often lacks quantitative justification, which can result in a somewhat arbitrary application of this evidence synthesis tool. This issue has been highlighted in previous studies, which have underscored the need for more rigorous methods in covariate selection to enhance the reliability and interpretability of MAIC results [12].
While the primary focus of our study was to propose a process for identifying the minimum necessary set of prognostic factors, the results also underscore several critical considerations in the broader application of unanchored MAIC. First, it is imperative to select covariates that have a significant association with the outcomes under investigation. Such associations can often be substantiated through the IPD available to researchers. Second, our findings reiterate the inherent trade-off between reducing bias and maintaining statistical accuracy, suggesting that the list of covariates should be parsimonious rather than exhaustive conditional on sufficient bias adjustment. These points align with the recommendations made in the literature, which emphasize the importance of careful covariate selection in MAIC [1]. It is important to acknowledge that the proposed process prioritizes achieving a balance between bias reduction and precision. In situations where the raw studies have large sample sizes and the risk of compromising statistical power is minimal, researchers may choose to include a wider range of covariates based on their clinical judgment and understanding of the disease area.
There are several limitations to our study that warrant attention. First, the study is based on simulated data, which may not fully capture the complexities and nuances of real-world clinical scenarios. While simulation allows for controlled testing of our methodology, it is important to apply this framework to clinical trial data to demonstrate its practical utility in future research. Second, the proposed process is specifically tailored to the selection of prognostic factors as covariates and does not extend to the consideration of effect modifiers. The selection of 1.8 as the HR threshold for creating artificial risk groups, while serving its purpose in demonstrating the methodology by creating substantial imbalance, renders the robustness of the method vulnerable. In light of this, we conducted a post hoc sensitivity analysis using an HR of 2.2 to assess the robustness of our findings. The results remained consistent, which helps to reinforce the robustness of the process. Despite these limitations, the proposed methodology offers a meaningful advance in the field, particularly given the current absence of a quantitative framework for making such choices. Future research could focus on extending this methodology to include effect modifiers and validating the process using real-world data.
Conclusion
In conclusion, our study provides a novel data-driven process to consolidate a broad candidate pool of covariates to a minimal subset that helps to optimize bias-variance trade-offs in unanchored MAIC of single-arm trials with time-to-event outcomes.
Summary points
•
Unanchored matching-adjusted indirect comparison (MAIC) has gained popularity for comparing treatments when direct comparisons are not available.
•
Current processes to select and validate prognostic factors in unanchored MAIC are absent, creating uncertainty in analysis choices.
•
We introduced a novel process for validating prognostic factors in unanchored MAIC using available single-arm individual patient data.
•
The method creates artificial imbalance between within-arm groups with a known effect size, providing a benchmark for validation.
•
Our validation process demonstrated that including appropriate prognostic factors achieved balance between comparison groups.
•
This approach provides quantitative evidence for validating covariate selection in MAIC analyses.
•
The method demonstrates how excluding essential prognostic factors can introduce bias in treatment comparisons.
•
This validation framework improves the reliability of unanchored MAIC analyses by confirming appropriate covariate selection.
Author contributions
Y Yi: Investigation, methodology, formal analysis, visualization, writing – review & editing. Y Jiang: Conceptualization, methodology, software, formal analysis, investigation, data curation, visualization, writing – original draft, supervision.
Financial disclosure
The authors have no financial involvement with any organization or entity with a financial interest in or financial conflict with the subject matter or materials discussed in the manuscript. This includes employment, consultancies, honoraria, stock ownership or options, expert testimony, grants or patents received or pending, or royalties.
Competing interests disclosure
The authors have no competing interests or relevant affiliations with any organization or entity with the subject matter or materials discussed in the manuscript. This includes employment, consultancies, honoraria, stock ownership or options, expert testimony, grants or patents received or pending, or royalties.
Writing disclosure
No writing assistance was utilized in the production of this manuscript.
Data sharing statement
The datasets generated and analyzed during the current study have been provided for peer review and are available in the Mendeley Data repository.
Open access
This work is licensed under the Attribution-NonCommercial-NoDerivatives 4.0 Unported License. To view a copy of this license, visit https://creativecommons.org/licenses/by-nc-nd/4.0/
References
Papers of special note have been highlighted as: • of interest; •• of considerable interest
1.
Signorovitch JE, Sikirica V, Erder MH et al. Matching-adjusted indirect comparisons: a new tool for timely comparative effectiveness research. Value Health 15(6), 940–497 (2012).
•• Introduced matching-adjusted indirect comparison (MAIC) methodology, forming the foundation for our validation approach and highlighting the original considerations for covariate selection.
2.
Kim H, Gurrin L, Ademi Z, Liew D. Overview of methods for comparing the efficacies of drugs in the absence of head-to-head clinical trial data. Br. J. Clin. Pharmacol. 77(1), 116–121 (2014).
3.
Phillippo DM, Ades AE, Dias S et al. Methods for population-adjusted indirect comparisons in health technology appraisal. Med. Decis. Making 38(2), 200–211 (2018).
•• It provides a comprehensive review of population adjustment methods including MAIC, highlighting the methodological challenges that our validation approach addresses.
4.
Phillippo DM, Dias S, Ades AE, Welton NJ. Equivalence of entropy balancing and the method of moments for matching-adjusted indirect comparison. Res. Synth. Methods 11(4), 568–572 (2020).
5.
Petto H, Kadziola Z, Brnabic A, Saure D, Belger M. Alternative weighting approaches for anchored matching-adjusted indirect comparisons via a common comparator. Value Health 22(1), 85–91 (2019).
6.
Phillippo DM, Dias S, Ades AE, Welton NJ. Assessing the performance of population adjustment methods for anchored indirect comparisons: a simulation study. Stat. Med. 39(30), 4885–4911 (2020).
• It provides a comprehensive simulation study to evaluate the performance of population adjustment methods, thereby demonstrating the importance of proper methodology assessment.
7.
Remiro-Azócar A, Heath A, Baio G. Methods for population adjustment with limited access to individual patient data: a review and simulation study. Res. Synth. Methods 12(6), 750–775 (2021).
• Reviews and evaluates population adjustment methods when individual patient data are limited, which highlights methodological challenges that inform the proposed validation approach.
8.
Jiang Y, Ni W. Performance of unanchored matching-adjusted indirect comparison (MAIC) for the evidence synthesis of single-arm trials with time-to-event outcomes. BMC Med. Res. Methodol. 20(1), 241 (2020).
9.
Remiro-Azócar A, Heath A, Baio G. Conflating marginal and conditional treatment effects: comments on “Assessing the performance of population adjustment methods for anchored indirect comparisons: a simulation study”. Stat. Med. 40(11), 2753–2758 (2021).
10.
Phillippo DM, Dias S, Ades AE, Welton NJ. Target estimands for efficient decision making: response to comments on “Assessing the performance of population adjustment methods for anchored indirect comparisons: a simulation study”. Stat. Med. 40(11), 2759–2763 (2021).
11.
Jiang Y, Cai D, Shi S. Indirect comparisons via sorafenib for the comparative effectiveness of two PD-1/PD-L1 inhibitors to treat advanced hepatocellular carcinoma patients without prior systemic therapies. Clin. Epidemiol. 14, 581–590 (2022).
12.
Phillippo D, Ades T, Dias S et al. NICE DSU Technical Support Document 18: methods for population-adjusted indirect comparisons in submissions to NICE. (2016). Available at: https://research-information.bris.ac.uk/en/publications/nice-dsu-technical-support-document-18-methods-for-population-adj
13.
Cheng D, Tchetgen ET, Signorovitch J. On the double-robustness and semiparametric efficiency of matching-adjusted indirect comparisons. Res. Synth. Methods 14(3), 438–442 (2023).
14.
Hatswell AJ, Freemantle N, Baio G. The effects of model misspecification in unanchored matching-adjusted indirect comparison: results of a simulation study. Value Health. 23(6), 751–759 (2020).
15.
Remiro-Azócar A. Two-stage matching-adjusted indirect comparison. BMC Med. Res. Methodol. 22(1), 217 (2022).
Information & Authors
Information
Published In
Copyright
© 2025 The authors. This work is licensed under the Attribution-NonCommercial-NoDerivatives 4.0 Unported License
History
Received: 16 December 2024
Accepted: 28 February 2025
Published online: 7 April 2025
Keywords:
Topics
Authors
Metrics & Citations
Metrics
Article Usage
Article usage data only available from February 2023. Historical article usage data, showing the number of article downloads, is available upon request.
Citations
How to Cite
A process to validate prognostic factors for unanchored matching-adjusted indirect comparison of single-arm trials in oncology: a proof-of-concept study. (2025) Journal of Comparative Effectiveness Research. DOI: 10.57264/cer-2024-0235
Export citation
Select the citation format you wish to export for this article or chapter.
Citing Literature
- Huiqiao Gu, Bingxin Hu, Yawen Jiang, The Comparative Effectiveness of Enlonstobart and Camrelizumab as Second-Line Recurrent or Metastatic Cervical Cancer Therapies: Matching-Adjusted and Simulated Treatment Comparisons, ImmunoTargets and Therapy, 10.2147/ITT.S572970, Volume 15, (1-12), (2026).