Matching-adjusted indirect comparisons of efficacy outcomes between etrasimod and ozanimod for moderately to severely active ulcerative colitis
Publication: Journal of Comparative Effectiveness Research
Abstract
Aim: Etrasimod and ozanimod are selective sphingosine 1-phosphate receptor modulators targeting the S1P1,4,5, and S1P1,5 receptors, respectively, for the treatment of patients with moderately to severely active ulcerative colitis (UC). No head-to-head trial data exist between the two treatments. We compared these treatments indirectly using key efficacy outcomes from pivotal trials with induction and maintenance phase data adjusting for differences in clinical trial design and populations. Materials & methods: Individual patient data for etrasimod were matched to published aggregate data of ozanimod by key baseline characteristics. An anchored matching-adjusted indirect comparison (MAIC) was conducted for the induction period. An unanchored MAIC was utilized during the maintenance period due to differences in placebo arms between trials as a result of differing trial designs. Matching characteristics measured at baseline were age, sex, corticosteroid use, duration of UC, biologic exposure, modified Mayo score, and presence of left-sided colitis. Outcomes were clinical response and clinical remission for the induction period, and clinical response and clinical remission among induction phase responders for the maintenance period. Two sensitivity analyses were conducted. The first matched on prior TNFi exposure rather than biologic exposure, the second sensitivity analysis included an induction only etrasimod trial (ELEVATE UC 12). Results: There were no significant differences between etrasimod and ozanimod at the end of the induction period for clinical response and clinical remission, respectively (relative risk [RR] 0.98 [95% confidence interval (CI): 0.76–1.33], RR: 1.25 [95% CI: 0.71–2.92]). At the end of maintenance, etrasimod demonstrated improved outcomes compared with ozanimod for both clinical response (RR: 1.18 [95% CI: 1.05–1.30]) and clinical remission among induction phase responders (RR: 1.33 [95% CI: 1.12–1.55]). In the sensitivity analysis that matched on prior TNFi exposure rather than biologic exposure, there were no notable differences compared with the primary analyses. In the sensitivity analysis pooling ELEVATE UC 12 and ELEVATE UC 52 data, results were similar for clinical response (RR: 0.90 [95% CI: 0.75–1.10]) but etrasimod showed reduced efficacy for clinical remission (RR: 0.72 [95% CI: 0.50–1.12]) compared with the primary analysis, though overall remained not significantly different from ozanimod. Conclusion: MAIC results suggest that patients receiving etrasimod have similar induction results but are more likely to have clinical response and clinical remission at the end of the maintenance phase compared with patients receiving ozanimod. Despite the approach to ensure similarity between the trials by weighting, residual imbalance is possible, and results should be interpreted in the context of the assumptions.
Plain language summary: Comparing the effectiveness of etrasimod & ozanimod for treating moderate to severe ulcerative colitis
What is this article about?
This study compares two medications, etrasimod and ozanimod, used to treat moderate to severe ulcerative colitis. Since no trial exists comparing etrasimod and ozanimod directly, an analytical method called matching-adjusted indirect comparison was used to analyze and compare the effectiveness of these treatments. The study evaluated outcomes during both the induction phase and maintenance phase.
What were the results?
During the induction phase, there were no significant differences between etrasimod and ozanimod in achieving clinical response or clinical remission. However, during the maintenance phase, etrasimod-treated patients showed better results. Patients receiving etrasimod were more likely to achieve clinical response and clinical remission compared with those receiving ozanimod. Sensitivity analyses confirmed these findings, although results varied slightly when pooling additional etrasimod trial data in the induction period.
What do the results mean?
The results suggest that both etrasimod and ozanimod are effective for induction treatment, but etrasimod may offer better remission and response outcomes over the maintenance period. These findings could help physicians make informed decisions about treatment options for ulcerative colitis. However, results should be interpreted in the context of the assumptions of this study.
Ulcerative colitis (UC) is a lifelong idiopathic inflammatory bowel disease that affects the colonic mucosa [1]. It typically follows a relapsing/remitting and progressive inflammatory course and is associated with impaired quality of life, hospitalizations, surgery and an increased risk for colon cancer [2]. The prevalence of UC in 2023 was estimated to be 5 million cases globally, with an increasing incidence trend [3].
According to guidelines [4–6], the goal of treatment in UC is to relieve symptoms, induce remission, maintain remission and improve patient health-related quality of life [4,7]. Conventional therapies such as aminosalicylates, corticosteroids and thiopurines are the common first-line treatments for UC [7]. When patients are intolerant or have lost response to conventional treatments, biologics such as tumor necrosis factor inhibitors (TNFi) (adalimumab, golimumab, infliximab) [8], interleukin 12/23 inhibitors (ustekinumab, mirikizumab, risankizumab) [9–11], anti-integrin (vedolizumab) [12], advanced small molecules such as janus kinase inhibitors (filgotinib, tofacitinib, upadacitinib) [13–15], sphingosine-1-phosphate (S1P) receptor modulators (etrasimod, ozanimod) [16,17] are prescribed. Surgery is considered for UC patients whose disease has not responded to or is refractory to medical treatment [2]. Of the medical treatments available, S1P receptor–modulating therapies etrasimod and ozanimod are the newest oral small molecules to be approved for the treatment of moderately to severely active UC [16,17]. S1P modulators are emerging as a significant advancement in the treatment of UC. By modulating lymphocyte egress from lymphoid tissues, these agents help mitigate the inflammatory processes central to UC, offering a novel mechanism of action and promising therapeutic option [18–20].
There are no head-to-head studies comparing etrasimod and ozanimod for the treatment of patients with moderately to severely active UC. While there have been some indirect comparisons of etrasimod with ozanimod [21,22], these have been conducted in a network meta-analysis (NMA) framework. NMAs rely upon key assumptions which baseline differences in population characteristics can violate [23]. Population-adjusted methods, such as matching-adjusted indirect comparisons (MAIC), can adjust for cross-trial differences so that outcomes can be assessed in balanced populations. Given that they are the only S1P receptor modulators approved in UC and have similar mechanism of action, this comparison is of particular importance to help understand differences in effectiveness between the two treatments.
This study aimed to assess the comparative effectiveness of etrasimod and ozanimod. The findings of this study provide additional comparative evidence that could support clinical decision-making as well as inform health technology assessments.
Materials & methods
Literature search & included studies
Clinical systematic literature review
A systematic literature review (SLR) was performed in November 2022, to capture published literature on clinical trial data for comparator therapies in patients with UC [21]. The SLR was conducted in line with National Institute for Health and Care Excellence (NICE) and Preferred Reporting Items for Systematic Reviews and Meta-Analyses guidelines [24]. The scope of the clinical SLR was wider than the scope of this study. Further, hand-searches were conducted in November 2023 to update any available literature specifically for ozanimod.
Included studies
Pivotal trials of ozanimod that reported data for the outcomes of interest were include in this study. Studies that reported data on both the induction and maintenance phases were preferable to ensure consistency between induction and maintenance phase patients. The TRUE NORTH trial (NCT02435992) was identified as the primary source of ozanimod data.
TRUE NORTH is a phase III pivotal, multicenter, randomized, double-blind, placebo-controlled trial of oral ozanimod as induction and maintenance therapy for moderate to severe UC that followed a responder randomization trial design [25]. It comprised of a 10-week induction period with two cohorts; cohort 1 was assigned to receive oral ozanimod hydrochloride at a dose of 1 mg per day or placebo once daily in a double-blind manner, cohort 2 received open-label ozanimod at the same daily dose (Figure 1) [25]. At 10 weeks, patients with a clinical response to ozanimod in either cohort underwent randomization again to receive double-blind ozanimod or placebo for the maintenance period (through week 52).
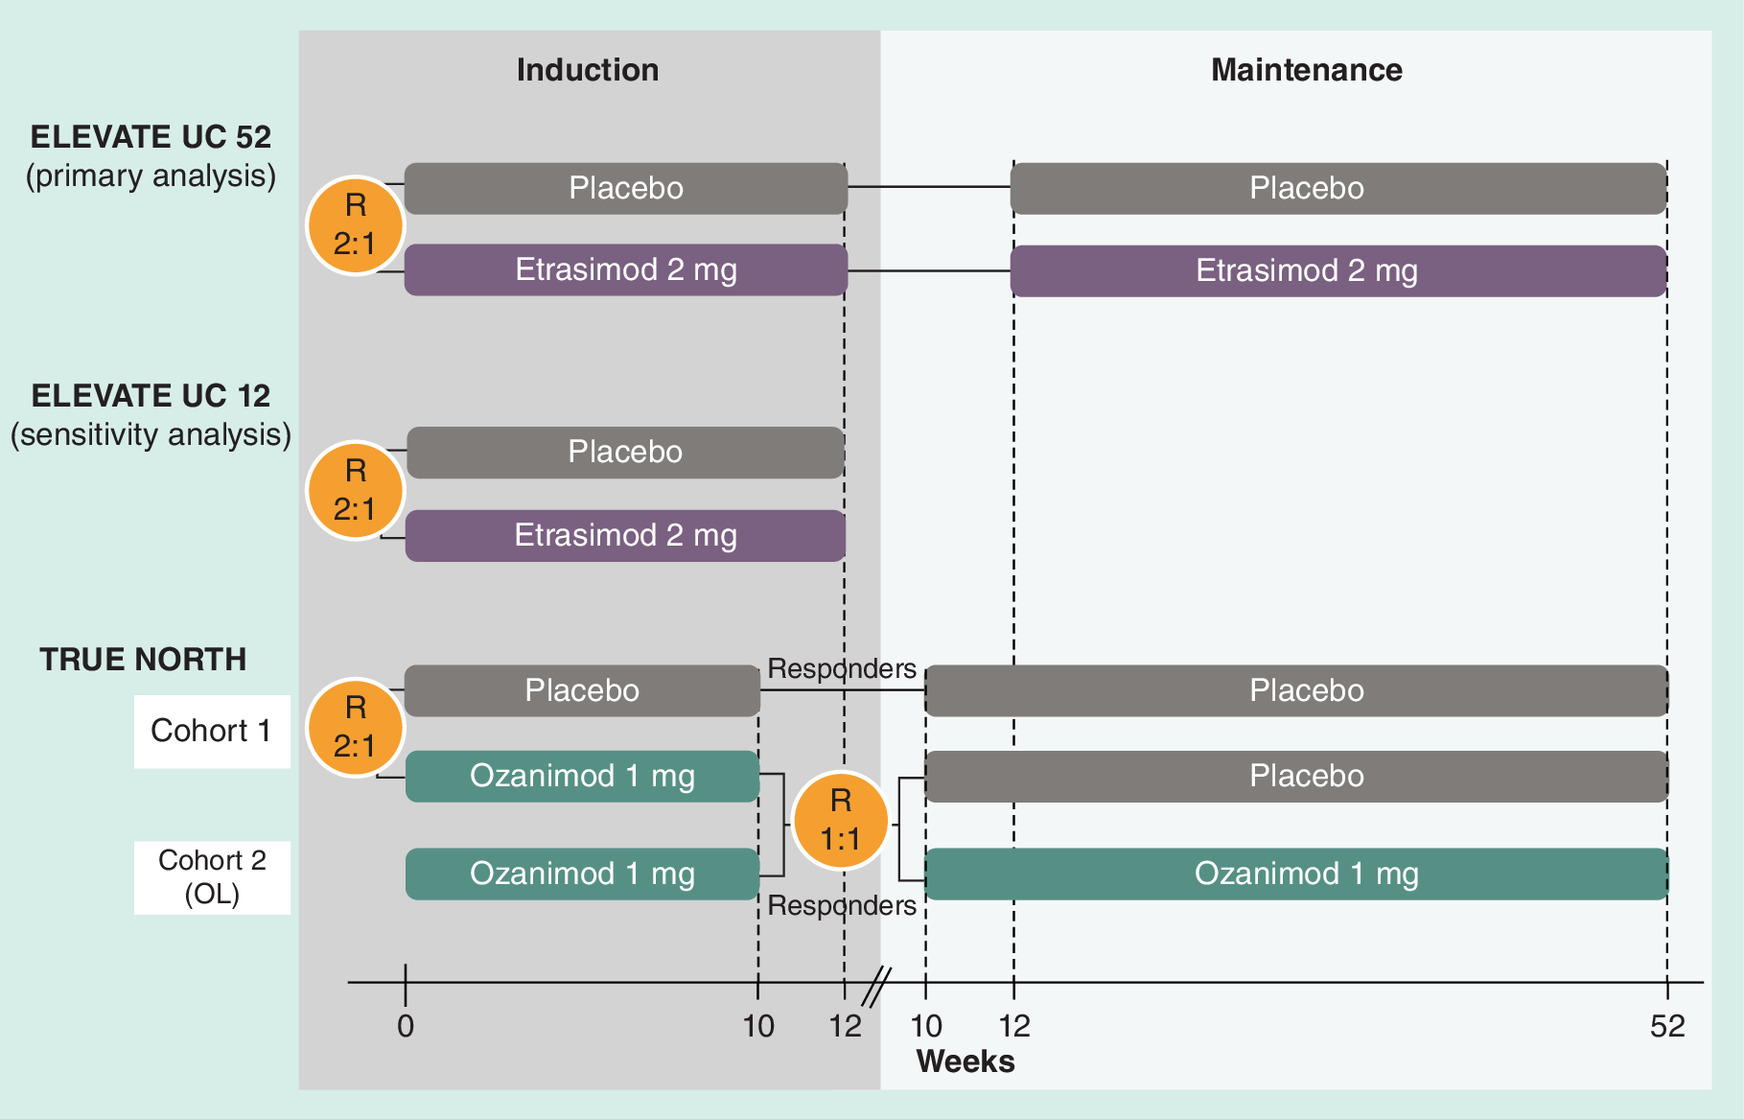
Figure 1. Trial schematic for ELEVATE UC 52, ELEVATE UC 12 and TRUE NORTH.
R: Randomization; OL: Open-label.
For etrasimod, two studies were included in the analyses. ELEVATE UC 52 and ELEVATE UC 12 are two phase III pivotal, multicenter, randomized, double-blind, placebo-controlled trials of etrasimod in patients with moderately to severely active UC. ELEVATE UC 52 comprised a 12-week induction period followed by a 40-week maintenance period with a treat-through design, i.e., all patients enrolled in the trial were included in the efficacy evaluation at the end of the 40-week maintenance period; there was no re-randomization of responders at the end of the 12-week induction period (Figure 1) [26]. ELEVATE UC 12 is a 12-week induction only trial. In both trials, patients were randomly assigned to once-daily oral etrasimod 2 mg or placebo. ELEVATE UC 52 was included in the primary analysis and both ELEVATE UC 52 and ELEVATE UC 12 were included in a sensitivity analysis.
Patients in the TRUE NORTH trial had a total Mayo score of 6 to 12 with an endoscopy subscore of 2 or higher, a rectal-bleeding subscore of 1 or higher, and a stool-frequency subscore of 1 or higher. This range was used to define moderately to severely active UC at the time this study was conducted. For both ELEVATE trials, inclusion criteria required confirmation of moderately to severely active UC defined by a modified Mayo score (MMS) of 4 to 9 with an endoscopic subscore of 2 or higher and a rectal bleeding subscore of 1 or higher. To align with the definition of moderately to severely active UC, this study included data only from patients that had an MMS of 5 to 9 at baseline [27]. The inclusion criteria for the ELEVATE trials included patients aged 16 years and over, whereas in TRUE NORTH only adult patients were included (18 years and over). However, the impact of this difference is expected to be minimal given the small number of patients aged under 18.
Methods & outcomes
Selection of matching variables
The selection of the matching variables was prespecified and based on an assessment of possible matching variables and their relationship with outcomes, clinical relevance and availability in the data sources with input from experts in the treatment of UC and comparative efficacy research [28]. A review of matching variables used in other published MAICs in UC was also conducted [29–32].
Patients were matched on the following characteristics measured at baseline which were considered as potential effect modifiers: age, sex, corticosteroid use, duration of UC, prior biologic exposure, MMS and presence of left-sided colitis. No additional prognostic variables were considered.
Prior biologic exposure was not explicitly reported for the TRUE NORTH trial but was estimated through other reported data in the baseline characteristics by summing those that had received a TNFi and those that received vedolizumab and subtracting those patients that had received both a TNFi and vedolizumab to prevent double counting [25]. The choice of prior biologic exposure as a matching variable in the primary analysis reflects the current treatment landscape, where multiple classes of biologic therapies are available. Prior biologic exposure provides a more inclusive measure of prior treatment exposure, capturing the broader patient exposure to advanced therapy and supporting the generalization of the results rather than solely focusing on TNFi, which represents only one class of biologic therapy. Corticosteroid use at baseline included both systemic corticosteroids and budesonide.
Further, adjusting for both MMS and the duration of UC may act as a proxy for the distribution of disease severity of UC at baseline.
Within the respective trials, the handling of corticosteroids was similar. Patients had to be on stable corticosteroids (prednisone at a dose ≤20 mg/day or budesonide) for 2 weeks (TRUE NORTH) or 4 weeks (ELEVATE UC trials) prior to screening endoscopy and for the whole duration of induction. Corticosteroid dose was tapered once patients entered maintenance (this was mandatory in TRUE NORTH and recommended in ELEVATE UC trials).
Statistical methods
The approach was based on methodology described in Signorovitch et al. [33,34]. Individual patient level data from the ELEVATE UC 52 were weighted using weights estimated from logistic regression to match on the selected matching variables of the aggregate patient data reported for the TRUE NORTH trial. Weighting was based on characteristics reported at baseline for both the induction and maintenance phases since aggregate data on all matching variables was not available for the TRUE NORTH trial for the maintenance period. The unweighted and weighted characteristics from the ELEVATE trials were compared with the matching variables in the TRUE NORTH trial using standardized mean differences. The effective sample size (ESS), i.e., the number of independent, non-weighted individuals needed to produce an estimate that matches the precision of the estimate derived from the weighted sample, was also reported.
Both induction cohorts 1 and 2 in TRUE NORTH contributed to the maintenance phase of TRUE NORTH. Therefore, to calculate the baseline characteristics for the maintenance phase of TRUE NORTH, a weighted average of the baseline induction characteristics was utilized, weighted by the proportion of responders in each cohort. For induction analyses, baseline characteristics were used as reported from cohort 1, since the open-label induction cohort from TRUE NORTH was not included in the induction analysis.
To improve the comparability of the two trial populations, only induction phase responders from ELEVATE UC 52 were included in the maintenance analyses to align with the responder re-randomization trial design of TRUE NORTH. Even with this adjustment, we cannot account for differences in the maintenance placebo arms due to all patients in TRUE NORTH having response to prior active treatment as a result of the responder re-randomization trial design, compared with all maintenance placebo patients in ELEVATE UC 52 only having received placebo in induction. Consequently, the placebo arms in the respective maintenance phases were not considered comparable due to the differences in trial designs, which led to variations in patient populations and placebo response rates. These differences precluded the use of an anchored comparison, as the assumptions required for such an analysis (i.e., comparable placebo arms across trials) would not hold. Thus an unanchored MAIC approach was utilized to compare treatments by aligning populations based on observed baseline characteristics mitigating the impact of noncomparability between placebo arms. A placebo anchored MAIC was conducted for the induction analyses. Unadjusted comparisons are also estimated.
The relative risk (RR) with corresponding bootstrapped 95% confidence interval (CI) was used as the outcome measure for all outcomes.
R version 4.2.2 and the MAIC package was used to conduct the analysis [35].
Outcomes
The outcomes assessed at the end of the induction period were clinical response and clinical remission. Similarly, clinical response and clinical remission in the induction phase responders was assessed at the end of the maintenance period. Both ELEVATE UC 52 and TRUE NORTH reported outcomes for the maintenance period at week 52. The ELEVATE trials reported induction outcomes at week 12, while TRUE NORTH reported outcomes at week 10.
Clinical response and clinical remission were measured using the MMS in both ELEVATE and TRUE NORTH trials. Full definitions of each outcome are given in Table 1. There was a small difference in the outcome definitions between the ELEVATE and TRUE NORTH trials. The clinical response outcome in the ELEVATE trials required a ≥30% decrease from baseline in MMS whereas in TRUE NORTH ≥35% is required. A ≥30% reduction is generally considered as the most appropriate definition [36].
| Outcome | ELEVATE UC 52; ELEVATE UC 12 | TRUE NORTH |
|---|---|---|
| Clinical response | MMS: ≥2-point and ≥30% decrease from baseline in MMS and a ≥1-point decrease from baseline in rectal bleeding subscore or an absolute rectal bleeding subscore ≤1 | MMS: ≥2 points and ≥35% decrease from baseline in MMS and a ≥1-point decrease from baseline in rectal bleeding subscore or an absolute rectal bleeding subscore ≤1 |
| Clinical remission | MMS: A composite of stool frequency subscore = 0 (or stool frequency subscore = 1 with a ≥1-point decrease from baseline), rectal bleeding subscore = 0 and endoscopic subscore of 1 or less (without friability; centrally read) | MMS: A stool frequency subscore = 1 or less with a ≥1-point decrease from baseline, rectal bleeding subscore = 0 and an endoscopy subscore of 1 or less (without friability; centrally read) |
MMS: Modified Mayo score.
Analyses
Prespecified primary analyses compared patients in ELEVATE UC 52 with patients from the TRUE NORTH trial over both the induction and maintenance periods. Additionally, two predefined sensitivity analyses were also conducted. The first sensitivity analysis replaced prior biologic exposure with prior TNFi exposure to assess the impact of adjusting for patients with only prior TNFi exposure compared with prior biologic exposure; this sensitivity analysis was conducted both over the induction and maintenance periods. The second sensitivity analysis included patients from the ELEVATE UC 12 induction only trial and thus was conducted for only the induction phase. Unadjusted comparisons are estimated for each analysis for reference.
Results
Primary analysis
Baseline characteristics matching
Baseline characteristics of patients from the ELEVATE UC 52 trial before matching and after matching compared with the baseline characteristics from patients in the TRUE NORTH trial are shown in Tables 2 & 3. There were some differences in the baseline characteristics between the populations in both the induction and maintenance periods prior to matching, for example, the mean MMS and the proportion of patients with previous biologics exposure, as indicated by the standardized mean differences (Tables 2 & 3). However, after matching, populations were balanced on key baseline characteristics (standardized mean difference <0.05). The ESS after the induction period post-matching was 357.05 indicating a reduction of approximately 12.7% from the initial sample size, which suggests significant overlap in the populations studied. This indicates that the sample size was preserved without excessive data loss from the overall population, supporting the robustness of the analysis. A similar reduction (14.5%) was observed for the maintenance period.
| Baseline characteristics | TRUE NORTH (n = 645) | ELEVATE UC 52 (before matching) | ELEVATE UC 52 (after matching) | ||
|---|---|---|---|---|---|
| Induction | n = 409 | SMD | ESS = 357.05 | SMD | |
| Age (mean) | 41.57 | 40.61 | -0.0677 | 41.57 | 0 |
| Sex (male, proportion) | 0.60 | 0.55 | -0.1080 | 0.60 | 0 |
| Corticosteroid use at baseline (proportion) | 0.34 | 0.31 | -0.0701 | 0.34 | 0 |
| Time since diagnosis (years, mean) | 6.87 | 7.07 | 0.0276 | 6.87 | 0 |
| Biologics exposure (proportion) | 0.33 | 0.27 | -0.1267 | 0.33 | 0 |
| Modified mayo score (mean) | 6.60 | 6.87 | 0.2630 | 6.60 | 0 |
| Presence of left-sided colitis (proportion) | 0.62 | 0.59 | -0.0642 | 0.62 | 0 |
ESS: Effective sample size; SMD: Standardized mean difference.
| Baseline characteristics | TRUE NORTH (n = 230) | ELEVATE UC 52 (before matching) | ELEVATE UC 52 (after matching) | ||
|---|---|---|---|---|---|
| Maintenance | n = 274 | SMD | ESS = 234.4 | SMD | |
| Age (mean) | 41.74 | 41.59 | -0.0109 | 41.74 | 0 |
| Sex (male, proportion) | 0.58 | 0.53 | -0.1025 | 0.58 | 0 |
| Corticosteroid use at induction maintenance (proportion) | 0.36 | 0.32 | -0.09089 | 0.36 | 0 |
| Time since diagnosis (years, mean) | 7.38 | 7.59 | 0.0260 | 7.38 | 0 |
| Biologics exposure (proportion) | 0.38 | 0.27 | -0.2561 | 0.38 | 0 |
| Modified mayo score (mean) | 6.70 | 6.88 | 0.1690 | 6.70 | 0 |
| Presence of left-sided colitis (proportion) | 0.64 | 0.59 | -0.0965 | 0.64 | 0 |
ESS: Effective sample size; SMD: Standardized mean difference.
For induction, both the ELEVATE UC 52 and TRUE NORTH populations included placebo treated patients, whereas in maintenance only etrasimod and ozanimod treated patients were included, respectively.
Induction phase results
Figure 2A shows the RR of etrasimod compared with ozanimod for clinical response and clinical remission over the induction period. The results did not indicate a difference between etrasimod and ozanimod at the end of the induction period for both clinical response (RR: 0.98 [95% CI: 0.76–1.33]) and clinical remission (RR: 1.25 [95% CI: 0.71–2.92]).
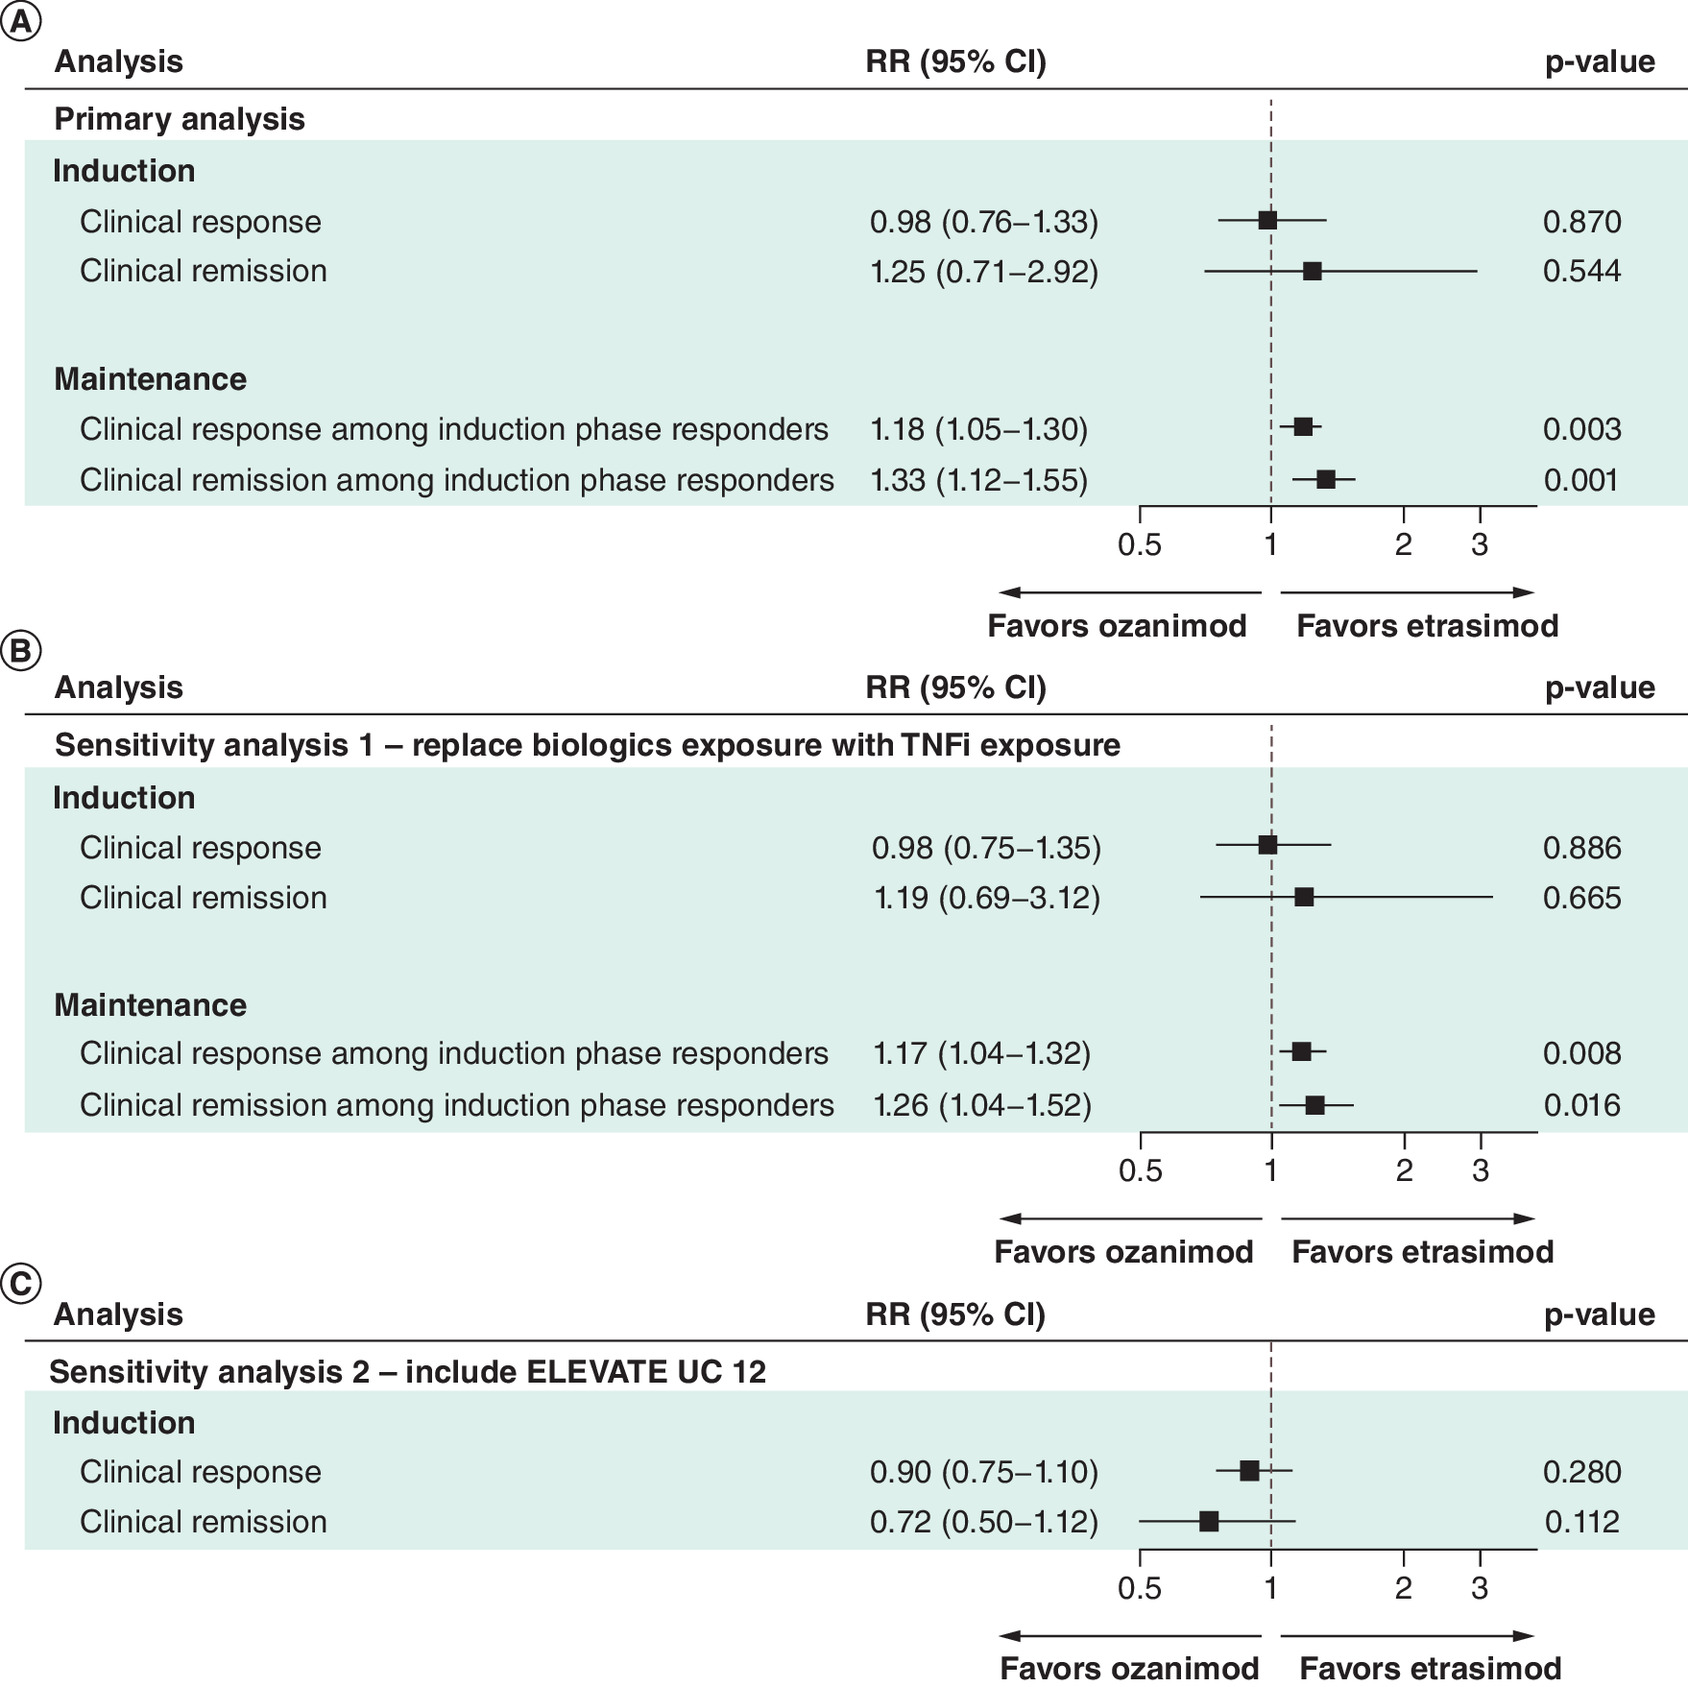
Figure 2. Results of the primary and sensitivity matching-adjusted indirect comparisons analyzes.
CI: Confidence interval; RR: Relative risk.
The results were similar to the unadjusted comparison between ELEVATE UC 52 and TRUE NORTH for both outcomes (Supplementary 1).
Maintenance phase results
At the end of the maintenance phase, etrasimod demonstrated favorable performance when compared with ozanimod for both the clinical response among induction phase responders (RR: 1.18 [95% CI: 1.05–1.30]) and clinical remission among induction phase responders (RR: 1.33 [95% CI: 1.12–1.55]) (Figure 2A).
The results were similar to the unadjusted comparison between ELEVATE UC 52 and TRUE NORTH for both outcomes (Supplementary 1).
Sensitivity analyses
Replace biologics exposure with TNFi exposure for matching
Baseline characteristics matching
TNFi exposure at baseline among patients from the ELEVATE UC 52 trial was lower compared with patients in the TRUE NORTH trial (Supplementary Table 1). However, after matching, populations were balanced on all key baseline characteristics. The ESS for the induction period after matching was 325.5, a reduction of approximately 20.4% compared with the initial sample size, while for the maintenance period it was 190.5 representing an approximate 30.5% reduction. Similar to the primary analysis, this reduction was relatively small indicating good population overlap.
Induction & maintenance phase results
For the sensitivity analysis replacing biologics exposure with TNFi exposure for matching, the results were consistent with those from the primary analysis, suggesting the analyses are robust to using TNFi exposure rather than biologic exposure as a matching variable (Figure 2B).
The results were similar to the unadjusted comparisons for the respective analyses between ELEVATE UC 52 and TRUE NORTH for both outcomes (Supplementary 2).
Include ELEVATE UC 12 trial
Baseline characteristics matching
The baseline characteristics of patients from the ELEVATE UC 12 trial were similar to those in the ELEVATE UC 52 trial. This means that the performance of matching for induction phase was similar to the primary analysis for the induction phase, with populations balanced on key baseline characteristics after matching. The ESS after matching was 681.1 representing an approximate reduction from the initial sample size of 8.3% suggesting good population overlap, as per the primary analysis.
Induction phase results
In the sensitivity analysis pooling the ELEVATE UC 12 and the ELEVATE UC 52 induction data, point estimates for the clinical response (RR: 0.90 [95% CI: 0.75–1.10]) and clinical remission (RR: 0.72 [95% CI: 0.50–1.12]) are reduced compared with the main analysis, yet not significantly different from ozanimod (Figure 2C). This consistency in statistical significance suggests that the primary findings are robust and not overly sensitive to variations in the analytical approach or population pooling. The pooled RR of etrasimod versus placebo is smaller for these outcomes when ELEVATE UC 12 data are included compared with solely ELEVATE UC 52 data. The CIs are narrower than for the primary analyses due to the increased sample size.
The results were similar to the unadjusted comparisons for the respective analyses between ELEVATE UC 52 and TRUE NORTH for both outcomes (Supplementary 2).
Discussion
This analysis is the first to present population-adjusted indirect comparisons of etrasimod and ozanimod, two S1P receptor–modulator therapies approved for the treatment of patients with moderately to severely active UC. Individual patient data for etrasimod from the pivotal phase III ELEVATE UC 52 trial were matched to published aggregate data for ozanimod from the TRUE NORTH trial by key baseline characteristics using MAIC methodology following a pre-specified statistical analysis plan developed in line with NICE technical framework [28].
After applying MAIC weighting, the populations were similar with regards to the matching characteristics with standardized mean differences all less than 0.05. The results of this study indicated that, while there was little difference between etrasimod and ozanimod after the induction period, etrasimod had favorable performance compared with ozanimod at the end of the maintenance period. The results of the study were supported by the sensitivity analyses conducted.
The findings from this study are largely consistent with results from a three published NMAs which included a comparison of ozanimod and etrasimod. One study found that there were few differences between etrasimod and ozanimod after both the induction and maintenance periods for the advanced-treatment naive population [21]. While in the maintenance period, point estimates favored etrasimod in the advanced-treatment naive population, although results were not statistically significant [21]. In another NMA that included both treatment-naive patients and those previously exposed to advanced therapy, without adjusting for trial design, no statistically significant differences were found between etrasimod and ozanimod in terms of inducing and maintaining clinical remission [37]. However, etrasimod was associated with higher odds of achieving clinical remission by the end of the maintenance phase, consistent with the findings of this study [37]. Similarly, another study that did not account for differences in study design also found little difference between etrasimod and ozanimod for clinical response and clinical remission outcomes over the induction phase [38]. However, etrasimod-treated patients were more likely to achieve clinical remission compared with ozanimod-treated patients for clinical remission over the maintenance period aligning with the results of this study [38].
This study’s strengths lie in the adoption of multiple approaches improving the reliability and validity of the analysis results. Two sensitivity analyses were conducted. The first assessed the impact of including a different matching characteristic for prior treatment exposure. The choice of matching characteristics within the analyses used potential effect modifiers that were based on precedent from prior published MAICs in UC and from expert clinical input. The second sensitivity analysis assessed the effect of including ELEVATE UC 12, an induction only study.
Although this study followed the relevant guidelines suggested in NICE TSD 18 [28], as in the case of any indirect treatment comparison, there remained several limitations that must be acknowledged. Though the analyses adjusted ELEVATE trial patient level data to resemble the population of the TRUE NORTH trial, matching characteristics were not reported separately for those ozanimod responders progressing to the maintenance phase within TRUE NORTH. Therefore, adjustments for the comparison of maintenance phase outcomes were based on matching characteristics at the start of the induction period. An assumption of this study is that the characteristics at baseline are reflective of those patients entering the maintenance period. As shown in Supplementary 3, this assumption is not unreasonable based on the ELEVATE UC 52 trial data.
When conducting MAICs, the choice between an anchored and unanchored approach for the interpretation of treatment effects is crucial and each presents its own limitations. An anchored approach estimates the relative treatment effect using a common comparator across studies, enhancing the comparability of treatments. In contrast, an unanchored approach allows for flexibility in estimating treatment effects but may introduce bias if the assumptions underlying the matching are violated, i.e., not all prognostic variables and effect modifiers are accounted for. Therefore, the results of this study should be interpreted with consideration of these limitations and in conjunction with other available comparative data and trial results.
In TRUE NORTH, only ozanimod responders after the induction period progress to the maintenance phase, at which point they are rerandomized, whereas in ELEVATE UC 52 all patients that were randomized at treatment initiation continued on the same treatment through to the end of the maintenance period. This has the potential to introduce inequality into the comparability of the respective placebo arms since responders randomized to placebo in TRUE NORTH are impacted by carry-over effects from ozanimod treatment in the induction period [39]. As a result, an unanchored approach was utilized in the maintenance period. The differences in trial design underscore the importance of interpreting the results in the context of the specific trial designs and patient selection criteria.
Further, the maintenance period of TRUE NORTH included patients from an open-label induction phase as well as a blinded induction period (Figure 1). It is well known that open-label trials generally have higher relative treatment effects than blinded trials [40]. Consequently, there may be a larger number of patients who achieve clinical response and who are eligible for the maintenance phase in TRUE NORTH, which is also a carry-over effect from prior active induction treatment [41,42].
While the MAIC reduced observed differences in the baseline characteristics, residual confounding from unmeasured variables may still be present. Such residual confounding may lead to potential bias in the interpretation of the comparative effectiveness results, although the robust alignment achieved in the matching process minimizes this risk.
The distribution of disease severity among patients at baseline represents a potential effect modifier between trial populations. To account for this, only ELEVATE patients with an MMS score at baseline between 5 and 9 were included, as this is the US FDA mandated definition for moderately to severely active UC [27]. Further, MMS at baseline and the duration of UC were adjusted for within the analysis. When combined, these could act as a proxy for the distribution of disease severity of UC in patients at baseline across trials.
While both etrasimod and ozanimod have demonstrated positive results in clinical endpoints through their respective trials and other comparative studies [21,25,26,43], this study provides a comparison while adjusting for differences in population between etrasimod and ozanimod, reducing potential biases. The findings suggest that while the clinical response and clinical remission of the two treatments appears comparable during the induction phase, etrasimod may offer superior benefits during the maintenance phase. These findings may guide clinicians and healthcare decision makers in selecting treatment options. Future research and real-world studies may further clarify these benefits and help optimize treatment pathways for UC.
Conclusion
The findings of this study suggest that patients receiving etrasimod are more likely to achieve clinical response and clinical remission after 52 weeks of maintenance compared with ozanimod treated patients, when matched to the characteristics of the patients in the ozanimod trial. Despite the approach to ensure the comparability between the trials, residual imbalance is possible, and results should be interpreted within the context of the assumptions. The analyses conducted in this study may help support treating physicians in their therapeutic decisions and more broadly, healthcare decision and policy makers such as public and private payors on reimbursement choices, in the absence of head-to-head trial data.
Summary points
•
S1P receptor–modulating therapies (etrasimod and ozanimod) are the newest class of oral small molecules to be approved for the treatment of ulcerative colitis.
•
There are no head-to-head studies comparing etrasimod and ozanimod for the treatment of patients with moderately to severely active ulcerative colitis.
•
This study used matching-adjusted indirect comparisons to compare efficacy outcomes between etrasimod and ozanimod in the ozanimod trial population, matching on treatment effect modifiers.
•
There was little difference in efficacy outcomes between the treatments at the end of the induction period.
•
Following the maintenance period, the results suggested that patients receiving etrasimod were more likely to have a clinical response or be in clinical remission than patients receiving ozanimod.
Author contributions
L Bartolome, K Wosik, D Gruben, JC Cappelleri, P Hur, TP Leahy and R Potluri were responsible for study conception and design; TP Leahy, R Potluri, P Hur and L Bartolome were responsible for the acquisition of data; TP Leahy was responsible for the data analysis and all authors contributed to the drafting and revision of the manuscript.
Financial disclosure
This work was sponsored by Pfizer Inc. The authors have no other relevant affiliations or financial involvement with any organization or entity with a financial interest in or financial conflict with the subject matter or materials discussed in the manuscript apart from those disclosed.
Competing interests disclosure
V Jairath has received has received consulting/advisory board fees from AbbVie, Alimentiv, Arena pharmaceuticals, Asahi Kasei Pharma, Asieris, Astra Zeneca, Avoro Capital, Bristol Myers Squibb, Celltrion, Eli Lilly, Endpoint Health, Enthera, Ferring, Flagship Pioneering, Fresenius Kabi, Galapagos, Gilde Healthcare, GlaxoSmithKline, Genentech, Gilead, Innomar, JAMP, Janssen, Merck, Metacrine, Mylan, MRM Health, Pandion, Pendopharm, Pfizer, Protagonist, Prometheus Biosciences, Reistone Biopharma, Roche, Roivant, Sandoz, Second Genome, Sorriso, Synedgen, Takeda, TD Securities, Teva, Topivert, Ventyx, Vividion; speaker’s fees from, Abbvie, Ferring, Bristol Myers Squibb, Galapagos, Janssen Pfizer Shire, Takeda, Fresenius Kabi. T Raine has received research/educational grants and/or speaker/consultation fees from Abbvie, Arena, Aslan, AstraZeneca, Boehringer-Ingelheim, BMS, Celgene, Eli Lilly, Ferring, Galapagos, Gilead, GSK, Heptares, LabGenius, Janssen, MonteRosa, Mylan, MSD, Novartis, Numab, Pfizer, Roche, Sandoz, Takeda, UCB and XAP therapeutics. TP Leahy and R Potluri are employees of Putnam Associates. TP Leahy is a stockholder of Pfizer Inc. K Wosik, D Gruben, JC Cappelleri, P Hur and L Bartolome are all employees and stockholders of Pfizer Inc. The authors have no other competing interests or relevant affiliations with any organization or entity with the subject matter or materials discussed in the manuscript apart from those disclosed.
Writing disclosure
No writing assistance was utilized in the production of this manuscript.
Data availability statement
The data to support the findings of this study are available in corresponding publications as given in the article.
Open access
This work is licensed under the Attribution-NonCommercial-NoDerivatives 4.0 Unported License. To view a copy of this license, visit https://creativecommons.org/licenses/by-nc-nd/4.0/
Supplementary Material
File (supplementary materials.docx)
- Download
- 66.84 KB
References
Papers of special note have been highlighted as: • of interest
1.
Jess T, Gamborg M, Munkholm P, Sørensen TI. Overall and cause-specific mortality in ulcerative colitis: meta-analysis of population-based inception cohort studies. Am. J. Gastroenterol. 102(3), 609–617 (2007).
2.
Ungaro R, Mehandru S, Allen P, Peyrin-Biroulet L, Colombel J. Ulcerative colitis. Lancet 389(10080), 1756–1770 (2017).
3.
Berre C, Honap S, Peyrin-Biroulet L. Ulcerative colitis. Lancet 402(10401), 571–584 (2023).
4.
Lamb CA, Kennedy NA, Raine T et al. British Society of Gastroenterology consensus guidelines on the management of inflammatory bowel disease in adults. Gut 68(Suppl. 3), S1–S106 (2019).
5.
Raine T, Bonovas S, Burisch J et al. ECCO guidelines on therapeutics in ulcerative colitis: medical treatment. J. Crohns. Colitis 16(1), 2–17 (2022).
6.
Turner D, Ricciuto A, Lewis A et al. STRIDE-II: an update on the Selecting Therapeutic Targets in Inflammatory Bowel Disease (STRIDE) Initiative of the International Organization for the Study of IBD (IOIBD): determining therapeutic goals for treat-to-target strategies in IBD. Gastroenterology 160(5), 1570–1583 (2021).
7.
National Institute for Health and Care Excellence. Ulcerative Colitis: management. NICE guideline [NG130] (2019). Available at: https://www.nice.org.uk/guidance/ng130
8.
National Institute for Health and Care Excellence. Infliximab, adalimumab and golimumab for treating moderately to severely active ulcerative colitis after the failure of conventional therapy. Technology appraisal guidance [TA329] (2015). Available at: https://www.nice.org.uk/guidance/ta329
9.
National Institute for Health and Care Excellence. Ustekinumab for treating moderately to severely active ulcerative colitis. Technology appraisal guidance [TA633] (2020). Available at: https://www.nice.org.uk/guidance/ta633
10.
European Medicines Agency. Omvoh: EPAR – Product information. 2024. Available at: https://www.ema.europa.eu/en/documents/product-information/omvoh-epar-product-information_en.pdf
11.
Food & Drug Administration. Highlights of prescribing information: omvoh. 2023. Available at: https://www.accessdata.fda.gov/drugsatfda_docs/label/2023/761279s000lbl.pdf
12.
National Institute for Health and Care Excellence. Vedolizumab for treating moderately to severely active ulcerative colitis. Technology appraisal guidance [TA342] (2015). Available at: https://www.nice.org.uk/guidance/ta342
13.
National Institute for Health and Care Excellence. Tofacitinib for moderately to severely active ulcerative colitis. Technology appraisal guidance [TA547] (2018). Available at: https://www.nice.org.uk/guidance/ta547
14.
National Institute for Health and Care Excellence. Filgotinib for treating moderately to severely active ulcerative colitis. Technology appraisal guidance [TA792] (2022). Available at: https://www.nice.org.uk/guidance/ta792
15.
National Institute for Health and Care Excellence. Upadacitinib for treating moderately to severely active ulcerative colitis. Technology appraisal guidance [TA856] (2023). Available at: https://www.nice.org.uk/guidance/ta856
16.
National Institute for Health and Care Excellence. Ozanimod for treating moderately to severely active ulcerative colitis. Technology appraisal guidance [TA828] (2022). Available at: https://www.nice.org.uk/guidance/ta828
17.
National Institute for Health and Care Excellence. Etrasimod for treating moderately to severely active ulcerative colitis in people aged 16 and over. Technology appraisal guidance [TA956] (2024). Available at: https://www.nice.org.uk/guidance/ta956
18.
Bencardino S, D'Amico F, Faggiani I et al. Efficacy and safety of S1P1 receptor modulator drugs for patients with moderate-to-severe ulcerative colitis. J. Clin. Med. 12(15), 5014 (2023).
19.
Massironi S, Furfaro F, Bencardino S, Allocca M, Danese S. Immunity in digestive diseases: new drugs for inflammatory bowel disease treatment – insights from phase II and III trials. Gastroenterology 59(9), 761–787 (2024).
20.
Massironi S, Furfaro F, Bencardino S, Allocca M, Danese S. Immunity in digestive diseases: new drugs for inflammatory bowel disease treatment – insights from phase II and III trials. J. Gastroenterol. 59(9), 761–787 (2024).
21.
Jairath V, Leahy T, Potluri R et al. P849 Bayesian network meta-analysis of the efficacy of advanced therapies for patients with moderately to severely active ulcerative colitis naïve to advanced therapy. J. Crohns. Colitis 18(Suppl. 1), i1576–i1577 (2024).
22.
Rokkas T, Gisbert JP, Ekmektzoglou K et al. Comparative maintenance performance of all biologic agents and small molecules in ulcerative colitis: a network meta-analysis. Eur. J. Gastroenterol. Hepatol. 36(5), 520–533 (2024).
23.
Ades A, Welton NJ, Dias S, Phillippo DM, Caldwell DM. Twenty years of network meta-analysis: continuing controversies and recent developments. Res. Synth. Methods 15(5), 702–727 (2024).
24.
Page MJ, McKenzie JE, Bossuyt PM et al. The PRISMA 2020 statement: an updated guideline for reporting systematic reviews. Br. Med. J. 372, n71 (2021).
25.
Sandborn WJ, Feagan BG, D'Haens G et al. Ozanimod as induction and maintenance therapy for ulcerative colitis. N. Engl. J. Med. 385(14), 1280–1291 (2021).
• Primary publication presenting the results from the TRUE NORTH trial (ozanimod).
26.
Sandborn WJ, Vermeire S, Peyrin-Biroulet L et al. Etrasimod as induction and maintenance therapy for ulcerative colitis (ELEVATE): two randomised, double-blind, placebo-controlled, phase III studies. Lancet 401(10383), 1159–1171 (2023).
• Primary publication presenting the results from the ELEVATE UC trial program (etrasimod).
27.
Food & Drug Administration. Ulcerative colitis: developing drugs for treatment. Guidance for Industry (2022). Available at: https://www.fda.gov/regulatory-information/search-fda-guidance-documents/ulcerative-colitis-developing-drugs-treatment
28.
Phillippo D, Ades T, Dias S et al. NICE DSU Technical Support Document 18: methods for population-adjusted indirect comparisons in submissions to NICE. (2016). Available at: https://research-information.bris.ac.uk/en/publications/nice-dsu-technical-support-document-18-methods-for-population-adj
• Summarizes approaches for population-adjusted indirect comparisons.
29.
Dubinsky MC, Betts KA, LaPensee K et al. S694: comparative efficacy and safety of ozanimod vs adalimumab and vedolizumab in patients with moderately to severely active ulcerative colitis. Am. J. Gastroenterol. 116, S314 (2021).
30.
Loftus EV, Vermeire S, Feagan BG et al. Corticosteroid-sparing effects of filgotinib in moderately to severely active ulcerative colitis: data from the phase IIb/III SELECTION study. J. Crohns. Colitis 17(2), 211–220 (2023).
31.
Lu X, Gray E, Xin Y et al. CO95 a matching-adjusted indirect comparison of filgotinib versus tofacitinib for moderately to severely active ulcerative colitis. Value Health 25(7), S321 (2022).
32.
Reinisch W, Tran J, Patel K et al. P658: comparative efficacy and safety of upadacitinib versus tofacitinib as induction therapy in patients with moderately to severely active ulcerative colitis: a matching-adjusted indirect comparison. J. Crohns. Colitis 17(Suppl. 1), i785–i786 (2023).
33.
Signorovitch JE, Sikirica V, Erder MH et al. Matching-adjusted indirect comparisons: a new tool for timely comparative effectiveness research. Value Health 15(6), 940–947 (2012).
• This methodology article introduces matching-adjusted indirect comparison method.
34.
Signorovitch JE, Wu EQ, Yu AP et al. Comparative effectiveness without head-to-head trials: a method for matching-adjusted indirect comparisons applied to psoriasis treatment with adalimumab or etanercept. Pharmacoeconomics 28(10), 935–945 (2010).
35.
Young R. MAIC: matching-adjusted indirect comparison. (2022). Available at: https://CRANR-project.org/package=maic
36.
Jairath V, Sandborn WJ, Dong Y et al. 709: optimizing the definition of clinical response using the modified Mayo score: an analysis of a phase 2 study with mirikizumab in patients with ulcerative colitis. Am. J. Gastroenterol. 114(Suppl.), S417 (2019).
37.
Shehab M, Alrashed F, Alsayegh A et al. Comparative efficacy of biologics and small molecule in ulcerative colitis: a systematic review and network meta-analysis. Clin. Gastroenterol. Hepatol. 23(2), 250–262 (2025).
38.
Solitano V, Vuyyuru SK, MacDonald JK et al. Efficacy and safety of advanced oral small molecules for inflammatory bowel disease: systematic review and meta-analysis. J. Crohns. Colitis 17(11), 1800–1816 (2023).
39.
Naessens D, Cameron C, Hoaglin DC. Network meta-analysis of ulcerative colitis pharmacotherapies: carryover effects from induction and bias of the results. Clin. Gastroenterol. Hepatol. 19(10), 2219–2221 (2021).
40.
Beyer-Westendorf J, Büller H. External and internal validity of open label or double-blind trials in oral anticoagulation: better, worse or just different? J. Thromb. Haemost. 9(11), 2153–2158 (2011).
41.
Varu A, Wilson FR, Dyrda P et al. Treatment sequence network meta-analysis in Crohn's disease: a methodological case study. Curr. Med. Res. Opin. 35(5), 733–756 (2019).
42.
Varu A, Wilson FR, Dyrda P et al. Treatment sequence network meta-analysis in Crohn's disease: a methodological case study. Curr. Med. Res. Opin. 35(5), 733–756 (2019).
43.
Qiu J, Liu J, Cai K et al. Efficacy and safety of the S1PR modulator etrasimod in the treatment of moderately to severely active ulcerative colitis during the induction phase: a systematic review and meta-analysis of randomized controlled trials. Front. Pharmacol. 15, 1420455 (2024).
Information & Authors
Information
Published In
Copyright
© 2025 The authors. This work is licensed under the Attribution-NonCommercial-NoDerivatives 4.0 Unported License
History
Received: 16 October 2024
Accepted: 7 February 2025
Published online: 24 February 2025
Keywords:
Topics
Authors
Metrics & Citations
Metrics
Article Usage
Article usage data only available from February 2023. Historical article usage data, showing the number of article downloads, is available upon request.
Citations
How to Cite
Matching-adjusted indirect comparisons of efficacy outcomes between etrasimod and ozanimod for moderately to severely active ulcerative colitis. (2025) Journal of Comparative Effectiveness Research. DOI: 10.57264/cer-2024-0193
Export citation
Select the citation format you wish to export for this article or chapter.
Citing Literature
- Aleksandra Sobolewska-Włodarczyk, Jakub Orliński, Żaneta Witas, Łukasz Woźniak, Zuzanna Łysoń, Anita Gąsiorowska, Real-world utility of platelet count, hemoglobin, and iron levels as predictors of clinical response to vedolizumab in patients with ulcerative colitis: a retrospective, single-center study in Poland, BMC Gastroenterology, 10.1186/s12876-026-04780-y, 26, 1, (2026).
- Anurag Jha, Nirmal Paudel, Khawaja Arham Jawaid, Muhammad Haad Munir Chaudhry, Zain Ali, Farhan Javaid, Shazia Sharif, Ayesha Asghar, Muhammad Saad, Muhammad Nabeel Saddique, Efficacy and Safety of Etrasimod in Moderate-To-Severe Ulcerative Colitis: A GRADE-Based Systematic Review and Meta-Analysis of Randomized Controlled Trials, Annals of Pharmacotherapy, 10.1177/10600280261429462, (2026).
- Savika Bansal, Omesh Goyal, Manjeet Goyal, Ozanimod Therapy in Inflammatory Bowel Disease: From Concept to Real-world Application and Practical Considerations for Clinical Practice, International Journal of Immunology, 10.11648/j.iji.20251304.11, 13, 4, (77-89), (2025).
- Carlos Fernández Moriano, Pablo Caballero Portero, Etrasimod en colitis ulcerosa, Panorama Actual del Medicamento, 10.63105/49.483.4, 49, 483, (490-500), (2025).