Real-world ePRO use and clinical outcomes using electronic patient-reported symptom monitoring for patients with advanced non-small-cell lung cancer receiving first-line pembrolizumab
Publication: Journal of Comparative Effectiveness Research
Abstract
Aim: This ambispective observational study assessed the impact of Noona, an electronic patient-reported outcomes (ePRO) platform, for patients with non-small cell lung cancer (NSCLC) treated in a community oncology setting. Methods: Adults with advanced NSCLC, ECOG performance status of 0–2, who received first-line (1L) pembrolizumab (monotherapy or with chemotherapy) were eligible. Those initiating pembrolizumab from 1 July 2017 to 30 June 2019, identified retrospectively (historical cohort), were compared with those initiating pembrolizumab from 1 October 2019 to 30 September 2021 who were prospectively offered Noona (standard of care [SoC] cohort). The Kaplan–Meier method and Cox proportional hazards models were used to compare pembrolizumab real-world time on treatment (rwToT; primary outcome measure) and rw time to next treatment or death (rwTTNTD) between historical and SoC cohorts. Healthcare resource use (HCRU) was compared using generalized linear models with Poisson distribution. Analyses were repeated to compare outcomes in the SoC cohort between Noona users (created a profile and used any function ≥one-time during 1L therapy) and nonusers with >42 days on 1L pembrolizumab. Data cutoff was 30 June 2020 and 30 September 2022 for historical and SoC cohorts, respectively. Results: Median pembrolizumab rwToT was 4.4 months (95% CI: 3.9–5.1) in the historical cohort (n = 448) versus 4.1 months (95% CI: 3.3–4.8) in the SoC cohort (n = 462; adjusted hazard ratio [aHR], 0.9; 95% CI: 0.8–1.0; p = 0.14 vs historical cohort). In the SoC cohort, 147 of 341 eligible patients (43%) established a Noona profile; 122/341 (36%) were Noona users. Median rwToT was 6.4 months (95% CI: 5.1–7.4) and 6.9 months (95% CI: 5.6–7.6) among Noona users and Noona nonusers (n = 219), respectively (aHR, 1.1; 95% CI: 0.8–1.4; p = 0.95 vs Noona users). The rwTTNTD and HCRU were comparable in historical versus SoC cohorts and for Noona users versus nonusers. During the first year after establishing a Noona profile, 92 of 147 patients (63%) used the platform; monthly use was 32–42%, and checking laboratory results was the most used function overall (by 52% of the 147). Conclusion: Notwithstanding the null findings of this study, positive results of ePRO use in clinical trials and observational studies support the treatment-related symptom monitoring and survival benefits of ePRO utilization.
Plain language summary
What is this article about?
Patients with cancer often experience unpleasant symptoms related to their cancer treatment as well as to their cancer itself. Remote symptom monitoring using electronic patient-reported outcome (ePRO) tools could help patients to communicate easily with healthcare providers about their symptoms, which in turn could help them to stay on their cancer therapy by managing any unpleasant or unexpected symptoms more quickly and effectively. We studied the use of an ePRO tool for patients treated at a large network of cancer clinics who had advanced non-small cell lung cancer (NSCLC) and received an immunotherapy called pembrolizumab for their first cancer therapy. We evaluated the length of time they remained on pembrolizumab and compared it between patients treated before versus after the ePRO tool became available in September 2019 and between patients who did versus did not use the ePRO tool after it became available.
What were the results?
We found no differences in either comparison: the length of time on pembrolizumab was not statistically different between patients treated before or after ePRO tool availability or between patients who used or did not use the ePRO tool. There were also no differences in the time until patients received their next cancer treatment nor in use of healthcare resources. During the first year after signing up for the ePRO tool, about two-thirds of patients (63%) used it at least once and checking lab test results was the most common function used.
What do the results of the study mean?
Despite the fact that this study found no benefits of ePRO use for patients with advanced NSCLC, other studies have reported treatment-related symptom monitoring and survival benefits of ePRO tools for patients with cancer. The low levels of ePRO use in this study suggest a need for future research and improved strategies to increase ePRO uptake and use.
Patients with cancer often experience unpleasant symptoms related not only to their disease but to cancer treatment [1,2]. Early recognition of worsening symptoms, including those related to treatment, such as adverse events (AEs), is important for enabling effective management by the clinical care team, as the under-reporting of symptoms and delays in addressing AEs can disrupt treatment, potentially leading to negative outcomes [2–4]. In randomized clinical trials, remote symptom monitoring using electronic patient-reported outcome (ePRO) tools provided multiple benefits for patients receiving cancer therapy, including improved treatment-related symptom control, quality of life and overall survival (OS), with reductions in healthcare resource use (HCRU) [5–7].
Few studies have examined the use of ePRO tools for remote monitoring of patients treated in routine oncology practice outside of a clinical trial setting; however, encouraging results have been obtained in recent observational studies and pragmatic trials, with successful implementation of ePROs [8–15]. In one study, significantly fewer AEs, hospitalizations and emergency room visits were reported among patients with metastatic cancer whose symptoms were monitored with ePROs as compared with the matched control group not using ePROs [14,15].
Therapy with immune checkpoint inhibitors (ICIs, such as pembrolizumab, nivolumab, atezolizumab and durvalumab) has improved clinical outcomes in many types of cancers, including lung cancer, the leading cause of cancer death in the United States (US) [16]. Using ePRO tools for digital communication and remote monitoring could be particularly pertinent for patients treated with an ICI because the associated AEs often have an unpredictable onset, occur later in treatment and have longer duration than AEs associated with cytotoxic chemotherapy [3,17,18].
At the start of September 2019, an ePRO platform, Noona (Varian Medical Systems, Inc., CA, USA), was made available and offered to all patients as part of standard care at Tennessee Oncology (TN ONC), a large network of community-based cancer clinics in Tennessee and neighboring Kentucky and Georgia [19,20]. The Noona platform is a cloud-based digital cancer-specific communication and remote monitoring platform designed to improve communication between patients and their clinical care team [21,22]. It also provides portal functionality to remotely check test results and other information via computer or a smart device (e.g., smartphone, tablet). Noona was implemented at TN ONC in an effort to automate distress screening and better understand and address symptoms experienced by patients with cancer.
We conducted an observational study aimed at understanding the impact of Noona implementation at TN ONC practices for patients with advanced non-small cell lung cancer (NSCLC) receiving pembrolizumab as first-line therapy. In addition, we aimed to describe longitudinal utilization of Noona in this population and to compare outcomes between Noona users and Noona nonusers. The primary outcome measure was real-world time on treatment (rwToT) with pembrolizumab. In previous observational studies of immunotherapy, rwToT has been positively correlated with OS [23–25]. We hypothesized that patients receiving pembrolizumab as first-line therapy before Noona implementation at TN ONC (historical cohort) would have significantly shorter pembrolizumab rwTOT than those who had access to Noona (standard of care [SoC] cohort). This hypothesis was based on the belief that utilizing an ePRO tool would promote actionable communication between patients and their care team, particularly with regard to discussing treatment-related and other symptoms, with the potential to improve health outcomes.
Methods
Study design, data sources & patients
This ambispective (retrospective and prospective) cohort study was conducted using deidentified data abstracted from electronic health records (EHRs) of patients receiving routine oncology care at TN ONC combined with ePRO use data from Noona. As of November 2020, the TN ONC network included 34 sites, >76 medical oncologists, 75 mid-level providers and 275 clinical support staff providing treatment for >40,000 patients with cancer each year [20]. Study approval was provided by WCG IRB [26], which determined the study to be exempt from patient consent requirements, given the use of anonymized secondary data.
Patients included in the study had histologically or cytologically confirmed advanced NSCLC (unresectable stage III or stage IV, or recurrent NSCLC), with Eastern Cooperative Oncology Group performance status (ECOG PS) of 0–2, and who were ≥18 years of age at initiation of pembrolizumab (index date) as monotherapy or in combination with chemotherapy (platinum [carboplatin or cisplatin] and pemetrexed or carboplatin and paclitaxel or nab-paclitaxel). Eligible patients could have received prior chemotherapy and/or radiation therapy as part of adjuvant/neoadjuvant therapy, provided that treatment was completed at least 6 months before the diagnosis of advanced or metastatic disease, while those who started a second line of treatment, including targeted therapy for genomic alterations, within 28 days after initiating first-line pembrolizumab were excluded from the analyses. Patients who were pregnant and patients who enrolled in a clinical trial during pembrolizumab therapy were ineligible for the study.
Eligible patients were classified into one of two study cohorts according to the date when they initiated first-line pembrolizumab therapy: the historical cohort (initiation from 1 July 2017 to 30 June 2019, inclusive) or the SoC cohort (initiation from 1 October 2019 to 30 September 2021, inclusive). The historical cohort thus included patients initiating treatment within a 2-year period before Noona implementation, while the SoC cohort included patients initiating treatment within a 2-year period after Noona implementation. Data cutoff was 30 June 2020 for the historical cohort and 30 September 2022 for the SoC cohort, thereby enabling a minimum follow-up of 1 year for each cohort.
Noona users & nonusers (SoC cohort)
In the SoC cohort, Noona users were defined as patients who established a Noona profile and used any of the Noona functions at least once before the end of first-line therapy. Noona nonusers were defined as patients who either did not establish a Noona profile or who established a Noona profile but did not use Noona during first-line therapy.
Patients in the SoC cohort who received pembrolizumab for ≤42 days were excluded from the Noona user versus Noona nonuser comparative analyses. The 42-day interval (thus six weeks, the maximum cycle length of the 400-mg dose of pembrolizumab) was selected based on the clinical rationale that at least two pembrolizumab cycles would be required to classify a patient as a Noona user, because patients may be not be ready to establish a Noona profile at the time of the first cycle, so soon after receiving an advanced cancer diagnosis.
Chart abstraction & Noona use data
Trained clinical data abstractors employed by TN ONC identified study patients using International Classification of Diseases, Tenth Revision (ICD-10) codes and then applied the study eligibility criteria. For eligible patients, study-relevant data, including demographic, clinical, biomarker status and disease characteristics, were abstracted from structured and unstructured EHR data, curated and entered into an electronic clinical report form. Dates of death were determined using the Limited Access Death Master File (LADMF) of the Social Security Administration, the discrete fields in the EHR, unstructured data in the EHR (inter-chart communication between staff, death certificates, correspondence) and internet search engines that provide data from obituaries, funeral homes and other sources. The social security number was used to link patients from the EHR and LADMF data sources. For patients with conflicting dates of death from different sources, a hierarchy of data sources was used to identify the date of death.
The EHR data were subsequently merged with Noona use data, while symptom questionnaire responses, automated symptom alert information and texts (direct messaging or diary) were not included.
Noona platform
Since its implementation, Noona has been offered to all patients at their first appointment by the TN ONC front office staff, who provide support as needed for patients electing to use the platform. A relevant symptom module is assigned to patients who establish a Noona profile, together with provision of immediate access to a diary and to secure messaging with their clinical care team, the three core Noona functions. In addition, patients can access laboratory reports and view scheduled appointments. Patients can engage with the Noona platform using their smartphone, tablet, or computer. They can also request, by phone, to have the clinical care team manually enter symptoms into Noona on their behalf.
At five to seven days after each pembrolizumab infusion, patients with a Noona profile were prompted via email or an alert on their Noona application to complete a symptom questionnaire. The Noona questionnaires and features were tailored to the treatments that patients were receiving and any potential symptoms associated with those treatments. Patients who did not complete the questionnaire within three days were sent one reminder message and, if no response, were called by study care coordinators from days eight to ten after infusion. Patients were not prompted a third time and all uncompleted questionnaires expired after seven days. In addition to the post-infusion questionnaires, symptom questionnaires were accessible for patients to complete at any time (ad hoc).
The questionnaires included rule-based alerts reflecting moderate or severe symptoms. Upon receipt of a message or questionnaire response submitted by a patient in Noona, a member of the TN ONC care team (e.g., nurse, physician or pharmacist) read the information and evaluated the appropriate action as directed in the triaging algorithms built into the Noona system by the TN ONC and Noona teams. Clinical judgment was used on a case-by-case basis to define the appropriate response and included triage algorithms and guidelines from the National Comprehensive Cancer Network, Oncology Nursing Society and American Society of Clinical Oncology.
The care team would either offer ad hoc advice, forward the information to the patient's doctor, or recommend the patient seek immediate medical attention if a severe alert indicated a potentially emergent concern. Patients were also often contacted via telephone to clarify and provide in-depth information so that appropriate advice and treatment could be provided.
Statistical analyses
Baseline patient characteristics and outcomes were compared between historical and SoC cohorts and, in the SoC cohort, between Noona users and Noona nonusers. Descriptive statistics were used to summarize patient characteristics and HCRU, and the historical versus SoC cohorts and Noona users versus nonusers were compared using statistical tests as appropriate for the variable of interest, i.e., t-tests for continuous variables, the Mann-Whitney-Wilcoxon test for ordinal variables and Pearson's χ2 or Fisher's exact test for nominal variables.
The primary analysis using the nonparametric Kaplan–Meier method tested whether there was a significant difference between rwToT among patients initiating pembrolizumab before (historical cohort) or after Noona implementation (SoC cohort). The rwToT end point, also known as duration of therapy or real-world time to treatment discontinuation [27,28], was defined as the time from first-line pembrolizumab initiation to discontinuation, with discontinuation defined as the last pembrolizumab dose if a patient continued to a next line of therapy, died, had a gap of ≥120 days between the last dose and last known clinical activity in the dataset, or had a gap of <120 days and a physician order to discontinue pembrolizumab. All other patients were censored at the last pembrolizumab dose, as previously described in detail [27]. Inverse probability propensity weights were developed to account for differences between historical and SoC cohorts, including first-line regimen, baseline ECOG PS, PD-L1 expression level, neutrophil-to-lymphocyte ratio, histology, age at pembrolizumab initiation, sex, smoking status, advanced disease status, presence of brain metastases, presence of liver metastases and Census-Block-Group median 12-month household income (2021 estimate) [29]. A Cox proportional hazards model was used to determine the adjusted hazard ratio with 95% confidence interval (95% CI) comparing rwToT for the SoC cohort versus the historical cohort. Sensitivity analyses were conducted comparing historical and SoC cohorts after stratifying patients by ECOG PS (0–1 or 2) and by first-line pembrolizumab regimen (monotherapy or pembrolizumab combination therapy).
The same methods were used to compare rwToT for Noona users versus Noona nonusers in the SoC cohort and to compare real-world time to next treatment or death (rwTTNTD) between historical and SoC cohorts and between Noona users and Noona nonusers, defining rwTTNTD as the time from first-line pembrolizumab initiation to initiation of a subsequent (second-line) therapy or death, with censoring of patients who did not initiate second-line therapy [30].
We assessed the longitudinal use rates of four Noona functions (symptom questionnaire, direct messaging, diary function and laboratory report checking) among patients in the SoC cohort who established a Noona profile on or before the end of first-line therapy. This descriptive analysis aimed to understand the time intervals at which Noona was most frequently used and to identify the most frequently used Noona functions. Longitudinal Noona use was summarized overall for the first year after patients established a Noona profile and monthly according to the proportion of patients among those eligible to utilize Noona within the time interval (i.e., patients who had a Noona profile, were alive and were not lost to follow-up at start of the interval).
We evaluated HCRU, including hospitalizations (inpatient admissions), intensive care unit (ICU) stays and emergency department (ED) visits from pembrolizumab initiation for 12 months of follow-up or until the last dose of pembrolizumab plus 30 days, whichever came first. Differences between historical and SoC cohorts and between Noona users and Noona nonusers for person-time rates (hospitalizations per month and ED visits per month) were assessed using a generalized linear model with a Poisson distribution, a log-link function and log(months) as an offset, while controlling for baseline variables, using inverse probability propensity weights (variables listed above).
A sample size of 900 patients, 450 in each of the historical and SoC cohorts, was estimated to provide 80% power for demonstrating a statistically significantly longer rwToT for the historical versus SoC cohort comparison (2-sided α <0.05). The median rwToT was assumed to be approximately 5.2 months for pembrolizumab with or without chemotherapy, based on an analysis of the Flatiron Health Advanced NSCLC database of patients with ECOG PS 0–2 who were treated with a first-line pembrolizumab-based regimen (unpublished data, Merck & Co., Inc., NJ, USA) [31]. The target hazard ratio was approximately 0.82.
Statistical analyses were conducted using SAS (SAS Viya, V.04.0; SAS Institute, NC, USA). Propensity weights were derived using TWANG (Toolkit for Weighting and Analysis of Nonequivalent Groups; version 2.5 [32]) and applied using R's “survey: Analysis of Complex Survey Samples” (version 4.2.3 [33]).
Results
Patients
Historical & SoC cohorts
Of 916 patients identified in EHRs (451 in historical and 465 in SoC cohorts), 6 patients (3 in each cohort) were excluded for starting second-line targeted therapy within 28 days after initiating first-line pembrolizumab. Therefore, a total of 910 patients were included in the study, 448 patients in the historical cohort and 462 in the SoC cohort (Figure 1).
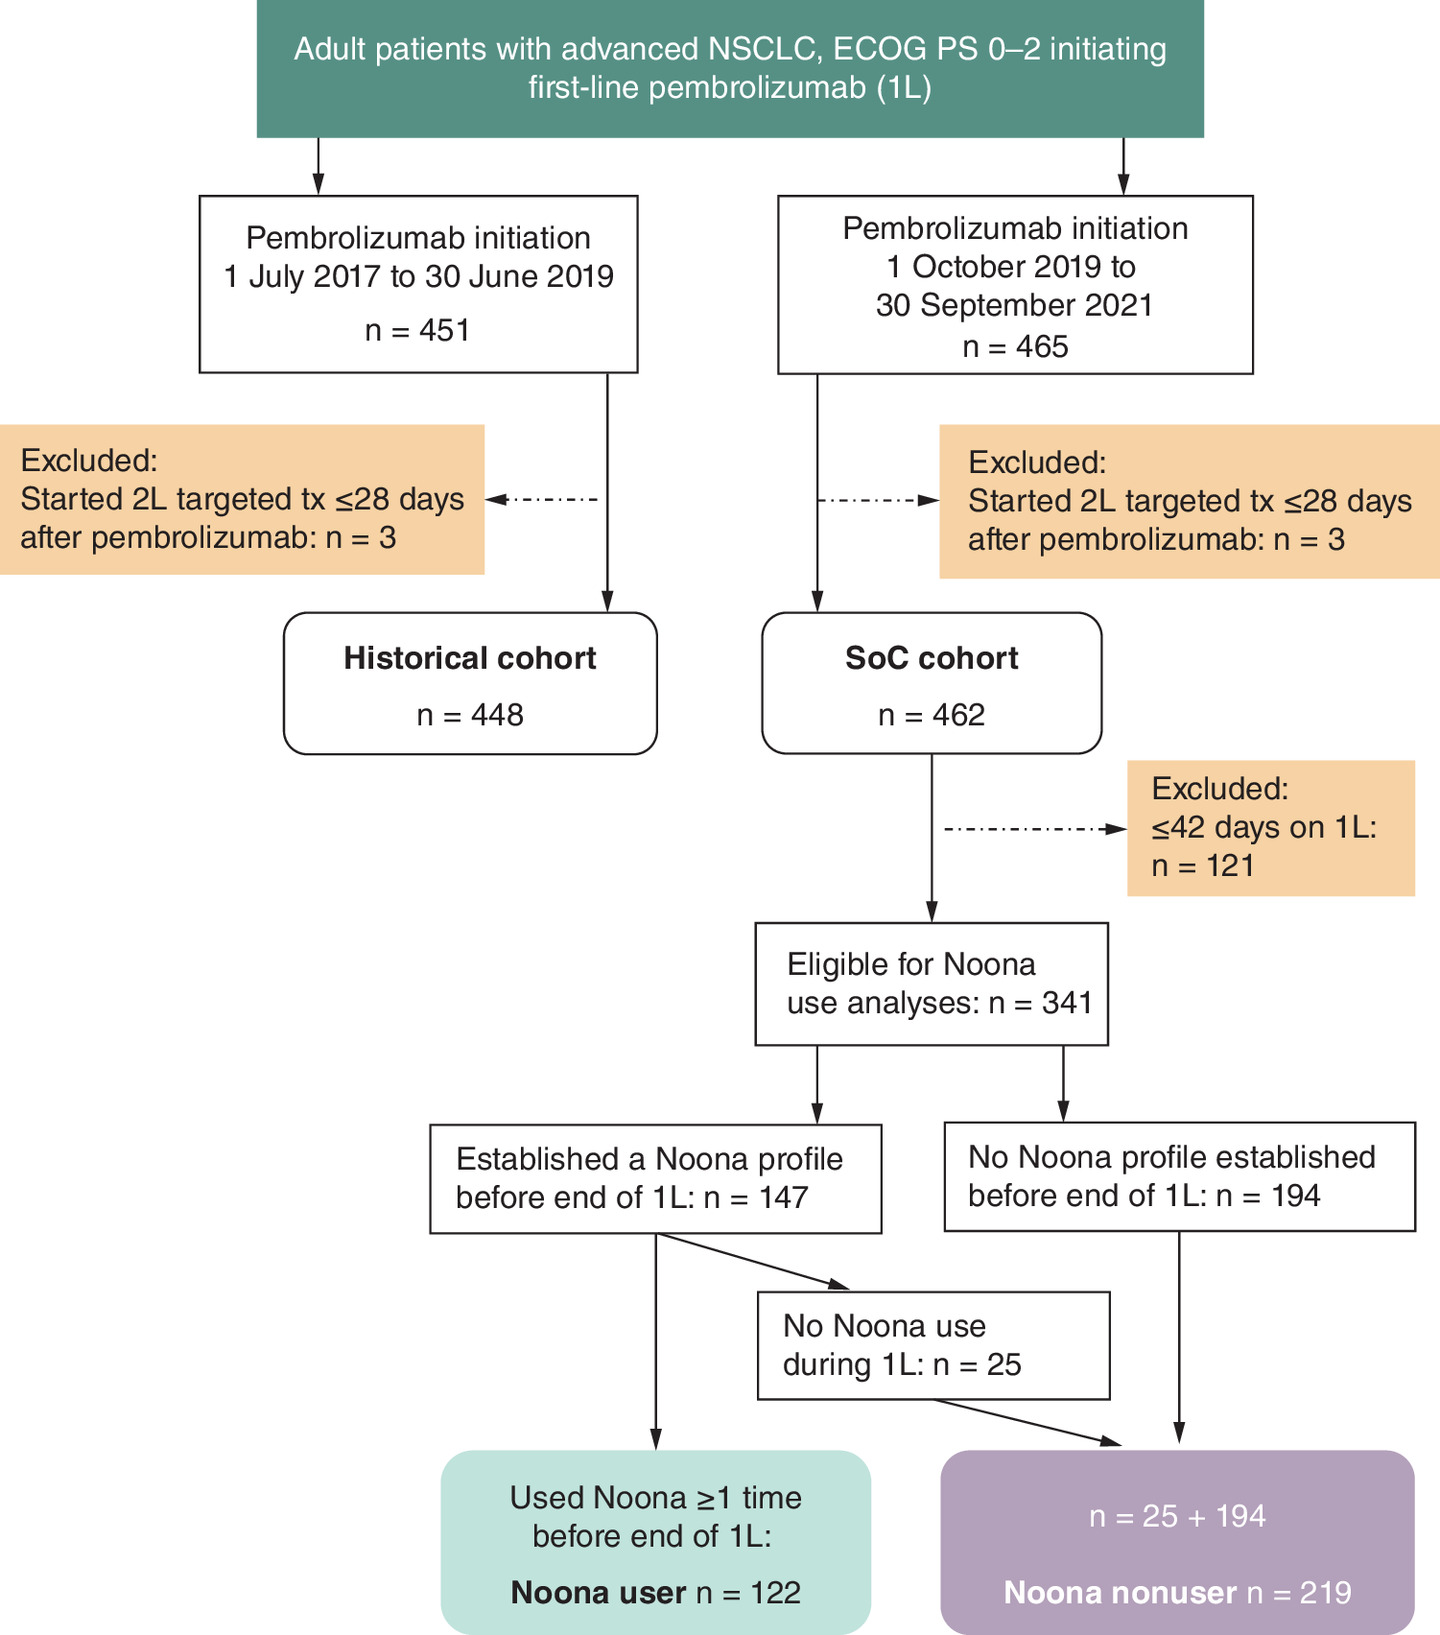
Figure 1. Patient identification.
1L: First-line pembrolizumab therapy; 2L targeted tx: Second-line targeted therapy; ECOG PS: Eastern Cooperative Oncology Group performance status; SoC: Standard of care.
The median age at initiation of first-line pembrolizumab therapy was 67 years in the historical cohort and 69 years in the SoC cohort; 40 and 46% of patients were women, respectively (Table 1). The majority of patients in both cohorts were White (∼84%) and current or former smokers (92%). Marital status and living arrangements were similar in historical and SoC cohorts (data not shown).
| Characteristic | Historical cohort (n = 448) | SoC cohort (n = 462) | p-value | SoC cohort – time on 1L >42 days | ||
|---|---|---|---|---|---|---|
| Noona user (n = 122) | Noona nonuser (n = 219) | p-value | ||||
| Age, median (range), years | 67 (34–94) | 69 (40–92) | 0.02 | 68 (43–92) | 69 (40–92) | 0.86 |
| Sex | ||||||
| Male | 271 (60.5) | 252 (54.6) | 0.07 | 60 (49.2) | 126 (57.5) | 0.14 |
| Female | 177 (39.5) | 210 (45.5) | 62 (50.8) | 93 (42.5) | ||
| Race/ethnicity | ||||||
| White | 381 (85.0) | 386 (83.6) | 0.43 | 110 (90.2) | 173 (79.0) | 0.11 |
| Black | 50 (11.2) | 57 (12.3) | 8 (6.6) | 36 (16.4) | ||
| Hispanic or Latino | 4 (0.9) | 2 (0.4) | 0 | 1 (0.5) | ||
| Asian | 4 (0.9) | 1 (0.2) | 0 | 1 (0.5) | ||
| Other race | 3 (0.7) | 4 (0.9) | 2 (1.6) | 2 (0.9) | ||
| Unknown | 6 (1.3) | 12 (2.6) | 2 (1.6) | 6 (2.7) | ||
| Highest educational level | ||||||
| High school or lower | 27 (6.0) | 171 (37.0) | <0.01 | 43 (35.3) | 81 (37.0) | <0.01 |
| College | 7 (1.6) | 61 (13.2) | 23 (18.9) | 19 (8.7) | ||
| Graduate school | 4 (0.9) | 15 (3.3) | 7 (5.7) | 5 (2.3) | ||
| Not documented | 410 (91.5) | 215 (46.5) | 49 (40.2) | 114 (52.1) | ||
| CBG median 12-mo income | ||||||
| Mean (SD), USD ($) | 68,535 (29,706) | 66,610 (26,124) | 0.32 | 69,121 (24,902) | 65,161 (26,111) | 0.20 |
| Median, USD ($) | 61,657 | 61,054 | 64,779 | 59,576 | ||
| Interquartile range, USD ($) | 48,412–84,531 | 48,412–82,529 | 50,413–86,862 | 47,551–80,737 | ||
| Not documented, n (%) | 26 (5.8) | 39 (8.4) | 17 (13.9) | 13 (5.9) | ||
| Patient or caregiver regular access to internet† | ||||||
| Yes | 3 (0.7) | 205 (44.4) | <0.01 | 70 (57.4) | 74 (33.8) | <0.01 |
| No | 1 (0.2) | 20 (4.3) | 0 | 16 (7.3) | ||
| Not documented | 444 (99.1) | 237 (51.3) | 52 (42.6) | 129 (58.9) | ||
| Smoking status‡ | ||||||
| Former | 259 (57.8) | 268 (58.0) | 0.79 | 77 (63.1) | 123 (56.2) | 0.41 |
| Current | 154 (34.4) | 158 (34.2) | 35 (28.7) | 78 (35.6) | ||
| Never | 34 (7.6) | 36 (7.8) | 10 (8.2) | 18 (8.2) | ||
†
Internet access via computer/tablet/smartphone.
‡
In the historical cohort, smoking status was not documented for one patient.
Data are n (%) unless otherwise noted. Percentages may not add up to 100 because of rounding.
1L: First-line pembrolizumab therapy; CBG: Census-Block-Group median household income (2021 estimate); SoC: Standard of care; USD: United States dollars ($).
The distributions of ECOG PS and NSCLC histologic types were similar in historical and SoC cohorts (Table 2). Among patients with documented PD-L1 tumor expression, 161/366 patients (44%) in the historical cohort and 133/398 (33%) in the SoC cohort had PD-L1 expression of ≥50%. Across the cohorts, EGFR, ALK, or ROS1 genomic alterations were similarly low (<5%; Table 2).
| Characteristic | Historical cohort (n = 448) | SoC cohort (n = 462) | p-value | SoC cohort – time on 1L >42 days | ||
|---|---|---|---|---|---|---|
| Noona user (n = 122) | Noona nonuser (n = 219) | p-value | ||||
| ECOG performance status | ||||||
| 0 | 90 (20.1) | 95 (20.6) | 0.09 | 25 (20.5) | 57 (26.0) | 0.44 |
| 1 | 226 (50.5) | 260 (56.3) | 70 (57.4) | 122 (55.7) | ||
| 2 | 132 (29.5) | 107 (23.2) | 25 (20.5) | 57 (26.0) | ||
| CCI, mean (SD) | 3.9 (1.2) | 4.2 (1.5) | <0.01 | 4.1 (1.4) | 4.3 (1.6) | 0.29 |
| NSCLC stage at initial diagnosis† | ||||||
| I | 30 (6.7) | 37 (8.0) | 0.41 | 8 (6.6) | 22 (10.1) | 0.36 |
| II | 18 (4.0) | 18 (3.9) | 5 (4.1) | 8 (3.7) | ||
| III | 51 (11.4) | 47 (10.2) | 10 (8.2) | 28 (12.8) | ||
| IV | 346 (77.2) | 360 (77.9) | 99 (81.2) | 161 (73.5) | ||
| Status at advanced disease | ||||||
| Recurrence or progression | 76 (17.0) | 77 (16.7) | 0.96 | 16 (13.1) | 44 (20.1) | 0.24 |
| De novo stage III | 26 (5.8) | 25 (5.4) | 7 (5.7) | 14 (6.4) | ||
| Stage IV at diagnosis | 346 (77.2) | 360 (77.9) | 99 (81.2) | 161 (73.5) | ||
| NSCLC histology | ||||||
| Adenocarcinoma | 297 (66.3) | 291 (63.0) | 0.23 | 74 (60.7) | 141 (64.4) | 0.70 |
| Squamous cell carcinoma | 112 (25.0) | 144 (31.2) | 41 (33.6) | 69 (31.5) | ||
| Adenosquamous | 11 (2.5) | 7 (1.5) | 1 (0.8) | 3 (1.4) | ||
| Large cell | 8 (1.8) | 3 (0.7) | 0 | 1 (0.5) | ||
| Bronchioalveolar | 1 (0.2) | 0 | 0 | 0 | ||
| Other | 5 (1.1) | 4 (0.9) | 2 (1.6) | 1 (0.5) | ||
| NOS/Not documented | 14 (3.1) | 13 (2.8) | 4 (3.3) | 4 (1.8) | ||
| Brain metastasis | 85 (19.0) | 78 (16.9) | 0.41 | 14 (11.5) | 38 (17.4) | 0.15 |
| Liver metastasis | 63 (14.1) | 84 (18.2) | 0.09 | 17 (13.9) | 40 (18.3) | 0.30 |
| PD-L1 expression | ||||||
| <1% | 99 (22.1) | 111 (24.0) | <0.01 | 28 (23.0) | 56 (25.6) | 0.75 |
| 1–49% | 86 (19.2) | 154 (33.3) | 39 (32.0) | 71 (32.4) | ||
| ≥50% | 161 (35.9) | 133 (28.8) | 42 (34.4) | 64 (29.2) | ||
| Not documented/unknown | 102 (22.8) | 64 (13.9) | 13 (10.7) | 28 (12.8) | ||
| EGFR/ALK/ROS1 genomic alteration status | ||||||
| Genomic alteration detected (any of the 3) | 19 (4.2) | 10 (2.2) | <0.01 | 2 (1.6) | 5 (2.3) | n/a |
| EGFR/ALK/ROS1 wild type | 319 (71.2) | 375 (81.2) | 99 (81.2) | 177 (80.8) | ||
| Not documented/unknown | 110 (24.6) | 77 (16.7) | 21 (17.2) | 37 (16.9) | ||
| 1L pembrolizumab regimen | ||||||
| Pembrolizumab monotherapy | 142 (31.7) | 123 (26.6) | <0.01 | 30 (24.6) | 63 (28.8) | 0.64 |
| Pembrolizumab/platinum/pemetrexed | 226 (50.0) | 211 (45.7) | 58 (47.5) | 94 (42.9) | ||
| Pembrolizumab/carboplatin/(nab)paclitaxel | 82 (18.3) | 128 (27.7) | 34 (27.9) | 62 (28.3) | ||
| First dose of pembrolizumab | ||||||
| 200 mg | 438 (97.8) | 295 (63.9) | <0.01 | 76 (62.3) | 144 (65.8) | 0.43 |
| 400 mg | 0 | 164 (35.5) | 46 (37.7) | 73 (33.3) | ||
| Other‡ | 10 (2.2) | 3 (0.7) | 0 | 2 (0.9) | ||
†
In the historical cohort, initial NSCLC stage was not documented for three patients (0.7%).
‡
Other pembrolizumab doses ranged from 132 to 300 mg.
Data are n (%) unless otherwise noted. Percentages may not add up to 100 because of rounding.
All samples for biomarker testing were taken before or <60 days after pembrolizumab initiation.
1L: First-line; CCI: Charlson comorbidity index; ECOG: Eastern Cooperative Oncology Group; n/a: Not assessed; NSCLC NOS: Non-small cell lung cancer, not otherwise specified; PD-L1: Programmed death-ligand 1; SoC: Standard of care.
SoC cohort: Noona users & Noona nonusers
Of 462 patients in the SoC cohort, 121 patients (26%) had ≤42 days on first-line therapy and therefore were excluded from the Noona use comparisons (Figure 1). Among the remaining 341 patients in the SoC cohort, 147 patients (43%) established a Noona profile on or before the end of first-line therapy and 122 of these 147 patients (83%) used Noona at least once before the end of first-line therapy (thus were Noona users), while 25 of the 147 patients (17%) with a Noona profile did not use Noona before the end of first-line therapy and thus were included among the Noona nonusers. The overall distribution of the 341 patients included in the Noona use analyses was 36% Noona users (n = 122) and 64% Noona nonusers (n = 219).
The median age at initiation of first-line pembrolizumab therapy was 68 and 69 years in Noona user and Noona nonuser cohorts, respectively; 51 and 43% of patients were women, respectively and 90 and 79% were White, respectively (Table 1). In both cohorts, the majority of patients had ECOG PS of 0 or 1, a NSCLC diagnosis at stage IV and lung adenocarcinoma histologic type (Table 2).
First-line pembrolizumab therapy
For first-line pembrolizumab, 32% of patients in the historical cohort and 27% in the SoC cohort received pembrolizumab monotherapy. Most patients in the historical cohort received the 200-mg dose of pembrolizumab, while 64% in the SoC cohort received the 200-mg dose and 36% received the 400-mg dose, administered every 6 weeks, for which regulatory approval was obtained on 28 April 2020 (Table 2).
Overall, 25 and 29% of Noona users and Noona nonusers, respectively, received pembrolizumab monotherapy and 75 and 71%, respectively, received pembrolizumab combination regimens.
Results of inverse probability propensity weighting
There were statistically significant differences in the unweighted comparisons between historical and SoC cohorts for first-line regimen type and, at baseline, PD-L1 expression and neutrophil-to-lymphocyte ratio. After the weights were applied, the cohorts were balanced on all 12 characteristics (data not shown). For the unweighted comparisons between Noona users and Noona nonusers, there were no statistically significant differences among the factors, but there were significantly more Noona users who were missing a value for Census Block Group median 12-month income. The cohorts were balanced on all 12 characteristics after the weights were applied (data not shown).
rwToT with first-line pembrolizumab & rwTTNTD
The median patient follow-up time from pembrolizumab initiation to death or data cut-off, whichever came first, was 11.3 months and 9.9 months in historical and SoC cohorts, respectively (Table 3).
| Variable | Historical cohort (n = 448) | SoC cohort (n = 462) | SoC cohort – time on 1L >42 days | |
|---|---|---|---|---|
| Noona user (n = 122) | Noona nonuser (n = 219) | |||
| Study follow-up, median (range), mo† | 21.5 (12.1–36.0) | 24.7 (12.0–36.0) | 23.6 (12.1–36.0) | 26.1 (12.0–36.0) |
| Patient follow-up, median (range), mo† | 11.3 (0.1–36.0) | 9.9 (0.1–35.9) | 14.9 (1.7–35.6) | 13.2 (1.7–35.9) |
| Discontinued pembrolizumab, n (%) | 429 (95.8) | 403 (87.2) | 100 (82.0) | 182 (83.1) |
| Median rwToT (95% CI), mo | 4.4 (3.9–5.1) | 4.1 (3.3–4.8) | 6.4 (5.1–7.4) | 6.9 (5.6–7.6) |
| On-treatment rate, % (95% CI)‡ | ||||
| At 6 months | 39.1 (34.5–43.6) | 39.8 (35.3–44.3) | 52.5 (43.2–60.9) | 54.8 (48.0–61.1) |
| At 12 months | 21.9 (18.2–25.8) | 21.6 (18.0–25.5) | 31.1 (23.2–39.4) | 28.3 (22.5–34.4) |
| At 18 months | 12.6 (9.7–15.9) | 15.6 (12.3–19.2) | 20.7 (13.7–28.8) | 21.3 (16.0–27.1) |
| Restricted mean rwToT (95% CI), mo‡ | ||||
| Restricted to 6 months | 3.7 (3.5–3.9) | 3.5 (3.3–3.8) | 4.7 (4.4–5.0) | 4.7 (4.5–4.9) |
| Restricted to 12 months | 5.5 (5.1–5.9) | 5.3 (4.8–5.7) | 7.1 (6.4–7.8) | 7.0 (6.5–7.6) |
| Restricted to 18 months | 6.5 (5.9–7.1) | 6.4 (5.8–7.0) | 8.6 (7.6–9.7) | 8.5 (7.7–9.3) |
| rwTTNTD events, n (%) | 345 (77.0) | 365 (79.0) | 83 (68.0) | 161 (73.5) |
| Median rwTTNTD (95% CI), mo | 8.1 (6.8–9.0) | 7.3 (6.4–8.2) | 10.3 (8.3–15.7) | 9.9 (8.7–11.1) |
| Rate of no next treatment or death, % (95% CI)‡ | ||||
| At 6 months | 58.3 (53.5–62.7) | 55.8 (51.2–60.2) | 74.6 (65.9–81.4) | 71.7 (65.2–77.2) |
| At 12 months | 35.0 (30.6–39.4) | 33.0 (28.8–37.3) | 48.1 (39.0–56.7) | 41.6 (35.0–48.0) |
| At 18 months | 25.9 (21.8–30.2) | 22.7 (18.8–26.8) | 34.8 (25.9–43.7) | 28.6 (22.5–35.0) |
| At 24 months | n/a‡ | 19.6 (15.8–23.6) | 27.5 (18.7–36.9) | 25.8 (19.8–32.2) |
†
Study follow-up was defined as the time from pembrolizumab initiation to data cutoff. Patient follow-up was defined as time from pembrolizumab initiation to death or data cutoff, whichever came first.
‡
On-treatment rate, restricted mean rwToT and rate of no next treatment were calculated for sample sizes ≥10% of the cohort size.
1L: First-line pembrolizumab therapy; mo: Month; SoC: Standard of care.
The median pembrolizumab rwToT was 4.4 months (95% CI: 3.9–5.1) in the historical cohort and 4.1 months (95% CI: 3.3–4.8) in the SoC cohort (adjusted HR, 0.9; 95% CI: 0.8–1.0; log-rank p = 0.14); 22% of patients in each cohort remained on pembrolizumab at 12 months (Table 3, Figure 2A). In sensitivity analyses, there were no differences between historical and SoC cohorts when patients were stratified by ECOG PS (ECOG PS of 0–1 or ECOG PS of 2) or when patients were stratified by type of pembrolizumab regimen (monotherapy or pembrolizumab combination therapy; data not shown).
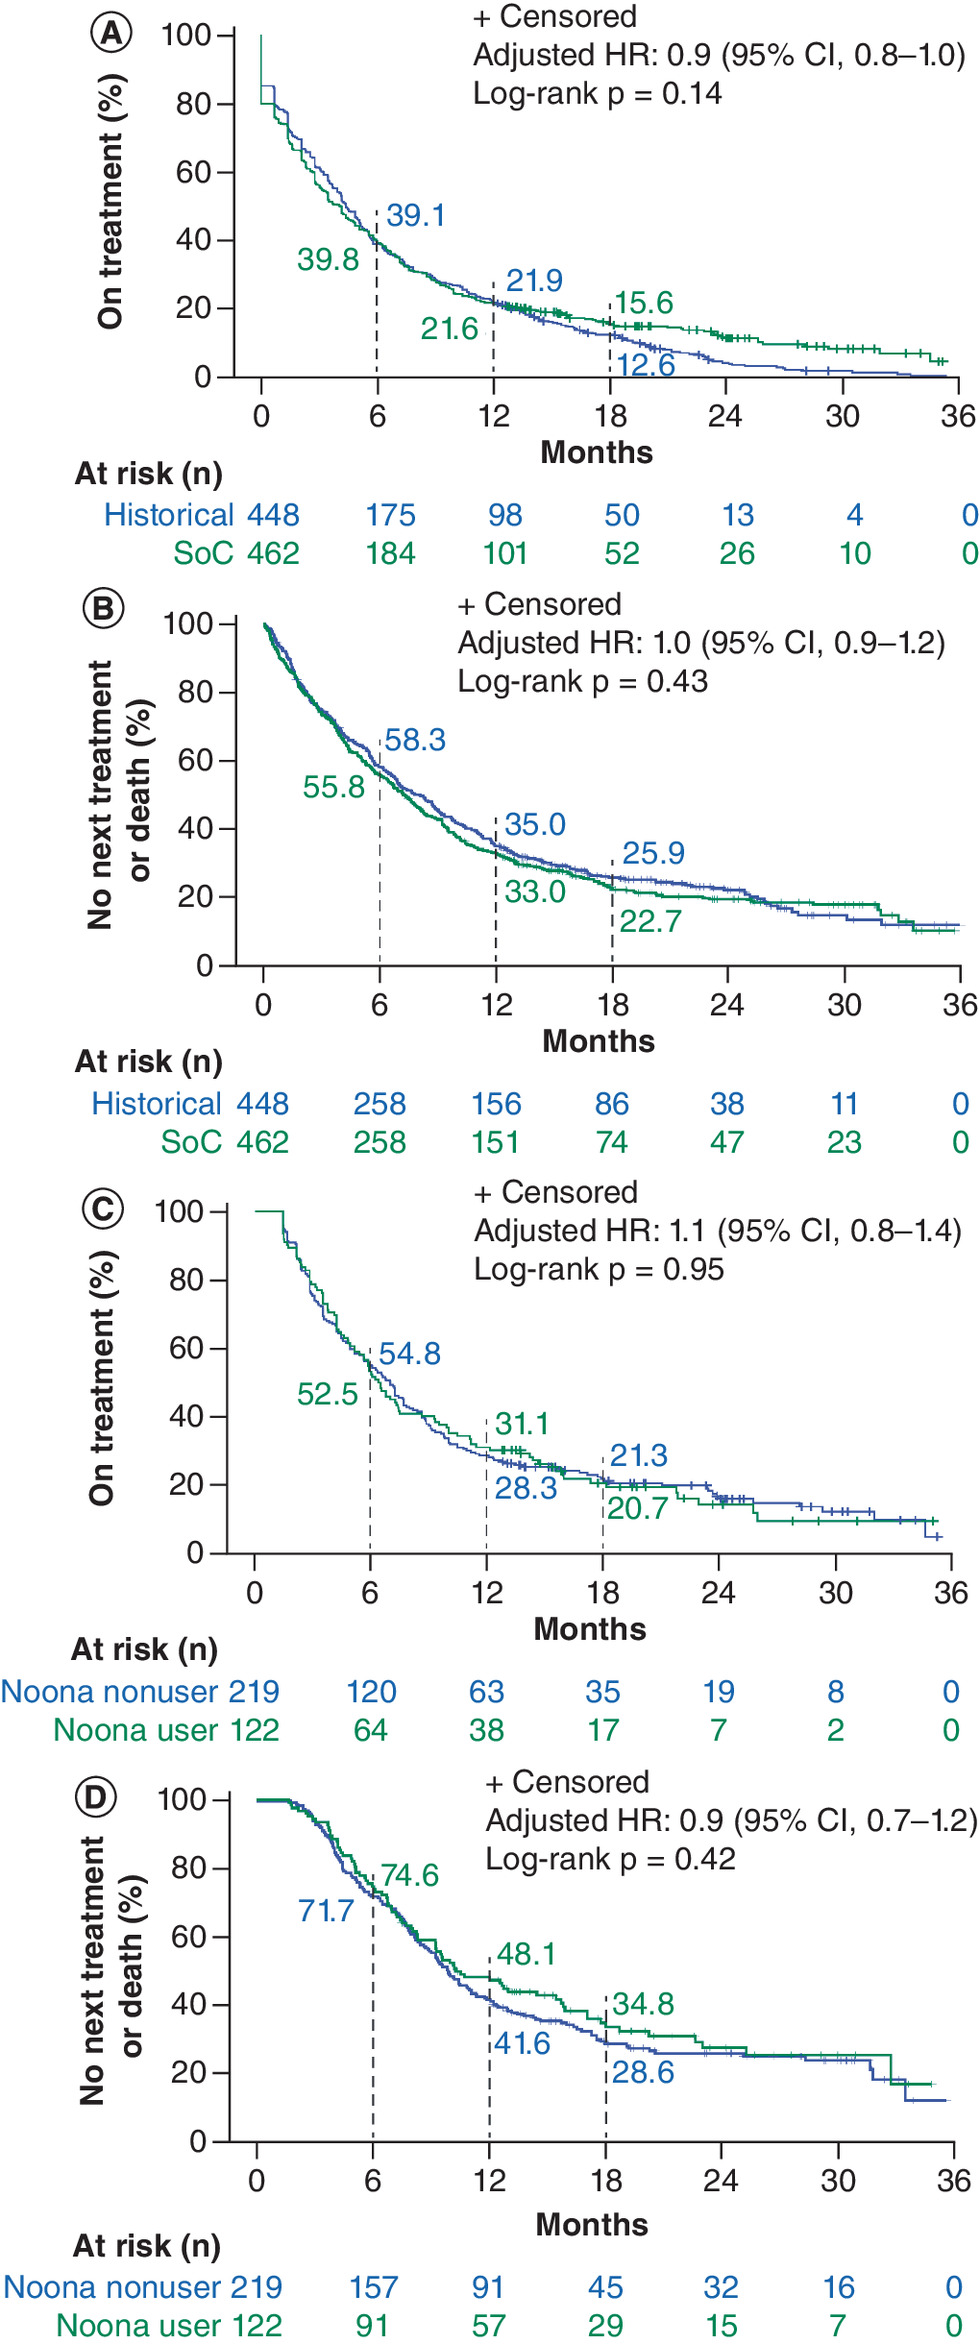
Figure 2. Kaplan–Meier plots for historical and standard of care cohorts (i.e., before and after Noona implementation).
(A) Real-world time on treatment (rwToT) with first-line pembrolizumab and (B) real-world time to next treatment or death (rwTTNTD). Panels (C) and (D) depict first-line pembrolizumab rwToT and rwTTNTD results for Noona users and Noona nonusers, respectively.
CI: Confidence interval; HR: Hazard ratio; SoC: Standard of care.
The median rwTTNTD was 8.1 months (95% CI: 6.8–9.0) in the historical cohort and 7.3 months (95% CI: 6.4–8.2) in the SoC cohort (adjusted HR, 1.0; 95% CI: 0.9–1.2; log-rank p = 0.43). At 12 months, 35 and 33% of patients, respectively, had not died or continued to second-line therapy (Table 3, Figure 2B).
In the SoC cohort, among patients whose time on first-line pembrolizumab was >42 days, the median patient follow-up time was 14.9 and 13.2 months among Noona users and nonusers, respectively (Table 3). The pembrolizumab rwToT did not differ by Noona use: median rwToT was 6.4 months (95% CI: 5.1–7.4) among Noona users and 6.9 months (95% CI: 5.6–7.6) among Noona nonusers (adjusted HR, 1.1; 95% CI: 0.8–1.4; log-rank p = 0.95; Table 3, Figure 2C). Likewise, rwTTNTD was similar in the two cohorts (adjusted HR, 0.9; 95% CI: 0.7–1.2 log-rank p = 0.42; Table 3, Figure 2D).
Patterns of Noona use during the first year after establishing a Noona profile
At least one Noona function was utilized by 92 of the 147 patients with a Noona profile (63%) during the first 12 months after they established their Noona profile (Figure 3).
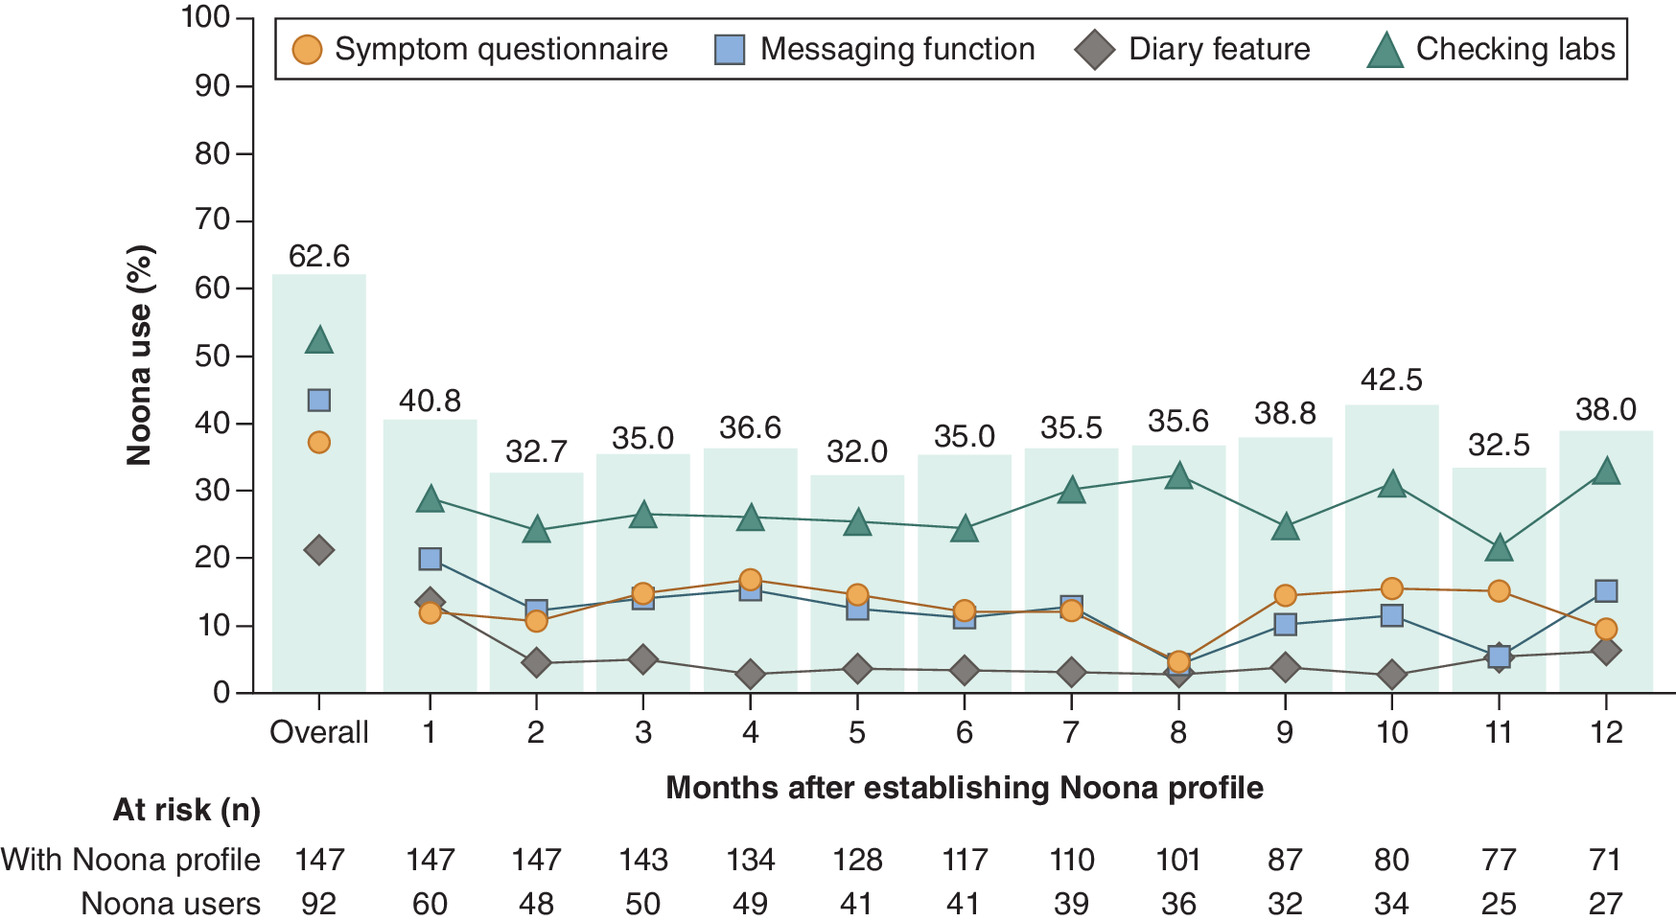
Figure 3. Percentages of patients in the SoC cohort who used a Noona function among 147 patients who established a Noona profile on or before the end of first-line pembrolizumab therapy.
Time zero (start of follow-up) for each patient is the date when they established their Noona profile or the date of initiating first-line pembrolizumab for those who established a profile before that day. Each time point in the figure is limited to patients eligible to utilize Noona within the time interval, defined as a patient who had not died or been lost to follow-up at start of the interval.
Labs: Laboratory test results.
Overall, 41% of 147 patients used Noona during month 1 and 43% of 80 patients used Noona in month 10; during the other months, from 32% to 39% used the Noona platform. Most patients used Noona to check laboratory results (52% of the 147 patients) or to use the secure messaging feature (44%); 38% used Noona to complete a symptom questionnaire and 22% used the diary function (Figure 3).
Pembrolizumab & subsequent therapy
Patients in the historical cohort received a median of 6 pembrolizumab doses and those in the SoC cohort received a median of 5 doses (Table 4). The most common reason for pembrolizumab discontinuation in both cohorts was disease progression; the second most common reason in the historical cohort was because of disease-related symptoms, while in the SoC cohort, patients were more likely to discontinue based on patient request (Table 4). There were also no significant differences between Noona users and Noona nonusers in number of pembrolizumab doses or reasons for pembrolizumab discontinuation (Table 4).
| Variable† | Historical cohort (n = 448) | SoC cohort (n = 462) | p-value | SoC: Noona user (n = 122) | SoC: Noona nonuser (n = 219) | p-value |
|---|---|---|---|---|---|---|
| Pembrolizumab doses, n, median (range) | 6 (1–66) | 5 (0–49) | <0.01 | 7.5 (2–49) | 8.0 (2–48) | 0.70 |
| Reason for 1L pembrolizumab discontinuation† | ||||||
| Progression | 158 (35.0) | 147 (31.5) | <0.01 | 44 (35.8) | 82 (37.1) | 0.24 |
| Patient request | 57 (12.6) | 81 (17.3) | 13 (10.6) | 31 (14.0) | ||
| Disease-related symptoms not due to therapy | 35 (7.8) | 21 (4.5) | 5 (4.1) | 8 (3.6) | ||
| Toxic effect of therapy | 28 (6.2) | 19 (4.1) | 11 (8.9) | 7 (3.2) | ||
| Completed treatment | 33 (7.3) | 12 (2.6) | 3 (2.4) | 9 (4.1) | ||
| Financial | 4 (0.9) | 2 (0.4) | 0 | 2 (0.9) | ||
| Other‡ | 30 (6.7) | 27 (5.8) | 3 (2.4) | 11 (5.0) | ||
| Not documented/unknown | 106 (23.5) | 158 (33.8) | 44 (35.8) | 71 (32.1) | ||
| Receipt of subsequent therapy line | ||||||
| Second line | 126 (28.1) | 120 (26.0) | n/a | 42 (34.4) | 63 (28.8) | n/a |
| Third line | 45 (10.0) | 37 (8.0) | 15 (12.3) | 17 (7.8) | ||
| Fourth line | 16 (3.6) | 13 (2.8) | 5 (4.1) | 6 (2.7) | ||
| Hospitalizations, n, mean (SD)§ | 0.5 (0.8) | 0.4 (0.7) | 0.4 (0.8) | 0.3 (0.6) | ||
| None | 294 (65.6) | 330 (71.4) | 0.14 | 85 (69.7) | 162 (74.0) | 0.67 |
| 1 | 110 (24.6) | 101 (21.9) | 28 (23.0) | 40 (18.3) | ||
| 2 | 31 (6.9) | 25 (5.4) | 7 (5.7) | 15 (6.9) | ||
| ≥3 | 13 (2.9) | 6 (1.3) | 2 (1.6) | 2 (0.9) | ||
| ICU stays, n, mean (SD)§ | 0.0 (0.2) | 0.0 (0.2) | 0.0 (0.2) | 0.0 (0.1) | ||
| None | 430 (96.0) | 445 (96.3) | 0.21 | 118 (96.7) | 214 (97.7) | 0.58 |
| 1 | 15 (3.4) | 17 (3.7) | 4 (3.3) | 5 (2.3) | ||
| 2 | 3 (0.7) | 0 | 0 | 0 | ||
| ED visits, n, mean (SD)§ | 0.2 (0.5) | 0.2 (0.5) | 0.2 (0.5) | 0.2 (0.5) | ||
| None | 393 (87.7) | 398 (86.2) | 0.46 | 104 (85.3) | 187 (85.4) | 0.93 |
| 1 | 42 (9.4) | 53 (11.5) | 14 (11.5) | 27 (12.3) | ||
| 2 | 10 (2.2) | 6 (1.3) | 2 (1.6) | 2 (0.9) | ||
| ≥3 | 3 (0.7) | 5 (1.1) | 2 (1.6) | 3 (1.4) |
†
Patients could have more than one reason for discontinuation.
‡
Other reason for discontinuation includes patients who died during therapy.
§
As recorded from first-line pembrolizumab initiation to 12-months of follow-up or the last dose of pembrolizumab plus 30 days, whichever came first.
Data are n (%) unless otherwise noted. Percentages may not add up to 100 because of rounding.
1L: First-line; ED: Emergency department; ICU: Intensive care unit; n/a: Not assessed; SoC: standard of care.
Healthcare resource use
Overall, HCRU was similar between the historical and SoC cohorts, with 34 and 29% of patients, respectively, having at least one hospitalization during 12 months of follow-up (Table 4). Stays in the ICU and ED visits were relatively infrequent in both cohorts. No significant differences in HCRU were detected in analyses using Poisson regression with inverse probability propensity weighting and time offset to compare rates (data not shown). Additionally, there were no significant differences between Noona users and Noona nonusers in HCRU (Table 4).
Discussion
In this ambispective study, we found no evidence of a real-world impact of implementing an ePRO platform among patients with advanced NSCLC receiving first-line pembrolizumab therapy in the community oncology setting. There were no statistically significant differences in rwToT with first-line pembrolizumab or in other outcome measures between historical (pre-Noona implementation) versus SoC (post-Noona implementation) cohorts or, in the SoC cohort, between Noona users versus Noona nonusers.
Assessing the impact of Noona use on the outcomes evaluated in this observational study depended on patients both establishing a Noona profile and then using the platform. We observed that fewer than half of patients (43%) in the SoC cohort who had received pembrolizumab therapy for >42 days established a Noona profile before the end of first-line therapy, with Noona users comprising approximately a third of eligible patients in the SoC cohort overall (36%). This percentage is slightly better than that reported in another study conducted recently at TN ONC during which 31% were identified as ePRO users among 1014 patients with solid tumors (NSCLC, melanoma, renal cell carcinoma, bladder cancer, or head and neck cancer) who received ICI therapy (not limited to pembrolizumab) [34]. While the use of Noona functions was not an element of the ePRO user definition, the latter study employed a shorter timeline for establishing a Noona profile (≤45 days from ICI initiation) than the present study, which could in part explain the comparatively lower percentage. In multivariable regression analyses, the risk of treatment discontinuation was lower in the ePRO cohort as compared with the historical cohort in the prior study (HR, 0.83; 95% CI: 0.71–0.97) [34]. Similar to the findings in our study, however, there were no differences in duration of ICI therapy (nor in overall survival in that study) between Noona users and Noona nonusers [34].
The low percentages of ePRO use measured among patients in our study could be partly explained by the fact that patients with advanced NSCLC tend to be older (median age at diagnosis, 71 years), thus possibly less likely to engage with technology and may be sicker (often current or ex-smokers) with more comorbidities than patients with breast cancer (median age at diagnosis, 63 years), for example [16,35]. Moreover, dependable internet access facilitates regular ePRO use, while the catchment area of TN ONC includes people who live in rural settings with limited access to the internet, a factor potentially affecting ePRO use in this study.
Previous studies have identified barriers and facilitators for ePRO implementation in routine oncology practice, where time and resources tend to be more limited than in clinical trials [10,36–38]. In a recent study assessing the feasibility of implementing an ePRO platform at a large US community oncology practice, Cherny et al. successfully enrolled 79% of eligible patients (n = 923/1173) treated with parenteral anticancer therapies; and retention rates at 3, 6, 9 and 12 months were 94, 88, 73 and 67%, respectively [13]. In another recent, large community-based study of ePRO implementation and use, the Texas Two-Step Study, specific methods were employed, managed by implementation specialists who worked with organizational operational leaders, to encourage ePRO adoption [14]. Several barriers to ePRO implementation and use were identified in that study, such as lack of reminders and inconsistent discussion by clinicians at visits, while ease of use and patient and staff engagement were identified as facilitators [14]. These findings suggest that tailored implementation strategies may be necessary to integrate ePRO use into oncology practice settings.
The definition of ePRO “use” is not always defined in the literature, however, and there is currently no operational definition of good or optimal ePRO use [14,39], limiting the ability to make comparisons among studies. For Noona users in the present study, checking laboratory reports was the most commonly used function (52%), followed by the messaging feature (44%). About 38% of Noona users completed a symptom questionnaire during the first year after establishing a Noona profile. It remains unclear whether a certain level of use (adherence), type of use (e.g., checking laboratory results vs symptom reporting), or timing of use during the cancer journey would be more likely to have an impact on outcomes such as rwToT or HCRU. Moreover, the evidence for factors predicting good adherence to ePROs in real-world settings is limited [8,40]. However, as noted by Basch et al., consistent, ongoing symptom monitoring from early in the cancer treatment course, together with timely review and response by the care team, contribute to the benefits of ePROs for identifying worsening and severe symptoms so they can be addressed [41,42].
Strengths of this study include the large patient population and availability of complete clinical, treatment and Noona use information. Analyses compared both historical versus SoC cohorts and Noona users versus Noona nonusers, with propensity score adjustments to balance cohorts with respect to potential confounders; and multiple end points were examined. Limitations include high percentages of unreported internet availability and educational level. While we used Census-Block-Group median household income as a proxy for these factors, information regarding internet access and education could have provided a better understanding of the level of technology use in this patient population. Moreover, the primary study outcome measure, rwToT with first-line pembrolizumab, did not capture the impact of later (after first line) establishment of a Noona profile and Noona use. Our analyses also assumed that the use of each ePRO function would have the same impact on outcomes, whereas it is possible that the impact of using the diary feature, for example, could have had a greater impact than checking laboratory reports, the most commonly used Noona feature. Another limitation was the lack of a parallel (in calendar time) control arm. We note, moreover, that the comparison between historical and SoC cohorts could be affected by time confounding related to the changes in clinical practice and biomarker testing over time, considering the difference between the timeline of pembrolizumab initiation for the historical cohort (1 July 2017 to 30 June 2019) and for the SoC cohort (1 October 2019 to 30 September 2021).
Additionally, it is possible that comparisons of Noona users versus nonusers in the SoC cohort could be impacted by immortal time bias, which, if not properly acknowledged, increases the likelihood of finding significant group differences [43,44]. Standard approaches to mitigating this bias include time-varying covariates or landmark analyses. The Noona user versus nonuser analyses did not adjust for this potential bias because all comparisons between Noona users and nonusers were already statistically nonsignificant and thus any further adjustments to address this potential bias would not impact the results or conclusions and would introduce complexities to the study. The propensity score weighting used to minimize group level differences across a variety of characteristics relies on dichotomization of the variable of interest, and is thus incompatible with the use of time-varying covariates, an approach that allows for patients' movement between groups. Furthermore, landmark analysis is suboptimal because, unlike medication use which begins at a time determined by the care team and is used until it is discontinued, Noona use begins whenever the patient chooses to engage with the app for the first time.
The findings of this study do not negate the published research supporting the feasibility and benefits of ePRO use, including among patients treated with ICI therapy [5–7,13–15,36]. Therefore we strongly support its continued use. Clinical recommendations for promoting ePRO implementation and use have been published, and studies to identify barriers and facilitators for implementing ePRO tools in routine cancer care are ongoing [36,41,42]. More studies are needed to properly operationalize the definitions of ePRO use to establish a standard and enable direct comparisons between studies. Factors that should be included in the operationalization of use including initiation/start time, frequency of use and functionality types.
In conclusion, we identified no significant differences in rwToT or other outcomes associated with implementation of an ePRO platform or with use of the platform (between Noona users vs Noona nonusers). Overall, 43% of patients in the SoC cohort established a Noona profile, and 63% of those patients used the Noona platform at least once during the first year after establishing their profile. The low levels of ePRO use in this study suggest a need for future research and improved strategies to increase ePRO uptake and use among patients with advanced NSCLC. Notwithstanding the null findings of this study, the positive results of ePRO use in clinical trials and other observational studies regarding treatment-related symptom monitoring and survival support the need for promoting ePRO implementation and use.
Summary points
•
In clinical trials, the use of electronic patient-reported outcome (ePRO) tools for remote symptom monitoring of patients receiving cancer therapy has improved quality of life and overall survival, and studies of ePRO use in routine oncology care are needed.
•
The aim of this study was to assess the impact of Noona, an ePRO platform, on outcomes among patients with advanced non-small cell lung cancer (NSCLC) treated at a large network of community oncology clinics in the United States.
•
Patients eligible for this ambispective (retrospective and prospective) study were adults with advanced NSCLC, ECOG performance status of 0–2, and who initiated first-line pembrolizumab (monotherapy or in combination with chemotherapy) from 1 July 2017 to 30 June 2019 (historical cohort, n = 448) or from 1 October 2019 to 30 September 2021 (SoC cohort, n = 462).
•
Using deidentified electronic health record and Noona use data, we compared outcomes between a historical cohort (pre-Noona) and a standard of care (SoC) cohort (post-Noona implementation), and, among patients who had received pembrolizumab for >42 days, between Noona users and Noona nonusers in the SoC cohort, with Noona users defined as those who established a Noona profile and used the Noona platform at least once during first-line therapy.
•
There were no statistically significant differences between the historical and SoC cohorts in outcome measures, including the primary outcome measure, real-world time on treatment (rwToT) with pembrolizumab, real-world time to next treatment or death (rwTTNTD) and healthcare resource use.
•
A total of 341 patients who received first-line pembrolizumab for >42 days in the SoC cohort were eligible for the Noona user versus nonuser comparisons; among them, 147 patients (43%) established a Noona profile; and 122 (36%) were Noona users while 219 patients (64%) were Noona nonusers, including the 194 patients who did not establish a Noona profile and 25 patients who had a Noona profile but didn't use it during first-line therapy.
•
Outcomes, including median pembrolizumab rwToT, did not differ by Noona use.
•
During the first year of treatment, 92 of the 147 patients (63%) used any Noona function one or more times and monthly use ranged from 32% to 42%, with checking laboratory results being the function most commonly used during the first year (by 52% of the 147 patients), followed by use of the messaging feature (44%), completing a symptom questionnaire (38%), and using the diary function (22%).
•
Noona users comprised fewer than half of eligible patients in the SoC cohort (122/341; 36%), perhaps because of the requirement to establish a Noona profile and use the platform during first-line therapy or because patients with advanced NSCLC tend to be older, thus possibly less likely to engage with technology, and may be sicker (often current or ex-smokers) with more comorbidities than patients with breast cancer, for example.
•
Notwithstanding the null findings of this study, the positive results of ePRO use in clinical trials and other observational studies regarding symptom monitoring and survival support the need for promoting ePRO implementation and use.
Author contributions
LJ Blakely, S Oskar, I Kudel, T Perry and T Burke were responsible for study conception and design; LJ Blakely, A Roush and B Smith were responsible for acquisition of data; I Kudel and A Christianson were responsible for data analysis and all authors were responsible for drafting and revision of the manuscript.
Acknowledgments
The authors thank Y-H Kao (Merck & Co., Inc., NJ, USA) for analytical support.
Financial disclosure
This work was supported by Merck Sharp & Dohme LLC, a subsidiary of Merck & Co., Inc., NJ, USA. Employees of the funder participated in the study design; in the interpretation of data; in the writing of this report; and in the decision to submit the article for publication. The authors have received no other financial and/or material support for this research or the creation of this work apart from that disclosed.
Competing interests disclosure
L Johnetta Blakely, Ashley Roush and Brittni Smith are full-time employees of Tennessee Oncology. Sabine Oskar and Thomas Burke are full-time employees of Merck Sharp & Dohme LLC, a subsidiary of Merck & Co., Inc., NJ, USA and hold stock of Merck & Co., Inc., NJ, USA. Ian Kudel, Zoya Shamsi and Annette Christianson are full-time employees of Varian, which received funding from Merck Sharp & Dohme LLC, a subsidiary of Merck & Co., Inc., NJ, USA, to provide data and conduct the analyses for this study. Toni Perry was a full-time employee of Varian at the time of the study. The authors have no other competing interests or relevant affiliations with any organization/entity with a financial interest in or financial conflict with the subject matter or materials discussed in the manuscript apart from those disclosed.
Writing dislcosure
Medical writing and editorial assistance were provided by Elizabeth V Hillyer, DVM (freelance). This assistance was funded by Merck Sharp & Dohme LLC, a subsidiary of Merck & Co., Inc., NJ, USA.
Ethical conduct of research
Study approval was provided by WCG IRB, which determined the study to be exempt from patient consent requirements, given the use of anonymized secondary data.
Data sharing statement
The health data used to support the findings of this study are restricted by Tennessee Oncology in order to protect patient privacy. For this reason, data used to support the findings of this study have not been made available.
Open access
This work is licensed under the Attribution-NonCommercial-NoDerivatives 4.0 Unported License. To view a copy of this license, visit https://creativecommons.org/licenses/by-nc-nd/4.0/
References
Papers of special note have been highlighted as: • of interest
1.
Di Maio M, Basch E, Denis F et al. The role of patient-reported outcome measures in the continuum of cancer clinical care: ESMO Clinical Practice Guideline. Ann. Oncol. 33(9), 878–892 (2022).
• Clinical practice guidelines summarizing the place in cancer care of patient-reported outcomes (PROs) and electronic patient-reported outcomes (ePROs), with recommendations for their implementation and use.
2.
Lustberg MB, Kuderer NM, Desai A, Bergerot C, Lyman GH. Mitigating long-term and delayed adverse events associated with cancer treatment: implications for survivorship. Nat. Rev. Clin. Oncol. 20(8), 527–542 (2023).
3.
Brahmer JR, Abu-Sbeih H, Ascierto PA et al. Society for Immunotherapy of Cancer (SITC) clinical practice guideline on immune checkpoint inhibitor-related adverse events. J. Immunother. Cancer 9(6), e002435 (2021).
4.
Arriola E, Jaal J, Edvardsen A et al. Feasibility and user experience of digital patient monitoring for real-world patients with lung or breast cancer. Oncologist 29(4), e561–e569 (2024).
5.
Basch E, Deal AM, Dueck AC et al. Overall survival results of a trial assessing patient-reported outcomes for symptom monitoring during routine cancer treatment. JAMA 318(2), 197–198 (2017).
• Research letter reporting survival outcomes with ePRO use after a median 7-year follow-up of a randomized clinical trial comparing ePRO use with usual care.
6.
Denis F, Basch E, Septans AL et al. Two-year survival comparing web-based symptom monitoring vs routine surveillance following treatment for lung cancer. JAMA 321(3), 306–307 (2019).
7.
Basch E, Schrag D, Henson S et al. Effect of electronic symptom monitoring on patient-reported outcomes among patients with metastatic cancer: a randomized clinical trial. JAMA 327(24), 2413–2422 (2022).
8.
Armbruster C, Knaub M, Farin-Glattacker E, von der Warth R. Predictors of adherence to cancer-related mHealth apps in cancer patients undergoing oncological or follow-up treatment-a scoping review. Int. J. Environ. Res. Public Health 19(20), 13689 (2022).
9.
Basch E, Charlot M, Dueck AC. Population-level evidence of survival benefits of patient-reported outcome symptom monitoring software systems in routine cancer care. Cancer Med. 9(21), 7797–7799 (2020).
10.
van den Hurk CJG, Mols F, Eicher M et al. A narrative review on the collection and use of electronic patient-reported outcomes in cancer survivorship care with emphasis on symptom monitoring. Curr. Oncol. 29(6), 4370–4385 (2022).
• Narrative review describing collection and use of ePROs for patients under care for cancer.
11.
Howell D, Rosberger Z, Mayer C et al. Personalized symptom management: a quality improvement collaborative for implementation of patient reported outcomes (PROs) in ‘real-world’ oncology multisite practices. J. Patient Rep. Outcomes 4(1), 47 (2020).
12.
Girgis A, Durcinoska I, Arnold A et al. Web-based patient-reported outcome measures for personalized treatment and care (PROMPT-Care): multicenter pragmatic nonrandomized trial. J. Med. Internet Res. 22(10), e19685 (2020).
13.
Cherny NI, Parrinello CM, Kwiatkowsky L et al. Feasibility of large-scale implementation of an electronic patient-reported outcome remote monitoring system for patients on active treatment at a community cancer center. JCO Oncol. Pract. 18(12), e1918–e1926 (2022).
• Real-world study of implementing symptom monitoring with ePROs at a community oncology center.
14.
Patt D, Wilfong L, Hudson KE et al. Implementation of electronic patient-reported outcomes for symptom monitoring in a large multisite community oncology practice: dancing the Texas two-step through a pandemic. JCO Clin. Cancer Inform. 5, 615–621 (2021).
• Detailed description of implementing ePROs at a multisite community oncology practice.
15.
Patt DA, Patel AM, Bhardwaj A et al. Impact of remote symptom monitoring with electronic patient-reported outcomes on hospitalization, survival, and cost in community oncology practice: the Texas Two-Step Study. JCO Clin. Cancer Inform. 7, e2300182 (2023).
16.
National Cancer Institute: Surveillance Epidemiology and End Results (SEER) Program. Cancer Stat Facts: lung and bronchus cancer. https://seer.cancer.gov/statfacts/html/lungb.html (Accessed: 2 July 2024).
17.
Schneider BJ, Naidoo J, Santomasso BD et al. Management of immune-related adverse events in patients treated with immune checkpoint inhibitor therapy: ASCO Guideline update. J. Clin. Oncol. 39(36), 4073–4126 (2021).
18.
Thompson JA, Schneider BJ, Brahmer J et al. Management of immunotherapy-related toxicities, version 1.2022, NCCN Clinical Practice Guidelines in Oncology. J. Natl Compr. Canc. Netw. 20(4), 387–405 (2022).
19.
PR Newswire. Varian to provide mobile technology to cancer patients across Tennessee. https://www.prnewswire.com/news-releases/varian-to-provide-mobile-technology-to-cancer-patients-across-tennessee-300875088.html (Accessed: 2 July 2024).
20.
Tennessee Oncology. https://tnoncology.com/about-us/ (Accessed: 2 July 2024).
21.
Varian. Noona. https://www.varian.com/products/software/care-management/noona (Accessed: 2 July 2024).
22.
Takala L, Kuusinen TE, Skytta T, Kellokumpu-Lehtinen PL, Barlund M. Electronic patient-reported outcomes during breast cancer adjuvant radiotherapy. Clin. Breast Cancer 21(3), e252–e270 (2021).
23.
Khozin S, Miksad RA, Adami J et al. Real-world progression, treatment, and survival outcomes during rapid adoption of immunotherapy for advanced non-small cell lung cancer. Cancer 125(22), 4019–4032 (2019).
24.
Kehl KL, Riely GJ, Lepisto EM et al. Correlation between surrogate end points and overall survival in a multi-institutional clinicogenomic cohort of patients with non-small cell lung or colorectal cancer. JAMA Netw. Open 4(7), e2117547 (2021).
25.
Stewart M, Norden AD, Dreyer N et al. An exploratory analysis of real-world end points for assessing outcomes among immunotherapy-treated patients with advanced non-small-cell lung cancer. JCO Clin. Cancer Inform. 3, 1–15 (2019).
26.
WCG IRB. https://www.wcgclinical.com/solutions/irb-review/ (Accessed: 2 July 2024).
27.
Velcheti V, Chandwani S, Chen X, Pietanza MC, Burke T. First-line pembrolizumab monotherapy for metastatic PD-L1-positive NSCLC: real-world analysis of time on treatment. Immunotherapy 11(10), 889–901 (2019).
28.
McKelvey BA, Berk A, Chin L et al. A study design to harmonize patient-reported outcomes across data sets. JCO Clin. Cancer Inform. 7, e2200161 (2023).
29.
United States Census Bureau. 2021 American Community Survey 5-year median household income in the past 12 months (in 2021 inflation-adjusted dollars) [Excel data file]. https://data.census.gov/table?q=2021%C2%A0American%20Community%20Survey%205-year%20median%20household%20income%20in%20the%20past%2012%20Months (Accessed: 2 July 2024).
30.
Rivera DR, Henk HJ, Garrett-Mayer E et al. The Friends of Cancer Research Real-World Data Collaboration Pilot 2.0: methodological recommendations from oncology case studies. Clin. Pharmacol. Ther. 111(1), 283–292 (2022).
31.
Flatiron Health. Flatiron Health database. https://flatiron.com/real-world-evidence/ (Accessed: 2 July 2024).
32.
Toolkit for Weighting and Analysis of Nonequivalent Groups (TWANG). https://www.rand.org/statistics/twang/downloads.html (Accessed: 2 July 2024).
33.
R – survey: Analysis of Complex Survey Samples. https://cran.r-project.org/web/packages/survey/index.html (Accessed: 2 July 2024).
34.
Dickson NR, Beauchamp KD, Perry TS et al. Real-world use and clinical impact of an electronic patient-reported outcome tool in patients with solid tumors treated with immuno-oncology therapy. J. Patient Rep. Outcomes 8(1), 23 (2024).
35.
National Cancer Institute. Cancer Stat Facts: female breast cancer. https://seer.cancer.gov/statfacts/html/breast.html (Accessed: 2 July 2024).
36.
Lai-Kwon J, Rutherford C, Jefford M, Gore C, Best S. Using implementation science frameworks to guide the use of electronic patient-reported outcome symptom monitoring in routine cancer care. JCO Oncol. Pract. 20(3), 335–349 (2024).
37.
Eng L, Chan RJ, Chan A et al. Perceived barriers toward patient-reported outcome implementation in cancer care: an international scoping survey. JCO Oncol. Pract. 20(6), 816–826 (2024).
38.
Crockett C, Price J, Pham M et al. Experience with the routine use of electronic patient-reported outcome measures for patients with lung cancer. JCO Clin. Cancer Inform. 7, e2200150 (2023).
39.
Weichenthal M, Mohr P, Livingstone E et al. Combi-EU: BRAF-/MEK-Inhibition with dabrafenib and trametinib in melanoma patients in the adjuvant setting: interim analysis of an observational study on a treatment supporting electronic health app (Abstract 117). Presented at: 18th European Association of Dermato-Oncology (EADO) Congress. Seville, Spain, 21–23 April 2022.
40.
Hasnan S, Aggarwal S, Mohammadi L, Koczwara B. Barriers and enablers of uptake and adherence to digital health interventions in older patients with cancer: a systematic review. J. Geriatr. Oncol. 13(8), 1084–1091 (2022).
41.
Basch E, Hudson K, Rocque G. Implementation of electronic patient-reported outcomes for symptom monitoring during cancer treatment: the importance of getting it right. J. Comp. Eff. Res. 12(12), e230157 (2023).
42.
Basch E, Rocque G, Mody G, Mullangi S, Patt D. Tenets for implementing electronic patient-reported outcomes for remote symptom monitoring during cancer treatment. JCO Clin. Cancer Inform. 7, e2200187 (2023).
• Detailed, current guidance for implementing ePROs in oncology practice.
43.
Shintani AK, Girard TD, Eden SK, Arbogast PG, Moons KG, Ely EW. Immortal time bias in critical care research: application of time-varying Cox regression for observational cohort studies. Crit. Care Med. 37(11), 2939–2945 (2009).
44.
Levesque LE, Hanley JA, Kezouh A, Suissa S. Problem of immortal time bias in cohort studies: example using statins for preventing progression of diabetes. BMJ 340, b5087 (2010).
Information & Authors
Information
Published In
Copyright
© 2025 Merck & Co., Inc., Rahway, NJ, USA and its affiliates. This work is licensed under the Attribution-NonCommercial-NoDerivatives 4.0 Unported License
History
Received: 24 July 2024
Accepted: 13 December 2024
Published online: 17 January 2025
Keywords:
Topics
Authors
Metrics & Citations
Metrics
Article Usage
Article usage data only available from February 2023. Historical article usage data, showing the number of article downloads, is available upon request.
Citations
How to Cite
Real-world ePRO use and clinical outcomes using electronic patient-reported symptom monitoring for patients with advanced non-small-cell lung cancer receiving first-line pembrolizumab. (2025) Journal of Comparative Effectiveness Research. DOI: 10.57264/cer-2024-0122
Export citation
Select the citation format you wish to export for this article or chapter.
Citing Literature
- K. Liao, Q. Liu, Y. Wang, K.H. Law, N. Takemura, D.H.Z. Lui, Y.-K. Lo, C. Faivre-Finn, T. Nuamek, J. Price, K.Y. Ho, J. Yorke, Real-world implementation of electronic patient-reported outcome measures (ePROMs) in routine oncology practice: a scoping review, ESMO Real World Data and Digital Oncology, 10.1016/j.esmorw.2026.100717, 13, (100717), (2026).