A systematic review of discounting in national health economic evaluation guidelines: healthcare value implications
Publication: Journal of Comparative Effectiveness Research
Abstract
Aim: This review summarizes the discounting approaches recommended in current economic evaluation (EE) guidelines for healthcare programs and interventions. Materials & methods: A systematic review of EE guidelines for healthcare, published up to July 2022, was conducted. Results: A total of 52 EE guidelines were reviewed. The majority of these guidelines recommend equal discounting (80.8%) rather than differential discounting (9.6%). The rationale for equal discounting includes recommendations by the government, consistency with other countries, and economic development. However, the rationale for differential discounting is based on the interest in short-term government bonds and anticipated budget changes. Discussion: This review demonstrates variation in both discounting approaches and rates across EE guidelines and underscores the need for a global consensus on discounting approaches.
Plain language summary
This article discusses the discounting approaches recommended in published economic evaluations for healthcare decision making by various institutions worldwide. As discounting rates may differ based on the context, such as cost incurred or benefit received over time, it is important to understand the factors contributing to these differences. This systematic review details the different discounting rates by country and whether discounting is done equally or differently for cost and benefits, in which the synthesized evidence on discounting is currently lacking. Additionally, the rationale for choosing similar or varying rates was reviewed and summarized. This review identified a significant discrepancy and variation in discounting rates and rationale in economic evaluations by country. Variation in the discount rates was observed and may be due to the individual country’s healthcare system, financing mechanisms and needs. Including discounting approaches in national guidelines can be used by policymakers to understand the impact each approach has on decision making in healthcare interventions.
Globally, there is a growing demand for health economic evaluations (EE) given the technological progress, medical innovation, changing demographics and epidemiological transition [1–3]. The financial cost of therapies is high, which may translate to high upfront therapy costs and subsequent high consumption in national health budgets [4,5]. This necessitates the growing need for therapies to demonstrate value for money. For example, medical therapy such as ABECMA (idecabtagene vicleucel), a recently approved gene therapy by the US FDA for multiple myeloma, could cost nearly $0.5 million (USD) per fusion [4]. In instances such as these, decision makers must determine whether the expected additional health benefits of a new therapy justify the increased costs compared with the standard of care [3].
Economic evaluations provide a framework for understanding the clinical benefits and resource implications of health interventions, aid in resource optimization and decision making, and demonstrate whether there is value for money [3]. The integration and adoption of new technologies into clinical practice requires a demonstration of clinical and economic value. In doing so, the decision whether to fund new interventions is guided by EE, including the application for reimbursement and the transferability of results to guide decision making [6]. As such, these guidelines outline a framework for planning, conducting, and reporting economic evaluation for reimbursement applications, designing studies, and EE reports [7].
One common practice in EE is discounting to provide a logical basis for transforming future healthcare costs and benefits to ‘present value’. Future costs and benefits are discounted due to pure time preference, economic growth and the catastrophic risk of the intervention [8,9]. While the rationale for discounting potential costs and benefits is justified, there is disagreement regarding whether they should be discounted at the same rate (equal discounting) [10–12], mainly because of the concept of time preference. This is critical because future benefits are not valued at the current time. Costs are upfront and occur now, while benefits occur later, which undervalues the intervention and impacts decision making [13,14]. Additionally, discount rates in the economy vary, reflecting the individual preferences on the current and future consumption of goods/services and the productive potential of capital investment to yield ‘real money’ [15]. Unlike costs, discounting benefits is controversial mainly due to the fact that health cannot generate a real rate of return (USD adjusted for the rate of inflation) when invested to produce future gains [15,16]. This is important if future benefits are discounted, given benefits of interventions are imminent and costs occur in the present.
The development of EE guidelines has been an evolutionary step for health technology assessments (HTA) for reimbursement and understanding the comparative value of healthcare. Many countries have developed methodological guidelines or country-specific requirements to facilitate healthy EE. Though similarities exist in the theoretical constructs behind the development of EE guidelines, the content of these guidelines differ. EE guidelines have been previously evaluated [17–19] in systematic reviews, but those reviews did not focus on the theoretical concepts of the discounting approaches used. Furthermore, the historical trajectory of discount rates has evolved over time and some degree of variability exists in the discounting approaches recommended. Given discounting approaches in EE have been subject to debate, it is important to review the choice and rationale for each, as it impacts the comparability and transferability of EE results across settings. This paper identifies and summarizes the discounting approaches used in current EE guidelines for healthcare.
Materials & methods
Registration & protocol
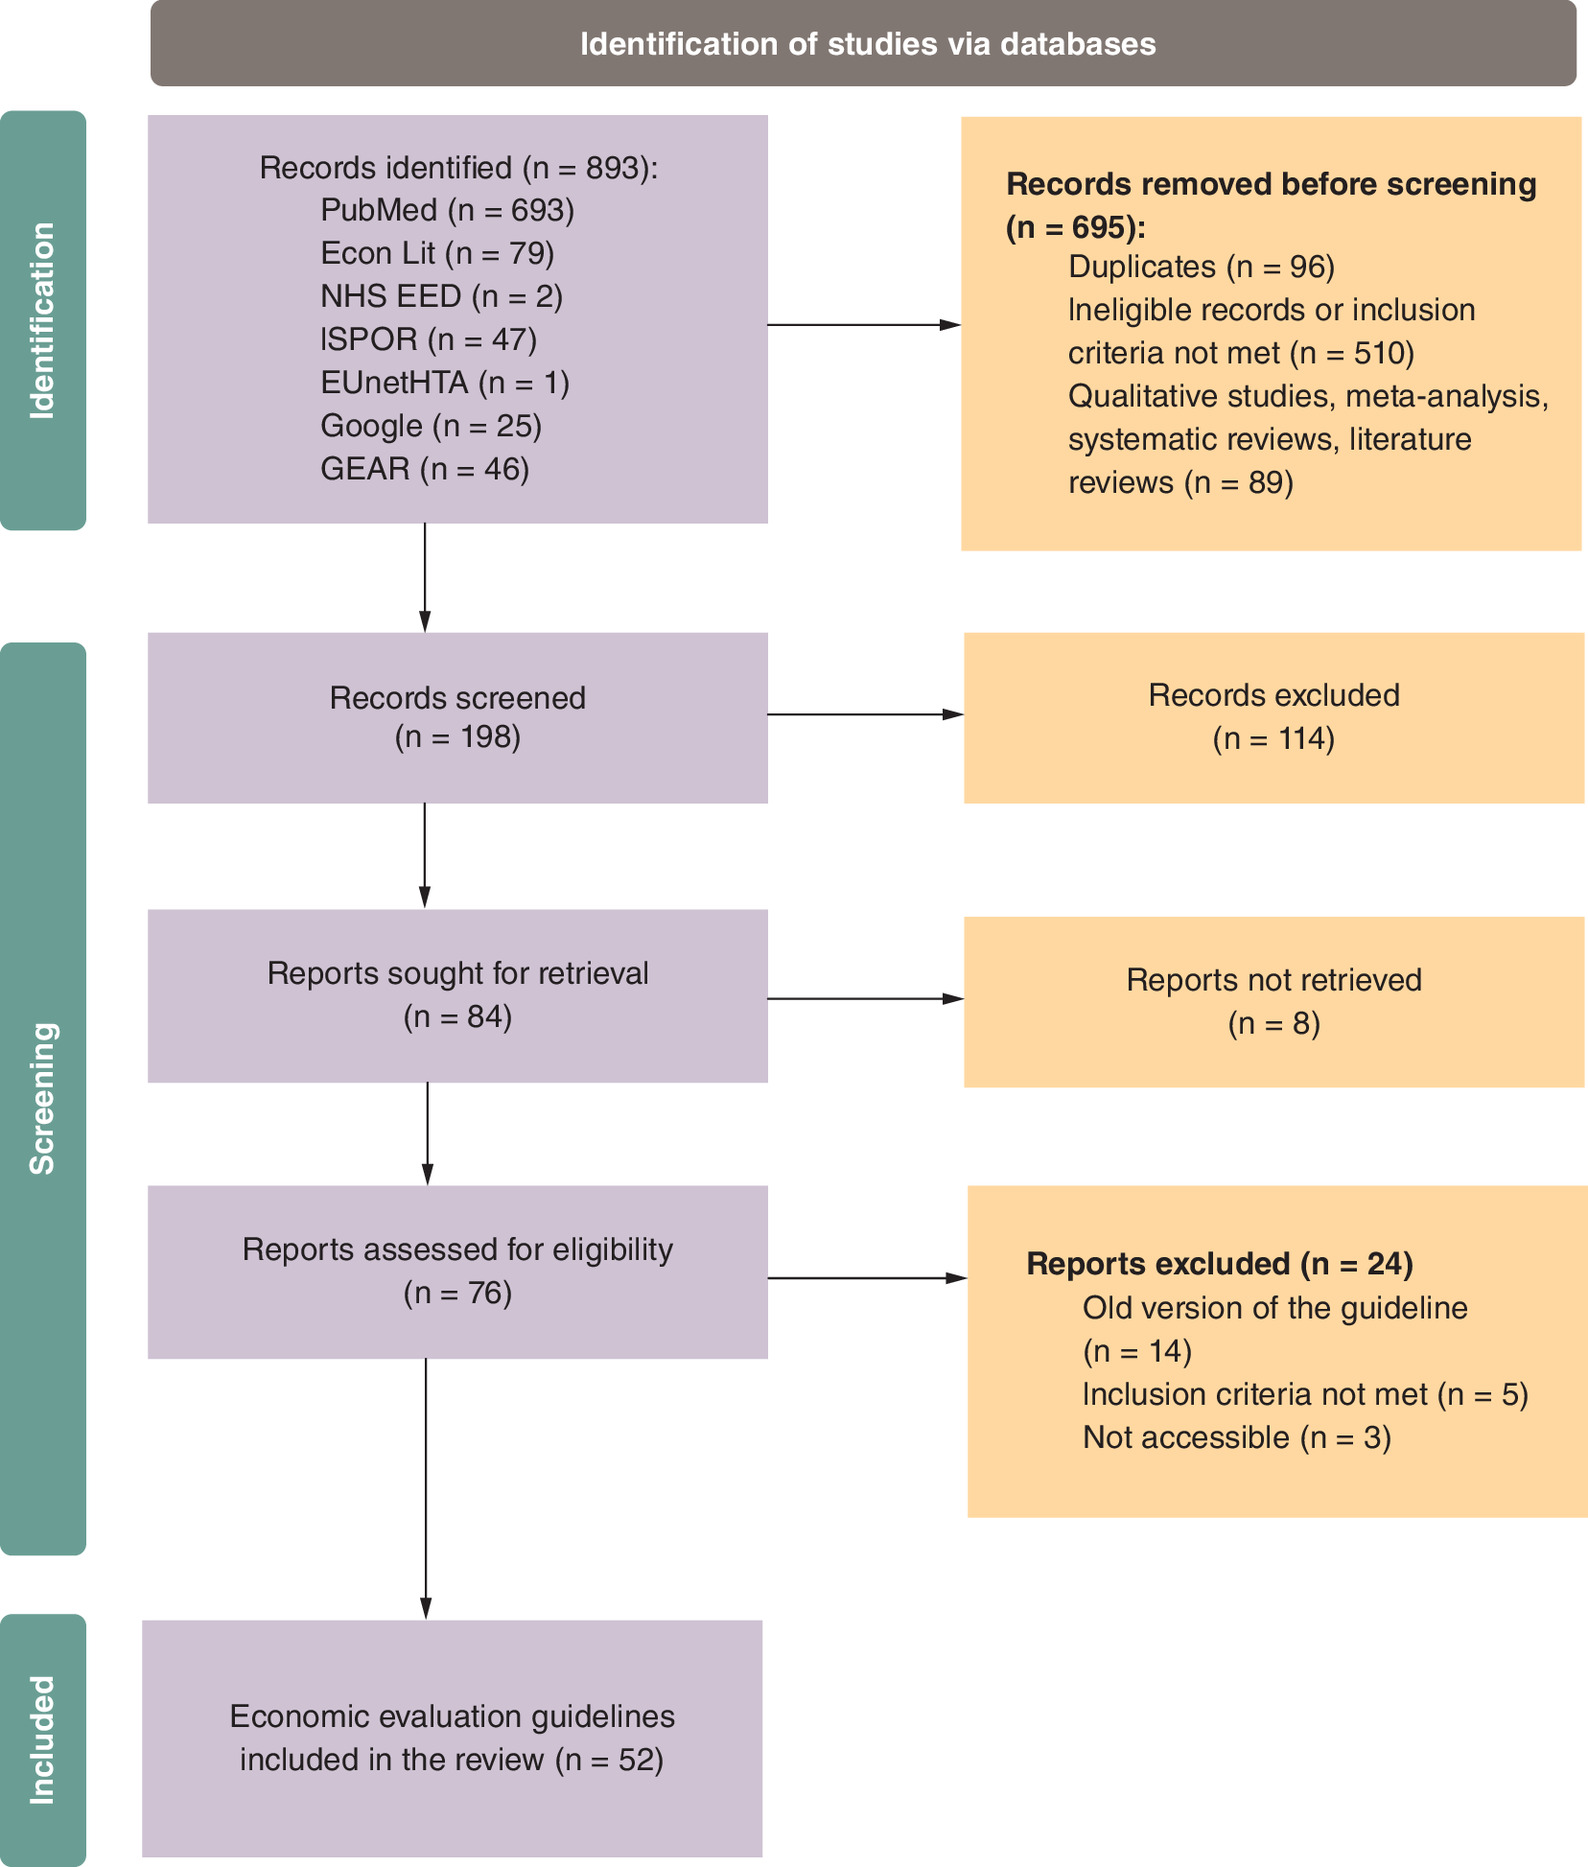
A systematic review of all discounting approaches recommended in current EE guidelines for healthcare programs and interventions was conducted following the Preferred Reporting Items for Systematic Reviews and Meta-Analysis (PRISMA) guidelines [20,21]. The review protocol was not registered on PROSPERO.
Eligibility criteria
EE guidelines were eligible for inclusion if they focused on healthcare and were published as articles or reports from official sources of government agencies (such as the Ministry of Health), HTA organizations, institutes, or working groups. Eligible publications and reports were classified as HTA guidelines, HTA recommendations, pharmacoeconomic (PE) submissions, PE recommendations or submission guidelines. Published articles were included if they were endorsed by HTA organizations or government agencies. The outcomes of interest were the recommended discount rates for costs and benefits (reference case and sensitivity analysis), as well as the rationale for the choice of the discount rate.
No restrictions were placed on the year or the language of the guidelines. Non-English language guidelines were translated to English using Google Translate. If multiple versions of a particular document were available, the most recently published document was used for data extraction.
Searches
A search was conducted for healthcare EE from the following databases: EconLit, National Health Service Economic Evaluation Database (NHS EED), European Network for Health Technology Assessment (EUnetHTA), PubMed®, Google™, Guide to Economic Analysis and Research (GEAR) and the International Society for Pharmacoeconomic and Outcomes Research (ISPOR).
The following keywords were used: topic = ‘country name’ and topic = ‘guidelines’ or ‘recommendations’ or ‘submissions’ or ‘standards’ and topic = ‘economic evaluation’ or ‘economic’ or ‘health technology assessment (HTA)’ or ‘healthcare’ or ‘pharmacoeconomic’. Hand searching was performed to identify eligible healthcare EE guidelines. An outline of the flow of the included guidance documents is shown in Figure 1.
Screening & data extraction
The search results were downloaded and imported into EndNote™ (Clarivate, London, UK) for deduplication. Searches with citations not compatible with EndNote format were saved in Microsoft Excel (Microsoft Corporation, WA, USA) and then manually deduplicated. Two reviewers Abimbola O Williams (AOW) and Alysha M McGovern (AMM) independently screened each record and extracted data. The date of the last search was July 2022. Discrepancies after the review were resolved through a discussion and consensus among the authors.
Guidelines were categorized by discounting approaches (equal and differential) and discounting rationale. Equal discounting was defined as identical discount rates for both costs and benefits, while differential discounting was defined as different discount rates for costs and benefits. For the guidelines that did not report discounting rates for either costs or benefits, the discount rates were not reported. The discounting rationales were extracted and reported, if available, and the information was synthesized by country and discount concepts.
Study risk of bias assessment
An attempt was made to assess the risk of bias in the EE guidelines. However, no formal quality appraisal was performed due to the lack of a standard tool for such an assessment. Given this systematic review included national guidelines focusing on discount rates, no guidelines fell into the categories of existing tools that could be assessed for bias. Further, most of the guidelines included in this study (Table 1) were developed by federal institutions of different countries and may present unbiased research reflecting their economy and health policy.
| Income Group | Country | Guideline name | Authoring institution | Document type | Target audience | Year of publication | Costs | Health benefits/effects | Sensitivity analysis (SA) | Discounting approach | Discounting rationale | Ref. |
|---|---|---|---|---|---|---|---|---|---|---|---|---|
| High-income countries | Austria | Methodenhandbuch für Health Technology Assessment Version 1 | Bundeinstitut für Qualität im Gesundheitswesen & Gesundheit Österreich | HTA guidelines | Decision makers | 2012 | 3.0% | 3.0% | 0, 5 and 10% | Equal | [22] | |
| High-income countries | Australia | Guidelines for preparing a submission to the Pharmaceutical Benefits Advisory Committee, Version 5.0 | Australian Government Department of Health | PE guidelines | Pharmaceutical industry | 2016 | 5.0% | 5.0% | 3.5 and 0% | Equal | [23] | |
| High-income countries | Baltic (Latvia, Lithuania and Estonia) | Baltic Guideline for Economic Evaluation of Pharmaceuticals (Pharmacoeconomic Analysis) | Healthcare experts | PE guidelines | Pharmaceutical industry | 2002 | 5.0% | 5.0% | No values stated | Equal | [24] | |
| Upper-middle income | Brazil | Diretrizes metodológicas Diretriz de Avaliação Econômica, 2a edição | Brazil Ministry of Health | PE guidelines | Not specified | 2014 | 5.0% | 5.0% | 0–10% | Equal | [25] | |
| High-income countries | Belgium | Belgian Guidelines for Economic Evaluations and Budget Impact Analyses: Second Edition | Belgian HealthCare Knowledge Center (KCE) | HTA guidelines | Pharmaceutical and medical devices industry, decision makers, researchers | 2012 | 3.0% | 1.5% | 0 or 5% for costs and outcomes | Differential | Based on the return on consistency in previously published guidelines, consistency in the discount rate above a fluctuating rate (e.g. interest om the short-term government bonds and the anticipated budget changes. | [26] |
| Lower-middle income countries | Bhutan | Health Technology Assessment Process Guideline, 2nd edition 2018 | Essential Medicines and Technology Division (EMTD), Department of Medical Services, Ministry of Health | HTA guidelines | Researchers, decisionmakers and healthcare professionals | 2018 | No values stated | No values stated | No values stated | [27] | ||
| Upper-middle income | China | China Guidelines for Pharmacoeconomic Evaluations, 2020 Edition | Peking University, Fudan University, Tianjin University, China Pharmaceutical University, Ministry of Human Resources and Social Security (MHRSS), PLA 306 Hospital and many others | PE recommendations | Payers (public and private), clinicians, healthcare industries and researchers | 2020 | 5.0% | 5.0% | 0–8% | Equal | [24] | |
| High-income countries | Canada | Guidelines for the Economic Evaluation of Health Technologies: Canada — 4th Edition | Canadian Agency for Drugs and Technologies in Health | HTA guidelines | Pharmaceutical and medical devices industry | 2017 | 1.5% | 1.5% | 0%, 3%. | Equal | Based on recent empirical evidence of Canadian provinces' long-term borrowing costs | [28] |
| Upper-middle income | Colombia | Manual Para la Elaboración de Evaluaciones Económicas en Salud (Manual for the Preparation of Economic Evaluations in Health) | Instituto de Evaluación Tecnológica en Salud (IETS) | PE guidelines | Decision makers, researchers, universities, pharmaceutical industry | 2014 | 5.0% | 5.0% | 0, 3.5, 7 and 12% | Equal | [29] | |
| Upper-middle income | Cuba | Methodological Guidelines for Health Economic Evaluation in Cuba | Cuba Ministry of Health | PE guidelines | Decision makers | 2003 | Yes, use rates recommended by specific government agencies. | Yes, use rates recommended by specific government agencies. | 0, 3 and 5% | Equal | Based on the Ministry of Finance and Prices and the Ministry of Economy and Planning recommendations | [24] |
| High-income countries | Croatia | The Croatian Guideline for Health Technology Assessment Process and Reporting, 1st edition | Agency for Quality and Accreditation in HealthCare, Croatia | HTA guidelines | Policymakers at the national level and, on hospital level, hospital directors and policy teams. | 2011 | 5.0% | 5.0% | Between 3 and 10% | Equal | Based on the average quarterly base rate within the respective year over the last 3 years | [30] |
| High-income countries | Czech Republic | Czech Best Practices Pharmacoeconomic Society (CFES) for Health-Economic Evaluations in the Czech Republic | Czech Pharmacoeconomic Society | Submission guidelines | Drug control decision maker and health insurance companies | 2016 | 3.0% | 3.0% | 0 and 5% | Equal | [31] | |
| High-income countries | Denmark | Health Technology Assessment Handbook | Danish Institute for Health Technology Assessment | HTA guidelines | Researchers conducting analysis of pharmaceuticals | 2001 | No values stated | No values stated | No values stated | Recommends discounting when there is an effect and cost consequences over several years | [32] | |
| Lower-middle income countries | Egypt | Recommendations for reporting pharmacoeconomic evaluations in Egypt | Central Administration for Pharmaceutical Affairs (CAPA) | PE guidelines | Payers (public and private), clinicians and healthcare industries | 2013 | 3.5% | 3.5% | Between 2 and 6% | Equal | Consistency (because in economic evaluation, constant prices and outcomes are used and there is no need accounting for inflation in the discount rate) | [33] |
| High-income countries | France | Choices in Methods for Economic Evaluation | Haute Autorité de Santé (French National Authority for Health) | HTA guidelines | Decision makers and healthcare professionals | 2012 | 4.0% | 4.0% | If time horizon is >30 years, then discount costs and benefits at 2%. 3–6% in the sensitivity analysis | Equal | Based on the relative prices of the health effects and the discount rate | [34] |
| High-income countries | Finland | Preparing a Health Economic Evaluation to Be Attached to the Application for Reimbursement Status and Wholesale Price for a Medicinal Product | Pharmaceuticals Pricing Board | PE guidelines | Pharmaceutical industry and researchers | 2019 | 3.0% | 3.0% | Not specified. Guideline recommends providing a rationale for SA and the chosen variables | Equal | [35] | |
| High-income countries | Germany | General Methods for the Assessment of the Relation of Benefits to Costs, Version 1.0 | Institute for Quality and Efficiency in HealthCare (IQWiG) | PE guidelines | Healthcare | 2009 | 3.0% | 3.0% | 0, 5, 7 and 10% | Equal | Consistency with the government international long-term equity market | [24] |
| High-income countries | Hungary | The Technical Guideline on Conducting and Assessment of Health-Economic Analyses by the Ministry of Human Resources | ISPOR Hungary Chapter, Hungarian Health Economics Association, National Institute of Pharmacy and Nutrition - Department of Health Technology Assessment and Experts (public and private sectors and academia) | PE guidelines | Pharmaceutical and medical devices industry, health providers, decision makers and policymakers | 2021 | 3.7% | 3.7% | Sensitivity analyses should be conducted on all uncertain parameters. The range applied in the case of each parameter should be described properly. Ranges should be selected to be meaningful from a real-life perspective. | Equal | Based on calculations on the domestic empirical data and the need to discount costs and health benefits to the same extent | [24] |
| Lower-middle income countries | Iran | Criteria for developing an economic evaluation file - 2017–2019 | Iran Food and Drug Administration (FDA) | Submission guidelines | Not specified | 2017 | Recommended but not specified | Recommended but not specified | [24] | |||
| Lower-middle income countries | India | Health Technology Assessment in India: A Manual | Department of Health Research, Ministry of Health & Family Welfare, Government of India | HTA guidelines | HTA researchers and policy makers | 2018 | 3.0% | 3.0% | Between 0 and 5% | Equal | 3% is the most commonly used value in published economic evaluations undertaken in India and other jurisdictions. A common discount rate will ensure comparability and standardization across evaluations | [36] |
| High-income countries | Italy | Linee Guide Per La Compilazione Del Dossier A Supporto Della Della Domanda Di Rimborsabilità E Prezzo Di Un Medicinale, Versione 1.0 | Agenzia Italiana Del Farmaco (Italian Drug Agency) | PE recommendations | Pharmaceutical industry | 2020 | 3.0% | 3.0% | Between 0 and 5% | Equal | Discount rate is appropriate for comparison | [37] |
| High-income countries | Israel | Guidelines for the Submission of a Request to Include a Pharmaceutical Product in the National List of Health Services - Appendix D: Instructions for Performing an Economic Assessment | Pharmaceutical Administration of the Ministry of Health Israel | Submission guidelines | Pharmaceutical industry | 2010 | 3.0% | 3.0% | Equal | [24] | ||
| High-income countries | Ireland | Guidelines for the Economic Evaluation of Health Technologies in Ireland | Health Information and Quality Authority | HTA guidelines | Health technology industry | 2020 | 4.0% | 4.0% | Limits of 0 and 10% are suggested | Equal | Discount rate are set by the Department of Finance and has been effective July 2019. Differential discounting may be allowed in some jurisdictions | [38] |
| Lower-middle income countries | Indonesia | Health technology assessment (HTA) guideline | Indonesian Health Technology Assessment Committee (InaHTAC), Ministry of Health, Republic of Indonesia | HTA guidelines | Researchers, decisionmakers and healthcare professionals | 2017 | 3.0% | 3.0% | A range is required (0–6%) | Equal | [39] | |
| High-income countries | Japan | Guideline for preparing cost–effectiveness evaluation to the Central Social Insurance Medical Council, Version 3.0 | Core to Evidence-Based Health Policy (C2H NIPH) | PE guidelines | Pharmaceutical and medical devices | 2022 | 2.0% | 2.0% | 0–4% | Equal | [40] | |
| High-income countries | South Korea | Guidelines on economic evaluation for pharmaceuticals | Ministry of Health and Human Services | PE guidelines | Healthcare decision makers | 2021 | 4.5% | 4.5% | If the time horizon is longer than 30 years and if deemed necessary, such as in the case of treatment for children, a 3.5% discount rate can be applied to costs and benefits accrued after 30 years in a sensitivity analysis | Equal | Discount rate reflects the rate used in the preliminary feasibility study on public investment in South Korea (4.5%) | [41] |
| Upper-middle income | Malaysia | Pharmacoeconomic Guidelines for Malaysia | Ministry of Health, Malaysia | PE guidelines | Researchers, decisionmakers and healthcare professionals | 2019 | 3.0% | 3.0% | Higher and lower discount rates (for example 0 and 5%) | Equal | [42] | |
| Upper-middle income | Mexico | Guía para la conducción de estudios de evaluación económica para la actualización del Cuadro Básico y Catálogo de Insumos del Sector Salud en México, Edición Diciembre | General Health Council | PE guidelines | Decision makers, Pharmaceutical, researchers and public health sector | 2017 | 5.0% | 5.0% | 3–7% for costs and 0–7% for effects | Equal | [43] | |
| Upper-middle income | MERCOSUR (Argentina, Brazil, Paraguay, Uruguay) | Guía metodológica para estudios de evaluación | MERCOSUR | PE guidelines | Researchers and decision makers | 2013 | Recommended but not specified | Recommended but not specified | Recommended but not specified | [44] | ||
| High-income countries | Norway | Guidelines on how to Conduct Pharmacoeconomic Analyses | Norwegian Medicines Agency (NOMA) | PE guidelines | Pharmaceutical industry | 2012 | 4.0% | 4.0% | Equal | Because the health sector was assumed to have a moderate systematic risk and was recommended by the Government (Ministry of Finance) | [24] | |
| High-income countries | New Zealand | Prescription for Pharmacoeconomic Analysis. Methods for Cost-Utility Analysis (Version 2.2) | Pharmaceutical Management Agency (PHARMAC) | PE guidelines | Pharmaceutical industry, PHARMAC staff | 2015 | 3.5% | 3.5% | 0 and 5% | Equal | Based on the social rate since it accounts for society's preferences | [45] |
| Lower-middle income countries | Philippines | Philippine HTA Methods Guide: Methodological Standards in Evaluation of Health Technologies in the Philippines | Republic of the Philippines, Health Technology Assessment Unit, Department of Health | HTA guidelines | HTA researchers | 2020 | 7.0% | 7.0% | 3 and 10%. For a time horizon >30 years, the discount rate shall be decreased as the time period increases. 31–75 years (5.33%) and 76+ years (3.66%) | Equal | Discount rates for sensitivity analysis was selected to allow benchmarking with international practice and with the official social discount rate (10%) | [46] |
| High-income countries | Poland | Health Technology Assessment Guidelines Version 3.0 | Poland Agency for HTA and Tariffs | HTA guidelines | Decision makers, pharmaceutical industry, researchers | 2016 | 5.0% | 3.5% | 0% for costs and 0% for outcomes | Differential | Justified mainly due to rising social expectations with regard to maintaining good health, as well as time-varying willingness to pay for health outcomes | [47] |
| High-income countries | Portugal | Guidelines for Economic Drug Evaluation Studies | INFARMED, ISEG, Lisbon University Faculty of Medicine, ENSP, UNL, CHE, University of York | PE guidelines | Policy makers, researchers, health authorities | 1998 | 5.0% | 5.0% | 5% | Equal | The discount rate was influenced by majority use globally. Also, based on the interest rate on the real long-term market (4 to 5%) | [24] |
| Upper-middle income | Russian Federation | Guidelines for conducting a comparative clinical and economic evaluation of drugs | Center for Healthcare Quality Assessment and Control of the Ministry of Health of the Russian Federation | PE recommendations | Decision makers, healthcare authorities, researchers, pharmaceutical companies | 2016 | 5.0% | 0.0% | Not specified but highlights the importance of conducting SA | Differential | [24] | |
| High-income countries | Singapore | Drug Evaluation Methods and Process Guide, Version 2.0 | Agency for Care Effectiveness | Submission guidelines | Pharmaceutical industry | 2019 | 3.0% | 3.0% | Not specified but recommends conducting SA in economic evaluations | Equal | Based on returns on the long-term risk-free government bonds | [48] |
| High-income countries | Scotland | Guidance to Manufacturers for Completion of New Product Assessment Form (NPAF) | Healthcare Improvement Scotland, Scottish Medicines Consortium (SMC) | PE guidelines | Scottish Medicines Consortium, Manufacturers | 2019 | 3.5% | 3.5% | Between 0 and 6%. Discount rates should be used for analyses with a time horizon of less than 30 years | Equal | [49] | |
| High-income countries | Sweden | General Guidelines for Economic Evaluations from the Pharmaceutical Benefits Board | The Dental and Pharmaceutical Benefits Agency | PE guidelines | TLV, pharmaceutical and medical device industry | 2017 | 3.0% | 3.0% | 0 and 5% | Equal | [50] | |
| High-income countries | Switzerland | Operationalisation of the Terms Effectiveness, Expediency and Profitability of Pharmaceutical | Swiss Federal Office of Public Health (BAG) | PE guidelines | Federal Commission of Pharmaceuticals | 2011 | No values stated | No values stated | No values stated | [51] | ||
| High-income countries | Slovak Republic | Guidelines for Economic Evaluation of HealthCare Interventions | Ministry of Health, Slovak Republic | PE guidelines | Decision makers, researchers, pharmaceutical companies | 2011 | 5.0% | 5.0% | Not specified but emphasizes the need for uncertainty in the evaluation | Equal | [52] | |
| High-income countries | Slovenia | Rules on the Classification of Medicine on the List | Health Insurance Institute of Slovenia | PE guidelines | Pharmaceutical industry and researchers | 2013 | 3 to 5% | 3.0% | Cost: 0–8%; discount rate for outcomes not stated | Differential | [53] | |
| Upper-middle income | South Africa | Guidelines for pharmacoeconomic submissions | National Department of Health | PE recommendations | Pharmaceutical industry, decision makers | 2013 | 5.0% | 5.0% | Costs and benefits should range 0–10% | Equal | [24] | |
| High-income countries | Spain | Spanish Recommendations on Economic Evaluation of Health Technologies | Canary Islands Health Services, Castilla La Mancha University, La Rioja University, Public Health Agency of Barcelona, Vic University, Alto Deba Hospital & Pompeu Fabra University | HTA guidelines | Pharmaceutical industry | 2010 | 3.0% | 3.0% | 0–5% for sensitivity analysis | Equal | Differential discounting for sensitivity analysis but not in the reference case | [24] |
| High-income countries | Taiwan | Guidelines of Methodological Standards for Pharmacoeconomic Evaluations | Taiwan Society for Pharmacoeconomic and Outcomes Research (TaSPOR) | PE guidelines | Not specified | 2006 | 5.0% | 5.0% | Between 0 and 10%. Outcomes: Three scenarios: discount cost but not outcome, both discounted, both not discounted | Equal | Based on the long-term interest rate ranging from 4 to 5% | [24] |
| Lower-middle income countries | Tunisia | Choix Methodologiques Pour Les Etudes Pharmaco-economiques A L'ineas (Methodological Choices for Pharmacoeconomic Studies at INEAS) | National Authority for Assessment and Accreditation in Healthcare (INEAS-Tunisia), Ministry of Health | Submission guidelines | Pharmaceutical companies and other stakeholders | 2021 | 5.0% | 5.0% | 0, 3 and 8% | Equal | [54] | |
| High-income countries | The Netherlands | From Good to Better: New Dutch Guidelines for Economic Evaluations in Healthcare | Dutch National Healthcare Institute and Institute for Medical Technology Assessment, Erasmus University Rotterdam | PE guidelines | Decision makers and researchers | 2016 | 4.0% | 1.5% | Not specified but suggests best and worst-case scenarios. For prevention, guideline recommends using different discount rates in social cost benefit analysis | Differential | [55] | |
| Upper-middle income | Thailand | Guidelines for Health Technology Assessment in Thailand (Second Edition) | The Medical Association of Thailand | HTA guidelines | Pharmaceutical industry, medical devices, researchers and decision makers | 2014 | 3.0% | 3.0% | Between 0 and 6% | Equal | Where effects are substantial and exhibit over a very long period (30 years or more), a rate of 4% for cost and 2% for health effect should be applied, so that the cost effectiveness threshold changes in line with the growth of health value (gk = gv). This ensures a difference between the two rates of 2%, which is in line with recommendations of other international guidelines and “NICE” | [56] |
| High-income countries | USA | Recommendations for conduct, methodological practices and reporting of cost-effectiveness analyses second panel on cost–effectiveness in health and medicine | Healthcare experts and researchers | HTA recommendations | Government policymakers, decision makers (health officials, payers, clinicians, patients, consumers, researchers, etc) | 2016 | 3.0% | 3.0% | The panel recommends conducting SA using a range of discount rates for costs and benefits | Equal | Based on the available data on the real economic growth on the real consumption rate of interest and promoting consistency with CEA studies | [57] |
| Lower-middle income countries | Ukraine | Sovereign Assessment of Medical Technologies for Medical Treatment (State Assessment of Medical Technologies for Medicines) | Ministry of Health of Ukraine | HTA guidelines | Stakeholders undefined | 2021 | 3.0% | 3.0% | Equal | Per WHO recommendations | [58] | |
| High-income countries | UK | Guide to the methods of technology appraisal 2013 | National Institute for Health and Care Excellence (NICE) | HTA guidelines | All organizations for HTA submission | 2013 | 3.5% | 3.5% | Costs and health effects at 1.5% | Equal | The specific discount rate varies across jurisdictions and over time. The Institute considers that it is usually appropriate to discount costs and health effects at the same annual rate of 3.5%, based on the UK Treasury's recommendation for the discounting of costs | [59] |
| NA | Europe | Methods for Health Economic Evaluations - A Guideline based on Current Practices in Europe | EUnetHTA | HTA guidelines | Health economists and health technology assessors | 2015 | 3–5% | 3–5% | Recommends exploring a variety of rates in the sensitivity analysis | Equal | It is recommended that both costs and effects are discounted in the base case analysis with the same rate. Furthermore, sensitivity analyses that explore the effect of varying the discount rate and differential discount rates (that is a lower discount rate for benefits than costs) should be performed | [60] |
| NA | Global | WHO guide to cost–effectiveness analysis | WHO | HTA recommendations | Researchers | 2003 | 3.0% | 3.0% | Costs (6%) and health effects (0%) | Equal | “The appropriate social discount rate takes into account the possibility of catastrophe outlined above, pure time preference and the rate at which the value of a unit of consumption might decline over time.” | [13] |
Results
Guideline characteristics
A total of 52 EE documents published between 1998 and 2022 were included in this review: 17 HTA guidelines, 24 PE guidelines, four PE recommendations, five submission guidelines and two HTA recommendations (Figure 2). Included guidelines were from 32 (61.5%) high-income countries, ten (19.2%) upper-middle-income countries and eight (15.4%) lower-middle-income countries. Countries were categorized based on the World Bank’s country and lending group classification for the fiscal year 2023 [61]. The remaining two guidelines were global (WHO) or European (EUnetHTA). The target audiences for the EE guidance were decision makers, including payers and healthcare professionals, researchers, and the pharmaceutical and medical device industries (Table 1).
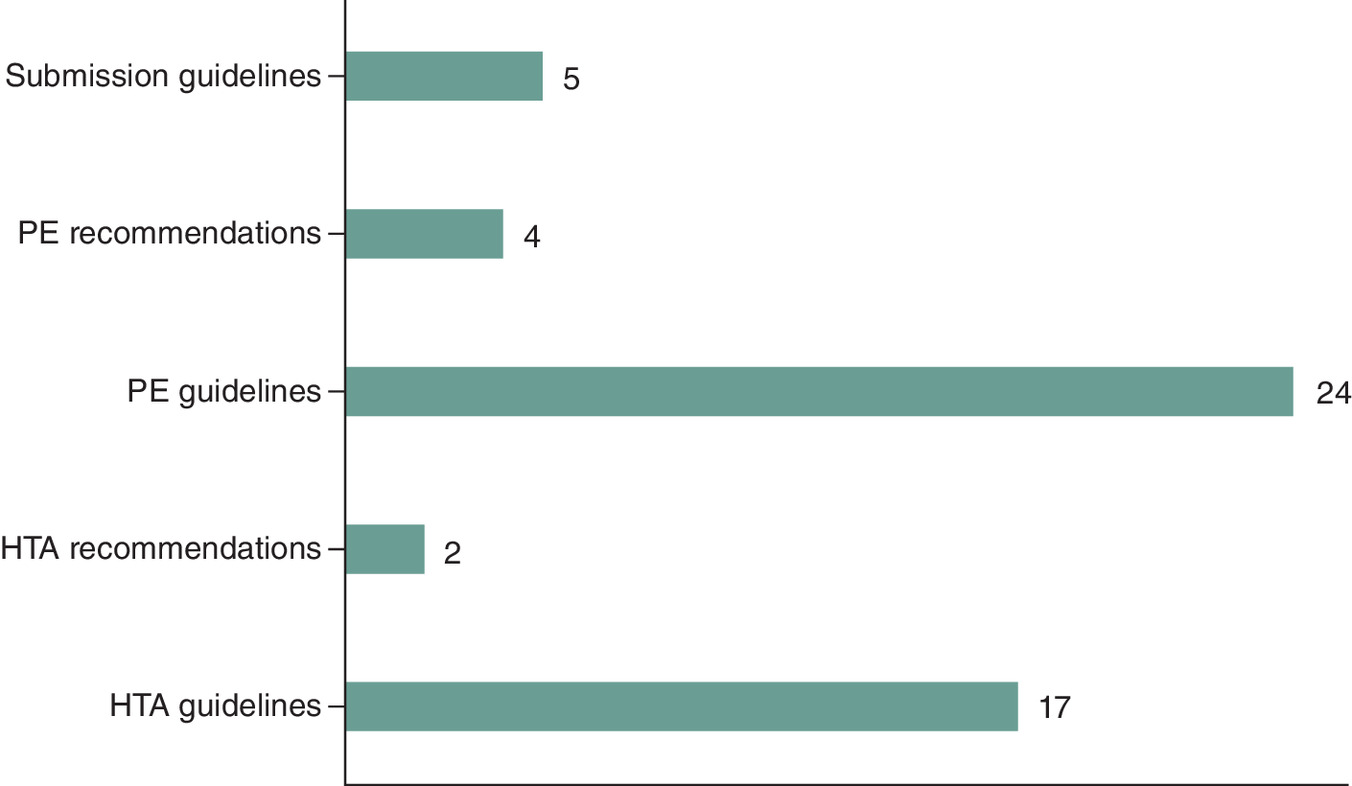
Figure 2. Economic evaluation guidelines in healthcare representation by type.
HTA: Health technology assessments; PE: Pharmacoeconomic.
Choice of discount rates
The following concepts were used to categorize the discount rates of costs and benefits: equal discounting (identical discount rates for both costs and benefits) and differential discounting (different discount rates for costs and benefits) (Figure 3). The majority (80.8%) of the EE guidelines recommend equal discounting of costs and benefits (Figure 1). However, Iran and MERCOSUR (Argentina, Brazil, Paraguay and Uruguay) recommend discounting costs and benefits but do not specify the choice of rates. Similarly, three countries (Bhutan, Denmark and Switzerland) did not specify discount rates in their guidelines.

Figure 3. A global view of the discounting approaches in economic evaluation guidelines on healthcare.
Differential discounting: Belgium, Poland, Russian Federation, Slovenia and The Netherlands. Equal discounting: Australia, Austria, Baltic (Latvia, Lithuania and Estonia), Brazil, Canada, China, Colombia, Croatia, Cuba, Czech Republic, Egypt, Europe, Finland, France, Germany, Global, Hungary, India, Indonesia, Ireland, Israel, Italy, Japan, Malaysia, Mexico, New Zealand, Norway, Philippines, Portugal, Scotland, Singapore, Slovak Republic, South Africa, South Korea, Spain, Sweden, Taiwan, Thailand, Tunisia, Ukraine, UK and USA.
Countries that emphasized equal discounting of costs and benefits in their guidance documents ranged from 1.5% (Canada) to 7% (the Philippines) (Table 1). The recommended discount rate to be used in sensitivity analysis for both costs and benefits ranged from 0% to 12%. Cuba recommended discounting both costs and benefits using rates recommended by specific government agencies.
Five EE guidelines (9.6%) emphasized differential discounting: Belgium, Poland, Russia, Slovenia and The Netherlands. The recommended discount rates for costs ranged from 3.0% (Belgium) to 5.0% (Russia, Poland and Slovenia), whereas the recommended discount rates for benefits ranged from 1.5% (Belgium and The Netherlands) to 3.5% (Poland). The discount rate for the reference case in sensitivity analysis ranged from 0% (Belgium, Poland and Slovenia) to 8.0% (Slovenia). Russia and the Netherlands did not specify discount rates for sensitivity analysis but highlight the importance of conducting sensitivity analysis in economic evaluations.
Discounting rationale
Of the 52 guidelines evaluated, 27 (51.9%) provided a clear rationale for the recommended discount approach. These countries include Belgium, Canada, Croatia, Cuba, Denmark, Egypt, France, Germany, Hungary, India, Ireland, Italy, New Zealand, Norway, Portugal, Singapore, Taiwan, Thailand, Ukraine, the UK and the USA. In contrast, 27 (51.9%) EE guidelines did not include a rationale for their recommended discounting approach and include: Australia, Austria, Baltic, Bhutan, Brazil, China, Colombia, Czech Republic, Finland, Indonesia, Iran, Israel, Japan, Malaysia, MERCOSUR, Mexico, Russia, Scotland, Slovak Republic, Slovenia, South Africa, Sweden, Switzerland and The Netherlands and Tunisia.
Among the 42 guidelines that recommended equal discounting, the choice and justification for the discount rate were based primarily on government (Ministry of Finance) recommendations (Cuba, Portugal, Ireland and the UK), consistency with other countries or economic evaluations (Egypt, India, Italy and Singapore) and economic development (government’s long-term cost of borrowing) (Cuba, Canada and Croatia). For example, the Canadian HTA guideline offered theoretical arguments on discounting recommendations but not a rationale for equal discounting [28]. The UK’s guideline specified equal discounting in its reference case at 3.5% per year, in line with its public bodies [59]. Normative arguments for equal discounting include consistency and comparison of results to other EEs. However, technical arguments focused on anticipated budget changes, the rate of return on investments, and the value of productivity and health over time.
Of the five countries that emphasized differential discounting, two (Belgium and Poland) included a rationale for the approach. The rationale for differential discounting in Belgium was based on consistency with previously published guidelines and consistency in the discount rate above a fluctuating rate (e.g., interest on the short-term government bonds and the anticipated budget changes). Poland justified its discounting approach as attributable to rising social expectations with regards to maintaining good health, as well as time-varying willingness to pay for health outcomes.
Discussion
This review summarizes the discounting rates and approaches used in EE guidelines for healthcare. Globally, discounting rules vary substantially, with many guidelines recommending equal rather than differential discounting of future costs and benefits. The rationale for equal discounting is mainly based on the consistency thesis [15] and uniformity with other assessment bodies that allows for comparability, transferability and generalizability of the value of healthcare across different settings. However, the rationale for differential discounting was based on the return on risk-free government bond and the anticipated budget changes over time. Gaps exist in the rationale behind discounting rate choices, which may be due to the changing discounting trajectory, misunderstandings on discounting health [15,16], lack of clarity on the rationale for discounting approaches, limited resources or investment in health, or disagreement on discounting of costs and benefits [10–12].
Theoretical debates about discounting in economic evaluations
Much of the recent inconsistencies in approaches to discounting costs and benefits stem from the UK’s shift in discounting rules from differential to equal discounting [62–64]. The inconsistency in discounting rules between the National Institute for Health and Care Excellence (NICE) and the Green Book, with irregularity in the changes in NICE annual rates and the differential rates over time, is notable [59,65]. The historical trajectory of UK discount rates has varied over time: NICE 2001 (6.0% and 1.5%) was aligned to the UK Department of Health; NICE 2004 (3.5% and 1.5%) aligned to Gravelle and Smith (2001); NICE 2004 (3.5%) was specified in the Green Book; and NICE 2008 (3.5% each) differed from the Green Book (1.5%) annual rate of health outcomes. Regardless, the current guidelines for equal discounting is consistent with other assessment bodies such as Canada’s Drug and Health Technology Agency.
Two influential arguments favoring equal discounting are the consistency thesis and the Keeler–Cretin paradox [15,66]. The consistency argument is based on valuing the benefits relative to current costs as in future costs and has no assumption that future benefits are less valuable than current benefits. The relationship between costs and benefits is then constant [15]. Similarly, the Keeler–Cretin paradox illustrates how an intervention may be more favorable by postponing its implementation if its costs are discounted, but the effects are not. Both studies concluded that differential discounting of costs and benefits might lead to misleading results [66]. This concept may be true when people delay spending due to an expectation of a price decline. Though, if the relative value of health or societal income rises with time, costs and benefits should have equal discount rates. However, because costs and benefits occur at different periods, differential discounting seems logical. Given decision makers choose from competing priorities to fund interventions, the likelihood of patients from different periods competing for resources is unlikely to occur [11,67].
Opposing arguments to equal discounting recommend not discounting benefits or conducting differential discounting of costs and benefits [10,11,68,69]. For instance, the discount factor for benefits should be higher than that of costs but lower than the rate of growth of future benefits compared with future costs over time [11]. However, because marginal utility increases with income and health remains constant, it is believed the rate will be positive in most settings. Furthermore, the rationality of this approach depends on the decision maker’s interest in maximizing health or wealth, a fixed healthcare budget and the changes in the value of health over time. The study concluded differences in the discounting rate might play a role in the growth of the cost–effectiveness (CE) threshold or value of health [70], potentially generating misleading results. Though under ‘strong and implausible assumptions about the values and facts,’ discounting costs and benefits at a common rate could be acceptable [63]. The assumption is that over time, the budget increases rapidly and the marginal social value of health spending increases as the marginal value of utility relative to consumption.
In the discounted utility model, the value from future welfare is the same as the product of the current utility and discount factor, which causes a positive time preference [71]. This emphasizes that equal discounting is appropriate, regardless of utility over different time periods. However, due to the distinct characteristics of interventions/programs, EEs could be sensitive to discounting and may worsen the CE of programs [11,72,73]. One notion is horizontal equity occurs and preserves treatment neutrality for potential beneficiaries who are alive and treated in a neutral manner, regardless of their position in time [74]. However, if potential beneficiaries are not equal in all respects due to differences in demographic characteristics, then the valuation of health could be perceived differently [75].
Implications on the value of healthcare
Several critics suggest treating costs and benefits differently and call for a deviation from the discounting policy for interventions [11,72,73]. Theoretically, the decision rule for differential discounting is based on the growth of the consumption value of health and the CE threshold and constraints on healthcare expenditure [9]. In addition, when the marginal utility of consumption declines, health becomes valuable, allowing for the satisfaction of higher consumption. Thus, discount rates for benefits need to be lower than those of costs if the benefits are valued per utility benefits [76]. Also, when both the microeconomic theory of consumption and the social welfare theory are evaluated, the discounting of benefits should be lower than the discounting of costs [76]. Yet, applying equal discounting to costs and benefits in EE is a departure from the utility-based theory [76].
Because a citizen requires healthcare services from birth to death, healthcare has been a key area for government investment. In the US, healthcare spending reached $3.6 trillion in 2018 ($11,172 per person), accounting for 17.7% of the share of the economy [77]. Given healthcare is an integral part of any society or nation, defining discount rates for both costs and benefits should be justified by rationales that are personalized for each country or healthcare system. However, resources are limited and investment in health varies by country; thus, accounting for the need for differential discounting.
Given the constraints on healthcare expenditures, healthcare costs will be health, which will be forgone at a rate represented by the CE threshold [9]. However, if healthcare expenditure is constrained, future costs are not displaced by consumption, but rather by health. In this case, any growth in health consumption value means subsequent costs and benefits are valuable. Thus, if the incremental cost–effectiveness ratio (ICER) is compared with the current threshold, then the increase in the consumption value of health can be reflected by discounting the incremental costs and benefits at a lower consumption rate [63]. Most importantly, the growth in the threshold justifies lowering the discount rates for benefits more than the discount rate for costs when one compares the ICER and the threshold [9]. In contrast, future costs may displace future consumption rather than health if there are no constraints on healthcare spending. Then, the future costs and benefits may be discounted equally. However, if no constraints occur in healthcare spending and growth in the consumption value of health, then discounting benefits lower than costs is ideal in EE guidelines.
Understanding the rationale for EE is critical and determines an appropriate discounting approach [63]. For instance, an EE that focuses on health spending should capture the future health benefits valued through differential discounting. If CE is the goal, costs and benefits should be discounted equally [63]. Also, from an intergenerational perspective of health effects, differential discounting appears to be more equitable and technically sound than equal discounting. Equal discounting appears to be appropriate for consistency with other national guidelines; however, the argument for equal discounting becomes acute when the effects of interventions are delayed and costs and benefits decrease at different times. Because current consumption is more valued than subsequent consumption, there is a higher opportunity cost for the current compared with the future consumption, resulting in the need for investing in existing resources to generate returns.
Strengths & limitations
This study has several limitations. First, this article focuses on the review of healthcare EE guidelines. Given the included documents were not designed as comparative research, an assessment of the risk of bias for each guideline was not completed. Since quality assessment is a critical part of systematic reviews, a standardized quality assessment tool for non traditional documents should be developed to ensure the reporting quality is assessed. Second, the wording of the guidelines was not sufficiently clear to make definite statements on the categorization of the guidelines by type. Third, the target audience, when not specified, was challenging to ascertain. Although in most countries, the guidelines were developed and funded by government agencies and were classified based on their country. However, the recommendations of the second panel was developed by global experts and funded by the US non profits and government agency, and this guideline was classified as a US guideline. At last, not all guidelines were available at the time of the review, thus not all guidelines were included.
Despite these limitations, this paper offers a comparative assessment of the discount rules and lays out the theoretical arguments of the impact of equal and differential discounting. Yet, differences in the discounting approach exist and can potentially impact the value of healthcare, health policies and resources. Thus, future research could explore the implications of discounting rates on healthcare decisions given how differences in discounting rates could impact the value of healthcare and interventions. This study serves as relevant material to researchers on the discounting landscape, methodological implications and the potential impact on national healthcare systems. Further, this study highlights the need for decision makers in countries without an EE guideline to consider developing a methodological guideline for EE in healthcare.
Conclusion
This study highlights substantial variations in the discount rates for costs and benefits in healthcare EE guidelines. Most EE guidelines emphasize equal discounting, which is partly due to budget constraints, the social objective of the economy and positive time preference. While the controversy in the methodological approaches of discounting impacts access to interventions, resource planning and decision making, there is need for standardization and clarity in the discounting approaches in EE guidelines.
•
Evidence evaluating discounting approaches in the current healthcare economic evaluation (EE) guidelines is lacking. This review evaluated and compared the discounting approaches in current published EE guidelines for healthcare interventions and programs.
•
Published healthcare EE guidelines were from 32 (61.5%) high-income countries, ten (19.2%) upper-middle-income countries and eight (15.4%) lower-middle-income countries.
•
Differences were found in the choice of discount rate – equal (80.8%), differential (9.6%) and no discount rates (9.6%).
•
Among the 42 guidelines that recommended equal discounting, the choice and justification of the discount rate was based mainly on government (Ministry of Finance) recommendations, consistency with other countries or economic evaluations and economic development (government long-term cost of borrowing).
•
The rationale for differential discounting was based on consistency with previously published guidelines, consistency in the discount rate above a fluctuating rate, rising social expectations regarding maintaining good health and time-varying willingness to pay for health outcomes.
•
Differential discounting appears to be more equitable and technically sound than equal discounting from an intergenerational perspective of health effects. Equal discounting appears to be appropriate for consistency with the other national guidelines, health budgets and resources constraints. However, the argument for equal discounting becomes acute when the effects of interventions are delayed and costs and benefits fall at different times.
•
A wide variation and methodological differences in discounting in EE guidelines exists. Thus, there is a need for a global consensus on, and consistency in, discounting approaches, given their impact on the value of interventions, resource planning and decision making.
Author contributions
AO Williams designed the methodology, extracted and analyzed data, and drafted the manuscript. S Rojanasarot and A Kumar contributed to the interpretation of the data and the manuscript writing. AM McGovern extracted data, edited and revised the manuscript. All authors read and approved the final manuscript and agreed to be accountable for all aspects of the work.
Acknowledgments
The authors acknowledge K Nguyen for assisting in proofreading the manuscript.
Financial & competing interests disclosure
AO Williams, S Rojanasarot and AM McGovern are full-time employees and own stock in Boston Scientific. A Kumar is an Assistant Professor at the University of Cincinnati. The authors have no other relevant affiliations or financial involvement with any organization or entity with a financial interest in or financial conflict with the subject matter or materials discussed in the manuscript apart from those disclosed.
No writing assistance was utilized in the production of this manuscript.
Data sharing statement
Data supporting the findings of this study are available from the corresponding author (AO Williams), upon reasonable request.
Open access
This work is licensed under the Attribution-NonCommercial-NoDerivatives 4.0 Unported License. To view a copy of this license, visit http://creativecommons.org/licenses/by-nc-nd/4.0/
Supplementary Material
File (supplementary materials.docx)
- Download
- 40.02 KB
References
1.
Rotily M, Roze S. What is the impact of disease prevalence upon health technology assessment? Best Pract. Res. Clin. Gastroenterol. 27(6), 853–865 (2013).
2.
Guyatt G, Drummond M, Feeny D et al. Guidelines for the clinical and economic evaluation of health care technologies. Soc. Sci. Med. 22(4), 393–408 (1986).
3.
Mitchell PM. The cost–effectiveness of what in health and care? In: Defining the Value of Medical Interventions: Normative and Empirical Challenges. Schildmann J, Buch C, Zerth J, Kohlhammer VW (Eds). W. Kohlhammer GmbH, Stuttgart, Germany (2021).
4.
Pagliarulo N. New CAR-T therapy from Bristol, Bluebird effective but too costly, ICER finds. Biopharma Dive (2021). www.biopharmadive.com/news/icer-car-t-multiple-myeloma-cost-bristol-johnson/597875/
5.
US Food and Drug Administration (FDA). Approved cellular and gene therapy products. (2022). www.fda.gov/vaccines-blood-biologics/cellular-gene-therapy-products/approved-cellular-and-gene-therapy-products
6.
Drummond M, Barbieri M, Cook J et al. Transferability of economic evaluations across jurisdictions: ISPOR Good Research Practices Task Force report. Value Health 12(4), 409–418 (2009).
7.
ISPOR—The Professional Society for Health Economics and Outcomes Research. About HEOR (2022). www.ispor.org/heor-resources
8.
Cairns JA. Valuing future benefits. Health Econ. 3(4), 221–229 (1994).
9.
Drummond MF, Sculpher MJ, Claxton K, Stoddart GL, Torrance GW. In: Methods for the Economic Evaluation of Health Care Programmes. Chapter 4 (4th edition). Oxford university press, Oxford, England (2015).
10.
Parsonage M, Neuburger H. Discounting and health benefits. Health Econ. 1(1), 71–76 (1992).
11.
Gravelle H, Smith D. Discounting for health effects in cost–benefit and cost-effectiveness analysis. Health Econ. 10(7), 587–599 (2001).
12.
Jones-Lee MW, Loomes G. Discounting and safety. Oxf. Econ. Pap. 47(3), 501–512 (1995).
13.
World Health Organization, Baltussen R, Tan-Torres T et al. Making Choices in Health: WHO Guide to Cost-Effectiveness Analysis. World Health Organization, Geneva, Switzerland (2003). https://apps.who.int/iris/handle/10665/42699
14.
Severens JL, Milne RJ. Discounting health outcomes in economic evaluation: the ongoing debate. Value in Health. 7(4), 397–401 (2004).
15.
Weinstein MC, Stason WB. Foundations of cost-effectiveness analysis for health and medical practices. N. Engl. J. Med. 296(13), 716–721 (1977).
16.
Sheldon TA. Discounting in health care decision-making: time for a change? J. Public Health 14(3), 250–256 (1992).
17.
Blüher M, Saunders SJ, Mittard V, Torrejon Torres R, Davis JA, Saunders R. Critical review of European health-economic guidelines for the health technology assessment of medical devices. Front. Med. 6, 278 (2019).
18.
Khorasani E, Davari M, Kebriaeezadeh A, Fatemi F, Akbari Sari A, Varahrami V. A comprehensive review of official discount rates in guidelines of health economic evaluations over time: the trends and roots. Eur. J. Health Econ. 23(9), 1577–1590 (2022).
19.
Daccache C, Rizk R, Dahham J, Evers SM, Hiligsmann M, Karam R. Economic evaluation guidelines in low-and middle-income countries: a systematic review. Int. J. Technol. Assess. Health Care 38(1), e1 (2022).
20.
Moher D, Liberati A, Tetzlaff J, Altman DG, Group* P. Preferred reporting items for systematic reviews and meta-analyses: the PRISMA statement. Ann. Intern. Med. 151(4), 264–269 (2009).
21.
Page MJ, Moher D, Bossuyt PM et al. PRISMA 2020 explanation and elaboration: updated guidance and exemplars for reporting systematic reviews. BMJ 372, n160 (2021).
22.
Bundeinstitut für Qualität im Gesundheitswesen & GesundheitÖsterreich(Biqg) BFQIGGÖ. Methodenhandbuch für Health Technology Assessment Version 1. (2012). https://vdocuments.net/methodenhandbuch-fr-health-technology-assessment-version-1.html?page=1
23.
Pharmaceutical Benefits Advisory Committee (PBAC). Guidelines for preparing a submission to the Pharmaceutical Benefits Advisory Committee, Version 5.0. PBAC, Australia (2016). https://database.inahta.org/article/19098
24.
ISPOR—The Professional Society for Health Economics and Outcomes Research. Pharmacoeconomic guidelines around the world. www.ispor.org/heor-resources/more-heor-resources/pharmacoeconomic-guidelines
25.
Brazil Ministry of Health Ministry of Health. Secretariat of Science, Technology and Strategic Insumos. Diretrizes metodológicas Diretriz de Avaliação Econômica, 2a edição. Department of Science and Technology, Brazil (2014). https://bvsms.saude.gov.br/bvs/ct/PDF/dirtrizes_de_avaliacao_economica.pdf
26.
Belgian Health Care Knowledge Center (KCE). Belgian Guidelines for Economic Evaluations and Budget Impact Analyses (Second Edition). KCE, Beligum (2012). https://kce.fgov.be/sites/default/files/2021-11/KCE_183_economic_evaluations_second_edition_Report_update.pdf
27.
Essential Medicines and Technology Division (EMTD). Health Technology Assessment Process Guideline, 2nd edition 2018. Department of Medical Services, Bhutan Ministry of Health (2018). www.moh.gov.bt/wp-content/uploads/afd-files/2014/11/HTA-Process-Guideline.pdf
28.
Canadian Agency for Drugs and Technologies in Health (CADTH). Guidelines for the economic evaluation of health technologies: Canada. CADTH, Ottawa, Canada (2017). www.cadth.ca/guidelines-economic-evaluation-health-technologies-canada-4th-edition
29.
Instituto de Evaluación Tecnológica en Salud (IETS). Manual Para la Elaboración de Evaluaciones Económicas en Salud. IETS, Colombia (2014). www.iets.org.co/Archivos/64/Manual_evaluacion_economica.pdf
30.
Republic of Croatia. The Croatian Guideline for Health Technology Assessment Process and Reporting (1st edition) Agency for Quality and Accreditation in Health and Social Welfare, Croatia (2011). http://aaz.hr/hr/procjena-zdravstvenih-tehnologija
31.
Czech Pharmacoeconomic Society (CPS). Doporučené postupy České farmakoekonomické společnosti (ČFES) pro zdravotně-ekonomická hodnocení v ČR (Czech Best Practices Pharmacoeconomic Society (CFES) for Health-Economic Evaluations in the Czech Republic). (2016). http://farmakoekonomika.cz/wp-content/uploads/2016/10/DP_CFES_13-10-2016_final.pdf
32.
Danish Institute for Health Technology Assessment (DIFHTA. Health Technology Assessment Handbook. (2001). https://cours.etsmtl.ca/gts813/Documents/health_technology_assessment_handbook.pdf
33.
Elsisi GH, Kaló Z, Eldessouki R et al. Recommendations for reporting pharmacoeconomic evaluations in Egypt. Value Health Reg. Issues 2(2), 319–327 (2013).
34.
Haute Autorité de Santé (HAS). Choices in methods for economic evaluation. HAS, France (2012). www.has-sante.fr/upload/docs/application/pdf/2012-10/choices_in_methods_for_economic_evaluation.pdf
35.
Finland Pharmaceuticals Pricing Board. Preparing a health economic evaluation to be attached to the application for reimbursement status and wholesale price for a medicinal product. (2019). www.hila.fi/content/uploads/2020/01/Instructions_TTS_2019.pdf
36.
Department of Health Research, Ministry of Health & Family Welfare. Health Technology Assessment in India: A manual. Government of India, India (2018). htain.icmr.org.in/images/pdf/htain%20manual.pdf
37.
Italian Medicines Agency. Linee Guide Per La Compilazione Del Dossier A Supporto Della Della Domanda Di Rimborsabilità E Prezzo Di Un Medicinale, Versione 1.0. Rome, Italy (2020). /www.aifa.gov.it/documents/20142/1307543/2021.01.22_estratto_linee_guida_sezione_E.pdf
38.
Health Information and Quality Authority (HIQA). Guidelines for the economic evaluation of health technologies in Ireland. HIQA, Dublin (2020). www.hiqa.ie/sites/default/files/2020-09/HTA-Economic-Guidelines-2020.pdf
39.
Indonesian Health Technology, Assessment Committee (InaHTAC). Health technology assessment (HTA) guideline. Ministry of Health, Republic of Indonesia, Indonesia (2017). www.gear4health.com/uploads/files/file-15-5a441f38c8992.pdf
40.
Core to Evidence-Based Health Policy (C2H NIPH). Guideline for preparing cost–effectiveness evaluation to the Central Social Insurance Medical Council. National Institute of Public Health, Japan (2022). https://c2h.niph.go.jp/tools/guideline/guideline_en.pdf
41.
Korea Health Insurance Review and Assessment (HIRA). Guidelines on economic evaluation for pharmaceuticals. HIRA, Korea (2022). www.hira.or.kr/bbsDummy.do?pgmid=HIRAA040055000000
42.
Ministry of Health Malaysia. Pharmacoeconomic guidelines for Malaysia. Ministry of Health Malaysia, Malaysia (2019). www.pharmacy.gov.my/v2/sites/default/files/document-upload/pharmacoeconomic-guidelines-malaysia-malaysia-second-edition-2019-final-page-adjustment_0.pdf
43.
General Health Council. Guía para la conducción de estudios de evaluación económica para la actualización del Cuadro Básico y Catálogo de Insumos del Sector Salud en México, Edición Diciembre 2017. Government of Mexico, Mexico (2017). www.csg.gob.mx/descargas/pdf/priorizacion/cuadro-basico/guias/conduccion_estudios/GCEEE_2017_Diciembre_x1x.pdf
44.
MERCOSUR. Guía metodológica para estudios de evaluación. (2013). http://sedici.unlp.edu.ar/bitstream/handle/10915/44143/MERCOSUR-_Gu%C3%ADa_metodol%C3%B3gica_para_estudios_de_evaluaci%C3%B3n_econ%C3%B3mica_de_tecnolog%C3%ADas_sanitarias__30_p._.pdf?sequence=63&isAllowed=y
45.
Pharmaceutical Management Agency (PHARMAC). Prescription for pharmacoeconomic analysis. Methods for cost-utility analysis. Wellington, New Zealand (2015). https://pharmac.govt.nz/assets/pfpa-2-2.pdf
46.
Republic of the Philippines, Health Technology Assessment Unit, Department of Health. Philippine HTA methods guide: methodological standards in evaluation of health technologies in the Philippines. (2020). https://drive.google.com/file/d/1lwSZcGXcCmPyibRSJ8d_M1pKNy9jE46K/view
47.
Agency for Health Technology Assessment and Tariff System. Wytyczne oceny technologii medycznych (HTA, ang. health technology assessment. (2016). www.aotm.gov.pl/media/2020/07/20160913_Wytyczne_AOTMiT-1.pdf
48.
Singapore Agency for Care and Effectiveness. Drug evaluation methods and process guide. Ministry of Health Singapore, Singapore (2019). www.ace-hta.gov.sg/docs/default-source/process-methods/ace-methods-and-process-guide-for-drug-evaluation-(20-dec-2019).pdf
49.
Scottish Medicine Consortium (SMC). Guidance to Manufacturers for Completion of New Product Assessment Form (NPAF). Glasgow, Scotland (2019). www.scottishmedicines.org.uk/making-a-submission/
50.
Swedish Council on Health Technology Assessment. Assessment of Methods in Health Care: A Handbook. Swedish Council on Health Technology Assessment (SBU), Stockholm, Sweden (2017). www.ncbi.nlm.nih.gov/books/NBK447962/
51.
Swiss Federal Office of Public Health. Operationalisation of the terms effectiveness, expediency and profitability of pharmaceutical. Swiss Federal Office of Public Health, Switzerland (2011). www.bag.admin.ch/themen/krankenversicherung/00263/00264/04853/index.html?lang=de
52.
Ministry of Health of the Slovak Republic. Guidelines for economic evaluation of health care interventions. Slovak Republic (2021). www.zakonypreludi.sk/zz/2011-422
53.
Health Insurance Institute of Slovenia. Rules on the classification of medicine on the list. Ljubljana, Slovenia (2013). www.uradni-list.si/glasilo-uradni-list-rs/vsebina/112932
54.
National Authority for Assessment and Accreditation in Healthcare (INEAS-Tunisia). Choix Methodologiques Pour Les Etudes Pharmaco-economiques A L'ineas (Methodological Choices for Pharmacoeconomic Studies at INEAS). Ministry of Health, Tunisia (2021). https://www.ineas.tn/sites/default/files/ineas.hta_.guide_etudes_pharmacoeconomiques.pdf
55.
Versteegh M, Knies S, Brouwer W. From good to better: new Dutch guidelines for economic evaluations in healthcare. PharmacoEconomics 34(11), 1071–1074 (2016).
56.
Permsuwan U, Guntawongwan K, Buddhawongsa P. Handling time in economic evaluation studies. J. Med. Assoc. Thai. 91(2), S53–S58 (2008).
57.
Sanders GD, Neumann PJ, Basu A et al. Recommendations for conduct, methodological practices, and reporting of cost-effectiveness analyses: second panel on cost-effectiveness in health and medicine. JAMA 316(10), 1093–1103 (2016).
58.
Ukraine Ministry of Health. Sovereign assessment of medical technologies for medical treatment (state assessment of medical technologies for medicines). Ukraine Ministry of Health, Ukraine (2021). www.dec.gov.ua/viewe-pdf-file/?url=https://www.dec.gov.ua/?ZG93bmxvYWQ=d3AtY29udGVudC91cGxvYWRzLzIwMjEvb210L0F0dGl0dWRlX3YxLnBkZg==
59.
National Institute for Health and Care Excellence (NICE). In: Guide to the methods of technology appraisal. National Institute for Health and Clinical Excellence, London, UK (2013). www.nice.org.uk/process/pmg9/chapter/foreword
60.
European Network for Health Technology Assessment (EUnetHTA). Methods for health economic evaluations - a guideline based on current practices in Europe Diemen, Netherlands (2015). www.eunethta.eu/wp-content/uploads/2018/03/Methods_for_health_economic_evaluations.pdf
61.
World Bank. World Bank country and lending groups. World Bank, Washington DC, US (2022). https://datahelpdesk.worldbank.org/knowledgebase/articles/906519
62.
Claxton K, Sculpher M, Culyer A et al. Discounting and cost-effectiveness in NICE–stepping back to sort out a confusion. Health Econ 15(1), 1–4 (2006).
63.
Claxton K, Paulden M, Gravelle H, Brouwer W, Culyer AJ. Discounting and decision making in the economic evaluation of health-care technologies. Health Econ. 20(1), 2–15 (2011).
64.
Gravelle H, Brouwer W, Niessen L, Postma M, Rutten F. Discounting in economic evaluations: stepping forward towards optimal decision rules. Health Econ. 16(3), 307–317 (2007).
65.
Hurst M. The Green Book: Central Government Guidance on Appraisal and Evaluation: HM Treasury. OGL Press, London, UK (2022). https://assets.publishing.service.gov.uk/government/uploads/system/uploads/attachment_data/file/1063330/Green_Book_2022.pdf
66.
Keeler EB, Cretin S. Discounting of life-saving and other nonmonetary effects. Manag. Sci. 29(3), 300–306 (1983).
67.
Cohen BJ. Discounting in cost-utility analysis of healthcare interventions. Pharmacoeconomics 21(2), 75–87 (2003).
68.
Drummond M. Economic analysis alongside controlled trials: an introduction for clinical researchers. Department of Health, London, UK (1994).
69.
Milner S, Marples G. Policy appraisal and health project: phase 1: a literature review. University of Northumbria, Newcastle, UK (1997).
70.
Stiglitz JE, Sen A, Fitoussi J-P. Mismeasuring our Lives: Why GDP Doesn't Add Up. The New Press, NY, US (2010).
71.
Samuelson PA. Some aspects of the pure theory of capital. Q. J. Econ. 51(3), 469–496 (1937).
72.
Brouwer WB, Niessen LW, Postma MJ, Rutten FF. Need for differential discounting of costs and health effects in cost effectiveness analyses. BMI 331(7514), 446–448 (2005).
73.
Lipscomb J. Time preference for health in cost–effectiveness analysis. Med. Care 27(Suppl. 3), S233–S253 (1989).
74.
Weinstein MC, Russell LB, Gold MR, Siegel JE. Cost–Effectiveness in health and medicine. Oxford University Press, NY, USA (1996).
75.
Brouwer W, Van Hout B, Rutten F. A fair approach to discounting future effects: taking a societal perspective. J. Health Serv. Res. Policy 5(2), 114–118 (2000).
76.
Haacker M, Hallett TB, Atun R. On discount rates for economic evaluations in global health. Health Policy Plan 35(1), 107–114 (2020).
77.
Hartman M, Martin AB, Benson J, Catlin A, Team NHEA. National health care spending in 2018: growth driven by accelerations in Medicare and private insurance spending. Health Affairs 39(1), 8–17 (2020).
Information & Authors
Information
Published In
Copyright
© 2022 The Authors. This work is licensed under the Attribution-NonCommercial-NoDerivatives 4.0 Unported License
History
Received: 13 September 2022
Accepted: 18 November 2022
Published online: 7 December 2022
Keywords:
Topics
Authors
Metrics & Citations
Metrics
Article Usage
Article usage data only available from February 2023. Historical article usage data, showing the number of article downloads, is available upon request.
Citations
How to Cite
A systematic review of discounting in national health economic evaluation guidelines: healthcare value implications. (2022) Journal of Comparative Effectiveness Research. DOI: 10.2217/cer-2022-0167
Export citation
Select the citation format you wish to export for this article or chapter.
Citing Literature
- Claire Lepault, Philippe Quirion, Pierre Uginet, A hidden health impact of heat: exacerbated anemia in India, Journal of Environmental Economics and Management, 10.1016/j.jeem.2026.103365, 139, (103365), (2026).
- Kyaw Zay Ya, Chee Wai Ku, See Ling Loy, Annabel Ngien, Kai Ting Mok, Mei Chien Chua, Fabian Yap, Jerry Kok Yen Chan, Elizabeth Martin, Economic evaluation of the Healthy Early Life Moments in Singapore (HELMS) programme: a study protocol for an integrated lifestyle intervention supported by a mobile health tool for mothers and children in Singapore, BMJ Open, 10.1136/bmjopen-2026-116421, 16, 6, (e116421), (2026).
- Elvira Meni Maria Gkrinia, Andrej Belančić, Ivana Stević, Dinko Vitezić, Slobodan Janković, Pharmacoeconomics of high-cost therapies: real world challenges, Expert Review of Pharmacoeconomics & Outcomes Research, 10.1080/14737167.2026.2691186, 26, 6, (723-738), (2026).
- Aleksi K. Winstén, Ville Langén, K.E. Juhani Airaksinen, Konsta Teppo, Cost-Effectiveness of Anticoagulation Treatment for Subclinical Device-Detected Atrial Fibrillation, JAMA Network Open, 10.1001/jamanetworkopen.2026.17213, 9, 6, (e2617213), (2026).
- Mochou Liu, Xinyue Zhang, Mengwen Feng, Qingfeng He, Zhen Feng, Cost-effectiveness of inclisiran in patients with atherosclerotic cardiovascular disease from Chinese healthcare perspective, PLOS One, 10.1371/journal.pone.0350294, 21, 5, (e0350294), (2026).
- Junni Du, Yi Cao, Yuxin Cai, Yan Li, Aixia Ma, Pingyu Chen, Tiantian Tao, Domain-specific discounting of health and money: implications for health technology assessment, The European Journal of Health Economics, 10.1007/s10198-026-01937-0, (2026).
- Christina Guo, Christopher Xiao, Juliana Evangelista Paiva, Yin Hong Lo, Emmanuel F Drabo, Guiding vaccine policy for chikungunya in Brazil: a cost-effectiveness analysis of live-attenuated versus recombinant chikungunya vaccines in Brazilian adults ≥18 years, BMJ Public Health, 10.1136/bmjph-2025-003794, 4, 2, (e003794), (2026).
- Ramona Maruster, Michael Bornstein, Pedram Sendi, Discounting Practices in Cost-Effectiveness Analyses in Dentistry: A Systematic Review of Studies Published After 2020, ClinicoEconomics and Outcomes Research, 10.2147/CEOR.S600837, Volume 18, (1-15), (2026).
- Wei Du, Chun-mei Gao, Yong Li, Ping Fu, Exploring the cost-effectiveness and optimization strategies of nursing caring for children and older adults: a perspective, Frontiers in Public Health, 10.3389/fpubh.2026.1769664, 14, (2026).
- Jonathan Briody, Ian S. Miller, James F. O’Mahony, Lesley Tilson, Alice C. O’Farrell, Qiushi Chen, Verena Murphy, Orla Casey, Nadine Schulte, Matthias P. Ebert, Jochen H. M. Prehn, Diether Lambrechts, Bauke Ylstra, Rodrigo Dienstmann, Annette T. Byrne, Kathleen Bennett, Bevacizumab for Metastatic Colorectal Cancer with Chromosomal Instability: Cost-Effectiveness Analysis for a Novel Precision Treatment Approach in Germany, Ireland and Spain, PharmacoEconomics, 10.1007/s40273-025-01585-x, 44, 3, (359-374), (2026).
- See more