National burden of achondroplasia: an analysis of the National Inpatient and Nationwide Ambulatory Surgery Samples
Publication: Journal of Comparative Effectiveness Research
Abstract
Background: To estimate the cost of US hospital admissions and outpatient surgeries associated with achondroplasia. Materials & methods: Using 2017 data from nationally representative databases, this study identifies hospital admissions and outpatient encounters with an achondroplasia diagnosis. Descriptive measures are reported. Results: There were 1985 achondroplasia admissions nationwide. The most frequent admissions were neonatal care (33.7%) in children and musculoskeletal (22.7%) in adults. Average hospital length of stay was 6.8 days, 2.2 days longer than the US mean. Total mean inpatient costs were US$19,959, $7789 greater than the US mean. In the outpatient setting, children 5–14 years accounted for 56.9% of procedures. Conclusion: Achondroplasia is a serious condition with a wide range of lifelong complications frequently requiring hospitalization and surgical intervention.
Achondroplasia is the most common form of skeletal dysplasia, with an estimated prevalence of approximately 1 in 25,000 individuals in North America [1,2]. The condition results from mutations of the FGFR3 gene, a negative regulator of bone growth, which results in the underdevelopment and shortening of the long bones formed by endochondral ossification [3]. Achondroplasia causes impaired bone development throughout the body, resulting in reduced growth velocity, severely reduced height and disproportionality (including shortened proximal limbs) [3–5]. Impaired endochondral ossification leads to a variety of serious orthopedic, neurological, respiratory and otolaryngologic complications [3,4,6–8] and results in increased mortality [9,10]. Common manifestations include sleep apnea, recurrent otitis media, hearing loss and resulting speech delay, chronic pain and spinal complications (e.g., stenosis, compression, kyphosis) [2,9–17].
Patients often require multiple surgeries over their lifetimes [2,4,6–8,18–20]. Infants may require foramen magnum decompression or hydrocephalus-related surgery (e.g., ventriculoperitoneal shunt) [3,5]. In children, tympanostomy tubes, tonsillectomy, adenoidectomy, foramen magnum decompression and procedures to address bowed legs are commonly performed, with procedures to address spinal stenosis or kyphosis becoming more common later in life. Beyond the high costs and negative impact on quality of life caused by these surgeries, surgery itself is riskier due to anatomic variations associated with achondroplasia [21–23]. The first pharmacological treatments for achondroplasia were approved in late 2021 [24].
Some studies have examined surgical interventions and associated complications in achondroplasia [4,18–20,25–27], but there are no national estimates of the numbers of hospitalizations or types of surgeries in this population in the USA. Spinal decompression and other major procedures require inpatient admissions. Other common surgeries, like tympanostomy tubes, are done in the outpatient setting. Therefore, to describe the burden of hospitalization and surgery in achondroplasia, we conducted a retrospective analysis using the most recent data from the National (Nationwide) Inpatient Sample (NIS) and the Nationwide Ambulatory Surgery Sample (NASS). These two databases are, respectively, the largest source of data on hospitalizations in the USA and the largest single source of data on ambulatory procedures. Recognizing that the reasons for hospitalization and types of procedures differ for adults and children, we analyzed these groups separately.
Materials & methods
Study design & data sources
This retrospective analysis was conducted using 2017 data from two separate data sources, each containing different types of data. Specifically, we used data from NIS and NASS. Both databases are part of the Healthcare Cost Utilization Project (HCUP) and developed through a federal-state-industry partnership sponsored by the Agency for Healthcare Research and Quality [28]. All data used in this study were de-identified and the study did not require institutional review board approval or patient consent.
National (Nationwide) Inpatient Sample
NIS is the largest publicly available all-payer inpatient healthcare database in the USA. Each NIS observation represents a unique discharge and overall, NIS represents a 20% stratified sample of all discharges in the USA. The 48 states participating in the 2017 NIS were geographically dispersed and accounted for 97% of the total US resident population and 96% of discharges from US community hospitals [29]. Unweighted, NIS contains data from >7 million hospital stays each year. The database is specifically designed to allow the calculation of national estimates. Using discharge weights provided by HCUP, each NIS discharge can be weighted to represent a national estimate. With this method, for each year of data, the sum of the discharge weights equals the total number of hospital discharges in the hospital universe for that year. HCUP calculates the discharge weights for NIS data by first stratifying NIS hospitals on the same variables (census division, urban/rural location, teaching status, bed size and ownership) that are used to create the sample. The weight is then computed for each stratum by dividing the number of universe discharges in that stratum by the number of NIS discharges in the stratum [30,31]. More detail on NIS and the weighting approach used is available at www.hcup-us.ahrq.gov/nisoverview.jsp#about. In all NIS analyses, the unit of analysis is the discharge, not the patient and a patient discharged more than once would be counted more than once. The database does not contain identifiers that can be used to track patients across multiple hospitalizations. For simplicity, we use the term ‘patient’ and ‘discharge’ interchangeably when referring to results from NIS.
Nationwide Ambulatory Surgery Sample
NASS is the largest all-payer, national ambulatory/outpatient surgery database in the USA. The 33 states that participated in the 2017 NASS were geographically dispersed and accounted for 82% of the total US resident population, an estimated 63% sample of the universe of hospital-owned facilities and an estimated 72% sample of the universe of ambulatory surgery encounters [32]. Unweighted, the 2017 sample contains data from approximately 9.9 million ambulatory surgical procedures. Like NIS, NASS is designed to allow the calculation of national estimates. HCUP assigns each encounter in NASS a weight, computed as the ratio of the number of universe ambulatory surgery encounters within each stratum to the number of ambulatory surgery encounters from sample hospitals selected for NASS. The database thus represents a weighted total of 13.7 million procedures. NASS is organized at the procedure level, with each observation representing a unique encounter. No uniform patient identifier is available that would allow a patient-level analysis to identify individuals with more than one ambulatory surgery encounter [32]. For the purposes of this study, we use the term ‘patient’ and ‘encounter’ interchangeably when referring to results from NASS.
Patient identification
In both databases, patients with achondroplasia were identified using the International Classification of Disease, 10th Revision, Clinical Modification (ICD-10-CM) code Q77.4. This is the diagnosis code for achondroplasia, in addition to the more uncommon conditions hypochondroplasia and osteosclerosis congenita. In the current study, we included all hospital discharges recorded in the 2017 NIS with a discharge diagnosis of Q77.4 in any position and all outpatient encounters in the 2017 NASS with a diagnosis of Q77.4.
Measures
For NIS, reported measures include patient demographics (age, gender, race) hospital characteristics (region, bed size [categorized as small, medium or large, depending on the type of hospital and region], urban/teaching status), payer type, diagnoses, procedures, length of stay (LOS) and total charges. Charges for a particular discharge represent the amount that hospitals bill, rather than the actual expenses incurred in the provision of services. Only total hospital charges are included in NIS. Total charges do not include professional fees [28]. To convert hospital charges to costs, we used the hospital-specific cost-to-charge ratio files, which are provided by HCUP based on data collected from the Centers for Medicare and Medicaid Services [33]. Neither the charges reported by NIS nor the calculated total cost can be divided into component parts (e.g., surgery or intensive care unit). We considered the entire hospitalization cost as being related to surgery if the surgery of interest was listed as the principal procedure. Cost and LOS were also reported categorized into the 23 organ-system major diagnostic categories (MDCs) defined by Centers for Medicare and Medicaid Services [34].
For NASS, reported measures include patient demographics (age, gender), surgical procedures performed, payer, affiliated hospital characteristics (region, bed size [categorized as <100, 100–299 and ≥300], urban/teaching status) and total charges [35]. The total charge for a case includes only the facility charge, not physician bills nor charges incurred outside of the ambulatory surgery setting. Reported charges represent billed amounts, not expenses incurred. The actual facility cost for each outpatient case in NASS was estimated using the hospital outpatient prospective payment system [36]. The hospital outpatient prospective payment system final rule cost statistical tables report mean cost values for each Current Procedural Terminology (CPT) code [37]. We used these tables to estimate the cost for each encounter. When more than one CPT code was entered for a single encounter, the code with the highest cost was used to determine the total cost for the encounter. Costs were reported grouped into broad clinical categories using CPT codes.
Statistical analysis
The unit of analysis was hospitalization (NIS) or outpatient procedure encounter (NASS). Descriptive statistics, including means, 95% CIs, relative frequencies and percentages were reported. Only weighted results were reported. Cost and LOS outcomes for each MDC were compared with HCUP national mean values. These national values were estimated with a tool provided by HCUP [38]. Results were reported both overall and stratified by age into children (<18 years old) and adults (≥18 years old). Per HCUP policy, cells with n <11 are not reported. All data transformations and statistical analyses were performed using SAS© version 9.4.
Results
National (Nationwide) Inpatient Sample
In 2017, there were 1985 hospital admissions of patients with achondroplasia in the USA. The mean (95% CI) age for all admissions was 26.8 (24.0–29.6) years (Table 1 ). The majority of hospitals were large, urban and teaching hospitals, with large bed size (Table 2). Considering both adults and children, the mean LOS was 6.8 (5.7–8.0) days and total mean inpatient costs were US$19,959 ($16,801–$23,118) for an overall inpatient cost of US$39,618,615. Both LOS and total costs were higher than the national average (4.6 days and US$12,170, respectively) (Figure 1).
| Adults | Children | All | |
|---|---|---|---|
| Weighted no. of admissions | 1080 | 905 | 1985 |
| Age, mean (95% CI) | 45.9 (43.3–48.5) | 4.0 (3.0–4.9) | 26.8 (24.0–29.6) |
| Median (min:max) | 43 (18:87) | 1 (0:17) | 22 (0:87) |
| Age group, % (95% CI) | |||
| 0–4 | n/a | 69.1 (61.4–76.8) | 31.5 (26.5–36.5) |
| <1 | n/a | 48.1 (39.7–56.5) | 21.9 (17.6–26.2) |
| 1–4 | n/a | 21.0 (15.0–27.0) | 9.6 (6.5–12.7) |
| 5–14 | n/a | 22.7 (16.2–29.1) | 3.8 (1.5–6.0) |
| 15–17 | n/a | 8.3 (3.5–13.1) | 14.1 (10.5–17.7) |
| 18–30 | 25.9 (19.9–32.0) | n/a | 16.6 (12.9–20.4) |
| 31–49 | 30.6 (24.4–36.7) | n/a | 10.3 (7.0–13.7) |
| 50–64 | 25.5 (19.3–31.6) | n/a | 13.9 (10.1–17.6) |
| 65+ | 18.1 (12.5–23.6) | n/a | 9.8 (6.7–13.0) |
| Female, % (95% CI) | 62.5 (55.7–69.3) | 47.5 (39.5–55.5) | 55.7 (50.5–60.8) |
| Race, % (95% CI) | |||
| White | 55.6 (48.3–62.8) | 48.1 (39.6–56.5) | 52.1 (46.6–57.7) |
| Black | 19.4 (13.8–25.1) | 13.3 (7.9–18.6) | 16.6 (12.6–20.6) |
| Hispanic | 12.0 (6.9–17.1) | 16.0 (10.0–22.1) | 13.9 (9.8–17.9) |
| Other | 6.5 (3.0–9.9) | 15.5 (9.3–21.6) | 10.6 (7.1–14.0) |
| Missing | 6.5 (2.1–10.9) | 7.2 (2.7–11.7) | 6.8 (3.7–9.9) |
| Primary payer, % (95% CI) | |||
| Medicare | 45.4 (38.6–52.2) | 0.6 (0.0–1.6) | 24.9 (20.4–29.5) |
| Medicaid | 24.5 (18.8–30.3) | 49.7 (41.6–57.8) | 36.0 (30.8–41.3) |
| Private (including HMO) | 25.9 (20.0–31.9) | 43.6 (35.5–51.8) | 34.0 (28.8–39.2) |
| Self-pay | 2.8 (0.6–5.0) | 1.7 (0.0–3.5) | 2.3 (0.8–3.7) |
| Missing/No charge/Other | 1.4 (0.0–3.0) | 4.4 (1.5–7.4) | 2.8 (1.2–4.4) |
HMO: Health maintenance organization.
| Adults | Children | All | |
|---|---|---|---|
| Weighted no. of admissions | 1080 | 905 | 1985 |
| Region of hospital, % (95% CI) | |||
| Northeast | 18.1 (13.0–23.1) | 13.8 (8.3–19.4) | 16.1 (12.4–19.9) |
| Midwest | 30.6 (23.3–37.8) | 18.2 (11.4–25.1) | 24.9 (19.8–30.1) |
| South | 31.5 (24.3–38.6) | 38.1 (29.3–46.9) | 34.5 (28.8–40.3) |
| West | 19.9 (14.1–25.7) | 29.8 (20.6–39.0) | 24.4 (19.0–29.9) |
| Urban hospital, % (95% CI) | 95.4 (92.3–98.4) | 97.2 (94.8–99.6) | 96.2 (94.3–98.2) |
| Teaching hospital, % (95% CI) | 80.1 (74.6–85.6) | 88.4 (83.0–93.7) | 83.9 (80.0–87.8) |
| Bed size of hospital, % (95% CI) | |||
| Small | 19.4 (13.4–25.5) | 18.2 (11.2–25.3) | 18.9 (14.1–23.7) |
| Medium | 19.0 (13.2–24.8) | 24.3 (16.5–32.1) | 21.4 (16.6–26.2) |
| Large | 61.6 (54.3–68.9) | 57.5 (48.4–66.5) | 59.7 (53.8–65.6) |
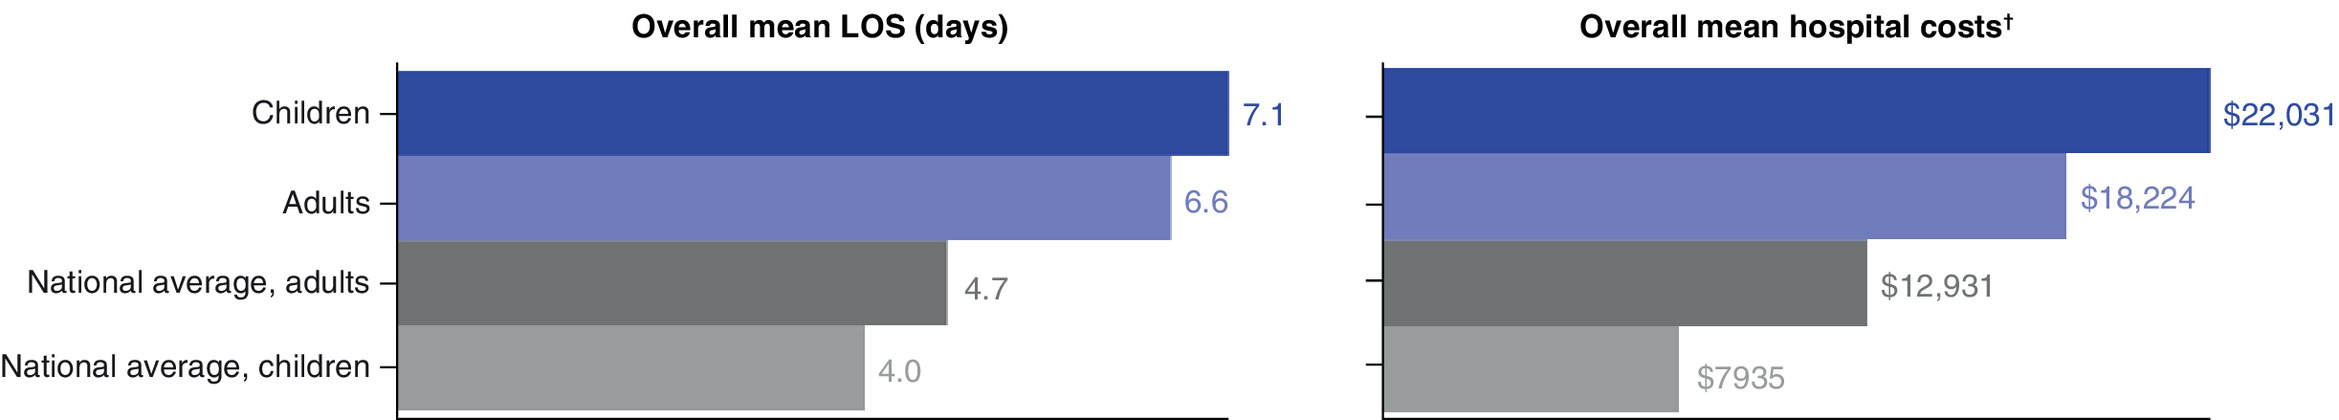
Figure 1. Mean length of stay and hospital costs† for patients admitted with achondroplasia compared with national average‡.
†Physician costs were not included.
‡National average based on Healthcare Cost and Utilization Project values.
LOS: Length of stay.
Considering children separately, of the 1985 admissions for achondroplasia, 905 (45.6%) were of children (<18 years old). The mean age of children admitted as inpatients was 4.0 (3.0–4.9) years. Medicaid was the primary payer for 49.7% (41.6%–57.8%) (Table 1). The mean LOS for all admitted children was 7.1 (5.0–9.2) days and mean total costs were US$22,031 ($16,311–$27,752), both higher than the national average (Figure 1). The most frequent MDC comprised conditions originating in the perinatal period (33.7% of discharges), followed by musculoskeletal (21.0%), respiratory (18.2%), nervous system (10.5%), and ear, nose and throat (6.1%) disorders, with other MDCs each making up less than 5% of discharges. The mean LOS for conditions originating in the perinatal period was 11.6 (6.2–16.9) days, compared with a national average of 3.8 days and the mean cost was US$18,862 ($7117–$30,607), compared with a national average of US$5153 (Figure 2). For the other diagnostic categories, the mean total hospital costs ranged from US$13,302 ($8081–$18,522) for diseases and disorders of the nervous system to US$31,010 ($22,694–$39,327) for disorders of the musculoskeletal system and connective tissue. The cost for respiratory- and musculoskeletal-related admissions was substantially higher than the national average (Figure 2).

Figure 2. Mean ength of stay and hospital costs† in children admitted with achondroplasia compared with national average‡ by major diagnostic category§, n (%).
†Physician costs were not included.
‡National average based on Healthcare Cost and Utilization Project values.
§Categories with weighted % ≥5%.
ACH: Achondroplasia; LOS: Length of stay.
Adults comprised the remaining 1080 of the 1985 (54.4%) admissions and their mean age was 45.9 (43.3–48.5) years. Medicare was the primary payer for 45.4% (38.6%–52.2%) of adults (Table 1). The mean LOS was 6.6 (5.5–7.7) and total mean inpatient costs were US$18,224 ($15,157–$21,292) for adults, both higher than the national average (Figure 1). The most frequent diagnostic category comprised disorders of the musculoskeletal system and connective tissue (22.7% of discharges), followed by respiratory (12.0%); infectious and parasitic diseases (10.2%); pregnancy, childbirth and puerperium (9.7%); nervous system (7.9%); kidney and urinary tract (7.4%); digestive (6.0%); and circulatory (5.1%) disorders, with other MDCs each making up less than 5% of discharges. Inpatients with the MDC of musculoskeletal and connective tissue disorders had a mean LOS of 6.3 (4.1–8.5) days, compared with the national average of 3.9 for this category (Figure 3). This diagnostic category was also the most expensive with a mean cost of US$27,874 ($20,962–$34,787) compared with the national average cost of US$17,700. Achondroplasia patients with nervous system disorders had a mean hospital cost of US$23,161 ($11,488–$34,833) and LOS of 9.1 (5.0–13.2) days, compared with the national average of US$15,403 and 5.7 days. Those with diseases of the circulatory system had a mean cost of US$22,606 ($12,228–$32,983) and LOS of 7.2 (4.7–9.7) compared with the national average US$17,059 and 4.7 days. Achondroplasia patients with respiratory system disorders had a mean hospital cost of US$19,340 ($7266–$31,415) and LOS of 8.3 (2.3–14.4) compared with the national average of US$12,081 and 5.0 days. Mean hospital costs were higher than national averages for all remaining diagnostic groups except diseases and disorders of the digestive system (Figure 3.)

Figure 3. Mean length of stay and hospital costs† in adults admitted with achondroplasia compared with national average‡ by major diagnostic category§, n (%).
†Physician costs were not included.
‡National average based on Healthcare Cost and Utilization Project values.
§Categories with weighted % ≥5%.
ACH: Achondroplasia; LOS: Length of stay.
Nationwide Ambulatory Surgery Sample
In 2017, there were 532 outpatient encounters for patients with achondroplasia in the hospital-affiliated ambulatory surgery centers represented by NASS. The mean age for all encounters was 14.0 (12.0–15.9) years. Affiliated hospitals were mainly large institutions with 300+ beds (Tables 3 & 4). The total mean costs were US$3131 ($2853–$3410) (not shown).
| Adults | Children | All | |
|---|---|---|---|
| Weighted no. of encounters | 123 | 410 | 532 |
| Age, mean (95% CI) | 38.0 (33.9–42.1) | 6.8 (6.1–7.4) | 14.0 (12.0–15.9) |
| Median (min:max) | 34 (18:87) | 6 (0:17) | 9 (0:87) |
| Age group, % (95% CI) | |||
| 0–4 | n/a | 37.3 (30.3–44.4) | 28.7 (22.9–34.5) |
| 5–14 | n/a | 56.9 (50.0–63.9) | 43.8 (37.6–50.0) |
| 15–17 | n/a | 5.8 (2.9–8.6) | 4.4 (2.2–6.6) |
| 18–30 | 45.5 (33.1–57.8) | n/a | 10.5 (7.0–14.0) |
| 31–49 | 26.7 (16.4–37.0) | n/a | 6.2 (3.3–9.1) |
| 50–64 | 18.9 (10.7–27.2) | n/a | 4.4 (2.2–6.5) |
| 65+ | 8.8 (3.1–14.5) | n/a | 2.0 (0.7–3.4) |
| Female, % (95% CI) | 64.7 (54.3–75.1) | 46.7 (41.1–52.3) | 50.8 (45.9–55.8) |
| Primary payer, % (95% CI) | |||
| Medicare | 23.1 (14.0–32.2) | 1.1 (0.0–2.4) | 6.2 (3.6–8.8) |
| Medicaid | 31.3 (19.9–42.7) | 36.3 (29.0–43.5) | 35.1 (28.7–41.5) |
| Private (including HMO) | 40.7 (28.5–52.9) | 57.8 (50.5–65.2) | 53.9 (47.0–60.8) |
| Self-pay | 2.2 (0.0–5.3) | 0.4 (0.0–1.2) | 0.8 (0.0–1.7) |
| Missing/No charge/Other | 2.6 (0.0–6.3) | 4.4 (1.9–6.8) | 4.0 (1.9–6.1) |
HMO: Health maintenance organization.
| Adults | Children | All | |
|---|---|---|---|
| Weighted no. of encounters | 123 | 410 | 532 |
| Region of hospital†, % (95% CI) | |||
| Northeast | 11.8 (5.1–18.5) | 11.5 (6.3–16.7) | 11.6 (7.1–16.0) |
| Midwest | 25.5 (16.6–34.4) | 22.6 (12.3–33.0) | 23.3 (14.6–31.9) |
| South | 41.8 (29.5–54.2) | 39.2 (26.7–51.6) | 39.8 (29.1–50.5) |
| West | 20.8 (11.3–30.3) | 26.7 (15.8–37.7) | 25.3 (15.9–34.8) |
| Urban hospital,† % (95% CI) | 92.4 (85.3–99.5) | 98.4 (96.5–100.0) | 97.0 (94.7–99.3) |
| Teaching hospital,† % (95% CI) | 76.9 (66.9–86.9) | 95.5 (92.4–98.5) | 91.2 (87.5–94.8) |
| Bed size of hospital†, % (95% CI) | |||
| Small (<100 beds) | 12.1 (3.7–20.6) | 2.8 (0.0–6.1) | 5.0 (1.6–8.4) |
| Medium (100–299 beds) | 31.5 (20.5–42.5) | 22.2 (12.9–31.4) | 24.3 (16.3–32.3) |
| Large (300+ beds) | 56.3 (44.4–68.2) | 75.0 (65.4–84.6) | 70.7 (62.1–79.3) |
†
Hospital which owns the outpatient surgical center.
Of 532 outpatient encounters, 410 (77.1%) were for children. The mean age for children seen in ambulatory surgery centers was 6.8 (6.1–7.4) years and 56.9% (50.0%–63.9%) of encounters were for children between 5 and 14 years old. Private (including health management organization) insurance was the primary payer for 57.8% (50.5%–65.2%) of these encounters (Table 3). The mean cost was US$2806 ($2503–$3109). Nearly all (96.5%) procedures were ear, nose, and throat (ENT) (78.5%) or orthopedic (18.0%) (Figure 4A).

Figure 4. Ambulatory surgeries with a diagnosis of achondroplasia by diagnostic category (%) - National Ambulatory Surgery Sample.
(A) Ambulatory surgeries in children with a diagnosis of ACH by diagnostic category (%) – National Ambulatory Surgery Sample. (B) Ambulatory surgeries in adults with a diagnosis of ACH by diagnostic category (%) – National Ambulatory Surgery Sample.
ACH: Achondroplasia; ENT: Ear, nose and throat; Ob/gyn: Obstetrics/gynecology; Ortho: Orthopedics.
The remaining 123 (23.1%) encounters were for adults. Private (including health management organization) insurance was the primary payer for adults (40.7% [28.5%–52.9%]) (Table 3). The mean cost for adults was US$4217 ($3545–$4889). The most common outpatient procedures among adults were orthopedic (27.1%) (Figure 4B).
Discussion
Patients with achondroplasia experience a variety of serious medical complications that may require a variety of surgical interventions over their lifetimes. This is the first nationally representative study to report hospital and outpatient surgical utilization and costs in achondroplasia. We found that, in a typical year, about 2000 people are admitted to US hospitals with a diagnosis of achondroplasia at a cost of approximately US$40 million. The average achondroplasia hospital admission is almost US$8000 more expensive and lasts 2 days longer than the national average admission.
Disease manifestations vary over a patient's lifetime. Sudden death in infants has a reported rate of approximately 7% [39] and this increased mortality has been attributed to foramen magnum stenosis. In children included in the current study, admissions for musculoskeletal conditions comprised a large proportion of all admissions and had the highest costs. ENT procedures were the most common reason for outpatient encounters among children. Upper airway and otologic disease often require interventions to treat upper airway obstruction and conductive hearing loss and associated obstructive sleep apnea and hearing loss [40], both conditions that can result in a reduction in daily function and learning.
Musculoskeletal conditions were the most common reason for admission among adults and these admissions had the highest costs. This is consistent with reports that in adults with achondroplasia, chronic back pain has a prevalence of 70% [14]. As a corollary, physical function diminishes with age in adults with achondroplasia and adults with achondroplasia report significantly lower physical and mental well-being [41].
Prior US studies using real-world data in this population have focused primarily on establishing the high rate of comorbidities and complications [17], or examining the impact of specific surgical intervention on outcomes [42–44]. There is limited literature estimating the number and frequency of hospitalizations and surgeries in patients with achondroplasia. In the largest multicenter natural history study of achondroplasia (>1000 individuals over a 60-year period), Hoover-Fong et al. found that 81.1% of patients with achondroplasia had at least one surgery, with ENT surgeries being the most common category (55.5%) [27]. That study examined data from a limited group of specialized centers over multiple decades but is consistent with our findings from a more nationally representative sample. In a retrospective chart review of patients with confirmed achondroplasia treated at a single center in Canada, King et al. reported that 29 patients underwent 85 procedures over a period of 52 years [18]. Okenfuss et al. reviewed 114 patient medical records to examine the lifetime impact of achondroplasia [4,45] and found ENT procedures to be the most frequent surgery intervention [4,45]. A 2013 survey of 189 adults with skeletal dysplasia (106 with achondroplasia) found that 28% of participants had spinal fusion or laminectomy [15].
The advantages of using NIS for this analysis included the large sample size and discharge weights. These allowed us to calculate national estimates of cost and characterize admissions in patients with achondroplasia nationwide. There were 74 million children in the USA in 2017 [46]. Assuming an achondroplasia prevalence of between 0.36 and 0.60 per 10,000 [47], there would have been between 2700 and 4400 children with achondroplasia in the USA in 2017, for an annual hospitalization rate of about 0.2 to 0.34 per affected child. That same year, the general rate of hospitalization for children in the USA was 0.07 per person, suggesting children with achondroplasia are hospitalized at three- to five-times the annual rate of the background population. NIS contains information on all hospital stays, regardless of expected payer for the hospital stay. Furthermore, NIS includes Medicare Advantage patients, a population that is often missing from Medicare claims data but comprises more than 40% of Medicare beneficiaries [48].
Analyzing NASS allowed us to characterize outpatient procedures associated with achondroplasia. Unlike NIS, which is representative of all acute, nonfederal hospitals in the USA, NASS estimates are representative only of hospital-owned outpatient facilities. There is no comprehensive national data on other ambulatory surgery centers and these nonhospital affiliated centers may represent as many as 75% of all outpatient surgery centers. As these other centers likely differ systematically from those that are included, simply ‘upweighting’ the encounters in NASS would produce an inaccurate estimate. Nonetheless, we feel these estimates are worth reporting, as they represent a much more diverse sample than reported in other published studies.
This study had other limitations. First, patient identification in both datasets was based on ICD-10-CM codes, not clinical evaluation. The ICD-10-CM diagnosis code for achondroplasia is also used for hypochondroplasia and osteosclerosis congenita. No published estimate for the prevalence of hypochondroplasia is available in the literature; one source suggests it “may approach the prevalence of achondroplasia” [49]. However, hypochondroplasia is milder in clinical presentation and less likely to result in hospitalization than achondroplasia [49]. Unintended inclusion of hypochondroplasia cases may thus lead us to underestimate the burden of hospitalizations in achondroplasia. Furthermore, osteosclerotic dysplasia is much less common than either achondroplasia or hypochondroplasia [50]. Second, the databases contain discharge- or encounter-level data, with no way to track individuals over multiple episodes of care (e.g., we could not identify initial vs revision surgeries). Third, both NIS and NASS report charges and we used these to estimate cost. Had we reported charges, the dollar amount of all estimates would have been substantially higher. Physician costs were not included in any of our estimates; had they been, our reported costs would have been higher. The data do not allow us to report the costs by component of care (e.g., surgery, intensive care unit stay). We therefore categorized the entire hospitalization cost as being related to surgery if the surgery of interest was listed as the principal procedure.
Finally, people with achondroplasia typically see a myriad of specialists for various disease-related complications throughout their lives. There are many other types of healthcare encounters (office visits, therapy sessions, medications) that are not captured in hospital databases. Therefore, the costs estimated in this study only reflect only a portion of the total cost of care.
We found no research directly estimating the ratio of outpatient and inpatient cost for achondroplasia, but in general, individuals with chronic conditions incur about a third of their healthcare costs in the inpatient setting, which would be consistent with an overall cost of achondroplasia of approximately US$120 million per year [51]. Importantly, 60% of the costs observed in our study were paid by Medicare and Medicaid.
Conclusion
In conclusion, achondroplasia is associated with a wide range of complications frequently requiring hospitalization and surgical intervention. In 2017, the hospitalization cost alone was estimated to be US$40 million in the USA. The current research may help raise awareness of the burden of this condition and underline the need for effective therapies for achondroplasia. Further research is needed to verify our findings using different data sources and to comprehensively quantify the total cost of care to support policy makers, health system managers and other key stakeholders in resource planning. It would be particularly interesting to further explore cost differences between children and adults with achondroplasia and to identify potential subgroups of patients with especially high burden.
•
Patients with achondroplasia experience serious complications, which vary over their lifetimes and require a diverse group of surgical interventions.
•
This study used 2017 data from two nationally representative databases, the National (Nationwide) Inpatient Sample for inpatient hospitalization and the Nationwide Ambulatory Surgery Sample for outpatient surgery, to estimate the burden of surgery on children and adults with achondroplasia.
•
Overall, the mean hospital length of stay was 7.1 days for children and 6.6 days for adults with achondroplasia, both longer than the national average of 4.0 days for children and 4.7 days for adults.
•
Mean hospital cost was US$22,031 for children and $18,224 for adults with achondroplasia, both higher than the national average of US$7935 for children and $12,931 for adults.
•
Inpatient encounters for children and adults were commonly related to musculoskeletal problems, whereas outpatient encounters in children were commonly for ear, nose, and throat procedures.
•
The overall cost of inpatient hospitalization for achondroplasia alone (e.g., excluding all care outside of inpatient facilities) is estimated at US$40 million per year in the USA.
•
Additional research is needed to estimate the cost of outpatient care for achondroplasia.
Author contributions
E Chen and AA Larkin: Design of the work; interpretation of data; revising the work for important intellectual content; final approval. JT Yan: Design of the work; acquisition and interpretation of data; drafting and revising the work for important intellectual content; final approval. E Chang: Design of the work; acquisition and analysis of data; drafting and revising the work for important intellectual content; final approval. MS Broder: Design of the work; interpretation of data; drafting revising the work for important intellectual content; final approval. M Tarbox: Acquisition of data; drafting and revising the work for important intellectual content; final approval. KK White: Interpretation of data; drafting revising the work for important intellectual content; final approval.
Financial & competing interests disclosure
E Chang, MS Broder and MH Tarbox report other from BioMarin, during the conduct of the study; other from AbbVie, other from Akcea, other from ASPC, other from Amgen, other from AstraZeneca, other from BMS, other from Boston Scientific Corporation, other from Celgene, other from Eisai, other from Ethicon, other from GRAIL, other from Helsinn, other from Illumina, other from Innovation and Value Initiative, other from Ionis, other from Jazz, other from Kite, other from Novartis, other from Otsuka, other from Pathnostics, other from PhRMA, other from Prothena, other from Sage, other from Takeda, other from Verde Technologies, other from Genentech, Inc., other from Greenwich Biosciences, Inc., other from Mirum Pharmaceuticals, Inc., grants and other from Dompe US, Inc., other from Sanofi US Services, Inc., other from Sunovion Pharmaceuticals, Inc., outside the submitted work. T Yan reports other from BioMarin, during the conduct of the study; other from AbbVie, other from Akcea, other from ASPC, other from Amgen, other from AstraZeneca, other from BMS, other from Boston Scientific Corporation, other from Celgene, other from Eisai, other from Ethicon, other from GRAIL, other from Helsinn, other from Illumina, other from Innovation and Value Initiative, other from Ionis, other from Jazz, other from Kite, other from Novartis, other from Otsuka, other from Pathnostics, other from PhRMA, other from Prothena, other from Roche, other from Sage, other from Takeda, other from Verde Technologies, other from Genentech, Inc., other from Greenwich Biosciences, Inc., other from Mirum Pharmaceuticals, Inc., grants and other from Dompe US, Inc., other from Sanofi US Services, Inc., other from Sunovion Pharmaceuticals, Inc., outside the submitted work. E Chen and AA Larkin are employees of BioMarin. KK White reports grant support from BioMarin, Ultragenyx, Pfizer, Ascendis, consultation fees from BioMarin and royalties from UptoDate.com. The authors have no other relevant affiliations or financial involvement with any organization or entity with a financial interest in or financial conflict with the subject matter or materials discussed in the manuscript apart from those disclosed.
No writing assistance was utilized in the production of this manuscript.
Open access
This work is licensed under the Attribution-NonCommercial-NoDerivatives 4.0 Unported License. To view a copy of this license, visit http://creativecommons.org/licenses/by-nc-nd/4.0/
References
Papers of special note have been highlighted as: • of interest; •• of considerable interest
1.
Foreman PK, Kessel F, Hoorn R, Bosch J, Shediac R, Landis S. Birth prevalence of achondroplasia: a systematic literature review and meta‐analysis. Am. J. Med. Genet. A. 182(10), 2297–2316 (2020).
2.
Pauli RM. Achondroplasia: a comprehensive clinical review. Orphanet J. Rare Dis. 14(1), 1 (2019).
• This review provides a background on the healthcare needs of patients with achondroplasia, current management options for the disease including areas of controversy and the gaps in knowledge and available therapies.
3.
Shirley ED, Ain MC. Achondroplasia: manifestations and treatment. J. Am. Acad. Orthop. Surg. 17(4), 231–241 (2009).
4.
Okenfuss E, Moghaddam B, Avins AL. Natural history of achondroplasia: a retrospective review of longitudinal clinical data. Am. J. Med. Genet. A. 182(11), 2540–2551 (2020).
•• This analysis of electronic health records finds that achondroplasia has a significant lifetime impact on patients’ physical health, including the need for intervention beyond childhood.
5.
Horton WA, Hall JG, Hecht JT. Achondroplasia. Lancet 370(9582), 162–172 (2007).
6.
Kubota T, Adachi M, Kitaoka T et al. Clinical practice guidelines for achondroplasia*. Clin. Pediatr. Endocrinol. 29(1), 25–42 (2020).
7.
Unger S, Bonafé L, Gouze E. Current care and investigational therapies in achondroplasia. Curr. Osteoporos. Rep. 15(2), 53–60 (2017).
8.
Högler W, Ward LM. New developments in the management of achondroplasia. Wien. Med. Wochenschr. 1946 170(5–6), 104–111 (2020).
9.
Wright MJ, Irving MD. Clinical management of achondroplasia. Arch. Dis. Child. 97(2), 129–134 (2012).
10.
Ireland P, Pacey V, Zankl A, Edwards P, Johnson L, Savarirayan R. Optimal management of complications associated with achondroplasia. Appl. Clin. Genet. 7, 117 (2014).
11.
Afsharpaiman S, Saburi A, Waters KA. Respiratory difficulties and breathing disorders in achondroplasia. Paediatr. Respir. Rev. 14(4), 250–255 (2013).
12.
Hunter AG, Bankier A, Rogers JG, Sillence D, Scott CI. Medical complications of achondroplasia: a multicentre patient review. J. Med. Genet. 35(9), 705–712 (1998).
13.
Tunkel D, Alade Y, Kerbavaz R, Smith B, Rose-Hardison D, Hoover-Fong J. Hearing loss in skeletal dysplasia patients. Am. J. Med. Genet. A. 158A(7), 1551–1555 (2012).
14.
Alade Y, Tunkel D, Schulze K et al. Cross-sectional assessment of pain and physical function in skeletal dysplasia patients: cross-sectional assessment of pain and physical function in SD patients. Clin. Genet. 84(3), 237–243 (2013).
15.
Dhiman N, Albaghdadi A, Zogg CK et al. Factors associated with health-related quality of life (HRQOL) in adults with short stature skeletal dysplasias. Qual. Life Res. 26(5), 1337–1348 (2017).
16.
Jeong S-T, Song H-R, Keny SM, Telang SS, Suh S-W, Hong S-J. MRI study of the lumbar spine in achondroplasia: a morphometric analysis for the evaluation of stenosis of the canal. J. Bone Joint Surg. Br. 88-B(9), 1192–1196 (2006).
17.
Fredwall SO, Maanum G, Johansen H, Snekkevik H, Savarirayan R, Lidal IB. Current knowledge of medical complications in adults with achondroplasia: a scoping review. Clin. Genet. 97(1), 179–197 (2020).
• This article provides an overview of the medical complications, health characteristics and psychosocial issues in adults with achrondroplasia, as well as highlighting areas for additional research in this population.
18.
King JAJ, Vachhrajani S, Drake JM, Rutka JT. Neurosurgical implications of achondroplasia: a review. J. Neurosurg. Pediatr. 4(4), 297–306 (2009).
19.
Malcolm TL, Phan DL, Schwarzkopf R. Concomitant achondroplasia and developmental dysplasia of the hip. Arthroplasty Today 1(4), 111–115 (2015).
20.
White KK, Bober MB, Goldberg MJ et al. Best practice guidelines for management of spinal disorders in skeletal dysplasia. Orphanet J. Rare Dis. 15(1), 161 (2020).
21.
Sukhavasi A, O'Malley TJ, Maynes EJ et al. Cardiac interventions in patients with achondroplasia: a systematic review. J. Thorac. Dis. 12(3), 998–1006 (2020).
22.
Mikhael H, Vadivelu N, Braveman F. Safety of spinal anesthesia in a patient with achondroplasia for cesarean section. Curr. Drug Saf. 6(2), 130–131 (2011).
23.
Mayhew JF, Katz J, Miner M, Leiman B, Hall ID. Anaesthesia for the achondroplastic dwarf. Can. Anaesth. Soc. J. 33(2), 216–221 (1986).
24.
US FDA. FDA approves first drug to improve growth in children with most common form of dwarfism (2021). www.fda.gov/news-events/press-announcements/fda-approves-first-drug-improve-growth-children-most-common-form-dwarfism
25.
Ain MC, Abdullah MA, Ting BL et al. Progression of low back and lower extremity pain in a cohort of patients with achondroplasia. J. Neurosurg. Spine 13(3), 335–340 (2010).
26.
Nadel JL, Wilkinson DA, Garton HJL, Muraszko KM, Maher CO. Screening and surgery for foramen magnum stenosis in children with achondroplasia: a large, national database analysis. J. Neurosurg. Pediatr. 23(3), 374–380 (2019).
27.
Hoover-Fong JE, Alade AY, Hashmi SS et al. Achondroplasia natural history study (CLARITY): a multicenter retrospective cohort study of achondroplasia in the United States. Genet. Med. 23(8), 1498–1505 (2021).
•• This paper reports on the largest multicenter natural history study of achondroplasia, following a cohort established at four specialized centers over multiple decades. Rates of surgical intervention reported were consistent with our findings from a nationally representative sample.
28.
Healthcare Cost and Utilization Project (HCUP). HCUP NIS overview. Agency for Healthcare Research and Quality (2021). www.hcup-us.ahrq.gov/nisoverview.jsp
29.
Agency for Healthcare Research and Quality Healthcare Cost and Utilization Project (HCUP). Introduction to the HCUP National Inpatient Sample (NIS) 2017. Agency for Healthcare Research and Quality, MD, USA (2019).
30.
Houchens R, Ross D, Elixhauser A. Using the HCUP National Inpatient Sample to Estimate Trends. 2015. HCUP Methods Series Report # 2006-05 ONLINE. January 4, 2016. U.S. Agency for Healthcare Research and Quality. Available: www.hcup-us.ahrq.gov/reports/methods/methods.jsp
31.
Healthcare Cost and Utilization Project (HCUP). Producing national HCUP estimates (2018). www.hcup-us.ahrq.gov/tech_assist/nationalestimates/508_course/508course_2018.jsp#weighting
32.
Agency for Healthcare Research and Quality Healthcare Cost and Utilization Project (HCUP). Introduction to the HCUP National Ambulatory Surgery Sample (NASS) 2017. Agency for Healthcare Research and Quality, MD, USA (2020).
33.
Healthcare Cost and Utilization Project (HCUP). Cost-to-charge ratio files (2020). www.hcup-us.ahrq.gov/db/state/costtocharge.jsp
34.
Centers for Medicare and Medicaid Services. Design and development of the diagnosis related group (DRGs). In: ICD-10-CM/PCS MS-DRG v37.0 Defintions Manual. US Centers for Medicare and Medicaid Services, MD, USA (2019).
35.
Agency for Healthcare Research and Quality. Overview of the Nationwide Ambulatory Sample (NASS) (2020). www.hcup-us.ahrq.gov/nassoverview.jsp
36.
Best MJ, Aziz KT, McFarland EG, Anderson GF, Srikumaran U. Economic implications of decreased elective orthopaedic and musculoskeletal surgery volume during the coronavirus disease 2019 pandemic. Int. Orthop. 44, 221–2228 (2020).
37.
US Centers for Medicare andMedicaid Services. Hospital outpatient PPS (2020). www.cms.gov/Medicare/Medicare-Fee-for-Service-Payment/HospitalOutpatientPPS
38.
Agency for Healthcare Research and Quality. Free health care statistics (2020). https://hcupnet.ahrq.gov/#setup
39.
Simmons K, Hashmi SS, Scheuerle A, Canfield M, Hecht JT. Mortality in babies with achondroplasia: revisited. Infant mortality in achondroplasia. Birt. Defects Res. A. Clin. Mol. Teratol. 100(4), 247–249 (2014).
40.
On behalf of the Skeletal Dysplasia Management Consortium, Savarirayan R, Tunkel DE, Sterni LM et al. Best practice guidelines in managing the craniofacial aspects of skeletal dysplasia. Orphanet J. Rare Dis. 16(1), 31 (2021).
• This article offers best practice guidelines developed by a panel of experts using the RAND/University of California at Los Angeles modified Delphi method.
41.
Yonko EA, Emanuel JS, Carter EM, Raggio CL. Quality of life in adults with achondroplasia in the United States. Am. J. Med. Genet. A. 185(3), 695–701 (2021).
42.
Kashanian A, Chan J, Mukherjee D, Pressman BD, Krakow D, Danielpour M. Improvement in ventriculomegaly following cervicomedullary decompressive surgery in children with achondroplasia and foramen magnum stenosis. Am. J. Med. Genet. A. 182(8), 1896–1905 (2020).
43.
Booth KL, Levy DA, White DR, Meier JD, Pecha PP. Management of obstructive sleep apnea in children with achondroplasia: outcomes of surgical interventions. Int. J. Pediatr. Otorhinolaryngol. 138, 110332 (2020).
44.
Susarla SM, Mundinger GS, Kapadia H et al. Subcranial and orthognathic surgery for obstructive sleep apnea in achondroplasia. J. Craniomaxillofac. Surg. 45(12), 2028–2034 (2017).
45.
Okenfuss E, Avins A, Moghaddam B. Natural history of achondroplasia: a retrospective study of patients managed by a multispecialty program. This was a presentation at the CHMH Annual Clinical Genetics Meeting, Seattle, WA, USA (2-6 April 2019).
46.
United States Census Bureau. America’s Families and Living Arrangements: 2017 (2021). www.census.gov/data/tables/2017/demo/families/cps-2017.html
47.
Waller DK, Correa A, Vo TM et al. The population-based prevalence of achondroplasia and thanatophoric dysplasia in selected regions of the US. Am. J. Med. Genet. A. 146A(18), 2385–2389 (2008).
• This article provides an estimate of achondroplasia prevalence in the USA. We used this information to derive the hospitalization rate among children with achondroplasia and assessed this rate in the context of hospitalization rate observed in the general US population.
48.
Freed M, Fuglesten Biniek J, Damico A, Neuman T. Medicare advantage in 2021: enrollment update and key trends (2021). www.kff.org/ba73771/
49.
Bober MB, Bellus GA, Nikkel SM, Tiller GE. Hypochondroplasia. In: GeneRreviews® [Internet]. David B Everman, Ghayda M Mirzaa, Roberta A Pagon, Stephanie E Wallace (Eds). Molecular Genetics: Lora JH Bean and Karen W Gripp. Anne Amemiya, Genetic Counseling University of Washington, WA, USA (2020).
50.
Orphanet. Prevalence and incidence of rare diseases: bibliographic data (2021). www.orpha.net/consor/cgi-bin/Education_Home.php?lng=EN
51.
Buttorff C, Ruder T, Bauman M. Multiple Chronic Conditions in the United States. RAND Corporation, CA, USA (2017).
Information & Authors
Information
Published In
Pages: 1135 - 1146
PubMed: 36039778
Copyright
© 2022 The Authors. This work is licensed under the Attribution-NonCommercial-NoDerivatives 4.0 Unported License
History
Received: 14 October 2021
Accepted: 28 July 2022
Published online: 30 August 2022
Keywords:
Topics
Authors
Metrics & Citations
Metrics
Article Usage
Article usage data only available from February 2023. Historical article usage data, showing the number of article downloads, is available upon request.
Citations
How to Cite
National burden of achondroplasia: an analysis of the National Inpatient and Nationwide Ambulatory Surgery Samples. (2022) Journal of Comparative Effectiveness Research. DOI: 10.2217/cer-2021-0250
Export citation
Select the citation format you wish to export for this article or chapter.
Citing Literature
- Chengaxin Duan, Yang Liu, Xuefan Gu, Dandan Ai, Jiayin Zheng, Kun Zhao, Binyan Sui, Economic Burden and Health-Related Quality of Life Among Children With Achondroplasia in China: A Cross-Sectional Study, Value in Health Regional Issues, 10.1016/j.vhri.2025.101584, (101584), (2026).
- Pranav Abraham, Gandarvaka Miles, Natalia Petruski-Ivleva, Kalyani Hawaldar, Cemre Robinson, Kenneth I. Berger, Clinical burden and healthcare resource utilization associated with achondroplasia: a real-world observational, retrospective cohort study, Orphanet Journal of Rare Diseases, 10.1186/s13023-025-04072-w, 20, 1, (2025).
- Renuka Chintapalli, Atman Desai, Achondroplasia Status and Adverse Short-Term Postoperative Outcomes in Elective Spinal Decompression Surgery: A Propensity Score-Matched Case-Control Study, Journal of Clinical Neuroscience, 10.1016/j.jocn.2025.111064, 134, (111064), (2025).
- Nadia Merchant, Jose Alvir, Paulette Negron Ericksen, Jane Loftus, Jose Francisco Cara, Alison Slade, Michael P. Wajnrajch, Christine L. Baker, Clinical and economic burden of achondroplasia in the United States: results from a retrospective, observational study, Orphanet Journal of Rare Diseases, 10.1186/s13023-024-03268-w, 20, 1, (2025).
- Moira S. Cheung, Inês Alves, Patricia Carl-Innig, Deborah Eastwood, Mohamad Maghnie, Amaka Offiah, Dror Paley, Simone Riganti, Ravi Savarirayan, Marco Sessa, Bjoern Vogt, Klaus Mohnike, Meeting report from the 3rd ISCBH-ERN BOND Achondroplasia Workshop on Long Bone Pathology in Children with Achondroplasia, Salzburg, Austria 22nd June 2024, Bone, 10.1016/j.bone.2024.117268, 190, (117268), (2025).