Cost–effectiveness analysis of a resource-intensive approach versus minimally invasive strategy for high-risk transcatheter aortic valve replacement patients
Publication: Journal of Comparative Effectiveness Research
Abstract
Aortic stenosis has a high mortality rate in patients who do not receive aortic valve replacement. Previously, transcatheter aortic valve replacement (TAVR) was an intervention reserved for individuals deemed high-risk for surgery. Since that time, TAVR has increasingly been offered to lower risk patients, yet it is unclear whether TAVR will meet an acceptable cost–effectiveness threshold in this group. In this cost–effectiveness study, we employed a decision tree model with Monte Carlo probability sensitivity analysis to determine the incremental cost (in US$) per quality-adjusted life year (QALY) and life year (LY) of performing the TAVR procedure using the resource-intensive approach versus the minimally invasive strategy in high-risk surgical patients.
Symptomatic aortic stenosis (AS) is a disease with a high mortality rate in patients who do not receive an aortic valve replacement [1–3]. Literature estimates suggest that 3.4% of the population >75 years of age has aortic stenosis [4]. Nearly a decade ago, transcatheter aortic valve replacement (TAVR), formerly an intervention reserved for high-risk individuals with severe symptomatic AS, was found to be superior to medical management. More recently, the PARTNER 3 trial demonstrated TAVR superiority with regards to 30-day mortality, stroke rate, new onset atrial fibrillation, and hospital length of stay even in low-risk patients [5]. As TAVR is increasingly offered to lower risk surgical patients, it will become important to assess the cost–effectiveness of the procedure across discretely defined risk groups, as 12-month cumulative costs of TAVR remain ∼US$10,000 more than surgical aortic valve replacement (SAVR), chiefly attributable to device cost [6,7]. It is unclear whether TAVR will meet an acceptable cost–effectiveness threshold in lower risk groups, where the relative higher cost of the TAVR procedure compared with traditional SAVR may outweigh the cost savings associated with a shorter hospital stay and fewer post-operative complications [7].
Most medical centers performing TAVR have historically employed a resource-intensive approach (RIA) that usually includes endotracheal intubation with general anesthesia, bladder catheterization, central line placement, invasive hemodynamic monitoring, trans-esophageal echocardiography (TEE) and cardiothoracic (CT) surgical back-up [8,9]. More recently, many hospitals in Europe and the USA have adopted a leaner, minimally invasive strategy (MIS) to TAVR staffing in an effort to decrease resource utilization, procedural costs and hospital length of stay (LOS) [10,11]. The MIS involves local anesthesia, minimal conscious sedation, transthoracic echocardiography (TTE) and is performed in a catheterization lab versus the hybrid operating room used with the RIA [10–12]. Literature has shown MIS is associated with shorter post procedural length of stay, reduced costs and a success rate consistent with the RIA [10–12].
Although there are a myriad of staffing approaches to TAVR, there is no clear consensus on the best method to optimize cost and patient safety [13]. In this review, we performed a cost–effectiveness analysis of the MIS (excluding a cardiac anesthesiologist and direct cardiac surgery back-up) versus the resource-intensive staffing model for TAVR in the setting of the need for emergent cardiac surgery (ECS). The primary outcome of our model was the incremental cost–effectiveness ratio (ICER) [14,15]. The ICER is a normalizing ratio designed to represent the incremental cost of a healthcare intervention relative to additional benefits [16]. Mathematically, the ICER is the difference in costs between two interventions (ΔC) divided by the difference in effectiveness (ΔE) of two interventions.
The ICER does not indicate an absolute cost incurred by a hospital or institution, rather a theoretical cost necessary to achieve a given outcome versus an alternative intervention. Therefore, the ICER should inform healthcare policy decision makers about the efficient allocation of constrained healthcare resources [17].
Case study/methods
Model design & study population
We developed a probability decision tree model to assess the cost–effectiveness of MIS-TAVR versus RIA-TAVR (see Figure 1) [18]. Our underlying model variables (i.e. probabilities, health utilities and costs) are described below:
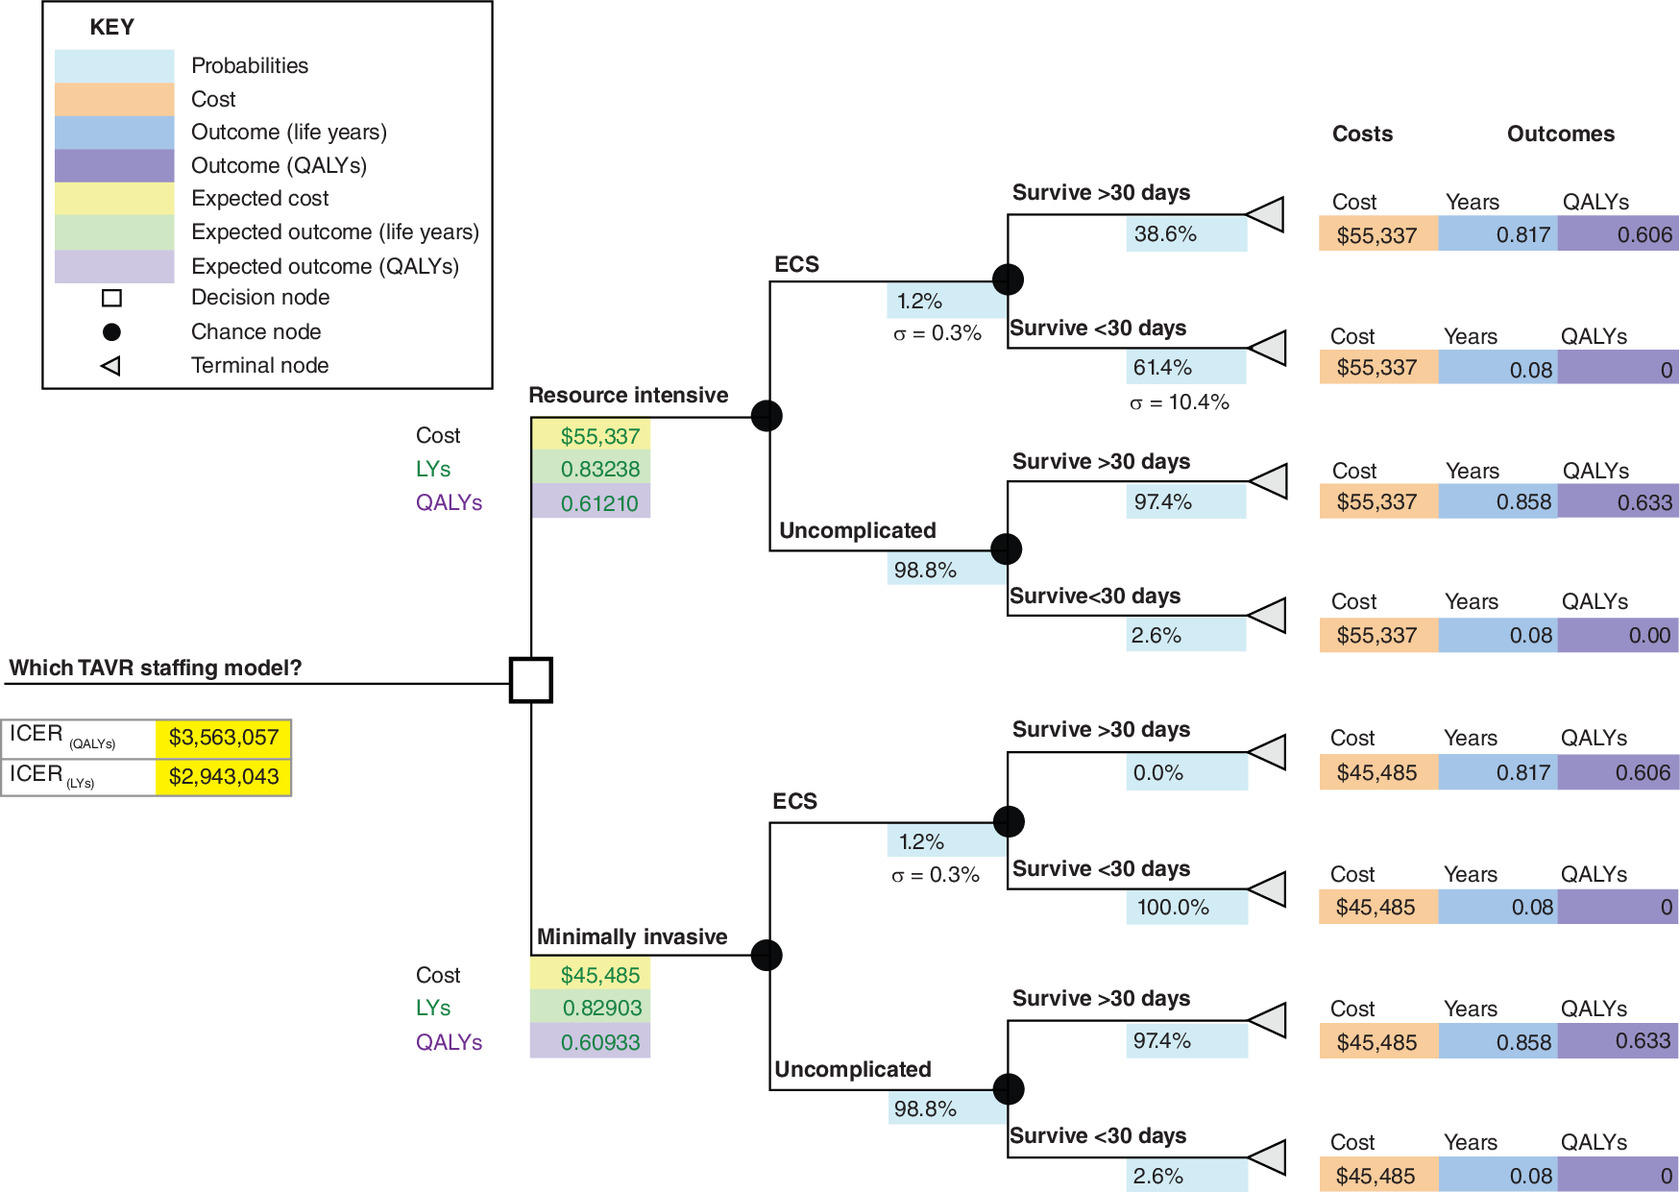
Figure 1. Decision tree model for transcatheter aortic valve replacement staffing approaches: expected value analysis.
ICER: Incremental cost–effectiveness ratio; LY: Life years QALY: Quality-adjusted life years; TAVR: Transcatheter aortic valve replacement.
Probabilities
The probabilities at the chance nodes in our decision tree are based on data from published studies (see Table 1). Studies contributing probability data to our model had a weighted mean logistic EuroScore of 23.8. Probabilities were based on the following key assumptions:
•
We calculated weighted average probabilities based on the number of study participants in each paper contributing data.
•
Studies contributing probability data contained transfemoral (TF) and transapical (TA) TAVR patients. We did not differentiate between access route when calculating our weighted probabilities as emergency cardiac surgery (ECS) conversion rates and 30-day mortality rates were similar between these two sub-groups in all studies [13,19–21].
•
The probability of survival >30 days after ECS with MIS excluding CT surgical back-up is unknown [21]. We assumed a survival probability of 0% for this scenario in our base case to be conservative; however, real survival rates are likely greater than zero.
•
The 30-day mortality rate for uncomplicated RIA and MIS cases was assumed to be 2.6% based on the PARTNER A trial [22].
| Study name | Author (year) | ECS conversion % | 30-day mortality % for patients undergoing ECS | Ref. | ||||||
|---|---|---|---|---|---|---|---|---|---|---|
| No. of participants | Xi = ECS conversion % | Wi = study weight | Xi + n†Wi + n = Xe = weighted ECS conversion % | No. of participants | Xii = 30-day mortality % | Wii = study weight | Xii + n†Wii + n = Xm = weighted 30-day mortality % | |||
| Emergent cardiac surgery during TAVI: a weighted meta-analysis of 9251 patients from 46 studies | Eggebrecht et al. (2013) | 9251 | 1.10 | 79.18 | 0.87 | 9251 | 67.10 | 76.49 | 51.32 | [19] |
| ECS during TF- and TA-TAVI: incidence, reasons, management, and outcome of 411 patients from a single center[] | Griese et al. (2013) | n/a† | n/a† | n/a† | n/a† | 411 | 35.00 | 3.40 | 1.19 | [13] |
| Outcome of patients after emergency conversion from TAVI to surgery | Hein et al. (2013) | 1975 | 1.20 | 16.90 | 0.20 | 1975 | 45.80 | 16.33 | 7.48 | [20] |
| Severe intraprocedural complications after transcatheter aortic valve implantation | Seiffert et al. (2013) | 458 | 2.80 | 3.92 | 0.11 | 458 | 38.50 | 3.79 | 1.46 | [21] |
| Totals‡ | 11,684 | 100.0 | 1.18 | 12,095 | 100 | 61.45 | ||||
| Weighted standard deviation§ | 0.33 | 10.40 | ||||||||
†
ECS in Griese et al. study was 4.9%. This was felt to be an outlier and therefore excluded from the weighted ECS conversion calculation.
‡
Totals calculated for Weighted ECS Conversion % and 30 day mortality % as follows: Weighted ECS conversion % = (w i*Xi) + (Wi + 1*Xi + 1) + (Wi + 2*Xi + 2) + (Wi + 3 * Xi + 3).
§
Example of Weighted Standard Deviation calculation as follows for ECS Conversion %: Weighted STDEV = SQRT[w i*(Xi – Xe)2 + Wi = 1 *(Xi + 1 - Xe)2 + Wi + 2* (Xi + 2 - Xe)2 + Wi + 3*(Xi + 3 – Xe)2].
ECS: Emergent cardiac surgery.
Health utilities
Health outcomes, life years (LYs) and quality-adjusted life years (QALYs) for TAVR patients were taken from a published cost–effectiveness analysis of the PARTNER A trial (see Table 2) [7]. We assumed all patients who survived <30 days accumulated 0.08 life years (30 days) and zero QALYs. The LYs and QALYs for TAVR patients undergoing ECS who survived >30 days were assumed to be the same as regular SAVR patients in the PARTNER A trial [7].
| Mean chance node probabilities† | Standard deviation | PSA distribution | Mean terminal node costs‡ | Standard deviation | PSA distribution | Mean terminal node life years§ | Standard deviation | PSA distribution | Mean terminal node QALYs§ | Standard deviation | PSA distribution | |
|---|---|---|---|---|---|---|---|---|---|---|---|---|
| Resource-intensive approach | ||||||||||||
| ECS conversion | 1.18% | 0.33% | Beta | |||||||||
| ECS survive >30 days | 38.55% | US$55,337 | US$22,587 | Gamma | 0.82 | 0.08 | Normal | 0.61 | 0.06 | Normal | ||
| ECS survive <30 days | 61.45% | 10.40% | Beta | US$55,337 | US$22,587 | Gamma | 0.08 | 0.01 | Normal | 0.00 | 0.00 | Normal |
| Uncomplicated | 98.82% | |||||||||||
| Uncomplicated survive >30 days | 97.41% | US$55,337 | US$22,587 | Gamma | 0.86 | 0.09 | Normal | 0.63 | 0.06 | Normal | ||
| Uncomplicated survive <30 days | 2.59% | 2.00% | Beta | US$55,337 | US$22,587 | Gamma | 0.08 | 0.01 | Normal | 0.00 | 0.00 | Normal |
| Minimally invasive strategy | ||||||||||||
| ECS conversion | 1.18% | 0.33% | Beta | |||||||||
| ECS survive >30 days | 0.00% | US$45,485 | US$14,397 | Gamma | 0.82 | 0.08 | Normal | 0.61 | 0.06 | Normal | ||
| ECS survive <30 days | 100.00% | US$45,485 | US$14,397 | Gamma | 0.08 | 0.01 | Normal | 0.00 | 0.00 | Normal | ||
| Uncomplicated | 98.82% | |||||||||||
| Uncomplicated survive >30 days | 97.41% | US$45,485 | US$14,397 | Gamma | 0.86 | 0.09 | Normal | 0.63 | 0.06 | Normal | ||
| Uncomplicated survive <30 days | 2.59% | 2.00% | Beta | US$45,485 | US$14,397 | Gamma | 0.08 | 0.01 | Normal | 0.00 | 0.00 | Normal |
†
Means and standard deviations for chance node probabilities calculated in Table 1.
‡
Means and standard deviations for terminal node costs from Babaliaros et al. 2017 [12].
§
Means and standard deviations for terminal node life years and QALYs from Reynolds et al. 2012.
ECS: Emergent cardiac surgery; PSA: Probability sensitivity analysis; QALY: Quality-adjusted life year.
Costs
Initial TAVR procedure hospitalization costs for the minimalist and resource-intensive approaches were determined from an outcomes and cost analysis study of TF-TAVR patients (see Table 2) [12]. Physician fees were not included in the model; therefore the cost difference was underestimated between the two staffing models in our analysis as more physicians were present during RIA-TAVR than MIS-TAVR.
Cost–effectiveness analysis
We computed the base case ICER using expected values from the two branches, MIS and RIA, of our decision tree. Expected values for costs and health utilities (i.e., life years and QALYs) were calculated by ‘rolling back’ the decision tree from right to left [23]. The final expected cost and health utility values were the sum of the products of the probability of events occurring and the outcomes (i.e., the health utilities and costs) of these events [23,24].
Next, the ICER was utilized to determine the cost–effectiveness of the RIA compared with the MIS, with C1 and E1 representing the cost and effect of the RIA, and C0 and E0 representing the cost and effect of the MIS.
Sensitivity analysis
We performed univariate sensitivity analyses of the key model variables to assess the relative impact of each variable on the model output (ICER). The key variables were manipulated while holding all other variables constant at their base values. See Table 3 for results of the univariate sensitivity analyses.
| ICER sensitivity to changes in 30-day mortality rates (survival <30 days) for ECS conversion with RIA | Base case -20% | Base case -10% | Base case | Base case +10% | Base case +20% |
|---|---|---|---|---|---|
| 30-day mortality rates for patients undergoing ECS with RIA | 41.45% | 51.45% | 61.45% | 71.45% | 81.45% |
| ICER (QALYs) | US$2,345,997 | US$2,829,191 | US$3,563,057 | US$4,810,981 | US$7,404,240 |
| ICER sensitivity to changes in 30-day mortality rates (survival <30 days) for ECS conversion with MIS | Base case -20% | Base case -15% | Base case -10% | Base case -5% | Base case |
|---|---|---|---|---|---|
| 30-day mortality rates for patients undergoing ECS with MIS | 80% | 85% | 90% | 95% | 100% |
| ICER (QALYs) | US$7,404,240 | US$5,832,340 | US$4,810,981 | US$4,094,034 | US$3,563,057 |
| ICER sensitivity to cost difference between MIS vs RIA staffing models | Base case -50% | Base case -25% | Base case | Base case +25% | Base case +50% |
|---|---|---|---|---|---|
| Absolute cost difference between RIA and MIS staffing approaches | US$4852 | US$7352 | US$9852 | US$12,352 | US$14,852 |
| ICER (QALYs) | US$1,754,766 | US$2,658,911 | US$3,563,057 | US$4,467,203 | US$5,371,348 |
†
Base case values in third column in sections i and iii and in fifth column in section ii.
ECS: Emergent cardiac surgery; ICER: Incremental cost–effectiveness ratio; MIS: Minimally invasive strategy; QALY: Quality-adjusted life year; RIA: Resource-intensive approach.
Next, we conducted a Monte Carlo Probability Sensitivity Analysis (PSA) to assess the effects of randomness on our model [25]. The Monte Carlo PSA involves assigning each model variable parameter inputs (mean and standard deviation) and an appropriate probability distribution [23]. We used the beta distribution for probabilities, the gamma distribution for costs, and the normal distribution for QALYs and life years (see Table 2) [24]. During each simulation of the model, random values for each variable are selected from the assigned probability distributions around the parameter inputs. We performed 5,000 simulation runs of our model (Figure 2A & B).
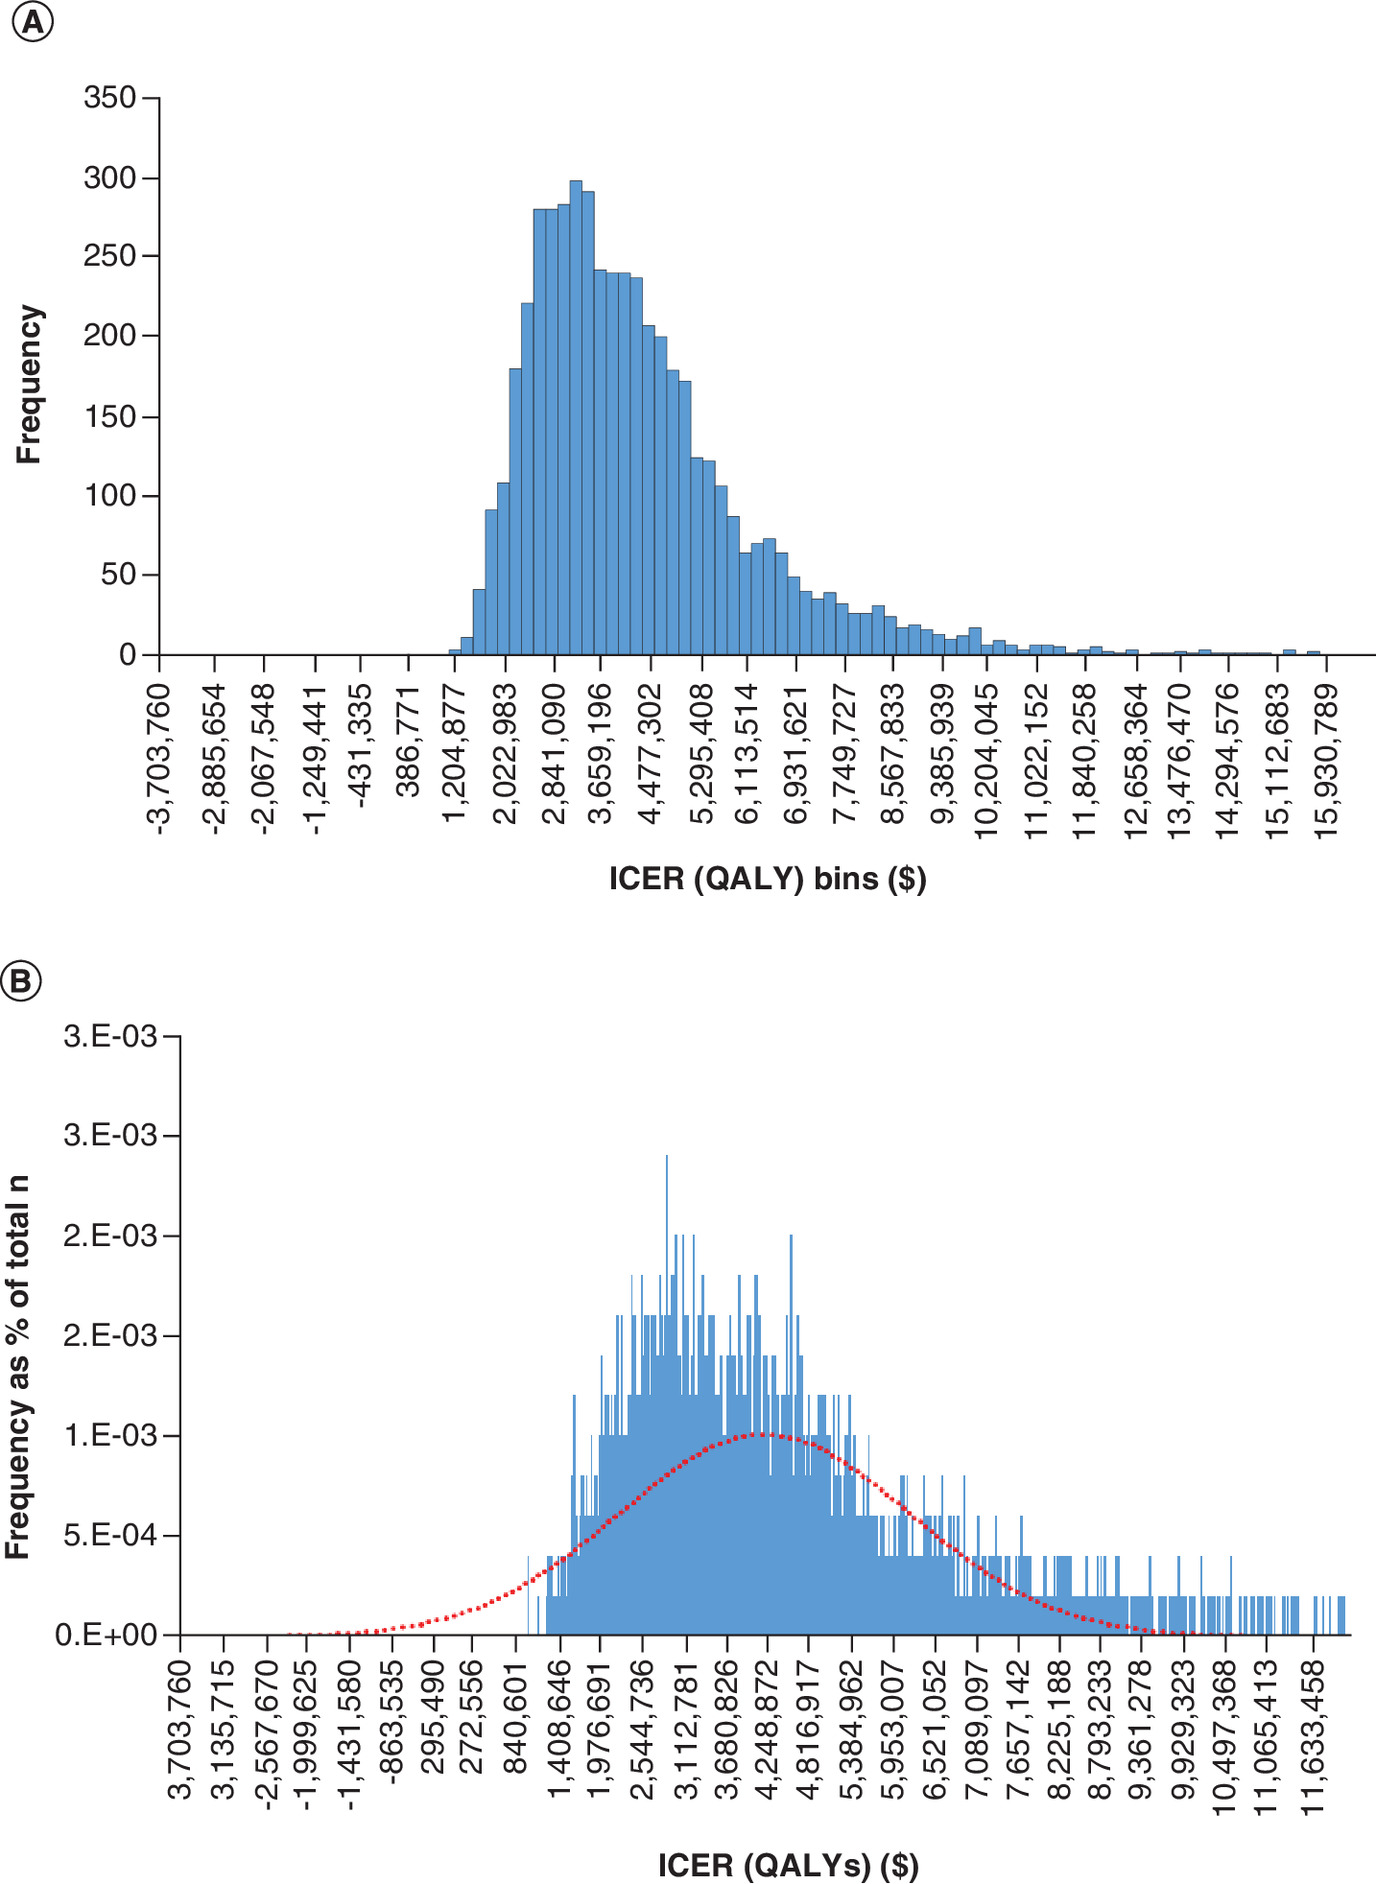
Figure 2. Incremental cost–effectiveness ratio (quality-adjusted life years).
(A) Frequency Distribution (n = 5000 samples). (B) Frequency distribution as percentage of simulations (n = 5000 samples).
ICER: Incremental cost–effectiveness ratio; QALY: Quality-adjusted life year.
Results
The base case ICER calculated using expected value analysis of the decision tree was US$3,563,057 per QALY ([US$55,337–US$45,485]/[0.61210–0.60933]) and US$2,943,043 per LY ([US$55,337–US$45,485]/[0.83238–0.82903]). We assessed the validity of our base case ICER results with univariate sensitivity analyses (see Table 3) and a Monte Carlo PSA (shown in Table 4 and Figure 2A & B & Figure 3A & B).
| Statistical distribution | ICER (QALYs) | ICER (LYs) |
|---|---|---|
| N = Number of samples | 5000 | 5000 |
| n = Sample interval | 3173 | 2601 |
| μ = Mean | US$4,229,831 | US$3,495,513 |
| σ = Std Dev | US$1,983,398 | US$1,625,385 |
| μ + 4 σ | US$12,163,423 | US$9,997,053 |
| μ - 4 σ | -US$3,703,760 | -US$3,006,026 |
| Percentile 25% | US$2,866,757 | US$2,376,189 |
| Percentile 75% | US$5,024,980 | US$4,195,629 |
| Min | US$1,008,187 | US$898,165 |
| Max | US$21,460,842 | US$15,411,721 |
| Range | US$20,452,655 | US$14,513,556 |
| No. of bins for graph | 100 | 100 |
| Bin interval | US$204,527 | US$145,136 |
| Cost–effectiveness acceptability threshold | US$50,000/QALY | US$50,000/LY |
ICER: Incremental cost–effectiveness ratio; LY: Life year; QALY: Quality-adjusted life year.
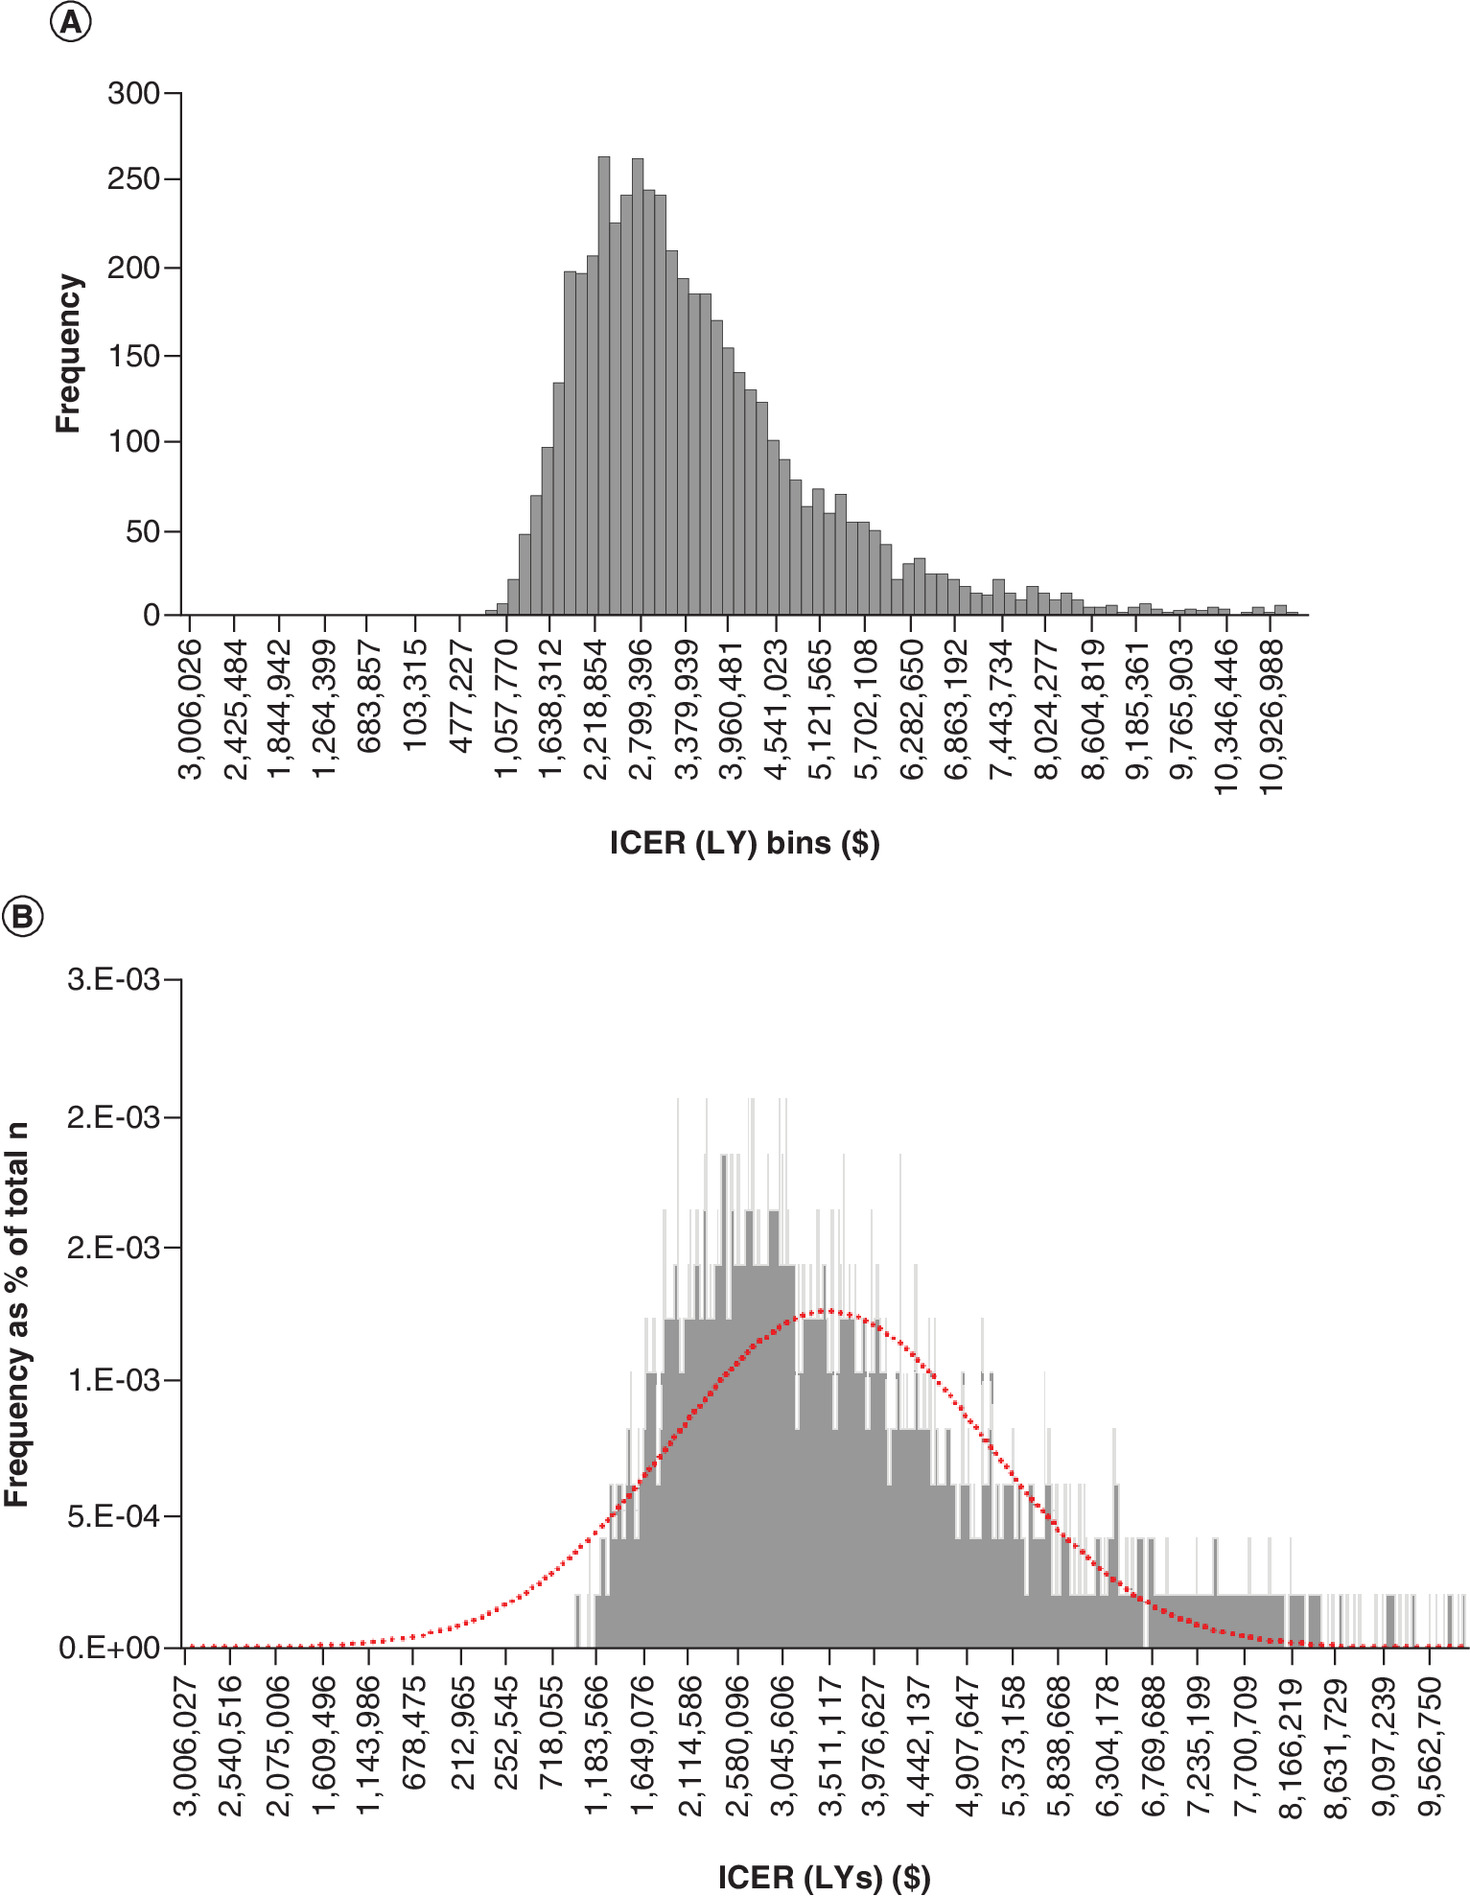
Figure 3. Incremental cost–effectiveness ratio (life years).
(A) Frequency distribution (n = 5000 samples). (B) Frequency distribution as percentage of simulations (n = 5000 samples).
ICER: Incremental cost–effectiveness ratio; LY: Life year.
The results of our univariate sensitivity analysis showed the model was highly sensitive to small changes in survival probabilities after ECS and costs, as expected when comparing two interventions with minor differences in base case costs and outcomes (see Table 3). Because procedural costs and short-term (<30 days) survival probabilities after ECS are likely easier to change than long-term (>30 days) post-procedural mortality and health-related quality of life (HRQOL) outcomes (i.e. QALYs), we examined our model's sensitivity to cost and short-term (<30 days) survival probabilities after ECS in greater detail. Altering the cost difference between the RIA and MIS-TAVR procedures by +/- US$5000, or roughly 50% from the base case, resulted in an ICER range of US$1,754,766–$5,371,348 per QALY (see Table 3.iii). Changing the 30-day mortality rate (survival <30 days) for ECS Conversion with the RIA by an absolute value of +/-20% from the base case resulted in an ICER range of US$2,345,997–$7,404,240 per QALY (see Table 3.i). Finally, reducing assumed mortality for patients undergoing ECS with the MIS from 100% to 90% and 80% resulted in ICERs of US$4,810,981 per QALY and US$7,404,240 per QALY, respectively (see Table 3.ii).
Our Monte Carlo PSA simulation produced a mean ICER of US$4,229,831 per QALY [IQR US$2,866,757–$5,024,980] while the ICER frequency distribution ranged from a minimum of US$1,008,187 per QALY to a maximum of US$21,460,842 per QALY (see Table 4 for Monte Carlo PSA simulation statistical summary). All ICER values were significantly above the generally accepted thresholds of US$50,000–$100,000 per QALY [26].
Summary
Based upon our case scenario and sensitivity analyses, it is not cost-effective to perform TAVR using a resource-intensive approach for high-risk aortic stenosis patients. These results of our ICER modeling are not surprising given the following model parameters: the low rate of ECS conversion during TAVR (∼1.2%); the high 30-day mortality rate for ECS cases (∼61.4%); and the small incremental difference in quality of life outcomes for those who survive an uncomplicated TAVR procedure compared with SAVR (0.027 QALYs). The sensitivity of our model to minor variations in cost illustrates the importance of accurate and transparent accounting practices when providers are calculating costs of procedural care [27].
Considering incidents necessitating ECS/CT back-up and anesthesiology are rare (1%) and associated with high mortality, our model assumes only incremental morbidity and mortality benefit with RIA (presence of both CT surgery back-up and cardiac anesthesiologist). Conceptually, the MIS does not preclude the possibility of converting to emergent surgery. This would require mobilization of a surgical team on an emergency basis similar to current percutaneous coronary intervention models. However, Eggebrecht et al. found no statistical difference in procedural outcomes (in-hospital complications and mortality) between institutions with and without on-site CT surgery departments [28]. A small randomized-controlled trial with and without an anesthesiologist found no difference in procedural or 30-day mortality, yet only 3 of 324 cases required ECS. Clearly, if future research confirms the results of Eggebrecht and Babaliaros then MIS-TAVR will be the preferred approach [29]. In the absence of a clear consensus on whether immediate CT back-up and type of anesthesia translate into different patient outcomes, many institutions will continue to assume that RIA-TAVR is clinically superior to MIS-TAVR, albeit at a higher cost.
There is historical precedent for the adoption of a MIS strategy for TAVR. During early percutaneous coronary interventions (PCI), the procedural risks of abrupt vessel closure and bleeding necessitated cardiac surgery standby protocols and multi-day hospitalizations. With the development of 2nd generation drug eluting stents and radial artery access techniques, these adverse events now occur in less than 1% of patients. Thus, instead of prolonged procedures, hospitalizations and resource utilization, PCI can now be performed more cost effectively as a same day procedure without the necessity of anesthesia or cardiac surgery resource requirements. In the future, the delivery of MIS-TAVR may follow in the step-wise progression in similar free standing environments [30].
With regards to MIS versus RIA-TAVR, further data could be analyzed regarding the incidence and outcomes of conversion from sedation to general anesthesia. Sedation is increasingly being used for TAVR, yet with decreasing conversion rates, ranging from 3.4 to 20% [31]. It is estimated that half of conversion to GA was being attributed to patient compliance and the remainder being attributed to more serious procedural complications [32]. However, conversion to GA from sedation is poorly characterized in much of the literature. Additional data regarding these indications and outcomes would further elucidate cost-benefit findings and predictions with regards to the presence or absence of an anesthesiologist and cardiac surgery backup.
There are several limitations to these analyses. First, our study extracted model parameter data (i.e. probabilities, health utilities and costs) from multiple different sources. We attempted to mitigate the effects of single source bias on our probability parameters by calculating weighted average probabilities from multiple published studies. However, in the case of costs and health utilities there were only single studies available to provide us with data for each parameter. Second, differences in study designs, patient populations and lack of availability of procedural details may have impacted the results of our model. Third, we assumed ECS to be defined as any periprocedural event requiring CT intervention. Because there is no uniform definition of ECS, some studies contributing data to our model defined the timeframe for ECS as periprocedural and up to 24 hours post procedure. Nevertheless, a decrease in ECS rates would only increase the ICER and further support the results of our model. Lastly, the costs associated with the conversion from MIS to ECS were not included in our model, but would likely align with those associated with RIA.
Conclusion
Cost–effectiveness analysis offers an objective approach to quantifying the incremental costs of adopting a more expensive, superior intervention over a less costly, inferior treatment modality. Healthcare policymakers and clinicians must continue to contribute to this field and critically evaluate the literature to ensure the optimal balance of patient care and expenditure of healthcare resources.
Future perspective
We believe our analysis is a starting point for discussion when hospitals or healthcare systems are considering the optimal approach to TAVR staffing. Individual institutions should continue to consider unique patient characteristics, available hospital resources and annual TAVR volumes when determining TAVR staffing models [13]. TAVR will be increasingly utilized as newer generations of valves, small delivery devices, increased surgical familiarization, and outcomes continue to improve. However, considering the increased price above SAVR, costs must be justified. A recent systematic review found both SAVR and TAVR to be cost-effective or ‘highly’ cost effective in all studies when compared with medical management, TAVR in inoperable or high-risk surgical candidates and SAVR in operable patients. When comparing TAVR to SAVR for high-risk operable patients, the outcomes were far more mixed with a trend toward SAVR providing higher QALYs at lower costs [33]. For patients suitable for SAVR, deemed low to moderate surgical risk, ICER with TAVR becomes increasingly less favorable [34,35].
This review assesses the resource utilization and cost effectiveness between RIA versus MIS across a wide spectrum of TAVR patients. While the current methodology was not powered for subgroup analysis, a larger multi-center design might further elucidate the relative impact of these strategies according to important subgroups (e.g., low, intermediate, high or extreme risk patients). Similarly, the most recent ACC-AHA valvular heart disease guidelines no longer recommend using risk strata to choose between TAVR versus SAVR. Instead, they have recommended risk stratification according to patient age. Accordingly, future studies should aim to analyze the cost effectiveness of the MIS stratified by age groups [36].
For TAVR to gain widespread adoption outside of high-income countries, the index procedural costs will need to decrease while outcomes and QALYs continue to improve. As we wait for a reduction in cost of the TAVR valve and delivery devices, hospitals should consider the adoption of MIS-TAVR when possible.
•
Transcatheter aortic valve replacement (TAVR) was previously an intervention reserved for high-risk individuals with severe, symptomatic aortic stenosis.
•
Recent studies have demonstrated superior TAVR outcomes with regards to 30-day mortality, stroke rate, new onset atrial fibrillation, and hospital length of stay even in low-risk patients.
•
As TAVR is increasingly offered to a broader range of surgical patients, it will become important to assess the cost–effectiveness of the procedure across discretely defined risk groups, as device costs make a TAVR procedure ∼US$5,000 more expensive than a surgical approach.
•
Traditionally, centers have employed a resource-intensive approach (RIA) involving general anesthesia, invasive hemodynamic monitoring, trans-esophageal echocardiography and cardiothoracic surgical back-up.
•
More recently, a leaner, minimally invasive strategy (MIS), involving local anesthesia, minimal conscious sedation, and transthoracic echocardiography, has been utilized to decrease resource utilization, procedural costs and hospital length of stay, with outcomes consistent with the RIA approach.
•
In this cost–effectiveness study, we employed a decision tree model with Monte Carlo probability sensitivity analysis to determine the incremental cost (in US$) per quality-adjusted life year and life year of performing the TAVR procedure using the RIA and MIS in high-risk surgical patients.
•
Our base case scenario and sensitivity analyses show it is not cost-effective to perform TAVR using a resource-intensive approach.
•
With TAVRs being increasingly utilized in a broader population, and considering the development of newer generations of valves and delivery devices, this analysis is offered as a starting point for analyzing the optimal approach to TAVR staffing.
Financial & competing interests disclosure
The authors have no relevant affiliations or financial involvement with any organization or entity with a financial interest in or financial conflict with the subject matter or materials discussed in the manuscript. This includes employment, consultancies, honoraria, stock ownership or options, expert testimony, grants or patents received or pending, or royalties.
No writing assistance was utilized in the production of this manuscript.
References
1.
Ross J, Braunwald E. Aortic stenosis. Circulation 38(1), 61–67 (1968).
2.
Turina J, Hess O, Sepulcri F, Krayenbuehl HP. Spontaneous course of aortic valve disease. Eur. Heart J. 8(5), 471–483 (1987).
3.
Kelly TA, Rothbart RM, Cooper CM, Kaiser DL, Smucker ML, Gibson RS. Comparison of outcome of asymptomatic to symptomatic patients older than 20 years of age with valvular aortic stenosis. Am. J. Cardiol. 61(1), 123–130 (1988).
4.
Osnabrugge RLJ, Mylotte D, Head SJ et al. Aortic stenosis in the elderly: disease prevalence and number of candidates for transcatheter aortic valve replacement: a meta-analysis and modeling study. J. Am. Coll. Cardiol. 62(11), 1002–1012 (2013).
5.
Mack MJ. Transcatheter aortic-valve replacement with a balloon-expandabel valve in low-risk patients. N. Engl. J. Med. 380(18), 1695–1705 (2019).
6.
Lange R, Bleiziffer S, Mazzitelli D et al. Improvements in transcatheter aortic valve implantation outcomes in lower surgical risk patients. J. Am. Coll. Cardiol. 59(3), 280–287 (2012).
7.
Reynolds MR, Magnuson EA, Lei Y et al. Cost–effectiveness of transcatheter aortic valve replacement compared with surgical aortic valve replacement in high-risk patients with severe aortic stenosis: results of the PARTNER (Placement of Aortic Transcatheter Valves) Trial (Cohort A). J. Am. Coll. Cardiol. 60(25), 2683–2692 (2012).
8.
Ailawadi G, LaPar DJ, Speir AM et al. Contemporary costs associated with transcatheter aortic valve replacement: a propensity-matched cost analysis. Ann. Thorac. Surg. 101(1), 154–160 (2016).
9.
Fröhlich GM, Lansky AJ, Webb J et al. Local versus general anesthesia for transcatheter aortic valve implantation (TAVR) – systematic review and meta-analysis. BMC Med. 12(1), 41 (2014).
10.
Attizzani GF, Alkhalil A, Padaliya B et al. Comparison of outcomes of transfemoral transcatheter aortic valve implantation using a minimally invasive versus conventional strategy. Am. J. Cardiol. 116(11), 1731–1736 (2015).
11.
Motloch LJ, Rottlaender D, Reda S et al. Local versus general anesthesia for transfemoral aortic valve implantation. Clin. Res. Cardiol. 101(1), 45–53 (2012).
12.
Babaliaros V, Devireddy C, Lerakis S et al. Comparison of transfemoral transcatheter aortic valve replacement performed in the catheterization laboratory (minimalist approach) versus hybrid operating room (standard approach): outcomes and cost analysis. JACC Cardiovasc. Interv. 7(8), 898–904 (2014).
13.
Griese DP, Reents W, Kerber S, Diegeler A, Babin-Ebell J. Emergency cardiac surgery during transfemoral and transapical transcatheter aortic valve implantation: incidence, reasons, management, and outcome of 411 patients from a single center. Catheter Cardiovasc. Interv. 82(5), 726–733 (2013).
14.
Briggs AH, Claxton K, Sculpher MJ. Decision Modelling for Health Economic Evaluation. Oxford University Press, UK (2006).
15.
Muennig P. Cost–effectiveness Analyses in Health: A Practical Approach. Jossey-Bass, CA, USA (2008).
16.
Mencacci C, Di Sciascio G, Katz P, Ripellino C. Cost–effectiveness evaluation of escitalopram in major depressive disorder in Italy. Clinicoecon. Outcomes Res. 5, 87–99 (2013).
17.
Black WC. The CE Plane. Med. Decis. Making 10(3), 212–214 (1990).
18.
Dittus RS, Roberts SD, Wilson JR. Quantifying uncertainty in medical decisions. J. Am. Coll. Cardiol. 14(Suppl. 3A), 23–28 (1989).
19.
Eggebrecht H, Schmermund A, Kahlert P, Erbel R, Voigtländer T, Mehta RH. Emergent cardiac surgery during transcatheter aortic valve implantation (TAVI): a weighted meta-analysis of 9,251 patients from 46 studies. EuroIntervention 8(9), 1072–1080 (2013).
20.
Hein R, Abdel-Wahab M, Sievert H et al. Outcome of patients after emergency conversion from transcatheter aortic valve implantation to surgery. EuroIntervention 9(4), 446–451 (2013).
21.
Seiffert M, Conradi L, Baldus S et al. Severe intraprocedural complications after transcatheter aortic valve implantation: calling for a heart team approach. Eur. J. Cardio. Thoracic Surg. 44(3), 478–484 (2013).
22.
Smith CR, Leon MB, Mack MJ et al. Transcatheter versus surgical aortic-valve replacement in high-risk patients. N. Engl. J. Med. 364(23), 2187–2198 (2011).
23.
Gray A. Applied methods of cost–effectiveness analysis in health care. Oxford University Press, UK (2011). https://www.herc.ox.ac.uk/downloads/applied-methods-of-cost–effectiveness-analysis-in-healthcare
24.
Briggs AH, Claxton K, Sculpher MJ. Decision Modelling for Health Economic Evaluation. Oxford University Press, UK (2006).
25.
Briggs AH. Handling uncertainty in cost–effectiveness models. Pharmacoeconomics 17(5), 479–500 (2000).
26.
Ubel PA, Hirth RA, Chernew ME, Fendrick AM. What is the price of life and why doesn't it increase at the rate of inflation? Arch. Intern. Med. 163(14), 1637–1641 (2003).
27.
Kaplan RS, Porter ME. How to solve the cost crisis in health care. Harv. Bus. Rev. 89(9), 46–61 (2011).
28.
Eggebrecht H, Bestehorn M, Haude M et al. Outcomes of transfemoral transcatheter aortic valve implantation at hospitals with and without on-site cardiac surgery department: insights from the prospective German aortic valve replacement quality assurance registry (AQUA) in 17 919 patients. Eur. Heart J. 37(28), 2240–2248 (2016).
29.
Cohen DJ, Reynolds MR. Interpreting the results of cost–effectiveness studies. J. Am. Coll. Cardiol. 52(25), 2119–2126 (2008).
30.
Writing Committee, Rao SV, Vidovich MI, Gilchrist IC et al. 2021 ACC Expert Consensus Decision Pathway on Same-Day Discharge After Percutaneous Coronary Intervention: a report of the American College of Cardiology Solution Set Oversight Committee. J. Am. Coll. Cardiol. 77(6), 811–825 (2021).
31.
Hyman MC. Conscious sedation versus general anesthesia for transcatheter aortic valve replacement: insights from the National Cardiovascular Data Registry Society of Thoracic Surgeons/American College of Cardiology Transcatheter Valve Therapy Registry. Circulation 136(22), 2132–2140 (2017).
32.
Gauthier C, Astarci P, Baele P et al. Mid-term survival after transcatheter aortic valve implantation: results with respect to the anesthetic management and to the access route (transfemoral versus transapical). Ann. Card. Anaesth. 18(3), 343–351 (2015).
33.
Huygens S, Takkenberg J, Molken M. Systemic review of model-based economic evaluations of heart valve implantations. Eur. J. Health Econ. 19(2), 241–255 (2018).
34.
Manolis A. Transcatheter aortic valve implantation econoimcs: a grisly reality. Ann. Cardiothoracic Surg. 6(5), 516–523 (2017).
35.
Orlando R, Pennant M. Cost–effectiveness of transcatheter aortic valve implantation (TAVI) for aortic stenosis in patients who are high risk or contraindicated for surgery: a model-based economic evaluation. Health Technol. Assess. 17(33), 1–86 (2013).
36.
Otto CM, Nishimura RA, Bonow RO et al. 2020 ACC/AHA Guideline for the Management of Patients With Valvular Heart Disease: a report of the American College of Cardiology/American Heart Association Joint Committee on Clinical Practice Guidelines. Circulation 143(5), e72–e227 (2021).
Information & Authors
Information
Published In
Pages: 217 - 227
PubMed: 35142536
Copyright
© 2022 Future Medicine Ltd.
History
Received: 1 September 2021
Accepted: 1 December 2021
Published online: 10 February 2022
Keywords:
Topics
Authors
Metrics & Citations
Metrics
Article Usage
Article usage data only available from February 2023. Historical article usage data, showing the number of article downloads, is available upon request.
Citations
How to Cite
Cost–effectiveness analysis of a resource-intensive approach versus minimally invasive strategy for high-risk transcatheter aortic valve replacement patients. (2022) Journal of Comparative Effectiveness Research. DOI: 10.2217/cer-2021-0210
Export citation
Select the citation format you wish to export for this article or chapter.