Comparative effectiveness of weekly versus every-2-weeks cetuximab in metastatic colorectal cancer in a US-insured population
Publication: Journal of Comparative Effectiveness Research
Abstract
Aim: To test the noninferiority of cetuximab administered every 2 weeks (Q2W) versus once weekly (Q1W) in treating metastatic colorectal cancer (mCRC) with regard to overall survival (OS). Patients: Patients receiving cetuximab plus chemotherapy for mCRC in a line-agnostic setting. Methods: This cohort study in IBM MarketScan followed patients from initiation of cetuximab for mCRC until the end of the data availability period, proxy-based death or loss of insurance coverage for >30 days. Results: The hazard ratio for OS was 0.94 (0.85–1.03), and the inferiority hypothesis was rejected at p < 0.001. No significant differences were noted in rates of safety events between Q2W and Q1W. Conclusion: Our real-world study confirmed the noninferiority of cetuximab administered Q2W versus Q1W for OS.
Colorectal cancer (CRC) is the third most commonly diagnosed cancer and is responsible for 900,000 deaths annually, making it the second leading cause of cancer mortality globally [1,2]. A higher CRC incidence rate is observed in economically developed countries [2]. In the USA alone, 53,200 CRC-related deaths are expected in 2020 [3]. The 5-year relative survival rate for CRC in the USA is 65% all stages considered, despite an observed improvement in survival rates of >10% between the mid-1970s and 2000 [3,4]. At diagnosis, approximately 25% of patients with CRC present with metastases [5]. Patients with stage IV or metastatic CRC (mCRC) have a poor prognosis, with an average 5-year relative survival rate of 14% [6]. Additionally, the incidence of CRC appears to be increasing among individuals under 55 years of age, and the incidence varies considerably depending on geographic location [3].
The current standard of care for patients with unresectable mCRC is chemotherapy in combination with targeted therapy [7,8]. Anti-EGFR agents are currently indicated for EGFR-expressing, (K)RAS wild-type (wt) mCRC [7,8]. Guidelines and routine clinical practice suggest that CRC should be tested for extended RAS and RAF mutations (KRAS, NRAS and BRAF) before considering anti-EGFR agents; these agents are recommended in the 1L setting for extended RAS and RAF wt tumors as well as for BRAF-V600E-mutant tumors [9,10]. Cetuximab is indicated for RAS wt mCRC according to the European Medicines Agency summary of product characteristics and for KRAS wt mCRC according to the US prescribing information [11,12]. In the USA, cetuximab is approved at an initial dose of 400 mg/m2 followed by a 250 mg/m2 weekly infusion for the treatment of KRAS wt, EGFR-expressing mCRC as determined by a US FDA-approved test, in combination with leucovorin calcium (folinic acid), 5-fluorouracil and irinotecan (FOLFIRI) for first-line (1L) treatment; in combination with irinotecan in patients who are refractory to irinotecan-based chemotherapy; or as a single agent in patients for whom oxaliplatin- and irinotecan-based chemotherapy have failed or who are intolerant of irinotecan [11].
Various clinical trials have evaluated the approved once-weekly (Q1W) dosing schedule for cetuximab in mCRC [13–17]; however, because the combined chemotherapy is administered every 2 weeks (Q2W), this weekly dosing schedule may not always be a convenient option. A cetuximab dosing regimen of 500 mg/m2 administered Q2W has been shown to have pharmacokinetic properties similar to the 250 mg/m2 Q1W dosing regimen [18]. In clinical practice, a Q2W 500-mg/m2 dose of cetuximab is used in accordance with National Comprehensive Cancer Network clinical practice guidelines [7,8]. This regimen may be a more convenient option for patients with mCRC receiving cetuximab and is currently recommended and/or reimbursed for use in some countries in Europe and Asia [18–20]. However, few studies have specifically compared these two treatment regimens; those that have compared them have had limited sample sizes and have generally reported on the absence of significant differences between the regimens rather than testing for noninferiority between them.
The main objective of the current study was to formally test the hypothesis of noninferiority of the cetuximab Q2W regimen compared with the Q1W regimen for the treatment of mCRC in combination with chemotherapy with regard to overall survival (OS). Secondary end points examining safety, time to treatment discontinuation and time to next treatment or death are also reported. The study included real-world patients with mCRC treated with cetuximab in combination with chemotherapy in a line-agnostic setting.
Materials & methods
Study design
This was a cohort study based on secondary use of the IBM MarketScan Commercial Claims and Encounters database and the Medicare Supplemental and Coordination of Benefits database (a US claims database) and included patients treated with cetuximab for mCRC in combination with chemotherapy between 1 July 2010 and 31 December 2016. Because data related to dosing were not directly available in the dataset in most cases, such data were derived according to an algorithm. For the purpose of this study, it was assumed that patients in the Q1W group received weekly cetuximab at 250 mg/m2 and patients in the Q2W group received cetuximab at 500 mg/m2 every 2 weeks.
Patient population
All patients included in this study were required to have ≥2 claims for cetuximab within 28 days of each other; the first of the two claims was considered to be the index date (Figure 1). Additionally, all patients were required to be ≥18 years of age at the index date, with one chemotherapy infusion claim within 28 days of the first cetuximab claim and a CRC diagnosis within 180 days of either of the two claims for cetuximab. Patients were followed up until the end of the data collection period, death or loss of health insurance coverage for >30 days, depending on the study end point. The baseline period used for covariate assessment was defined as the 180-day period prior to (but not including) the index date.
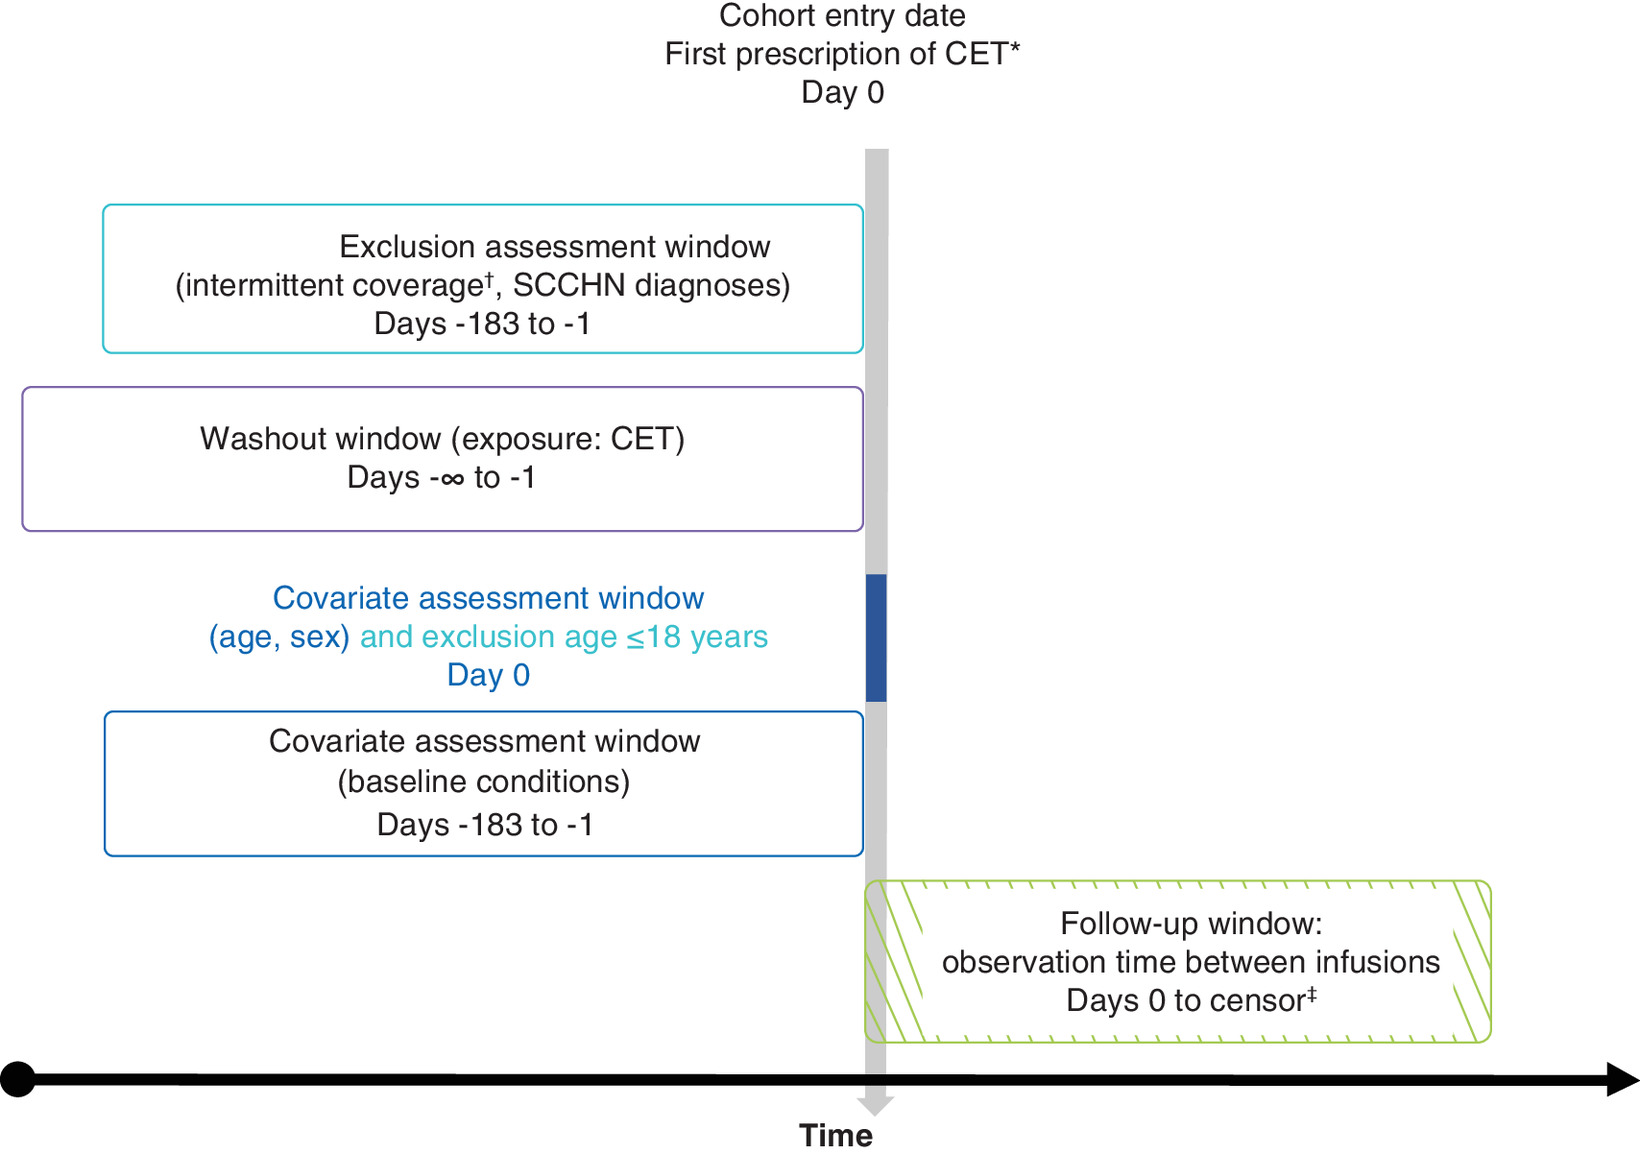
Figure 1. Study design.
*Eligibility required that the second CET claim occur within 28 days of the first CET claim. Additionally, a CT infusion claim had to have occurred within 28 days of the first CET claim, and a CRC diagnosis had to have occurred within 180 days of either of the two initial CET claims.
†Up to a 30-day gap in insurance coverage was allowed.
‡Earliest date of death, loss of insurance coverage, CET discontinuation (>45 days between infusions) or end of study period (31 December 2016).
CET: Cetuximab; CRC: Colorectal cancer; CT: Chemotherapy; SCCHN: Squamous cell carcinoma of the head and neck.
Patients were excluded from this study if they had <180 days of continuous enrollment prior to the index date, a diagnosis of squamous cell carcinoma of the head and neck (SCCHN) within 180 days before the index date or any time after (to avoid capturing cetuximab use corresponding to this indication, which is the only other authorized indication for cetuximab in the USA), or ≥1 cetuximab claim that may have occurred before the assigned index date [11]. A threshold value for age was set at 120 years; therefore, no patients were excluded on the basis of age after inclusion.
Definition of exposure
The dosing regimen was classified by examining the total overall claims history from the index date through the earliest end date of follow-up (defined as the exposure period). Patients were categorized according to the median time between all sequential cetuximab dispensation claims based on the following definitions: Q1W, the median time between all sequential cetuximab claims during an exposure period of ≥4 days and <11 days; Q2W, the median time between all sequential cetuximab claims during an exposure period of ≥11 and <19 days; other, any other median time between all sequential cetuximab claims. Due to the nature of the data, no further information on dosing was considered to be relevant to the exposure definition. Patients were categorized according to their defined group, and no change in the regimen was considered for the exposure period because all observed cetuximab claims were used to classify the exposure group. The ‘other’ group was defined for description purposes only and was not considered for any of the study objectives. Patients with no evidence of systemic anticancer therapy for mCRC in the baseline period were presumed to have received cetuximab as 1L treatment (presumed 1L population).
Study end points
The primary end point of the study was to assess the noninferiority of cetuximab Q2W treatment with regard to OS, under a noninferiority margin of 1.25. Because claims data are limited in terms of reporting death, we applied a previously published algorithm to define a proxy for death in the CRC setting [21]. Indicators for death included the following: hospital discharge status of death; hospital or emergency event within 30 days of loss of insurance coverage; and use of cardiac-stimulating medications such as epinephrine or lidocaine, diagnosis codes for cardiac arrest or failure, or procedure codes for resuscitation or defibrillation within 30 days of loss of insurance coverage. Patients with no events at the end of the study period or at the end of insurance coverage were censored at the earliest of these two dates.
The secondary end points included time to treatment discontinuation, defined as the time from the index date to the earliest date of discontinuation (i.e., no cetuximab claim for ≥45 days) or death, and time to next treatment or death, defined as the time from the index date to the earliest date of switch (i.e., a claim for a CRC systemic therapy contextual to cetuximab discontinuation) or death. Patients with no events at the end of the study period were censored. Incidence rates of specific safety events occurring during cetuximab treatment were also examined; these included infusion-related reactions (IRRs; based on the algorithm proposed by Foley and colleagues) [22], hypomagnesemia (identified as ≥1 inpatient diagnosis claim consistent with hypomagnesaemia within 7 days of a claim for intravenous magnesium), skin rash (identified as ≥1 inpatient diagnosis consistent with rash within 7 days of a claim for medicines used for the management of rash in cancer patients receiving EGFR-inhibitor therapy), mucositis, headache, conjunctivitis, diarrhea, nausea and vomiting, and anorexia and weight loss (all identified as ≥2 outpatient diagnoses within 7 days of each other or as one inpatient diagnosis). With the exception of IRRs, only the first occurrence of a safety event was considered. To avoid capturing pre-existing conditions, patients meeting the criteria for a safety event during the baseline period were excluded from the corresponding analysis. Secondary end points also included healthcare resource utilization and healthcare costs, which will be described in a separate upcoming publication.
Statistical analysis
We used a noninferiority design to compare OS time between the cetuximab Q1W and Q2W regimens [23]. For a given noninferiority margin of Δ0 (the maximum hazard ratio of clinical insignificance) and an estimated hazard ratio for OS time of Δ, the statistical hypotheses tested included H0: Δ ≥Δ0 versus H1: Δ <Δ0. The noninferiority margin of Δ0 was set in terms of the hazard ratio for OS time (Δ). The margin Δ0 was defined based on the known activity of the Q1W administration schedule in 1L RAS wt mCRC; in a recent meta-analysis of such studies, the hazard ratio for cetuximab Q1W in combination with chemotherapy versus chemotherapy alone was reported as 0.77, which would correspond to a margin of 1.3 (1/0.77) [24]. Based on classical thresholds in oncology trials and clinical judgment, we considered a hazard ratio of <0.8 as clinically meaningful, and a corresponding margin of 1.25 (1/0.8) was defined as the appropriate noninferiority margin for the hazard ratio, which was more conservative than the 1.3 derived from known Q1W activity. We also confirmed that there was a sufficient number of claims available in the database to achieve appropriate power for meaningful statistical comparisons. The required sample size, including censored patients, for the primary objective of noninferiority of OS was estimated to be 787 in the Q1W group and 395 in the Q2W group, with a required total of 709 events. Based on a feasibility study showing the distribution of patients in the Q1W and Q2W groups in a 2:1 ratio, the sample size in our database was considered sufficient to obtain results showing statistical significance. The number of available records and death events in the database also proved to be sufficient for confirmatory statistical analysis at an α-level of 0.05 with a power of 1-β of 0.8.
Primary and secondary effectiveness outcomes were analyzed using a Cox survival model, while safety outcomes were analyzed using incidence rate ratios obtained by fitting Poisson regression models. A high-dimensional propensity score (hdPS)-based methodology was used to account for potential confounding, with the following additional variables added to the model: age, sex, calendar year of index date, region of residence, type of insurance plan, chemotherapy used in combination with cetuximab and number of visits during the pre-index period [25]. As it was assumed that all patients treated with cetuximab could receive either the Q1W or Q2W regimen, the average treatment effect was considered an appropriate estimation for the selected outcomes. From this perspective, an inverse probability of treatment weighting (IPTW) that included trimming was generated based on the hdPS estimated for each outcome and then used to increase the comparability of baseline characteristics between the two treatment regimens. Balance among baseline characteristics was assessed using standardized differences. Outcome analyses were performed on the weighted population. Baseline characteristics with an absolute standardized difference of >0.1 between the two regimens were included as covariates in the corresponding outcome model. With the exception of the one-sided noninferiority test with an alpha of 0.025 for OS, all statistical tests used to assess differences between the regimens were based on a significance level alpha of 0.05 and were two-sided. Based on the predefined inferiority margin, there was a power of 80% to reject H0 with a one-sided type I error rate of 2.5%.
Results
Patient disposition, demographics & disease characteristics
Of the 2943 patients who met the study eligibility criteria (Figure 2), 1779 (60.4%) were categorized as having received cetuximab Q1W, 951 (32.3%) as having received cetuximab Q2W and 213 (7.2%) as ‘other.’ Patients in the Q1W group had a mean value of 8.1 days between two claims across all 27,161 cetuximab claims, and those receiving cetuximab Q2W had a mean value of 15 days between two claims across all 7678 cetuximab claims. The root-mean-square error of the observed number of days between two cetuximab claims compared with the theoretical value (i.e., 7 days for Q1W and 14 days for Q2W) was approximately 2 days, suggesting acceptable accuracy for the proposed classification of exposure (Table 1).
| Q1W | Q2W | |
|---|---|---|
| n (%)† | 1779 (60.4) | 951 (32.3) |
| Number of claims | 27,161 | 7678 |
| Days between cetuximab claims | ||
| – Mean (SD) | 8.1 (3.80) | 15.0 (4.70) |
| – Median (Q1–Q3) | 7 (7.0, 7.0) | 14 (14.0, 14.0) |
| – Minimum–maximum | 2.0–44.0 | 2.0–45.0 |
| Observed vs expected differences for all cetuximab claims‡ | ||
| – Mean absolute difference (days) | 1.171 | 1.333 |
| – Root-mean-square error (days) | 1.858 | 2.024 |
| – Distance as expected (%)§ | 75.7 | 66.4 |
†
An additional 213 patients were classified as having received a treatment schedule of ‘other’, as they could not be classified as having received the cetuximab Q1W or Q2W dosing regimens.
‡
The expected timeframe for the difference between two subsequent claims is approximately 7 and 14 days for the Q1W and Q2W groups, respectively.
§
Proportion of observed claims that were distant from the previous claim at the exact expected number of days.
Q1W: Once weekly; Q2W: Every 2 weeks.

Figure 2. Patient disposition.
CRC: Colorectal cancer; CT: Chemotherapy, SCCHN: Squamous cell carcinoma of the head and neck.
There were limited differences with respect to demographic and disease characteristics between the Q1W and Q2W groups (Table 2). Overall, 30.6 and 24.7% of the participants were ≥65 years of age in the Q1W and Q2W groups, respectively, and the majority of patients in both groups were male (57.5 and 60.5%, respectively). There was a substantial difference (standardized difference >0.25) between the study groups in terms of Medicare coverage (30.6 and 24.8% in the Q1W and Q2W groups, respectively), unemployment (36.6 and 28.6%) and ‘unspecified’ chemotherapy used in combination with cetuximab (19.5 and 9.8%), all of which were more frequent in the Q1W group. There was also a substantial difference in the use of FOLFIRI in combination with cetuximab, which was more frequent in the Q2W group (34.4%) versus the Q1W group (24.5%). Notably, the proportion of patients receiving cetuximab as presumed 1L treatment was comparable in the two groups (31.3 and 33.2% in the Q1W and Q2W groups, respectively; absolute standardized difference, 0.041).
| Q1W | Q2W | Total | |
|---|---|---|---|
| n (%) | 1779 (60.4) | 951 (32.3) | 2730 (100) |
| Median age at ID, years | 60 | 58 | 59 |
| Age at ID, ≥65 years | 544 (30.6) | 235 (24.7) | 779 (28.5) |
| Sex, female (%) | 756 (42.5) | 376 (39.5) | 1132 (41.5) |
| MarketScan data source, n (%) | |||
| – Commercial claims and encounters | 1235 (69.4) | 715 (75.2) | 1950 (71.4) |
| – Medicare supplemental | 544 (30.6) | 236 (24.8) | 780 (28.6) |
| Employment status at ID, n (%) | |||
| – Not currently employed | 652 (36.6) | 272 (28.6) | 924 (33.8) |
| – Currently employed | 462 (26.0) | 320 (33.6) | 782 (28.6) |
| – Unknown | 665 (37.4) | 359 (37.7) | 1024 (37.5) |
| Type of metastases, n (%) | |||
| – Liver and others | 843 (47.4) | 402 (42.3) | 1245 (45.6) |
| – Other localizations only | 936 (52.6) | 549 (57.7) | 1485 (54.4) |
| CT used with cetuximab, n (%) | |||
| FOLFOXIRI | 2 (0.1) | 1 (0.1) | 3 (0.1) |
| FOLFIRI | 436 (24.5) | 327 (34.4) | 763 (27.9) |
| FOLFOX | 101 (5.7) | 82 (8.6) | 183 (6.7) |
| CAPIRI | 36 (2.0) | 20 (2.1) | 56 (2.1) |
| CAPEOX | 9 (0.5) | 2 (0.2) | 11 (0.4) |
| 5-FU | 332 (18.7) | 143 (15.0) | 475 (17.4) |
| Irinotecan | 448 (25.2) | 239 (25.1) | 687 (25.2) |
| Undefined | 347 (19.5) | 93 (9.8) | 440 (16.1) |
| Other† | 68 (3.8) | 44 (4.6) | 112 (4.1) |
| Cetuximab presumed given in 1L | 557 (31.3) | 316 (33.2) | 873 (32.0) |
†
Other regimens included capecitabine (n = 72) and oxaliplatin (n = 31).
1L: First-line; CAPEOX: Capecitabine plus oxaliplatin; CAPIRI: Capecitabine plus irinotecan; CT: Chemotherapy; FOLFIRI: Leucovorin calcium (folinic acid), 5-fluorouracil and irinotecan; FOLFOX: Leucovorin calcium (folinic acid), 5-fluorouracil and oxaliplatin; FOLFOXIRI: 5-fluorouracil, leucovorin calcium (folinic acid), oxaliplatin and irinotecan; 5-FU: 5-fluorouracil; ID: Index date; Q1W: Once weekly; Q2W: Once every other week.
Propensity scores
The propensity scores showed good overlap between both regimens for OS (Supplementary Figure 1) and other outcomes (data available upon request). After trimming of the propensity scores to account for extreme scores, 599 patients from the Q1W group and 165 patients from the Q2W group were excluded, leaving 1180 and 786 patients remaining in the analysis in the Q1W and Q2W groups, respectively. This sample size was considered sufficient for the noninferiority test. The distributions of absolute standardized differences between the exposure groups before and after weighting are summarized in Figure 3. For both study groups, the average follow-up time for patients was 1.0 year (median: 0.7 year). Death due to any cause was the main reason for the end of the observation period for both groups (55.5 and 59.0% in the Q1W and Q2W groups, respectively).
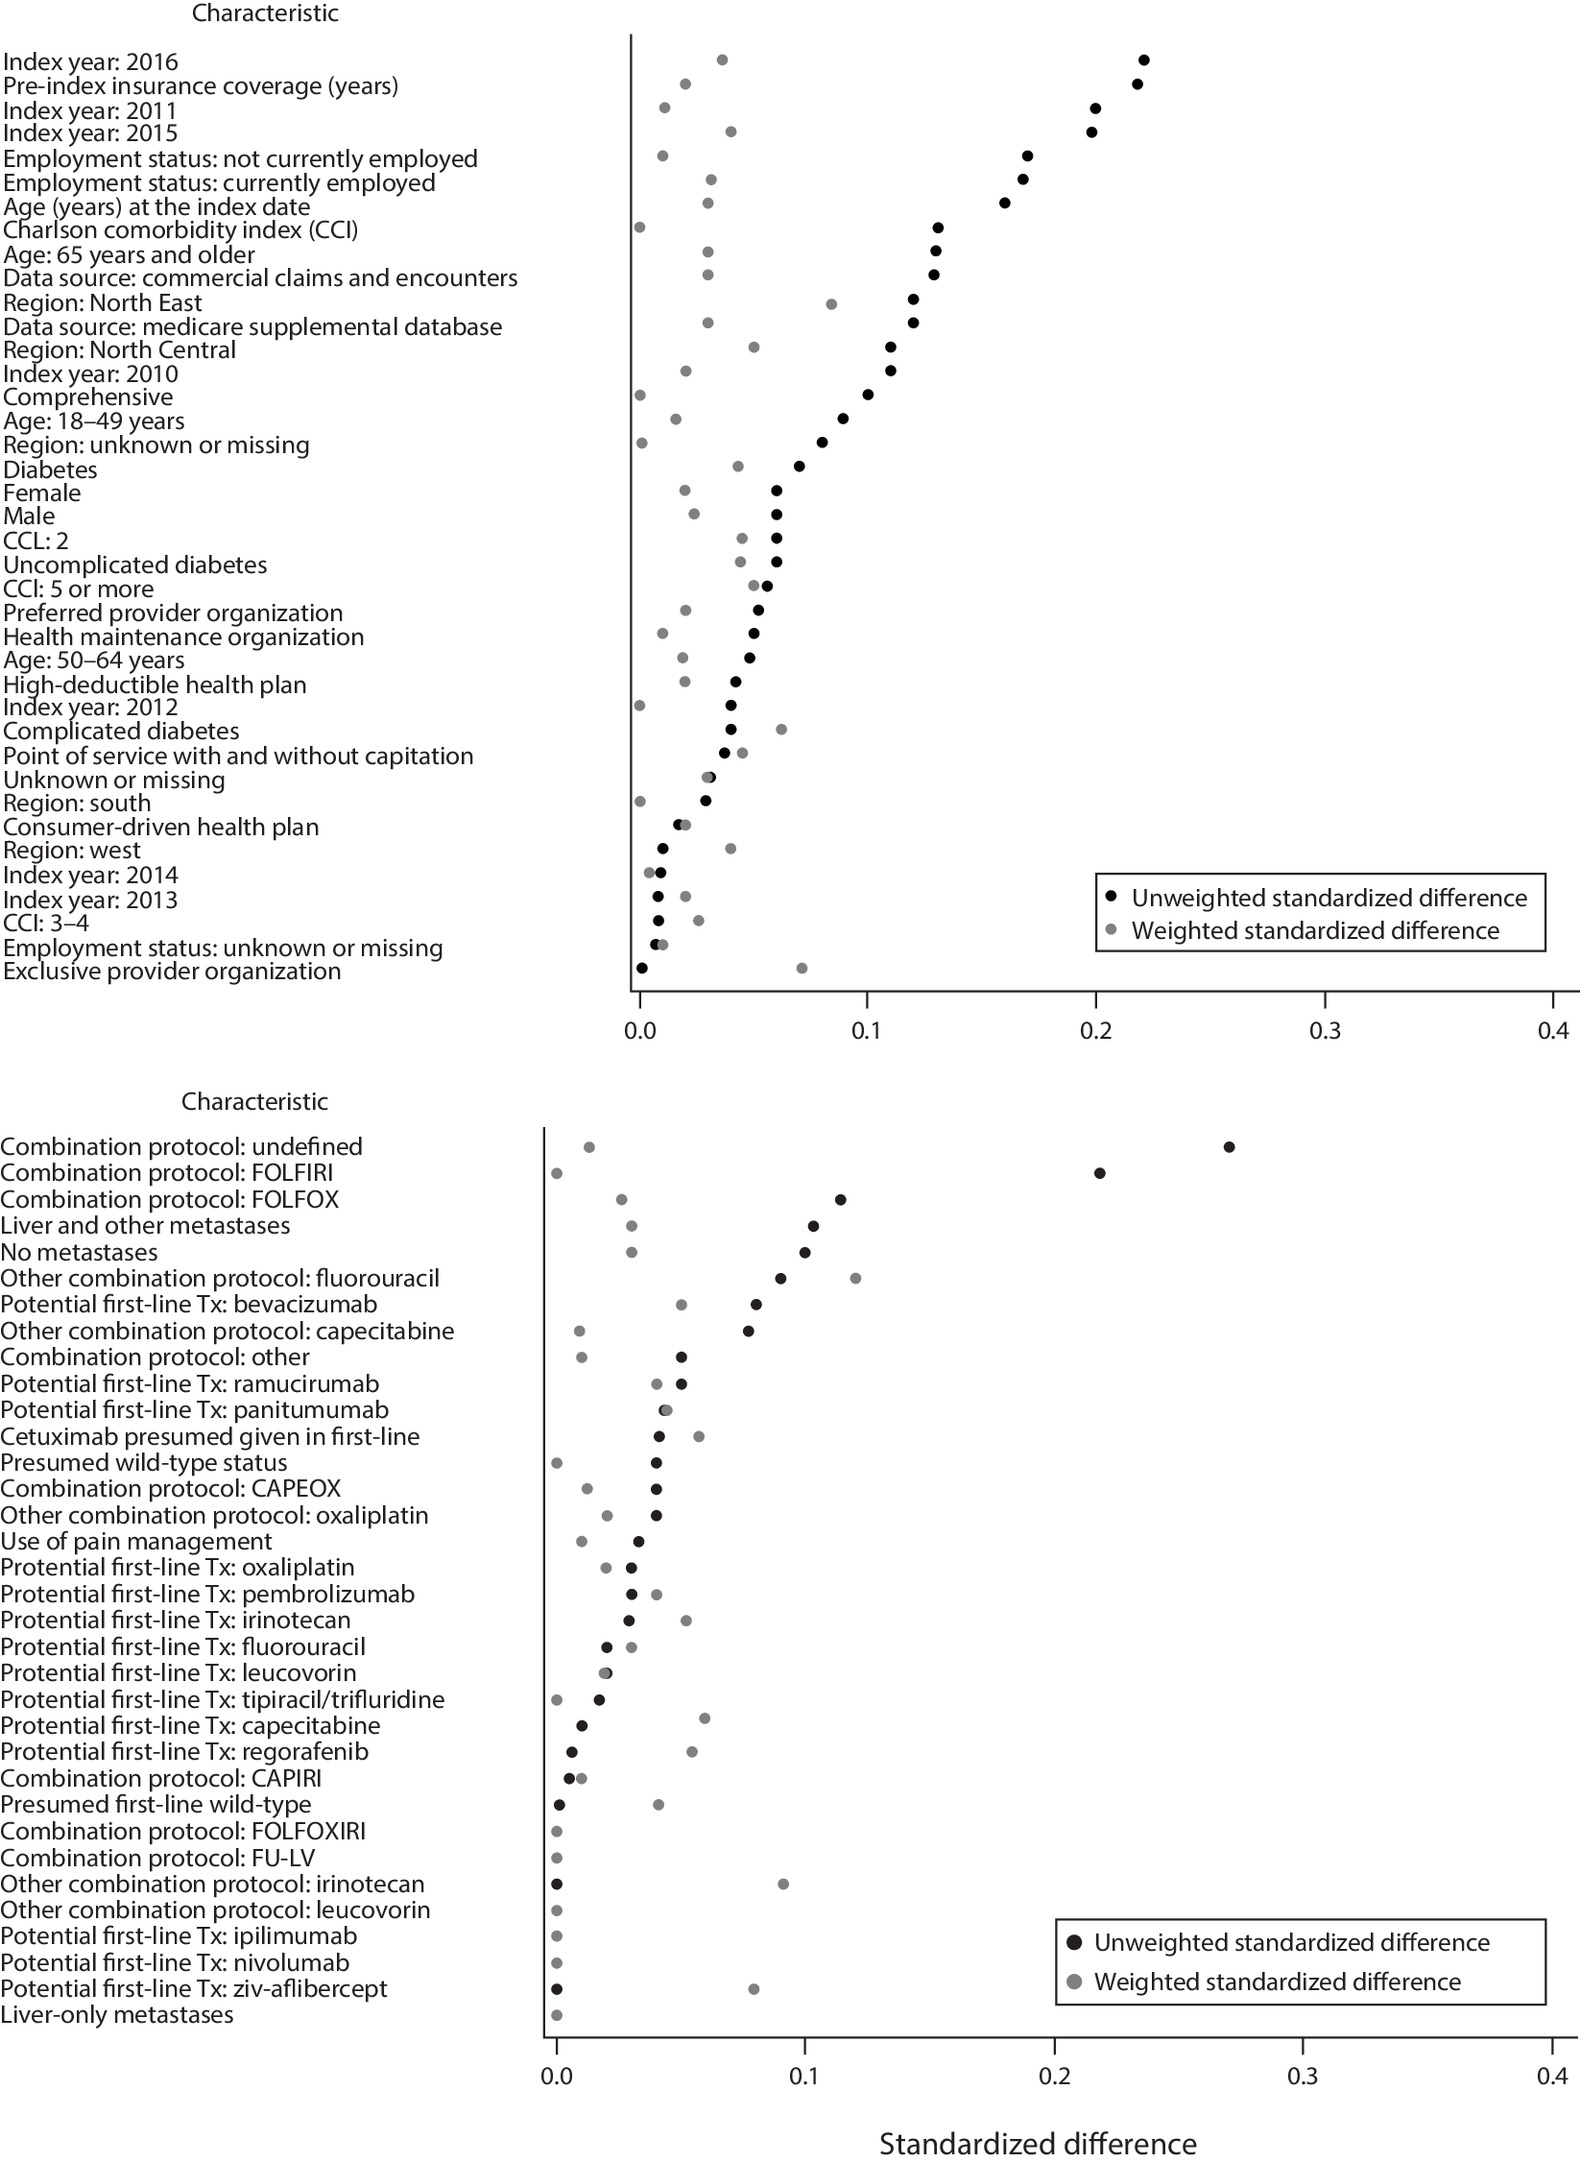
Figure 3. Balancing of baseline characteristics after high-dimensional propensity score for overall survival.
CAPEOX: Capecitabine plus oxaliplatin; CAPIRI: Capecitabine and irinotecan; CT: Chemotherapy; FOLFIRI: Leucovorin calcium (folinic acid), 5-fluorouracil and irinotecan; FOLFOX: Leucovorin calcium (folinic acid), 5-fluorouracil and oxaliplatin; FOLFOXIRI: Leucovorin calcium (folinic acid), 5-fluorouracil, oxaliplatin and irinotecan; FU-LV: 5-fluorouracil and leucovorin calcium (folinic acid).
Effectiveness
With respect to the primary outcome of OS, a total of 1548 deaths were reported, distributed as 987 deaths in the Q1W group and 561 deaths in the Q2W group. The unadjusted hazard ratio for OS between the Q1W and Q2W groups was 1.05 (95% CI: 0.93–1.18), and the weighted hazard ratio based on the trimmed hdPS was 0.94 (95% CI: 0.85–1.03). The inferiority hypothesis was rejected at p < 0.001. The Kaplan–Meier curve for weighted OS is shown in Figure 4. Several sensitivity analyses were conducted to assess the impact of the hypotheses made in the study on the OS outcome, and all analyses led to concordant results with the main analyses (Supplementary Table 1).
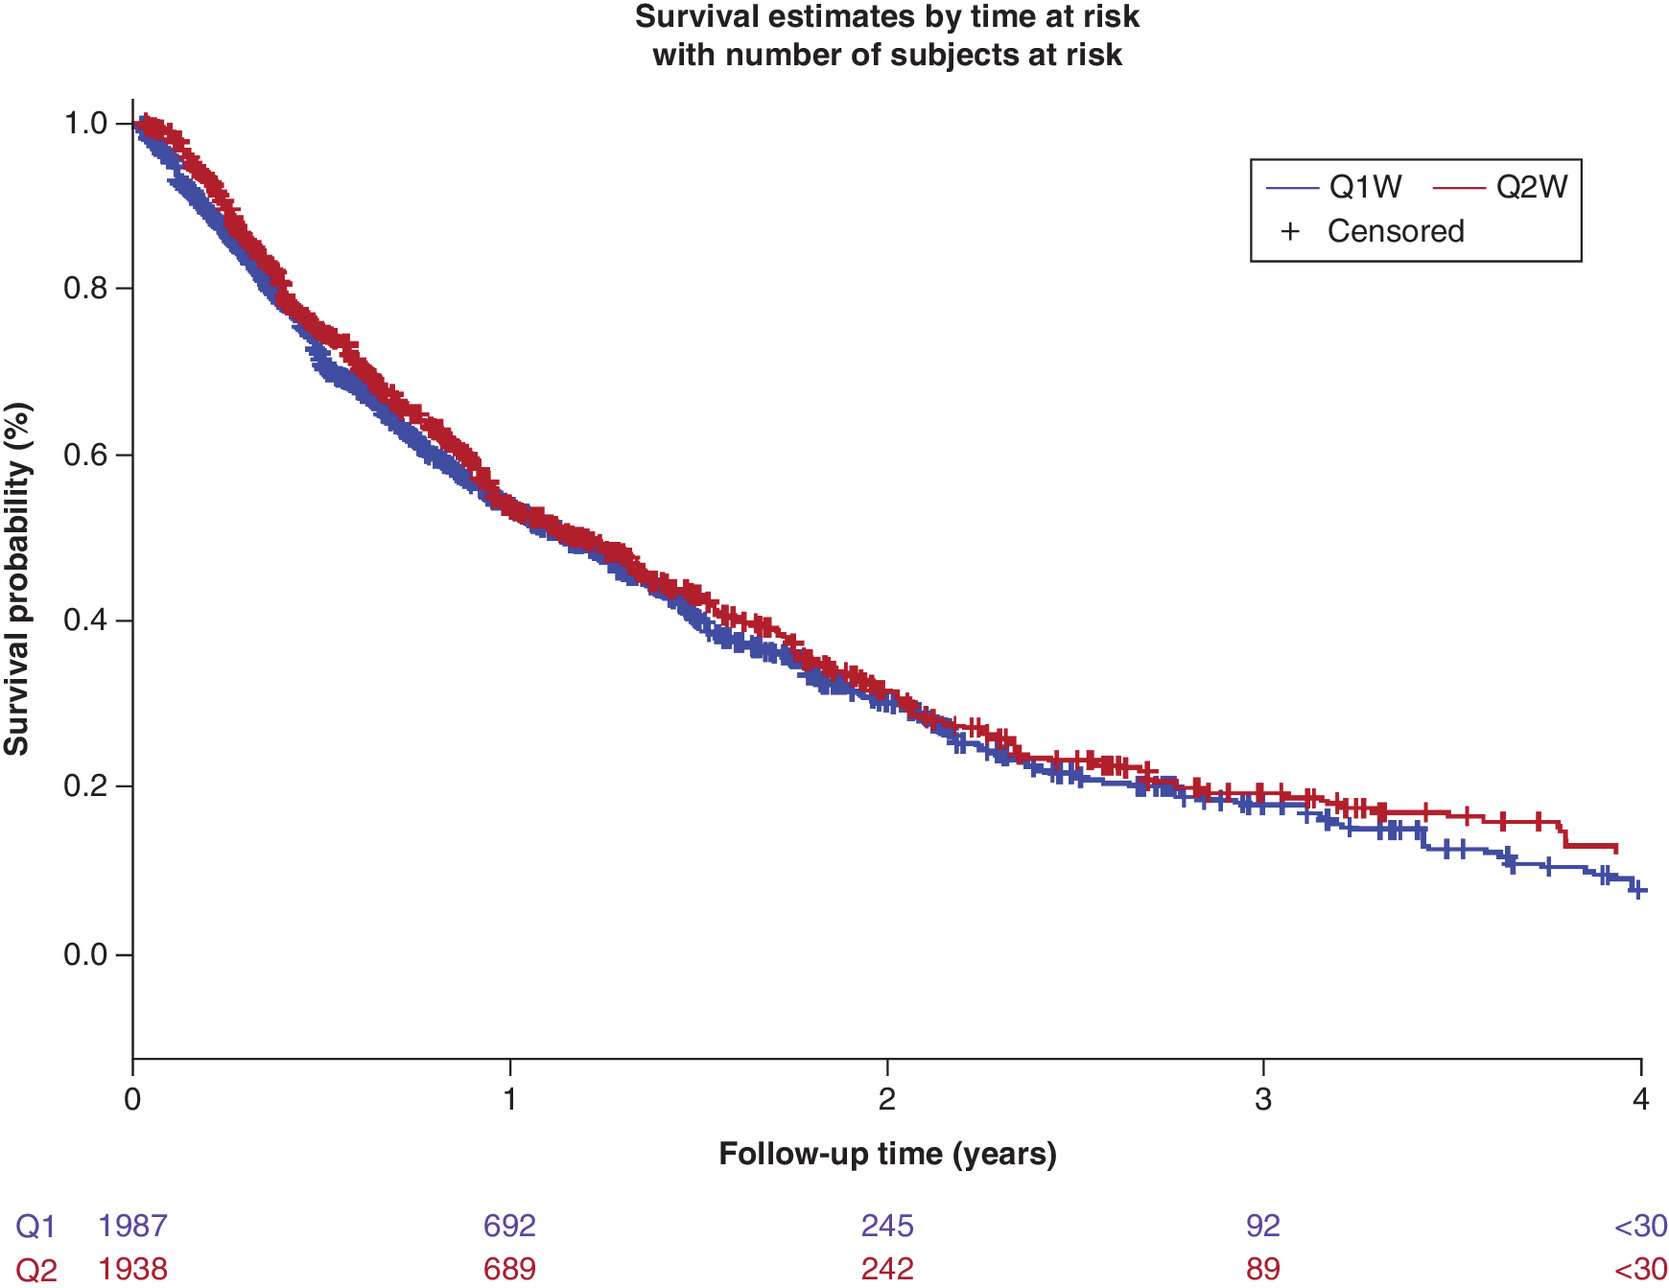
Figure 4. Overall survival curves for patients treated with cetuximab weekly or every 2 weeks in combination with chemotherapy for metastatic colorectal cancer after weighting with inverse probability of treatment.
Weighted for the inverse probability of treatment.
Q1W: Once weekly; Q2W: Every 2 weeks.
With respect to secondary outcomes, there were 1709 discontinuation or death events, distributed as 1077 events in the Q1W group and 632 events in the Q2W group (Table 3). The unadjusted hazard ratio for time to treatment discontinuation between the Q1W and Q2W groups was 1.14 (95% CI: 1.03–1.26), and the weighted hazard ratio was 0.97 (95% CI: 0.89–1.04; p = 0.38). The Kaplan–Meier curve for time to treatment discontinuation after IPTW is shown in Supplementary Figure 2.
| Exposure group | Number of events | Patient-years at risk | Unadjusted hazard ratio (95% CI) | Weighted hazard ratio (95% CI)† | p-value‡ |
|---|---|---|---|---|---|
| Time to treatment discontinuation or death event | |||||
| Q1W | 1077 | 1433 | 1 | 1 | 0.376 |
| Q2W | 632 | 739 | 1.14 (1.03–1.26) | 0.97 (0.89–1.04) | |
| Time to next treatment or death | |||||
| Q1W | 1045 | 1557 | 1 | 1 | 0.119 |
| Q2W | 604 | 852 | 1.06 (0.96–1.18) | 0.94 (0.87–1.02) | |
†
Weighted by the inverse probability of treatment based on a high-dimensional propensity score.
‡
Two-sided test (α = 0.05) against a null hypothesis of 1.
Q1W: Once weekly; Q2W: Every 2 weeks.
There were 1649 patients with a study outcome of either a switch from cetuximab to a subsequent line of treatment or death; among this population, 1045 events occurred in the Q1W group, for 1557 patient-years at risk, and 604 events occurred in the Q2W group, for 852 patient-years at risk (Table 3). The unadjusted hazard ratio for time to next treatment or death between the Q1W and Q2W groups was 1.06 (95% CI: 0.96–1.18), and the weighted hazard ratio was 0.94 (95% CI: 0.87–1.02; p = 0.119). The Kaplan–Meier curve for time to next treatment or death after IPTW is shown in Supplementary Figure 3.
For the presumed 1L subgroup analysis, the average follow-up time for patients in both the Q1W group and the Q2W group was 1.2 years (median: 0.9 year). There were 310 deaths in the Q1W group and 192 deaths in the Q2W group, which gave a sample size that was considered too low to test the noninferiority hypothesis in this subgroup. The unadjusted hazard ratio for OS in this subgroup was 1.10 (95% CI: 0.92–1.31). After weighting, the hazard ratio for OS was 1.05 (95% CI: 0.86–1.29; p = 0.625). The Kaplan–Meier curve for OS in 1L after IPTW is shown in Supplementary Figure 4.
Safety
There was no difference in the incidence of any of the considered safety events between the Q2W and Q1W groups, with the exception of the incidence rate of conjunctivitis, which was lower in the Q2W group compared with the Q1W group, at an incidence rate ratio of 0.55 (95% CI: 0.38–0.81). There was also a reduced incidence rate of IRRs in the Q2W group (mean number of IRRs per patient, 2.0 ± 4.8) relative to the Q1W group (mean number of IRRs per patient, 3.6 ± 7.7; incidence rate ratio, 0.85; 95% CI: 0.78–0.94) (Table 4). However, the decreased rate of IRRs in the Q2W group may have been an artifact resulting from the lower number of infusions in this group (average, 8.1 infusions per patient) versus that in the Q1W group (average, 15.3 infusions per patient). This conclusion is supported by the fact that both groups had similar numbers of IRRs per cetuximab claim (0.2 ± 0.32 events per cetuximab infusion in the Q1W group and 0.2 ± 0.34 events per cetuximab infusion in the Q2W group on average).
| Q1W (n = 763), unadjusted incidence rate (95% CI)† | Q2W (n = 554), unadjusted incidence rate (95% CI)† | Q2W vs Q1W, weighted incidence rate ratio (95% CI)†,‡ | |
|---|---|---|---|
| ≥1 IRR | 61.2 (57.3–65.5) | 49.5 (44.7–55.0) | 0.85 (0.78–0.94) |
| Hypomagnesemia | 87.3 (75.8–100.5) | 88.9 (70.1–112.8) | 1.08 (0.87–1.34) |
| Skin rash | 78.5 (66.8–92.3) | 106.8 (87.1–130.8) | 1.21 (0.98–1.50) |
| Mucositis | 66.3 (50.4–87.2) | 94.0 (70.0–126.3) | 0.89 (0.65–1.21) |
| Headache | 71.0 (57.4–87.8) | 68.4 (51.2–91.3) | 0.81 (0.60–1.09) |
| Conjunctivitis | 72.4 (54.2–96.7) | 54.2 (34.1–86.0) | 0.55 (0.38–0.81) |
| Diarrhea | 87.6 (77.9–98.5) | 92.9 (78.0–110.6) | 1.07 (0.92–1.24) |
| Nausea and vomiting | 91.8 (83.0–101.6) | 97.2 (84.4–111.9) | 0.89 (0.78–1.02) |
| Anorexia and weight loss | 82.3 (66.0–102.6) | 76.3 (55.7–104.4) | 1.30 (0.95–1.78) |
| Any event§ | 83.1 (78.5–88.0) | 78.8 (72.6–85.6) | 0.95 (0.88–1.03) |
†
Per 100 patient-years at risk.
‡
Incidence rate ratio obtained from Poisson regression models adjusted for the inverse probability of treatment weighting based on a high-dimensional propensity score.
§
Patients with a prior safety event were not excluded in this category. All other safety events do not include patients with a safety event that occurred in the 6 months prior to the index date.
IRR: Infusion-related reaction; Q1W: Once weekly; Q2W: Every 2 weeks.
Discussion
Our study provides a head-to-head comparison of two cetuximab administration regimens, Q2W versus Q1W, for the treatment of mCRC, which was conducted using real-world data from the US claims database MarketScan. Classification of exposure relied on the observed number of days between two infusions, and misclassification of exposure was considered limited because the standard duration between two claims usually differed by 2 days compared with the theoretical timeframe of approximately 7 days for the Q1W and 14 days for the Q2W dosing regimens, which could be attributed to the minimal changes in the scheduling of the infusions. As expected, patients treated with cetuximab Q1W or Q2W differed on a limited number of available baseline characteristics; these included status of Medicare coverage, unemployment status and use of ‘unspecified’ chemotherapy in combination with cetuximab, all of which were more frequent in the Q1W group. Backbone chemotherapy also differed between groups, with a higher use of FOLFIRI in the Q2W group. While the objectives and nature of the study did not allow for a detailed exploration of the combination chemotherapies used with each cetuximab infusion schedule, we observed increased use of the Q2W schedule with index year (from 26.9% in 2010 to 51.2% in 2016). Because FOLFIRI was added to the cetuximab label in 2012 [26], it is possible that the increased use of the Q2W schedule corresponded to a period in which the likelihood of receiving FOLFIRI was also increased. Interestingly, the prior receipt of systemic therapy for mCRC did not differ between groups. After IPTW based on the hdPS for the primary objective, no major imbalances remained across groups.
Following the above weighting, the results for OS confirmed the noninferiority of cetuximab Q2W versus Q1W in a line-agnostic setting, with consistent data across all sensitivity analyses, including an analysis considering only inpatient death as a criterion in the algorithm used for death. No differences were identified for any of the additional measures of effectiveness that were examined, such as time to treatment discontinuation or time to next treatment, both of which are increasingly used as proxies for progression-free survival in noninterventional settings [27–29]. Additionally, no significant differences were noted in the rates of predefined safety events between the cetuximab Q1W and Q2W groups, suggesting there was no increased risk for patients receiving the Q2W dosing regimen.
Consistent findings were reported in OS rates with cetuximab Q1W and Q2W dosing regimens in the randomized Central European Cooperative Oncology Group (CECOG) study involving 152 patients with mCRC with KRAS wt tumors, and in a single-center chart review of 50 patients with mCRC initiating treatment with cetuximab between 2004 and 2007 in France [30,31]. In a prospective study conducted in Denmark, similar OS rates were also observed for the cetuximab Q1W and Q2W dosing schedules when administered in the third-line setting in combination with irinotecan [32]. In addition, no significant differences in disease control rate, progression-free survival or toxicities were reported between Q1W and Q2W cetuximab dosing regimens in a retrospective study of 60 Taiwanese patients with mCRC receiving targeted therapy with cetuximab in combination with FOLFIRI chemotherapy [33]. In a retrospective study of 152 Chinese patients with mCRC, a Q2W regimen of cetuximab plus leucovorin calcium (folinic acid), 5-fluorouracil and oxaliplatin (FOLFOX) or capecitabine and oxaliplatin (CAPEOX) demonstrated no difference in OS or progression-free survival, but a higher overall response rate was observed with this Q2W regimen compared with the standard Q1W regimen, and there were no significant differences in the frequency of any grade 3/4 adverse events [34]. More recently, a pooled analysis of patient-level data aiming to test the noninferiority of Q2W versus Q1W cetuximab in terms of OS confirmed noninferiority between the two dosing regimens in the 1L setting [35]. A meta-analysis published in 2020 examining studies directly comparing the efficacy and safety of the Q1W and Q2W schedules also reported equivalent efficacy in terms of objective response rate, disease control rate, progression-free survival and OS [36]. In another report that derived the pharmacokinetic profile of cetuximab from 19 clinical studies in patients with a range of solid tumors, including CRC, the minimal exposure to cetuximab was equivalent for the cetuximab Q1W dose of 250 mg/m2 and the Q2W dose of 500 mg/m2 [18].
Our study has some limitations, particularly with regard to the nature of the data. Due to limitations of the data source in terms of reporting mortality, the primary outcome of our study relied on a proxy for the identification of death [21]. However, there is no reason to believe that this proxy would differentially affect either of the examined dosing schedules; therefore, the relative effectiveness of Q2W versus Q1W is not thought to be affected by a misclassification bias of the outcomes, including that of mortality. Furthermore, the sensitivity analysis restricting the definition of mortality to inpatient discharge diagnoses of death was concordant with the primary analysis.
Similarly, data reported in claims databases rely on the use of proxies for the identification of metastatic disease, which may not fully prevent the inadvertent inclusion of patients who may have been diagnosed with CRC but not mCRC, or of patients who may not have any form of CRC. However, the exclusion of all SCCHN diagnoses and the requirement of ≥1 claim for a combination of cetuximab and chemotherapy aimed to avoid such a misclassification bias. Furthermore, such a bias would have been unlikely to disproportionately impact the two dosing schedules. Another limitation of this study was that KRAS/NRAS mutational status could not be assessed, irrespective of the label being modified during the study period [11]. Interestingly, only 14% of patients had evidence of a claim testing for KRAS mutational status in our sample. This study also had a short follow-up of 1 year; however, as the follow-up time was identical in both groups, it is not expected to have impacted the observation of relative effectiveness. Nonetheless, absolute rates of events should be interpreted with caution.
Another limitation of our study is related to follow-up time, which was short. Patients with malignancy may experience job loss or transition to short- or long-term disability, either of which could lead to periodic termination from the database. However, a sufficient number of events was observed to achieve the power necessary to test the noninferiority hypothesis, and the length of follow-up was similar for both treatment schedules, suggesting this limitation did not differentially impact the study groups.
Conclusion
In summary, this study based on secondary use of real-world data confirmed the noninferiority of cetuximab Q2W versus Q1W for the treatment of mCRC in a line-agonistic setting on OS, as well as on other secondary effectiveness outcomes, including time to treatment discontinuation and time to next treatment or death, which were used as proxies for progression-free survival. Additionally, no significant differences were shown in the rate of selected safety events between cetuximab Q2W and Q1W in combination with chemotherapy. The results suggest that using a Q2W schedule for cetuximab in combination with chemotherapy may offer an alternative to the approved Q1W dosing regimen and may help synchronize the administration of cetuximab and concomitant chemotherapy. Such synchronization could reduce healthcare resource utilization; however, it should be noted that the Q2W schedule described here has not been approved by regulatory authorities and is therefore considered off-label.
•
This study tested the noninferiority of cetuximab administered every 2 weeks (Q2W; n = 951) versus once weekly (Q1W; n = 1779) for the treatment of metastatic colorectal cancer with regard to overall survival as well as time to next treatment, discontinuation, switch and/or death, and incidence rates of selected safety events.
•
This was a cohort study based on secondary use of IBM MarketScan data and included patients treated with cetuximab for metastatic colorectal cancer in combination with chemotherapy in a line-agnostic setting.
•
For each outcome, inverse probability of treatment weighting that included trimming was performed based on a high-dimensional propensity score-based methodology and then used to increase the comparability of baseline characteristics between the two treatment regimens.
•
With respect to the primary outcome of overall survival, the unadjusted hazard ratio between the Q1W and Q2W groups was 1.05 (95% CI: 0.93–1.18), and the weighted hazard ratio based on the trimmed high-dimensional propensity score was 0.94 (95% CI: 0.85–1.03); the inferiority hypothesis was rejected at p < 0.001.
•
No differences were identified between dosing regimens for additional measures of effectiveness such as time to treatment discontinuation and time to next treatment.
•
No significant differences were shown in the rate of selected safety events between cetuximab Q2W and Q1W in combination with chemotherapy.
•
The results suggest that using a Q2W schedule for cetuximab in combination with chemotherapy may offer an alternative to the approved Q1W dosing regimen and may help synchronize the administration of cetuximab and concomitant chemotherapy, which could reduce healthcare resource utilization.
Author contributions
All authors were involved in the conception, design and interpretation of the study. M Batech was responsible for data analysis. All authors contributed to revision of the manuscript.
Financial & competing interests disclosure
This work was funded by Merck KGaA, Darmstadt, Germany. All authors are employees of Merck KGaA, Darmstadt, Germany. The authors have no other relevant affiliations or financial involvement with any organization or entity with a financial interest in or financial conflict with the subject matter or materials discussed in the manuscript apart from those disclosed.
Medical writing assistance was provided by ClinicalThinking, Inc, Hamilton, NJ, USA, and funded by Merck KGaA, Darmstadt, Germany.
Ethical conduct of research
This study used data derived from US-centric administrative claims, which were de-identified and certified as HIPAA compliant per US Code of Federal Regulations (CFR 46.116). According to the CFR, this study meets criteria for a waiver of informed consent for research purposes because 1) the principal risk of the research is a breach of confidentiality, and written informed consent would be the only link between personal data and a participant's identity (CFR 46.117c), and 2) it meets the following 4 points outlined in CFR 46.116: the research risks are minimal, the waiver does not adversely affect the rights and welfare of the participants, the research could not be practicably carried out without the waiver, and it would not be possible to provide participants with additional pertinent information because the research data could not be used to identify them.
Open access
This work is licensed under the Attribution-NonCommercial-NoDerivatives 4.0 Unported License. To view a copy of this license, visit http://creativecommons.org/licenses/by-nc-nd/4.0/
Supplementary Material
File (supplementary materials.docx)
- Download
- 1.42 MB
References
Papers of special note have been highlighted as: • of interest; •• of considerable interest
1.
WHO. Colorectal cancer (2019). https://gco.iarc.fr/today/data/factsheets/cancers/10_8_9-Colorectum-fact-sheet.pdf
2.
Keum N, Giovannucci E. Global burden of colorectal cancer: emerging trends, risk factors and prevention strategies. Nat. Rev. Gastroenterol. Hepatol. 16(12), 713–732 (2019).
3.
Siegel RL, Miller KD, Goding Sauer A et al. Colorectal cancer statistics, 2020. CA Cancer J. Clin. 70(3), 145–164 (2020).
4.
Jemal A, Clegg LX, Ward E et al. Annual report to the nation on the status of cancer, 1975–2001, with a special feature regarding survival. Cancer 101(1), 3–27 (2004).
5.
Vatandoust S, Price TJ, Karapetis CS. Colorectal cancer: metastases to a single organ. World J. Gastroenterol. 21(41), 11767–11776 (2015).
6.
Siegel RL, Miller KD, Fedewa SA et al. Colorectal cancer statistics, 2017. CA Cancer J. Clin. 67(3), 177–193 (2017).
7.
National Comprehensive Cancer Network. Colon cancer (Version 4.2020). NCCN (2020). https://www.nccn.org/professionals/physician_gls/pdf/colon.pdf
8.
National Comprehensive Cancer Network. Rectal cancer (Version 6.2020) (2020). https://www.nccn.org/professionals/physician_gls/pdf/rectal.pdf
9.
García-Foncillas J, Sunakawa Y, Aderka D et al. Distinguishing features of cetuximab and panitumumab in colorectal cancer and other solid tumors. Front. Oncol. 9, 849 (2019).
10.
Dekker E, Tanis PJ, Vleugels JLA et al. Colorectal cancer. Lancet 394(10207), 1467–1480 (2019).
11.
Erbitux (cetuximab). Prescribing information (2019). https://www.accessdata.fda.gov/drugsatfda_docs/label/2019/125084s273lbl.pdf
12.
Erbitux, INN-cetuximab. Summary of product characteristics (2009). https://www.ema.europa.eu/en/documents/product-information/erbitux-epar-product-information_en.pdf
13.
Cunningham D, Humblet Y, Siena S et al. Cetuximab monotherapy and cetuximab plus irinotecan in irinotecan-refractory metastatic colorectal cancer. N. Engl. J. Med. 351(4), 337–345 (2004).
14.
Sobrero AF, Maurel J, Fehrenbacher L et al. EPIC: Phase III trial of cetuximab plus irinotecan after fluoropyrimidine and oxaliplatin failure in patients with metastatic colorectal cancer. J. Clin. Oncol. 26(14), 2311–2319 (2008).
15.
Wilke H, Glynne-Jones R, Thaler J et al. Cetuximab plus irinotecan in heavily pretreated metastatic colorectal cancer progressing on irinotecan: MABEL Study. J. Clin. Oncol. 26(33), 5335–5343 (2008).
16.
Bokemeyer C, Bondarenko I, Makhson A et al. Fluorouracil, leucovorin, and oxaliplatin with and without cetuximab in the first-line treatment of metastatic colorectal cancer. J. Clin. Oncol. 27(5), 663–671 (2009).
17.
Van Cutsem E, Köhne CH, Hitre E et al. Cetuximab and chemotherapy as initial treatment for metastatic colorectal cancer. N. Engl. J. Med. 360(14), 1408–1417 (2009).
18.
Tabernero J. Pfeiffer P, Cervantes A. Administration of cetuximab every 2 weeks in the treatment of metastatic colorectal cancer: an effective, more convenient alternative to weekly administration? Oncologist 13(2), 113–119 (2008).
• Derived the pharmacokinetics of cetuximab 250 mg/m2 Q1W vs 500 mg/m2 Q2W from 19 clinical studies of patients with various solid tumor types, including colorectal cancer (CRC).
19.
National Institute for Health and Care Excellence. Cetuximab and panitumumab for previously untreated metastatic colorectal cancer (2017). https://www.nice.org.uk/Guidance/ta439
20.
Phelip JM, Tougeron D, Léonard D et al. Metastatic colorectal cancer (mCRC): french intergroup clinical practice guidelines for diagnosis, treatments and follow-up (SNFGE, FFCD, GERCOR, UNICANCER, SFCD, SFED, SFRO, SFR). Dig. Liver Dis. 51(10), 1357–1363 (2019).
21.
Song X, Zhao Z, Barber B et al. Characterizing medical care by disease phase in metastatic colorectal cancer. Am. J. Manag. Care 17(Suppl. 5 Developing), SP20–SP25 (2011).
• Defines an algorithm used to define a proxy for death based on an assessment of patterns and costs of medical care by phase of metastatic CRC disease.
22.
Foley KA, Wang PF, Barber BL et al. Clinical and economic impact of infusion reactions in patients with colorectal cancer treated with cetuximab. Ann. Oncol. 21(7), 1455–1461 (2010).
• Describes incidence rates of cetuximab-related infusion reactions requiring medical intervention in clinical practice.
23.
Rothmann M, Li N, Chen G, Chi GY et al. Design and analysis of non-inferiority mortality trials in oncology. Stat. Med. 22(2), 239–264 (2003).
•• Presents noninferiority analyses that do not require a fixed margin, but rather compare 95% two-sided confidence intervals to assess differences between the treatment and the control.
24.
Van Helden EJ, Menke-van der Houven van Oordt CW, Heymans MW et al. Optimal use of anti-EGFR monoclonal antibodies for patients with advanced colorectal cancer: a meta-analysis. Cancer Metastasis Rev. 36(2), 395–406 (2017).
• Comprehensive meta-analysis of 17 randomized clinical trials to determine the optimal use of anti-EGFR antibodies for the treatment of metastatic CRC.
25.
Schneeweiss S, Rassen JA, Glynn RJ et al. High-dimensional propensity score adjustment in studies of treatment effects using health care claims data. Epidemiology 20(4), 512–522 (2009).
• Describes a high-dimensional propensity score to improve effect estimates compared with adjustment using predefined covariates.
26.
Erbitux (cetuximab). Prescribing information (2012). https://www.accessdata.fda.gov/drugsatfda_docs/label/2012/125084s225lbl.pdf
27.
Blumenthal GM, Gong Y, Kehl KL et al. Analysis of time-to-treatment discontinuation of targeted therapy, immunotherapy, and chemotherapy in clinical trials of patients with non-small-cell lung cancer. Ann. Oncol. 30(5), 830–838 (2019).
28.
Gong Y, Kehl KL, Oxnard GR et al. Time to treatment discontinuation (TTD) as a pragmatic endpoint in metastatic non-small cell lung cancer (mNSCLC): a pooled analysis of 8 trials. J. Clin. Oncol. 36(Suppl. 15), 9064–9064 (2018).
29.
Hari P, Romanus D, Palumbo A et al. Prolonged duration of therapy is associated with improved survival in patients treated for relapsed/refractory multiple myeloma in routine clinical care in the United States. Clin. Lymphoma Myeloma Leuk. 18(2), 152–160 (2018).
30.
Brodowicz T, Ciuleanu TE, Radosavljevic D et al. FOLFOX4 plus cetuximab administered weekly or every second week in the first-line treatment of patients with KRAS wild-type metastatic colorectal cancer: a randomized Phase II CECOG study. Ann. Oncol. 24(7), 1769–1777 (2013).
31.
Mrabti H, De la Fouchardiere C, Desseigne F et al. Irinotecan associated with cetuximab given every 2 weeks versus cetuximab weekly in metastatic colorectal cancer. J. Cancer Res. Ther. 5(4), 272–276 (2009).
32.
Pfeiffer P, Nielsen D, Bjerregaard J et al. Biweekly cetuximab and irinotecan as third-line therapy in patients with advanced colorectal cancer after failure to irinotecan, oxaliplatin and 5-fluorouracil. Ann. Oncol. 19(6), 1141–1145 (2008).
33.
Yeh Y, Chiang C, Chem C et al. Efficacy and safety of weekly and biweekly cetuximab-combined FOLFIRI regimen as first-line setting in patients with metastatic colorectal cancer: experience in a southern Taiwan medical center. J. Soc. Colon Rectal Surgeon (Taiwan). 21, 59–68 (2010).
34.
Yu Y, Zhang W, Sun Y et al. FOLFOX/XELOX plus cetuximab administered weekly versus biweekly as a first-line treatment for patients with KRAS/RAS wild-type metastatic colorectal cancer: a retrospective study. Chinese J. Clin. Oncol. 32, 105 (2018).
35.
Kasper S, Cheng A, Overkamp F et al. Noninferiority on overall survival of every-2-weeks vs weekly schedule of cetuximab for first-line treatment of RAS wild-type metastatic colorectal cancer. Ann. Oncol. 30(Suppl. 5), v220–v221 (2019).
• Pooled analysis of patient-level data from five primary data collection studies demonstrating noninferiority of cetuximab Q2W to Q1W in a 1L setting.
36.
Matsuda A, Yamada T, Jamjittrong S et al. Comparison between biweekly and weekly cetuximab in patients with metastatic colorectal cancer: a meta-analysis. Anticancer Res. 40(6), 3469–3476 (2020).
Information & Authors
Information
Published In
Pages: 1117 - 1129
PubMed: 33118841
Copyright
© 2020 Merck KGaA, Darmstadt, Germany. This work is licensed under the Attribution-NonCommercial-NoDerivatives 4.0 Unported License
History
Received: 30 June 2020
Accepted: 4 September 2020
Published online: 29 October 2020
Keywords:
Topics
Authors
Metrics & Citations
Metrics
Article Usage
Article usage data only available from February 2023. Historical article usage data, showing the number of article downloads, is available upon request.
Citations
How to Cite
Comparative effectiveness of weekly versus every-2-weeks cetuximab in metastatic colorectal cancer in a US-insured population. (2020) Journal of Comparative Effectiveness Research. DOI: 10.2217/cer-2020-0132
Export citation
Select the citation format you wish to export for this article or chapter.
Citing Literature
- Carsten Bokemeyer, Fortunato Ciardiello, Olivier Dubreuil, Joel Guigay, Stefan Kasper, Per Pfeiffer, Carmine Pinto, Kensei Yamaguchi, Takayuki Yoshino, Christoph Zielinski, Regina Esser, Josep Tabernero, Cetuximab Every 2 Weeks Versus Standard Weekly Dosing Administration Schedule, Future Oncology, 10.2217/fon-2023-0282, 20, 7, (393-407), (2023).
- Himani Aggarwal, Yimei Han, Kristin M Sheffield, Zhanglin Lin Cui, Real-world comparison between weekly versus biweekly dosing of cetuximab for metastatic colorectal cancer, Journal of Comparative Effectiveness Research, 10.2217/cer-2022-0143, 12, 2, (2023).
- Liang Zhang, He Li, TianFu Wang, RuiXin Wang, Long Cheng, Gang Wang, Real-World Study: A Powerful Tool for Malignant Tumor Research in General Surgery, Cancers, 10.3390/cancers14215408, 14, 21, (5408), (2022).
- Chris P Pescott, Emmanuelle Boutmy, Michael Batech, Philippe Ronga, Francois-Xavier Lamy, Real-world healthcare resource utilization and costs of weekly versus every-2-week cetuximab in metastatic colorectal cancer, Journal of Comparative Effectiveness Research, 10.2217/cer-2020-0232, 10, 5, (353-364), (2021).