Lenvatinib versus sorafenib for unresectable hepatocellular carcinoma: a cost–effectiveness analysis
Publication: Journal of Comparative Effectiveness Research
Abstract
Aim: To investigate the cost–effectiveness of lenvatinib and sorafenib in the treatment of patients with nonresected hepatocellular carcinoma in China. Materials & methods: Markov model was used to simulate the direct medical cost and quality-adjusted life years (QALY) of patients with hepatocellular carcinoma. Clinical data were derived from the Phase 3 randomized clinical trial in a Chinese population. Results: Sorafenib treatment resulted in 1.794 QALYs at a cost of $43,780.73. Lenvatinib treatment resulted in 2.916 QALYs for patients weighing <60 and ≥60 kg at a cost of $57,049.43 and $75,900.36, The incremental cost–effectiveness ratio to the sorafenib treatment group was $11,825.94/QALY and $28,627.12/QALY, respectively. Conclusion: According to WHO’s triple GDP per capita, the use of lenvatinib by providing drugs is a cost-effective strategy.
In 2018, hepatocellular carcinoma (HCC) is expected to be the sixth most common cancer type and the fourth major cause of cancer death in the world with 841,000 new cases and 782,000 deaths each year [1]. Nearly 50% of the world’s HCC patients are from China, which has the highest number of new cases and deaths of HCC in the world [2]. Latest statistics show that primary HCC has jumped to the secondary cause of death in China, which is a serious threat to people’s lives and health [3–5]. The pathological type of primary carcinoma of the liver is mainly HCC, accounting for 85–95% [6]. The most important influencing factors of HCC in China are chronic hepatitis B virus (HBV) infection and eating of food contaminated with aflatoxin [1]. The incidence of HCC is hidden, most patients are no longer able to receive radical surgical treatment at the time of diagnosis, and drug therapy has become one of the important methods of HCC treatment.
Lenvatinib was approved for listing in China in September 2018, which provides new options for the first-line treatment of HCC patients. Only sorafenib and lenvatinib have been approved for the first-line treatment of advanced HCC molecular targeted drugs. REFELECT is a global multicenter, randomized, open and noninferior Phase III clinical trial [7]. Lenvatinib’s overall survival (OS) improvement is not inferior to sorafenib, progression-free survival (PFS), time to progress and objective response rate values were significantly better for lenvatinib than for sorafenib. The China subgroup data [8,9] showed lenvatinib’s OS was significantly better by 4.8 months (15.0 vs 10.2 months) compared with that of sorafenib. In addition, lenvatinib was significantly better than sorafenib at the three secondary end points of PFS (9.2 vs 3.6 months), time to progress (11.0 vs 3.7 months) and objective response rate (21.5 vs 8.3%). For patients with HBV infection, lenvatinib has a more significant advantage than sorafenib (OS: 14.9 vs 9.9 months). Lenvatinib has shown better effectiveness in the Chinese population, it may be due to Chinese patients mostly in combination with HBV, cirrhosis and other basic liver diseases.
In 2017, China’s National Healthcare Security Administration included sorafenib into the scope of healthcare payments based on medical insurance/drug catalog access negotiations [10]. Sorafenib prices fell sharply, thus greatly reducing the financial burden of patients. Even so, the high prices of sorafenib and lenvatinib still limit their widespread use, especially in areas with limited health resources. Several studies focused on the cost effects of sorafenib and chemotherapy programs, lenvatinib and sorafenib still do not have an economic evaluation [11–13]. Therefore, medical decision-makers, patients and doctors are very interested in the selection of first-line targeted treatment options for advanced HCC.
This study aimed to evaluate the cost–effectiveness of lenvatinib compared with sorafenib for the first-line treatment of Chinese nonresected HCC patients, to build models based on the recommendations of the latest clinical guidelines, and to explore the cost effects of lenvatinib by using the latest clinical efficacy data. Subsequently, we aimed to provide reference for dynamic adjustment, patent drug negotiation and clinical decision-making of medical insurance catalog.
Materials & methods
Model structure
Based on the perspective of China’s health service system, this study analyzed the clinical and economic output of the two treatment options of lenvatinib and sorafenib by constructing a dynamic Markov model. The included population was previously untreated, nonresected patients with advanced HCC, liver function with Child–Pugh score graded as A or better B (≤7). The Markov model structure consisted of three states, PFS, progressed survival (PS) and death (Figure 1) [14]. Patients were in PFS at the initial stage of the model, and each cycle was left in PFS or converted to PS according to the transfer probability. Entering PS can only be in PS or into a state of death. Patients received treatment until the disease progressed. After progress, the patients entered the best support treatment. According to clinical research and treatment options, the cycle of the model was set to 1 month. After 10 years of model operation, all patients were in a state of death, and the study duration is set to 10 years to fully present the benefits of the two treatment options. All cost units were converted to USD with an average RMB exchange rate of $1–6.6174 Yuan for the full year of 2018 [15]. TreeAge2015 software was used to build the Markov model to calculate the incremental cost–effectiveness ratio (ICER) of all parameters after substituting all parameters. The ICER is the cost per additional quality-adjusted life year (QALY) gained. This study used the following formula to calculate the ICER: [16]

Clinical data
Clinical efficacy data were obtained from a multicenter, open-label, randomized Phase III clinical trial (REFLECT study of Chinese population subgroup) [8,9]. This study was a head-to-head study on lenvatinib and sorafenib for HCC. The individual level data of all Kaplan–Meier curves were reconstructed using the GetData Graph Digitizer software (version 2.26). Survival analysis was also adopted to fit the data. Weibull distribution can fit the survival data well. Therefore, through Kaplan–Meier curve fitting and extrapolation, the nonprogress probability and survival probability of the patient’s lifespan at every time point t were estimated. According to Weibull distribution, the survival probability at t was S(t) = exp(-λtγ), and the transition probability was P(t) = 1 - exp[λ(t - 1)γ - λtγ] given that the model cycle was t [17–20]. The final survival models chosen were based on the goodness of fit measured using the r2 statistic [21]. Weibull distribution parameter scale parameter λ and shape parameter γ were shown in Table 1.
| Input parameter | Value | [Ref.] | |
|---|---|---|---|
| Lenvatinib | Sorafenib | ||
| Weibull survival model | |||
| – PFS | Scale = 0.040493; shape = 1.200305; r2 = 0.9878513 | Scale = 0.125796; Shape = 0.979883; r2 = 0.9115187 | [8,9] |
| – OS | Scale = 0.0146642; shape = 1.3568686; r2 = 0.9882742 | Scale = 0.039869; Shape = 1.119715; r2 = 0.9671524 | [8,9] |
| Quality of life | |||
| – Utility of PFS | 0.832 | 0.837 | [22] |
| – Utility of PS | 0.714 | 0.714 | [22] |
| Incidence of SAE | [9] | ||
| – Nausea + vomiting | 6% | 8% | |
| – AST/ALT abnormal | 20% | 22% | |
| – Anorexia | 3% | 0% | |
| – Bilirubin abnormal | 12% | 10% | |
| – Fatigue | 3% | 2% | |
| – Diarrhea | 2% | 3% | |
| – HFSR | 1% | 7% | |
| – Rash | 0% | 1% | |
| – Hypertension | 23% | 15% | |
| – Bone marrow suppression | 37 | 19% | |
HFSR: Hand-foot skin reaction; OS: Overall survival; PFS: Progression-free survival; PS: Progressed survival; SAE: Serious adverse event (≥grade 3).
Cost & utility
This study was based on the perspective of the health service system and considered only the cost of direct medical care. We assumed a 3% annual discount rate for both costs and outcomes [17]. The direct medical costs in the model included the following: drug costs, follow-up costs (including inspection and inspection fees), costs for severe adverse reaction treatment and costs for postprogression of the disease. The sorafenib fee used the Medicare payment standard established by the China National Healthcare Security Administration’s Medicare drug catalog access negotiation, which was administered daily orally to 800 mg [6,10]. Lenvatinib costs were calculated based on the retail prices and the China primary healthcare foundation donation policy. For low-income population, the full self-funded continuous medication for 2 months can help them obtain 2 months of assistance drugs. Subsequent patients can obtain drug assistance until the progression of the disease after 2 months of continuous medication fully at their own expense, with assistance for no more than 10 months. For patients weighing <60 kg, lenvatinib was administered orally daily for 8 and 12 mg for patients weighing ≥60 kg [6]. The above programs were carried out until the progression of the disease or the emergence of intolerant toxicity. The model assumed no significant change in the weight of the patient during treatment. Serious adverse reactions only considered the adverse reactions of level 3 and above, and the incidence of adverse reactions were obtained from the REFLECT study of Chinese population subgroups. The formula for adverse reaction cost is as follows: cost of serious adverse events per cycle × probability of serious adverse events in related treatment program [23]. Other cost data were derived from relevant published literature.
The health utility values of three states were derived from the study of Kobayashi [22], and the utility values of lenvatinib and sorafenib PFS were 0.832 and 0.837, respectively. The utility value considered the effects of the two groups of adverse events. The utility value of both groups in the PS state was 0.714. Cost and utility model input data are shown in Tables 1 & 2.
| Input parameter | Value | PSA distribution | [Ref.] |
|---|---|---|---|
| Cost of sorafenib per day (US $) | 122.71 | Gamma | Negotiated price |
| Cost of lenvatinib per day(<60 kg) | 169.25 (11.55, 28.88) | Gamma | Local charge |
| Cost of lenvatinib per day (≥60 kg) | 253.88 (13.97, 34.92) | Gamma | Local charge |
| Cost of the PF state | 345.58 | Gamma | [11] |
| Cost of follow-up per cycle (US $) | 481.81 | Gamma | [11] |
| Cost of SAEs for lenvatinib per cycle | 96.49 | Gamma | |
| Cost of SAEs for sorafenib per cycle | 74.44 | Gamma | |
| – Cost of nausea + vomiting | 65 | [12] | |
| – Cost of AST/ALT abnormal | 59 | [12] | |
| – Cost of anorexia | 26 | [12] | |
| – Cost of bilirubin abnormal | 349 | [12] | |
| – Cost of fatigue | 3 | [12] | |
| – Cost of diarrhea | 13 | [12] | |
| – Cost of HFSR | 4 | [12] | |
| – Cost of rash | 7 | [12] | |
| – Cost of hypertension | 37 | [12] | |
| – Cost of bone marrow suppression | 79 | [12] |
HFSR: Hand-foot skin reaction; PF: Progression free; PS: Progressed survival; PSA: Probabilistic sensitivity analysis; SAE: Serious adverse event (≥grade 3).
Basic & sensitivity analysis
A Markov queue model was established to evaluate the QALYs and lifetime costs of HCC patients. By calculating the ICER, cost utility analysis was carried out by comparing it with the threshold value. The cost utility threshold for HCC patients in China has not yet been determined. According to the WHO triple GDP per capita [24,25], when the ICER is less than the triple GDP per capita, the increased cost is acceptable. Otherwise, the increased cost is not worth it. This study will take 2018 China’s triple GDP per capita of ($29,306.37) as the threshold value.
In order to test the influence of the variables on the results of cost–effectiveness analysis, one-way sensitivity analysis was carried out for all the parameters of input Markov model. The results are presented using a tornado diagram. The range of drug price changes is limited by decreasing trend of 20%. When the range of other parameters was unattainable, the variation range was ±20%. In addition, probabilistic sensitivity analysis was carried out using second order Monte Carlo simulation. Based on the different distribution assumptions of each parameter, 1000-times of sampling were repeated, and the two treatment schemes were calculated based on the ICER value of each sample, which were presented using a scatter plot. The results of the probabilistic sensitivity analysis are presented by the cost–effectiveness acceptable curve.
Results
Basic analysis
Basic analysis results in Table 3 shows that the QALY of lenvatinib (2.916 QALYs) is 1.122 QALYs higher than that of sorafenib (1.794 QALYs). For patients weighing <60 kg, lenvatinib lifetime medical expenses ($57,049.43) was $13,267.70 higher than that of sorafenib ($43,780.73) and the ICER value is $11,825.94/QALY. For patients weighing ≥60 kg, lenvatinib lifetime medical expenses ($75,900.36) was $32,119.63 higher than that of sorafenib ($43,780.73) and ICER value is $28,627.12/QALY. The ICER values are lower than China’s triple GDP per capita threshold in 2018 ($29,306.37).
| Strategy | Costs ($) | QALYs | ΔCosts ($) | ΔQALYs | ICER ($/QALY) |
|---|---|---|---|---|---|
| Sorafenib | 43780.73 | 1.794 | † | † | † |
| Lenvatinib (<60 kg) | 57049.43 | 2.916 | 13268.70‡ | 1.122‡ | 11825.94‡ |
| Lenvatinib (≥60 kg) | 75900.36 | 2.916 | 32119.63‡ | 1.122‡ | 28627.12‡ |
†
No comparison.
‡
Compared with sorafenib.
ICER: Incremental cost–effectiveness ratio; QALY: Quality-adjusted life years.
Sensitivity analysis
One-way sensitivity analyses found that for patients weighing <60 kg, the lenvatinib and sorafenib price, the utility of PFS and PS and the cost of postprogression treatment were the main influencing factors. For patients weighing ≥60 kg, lenvatinib price has the greatest effect on the result followed by utility and sorafenib price. The tornado diagram of one-way sensitivity analyses is shown in Figure 2.
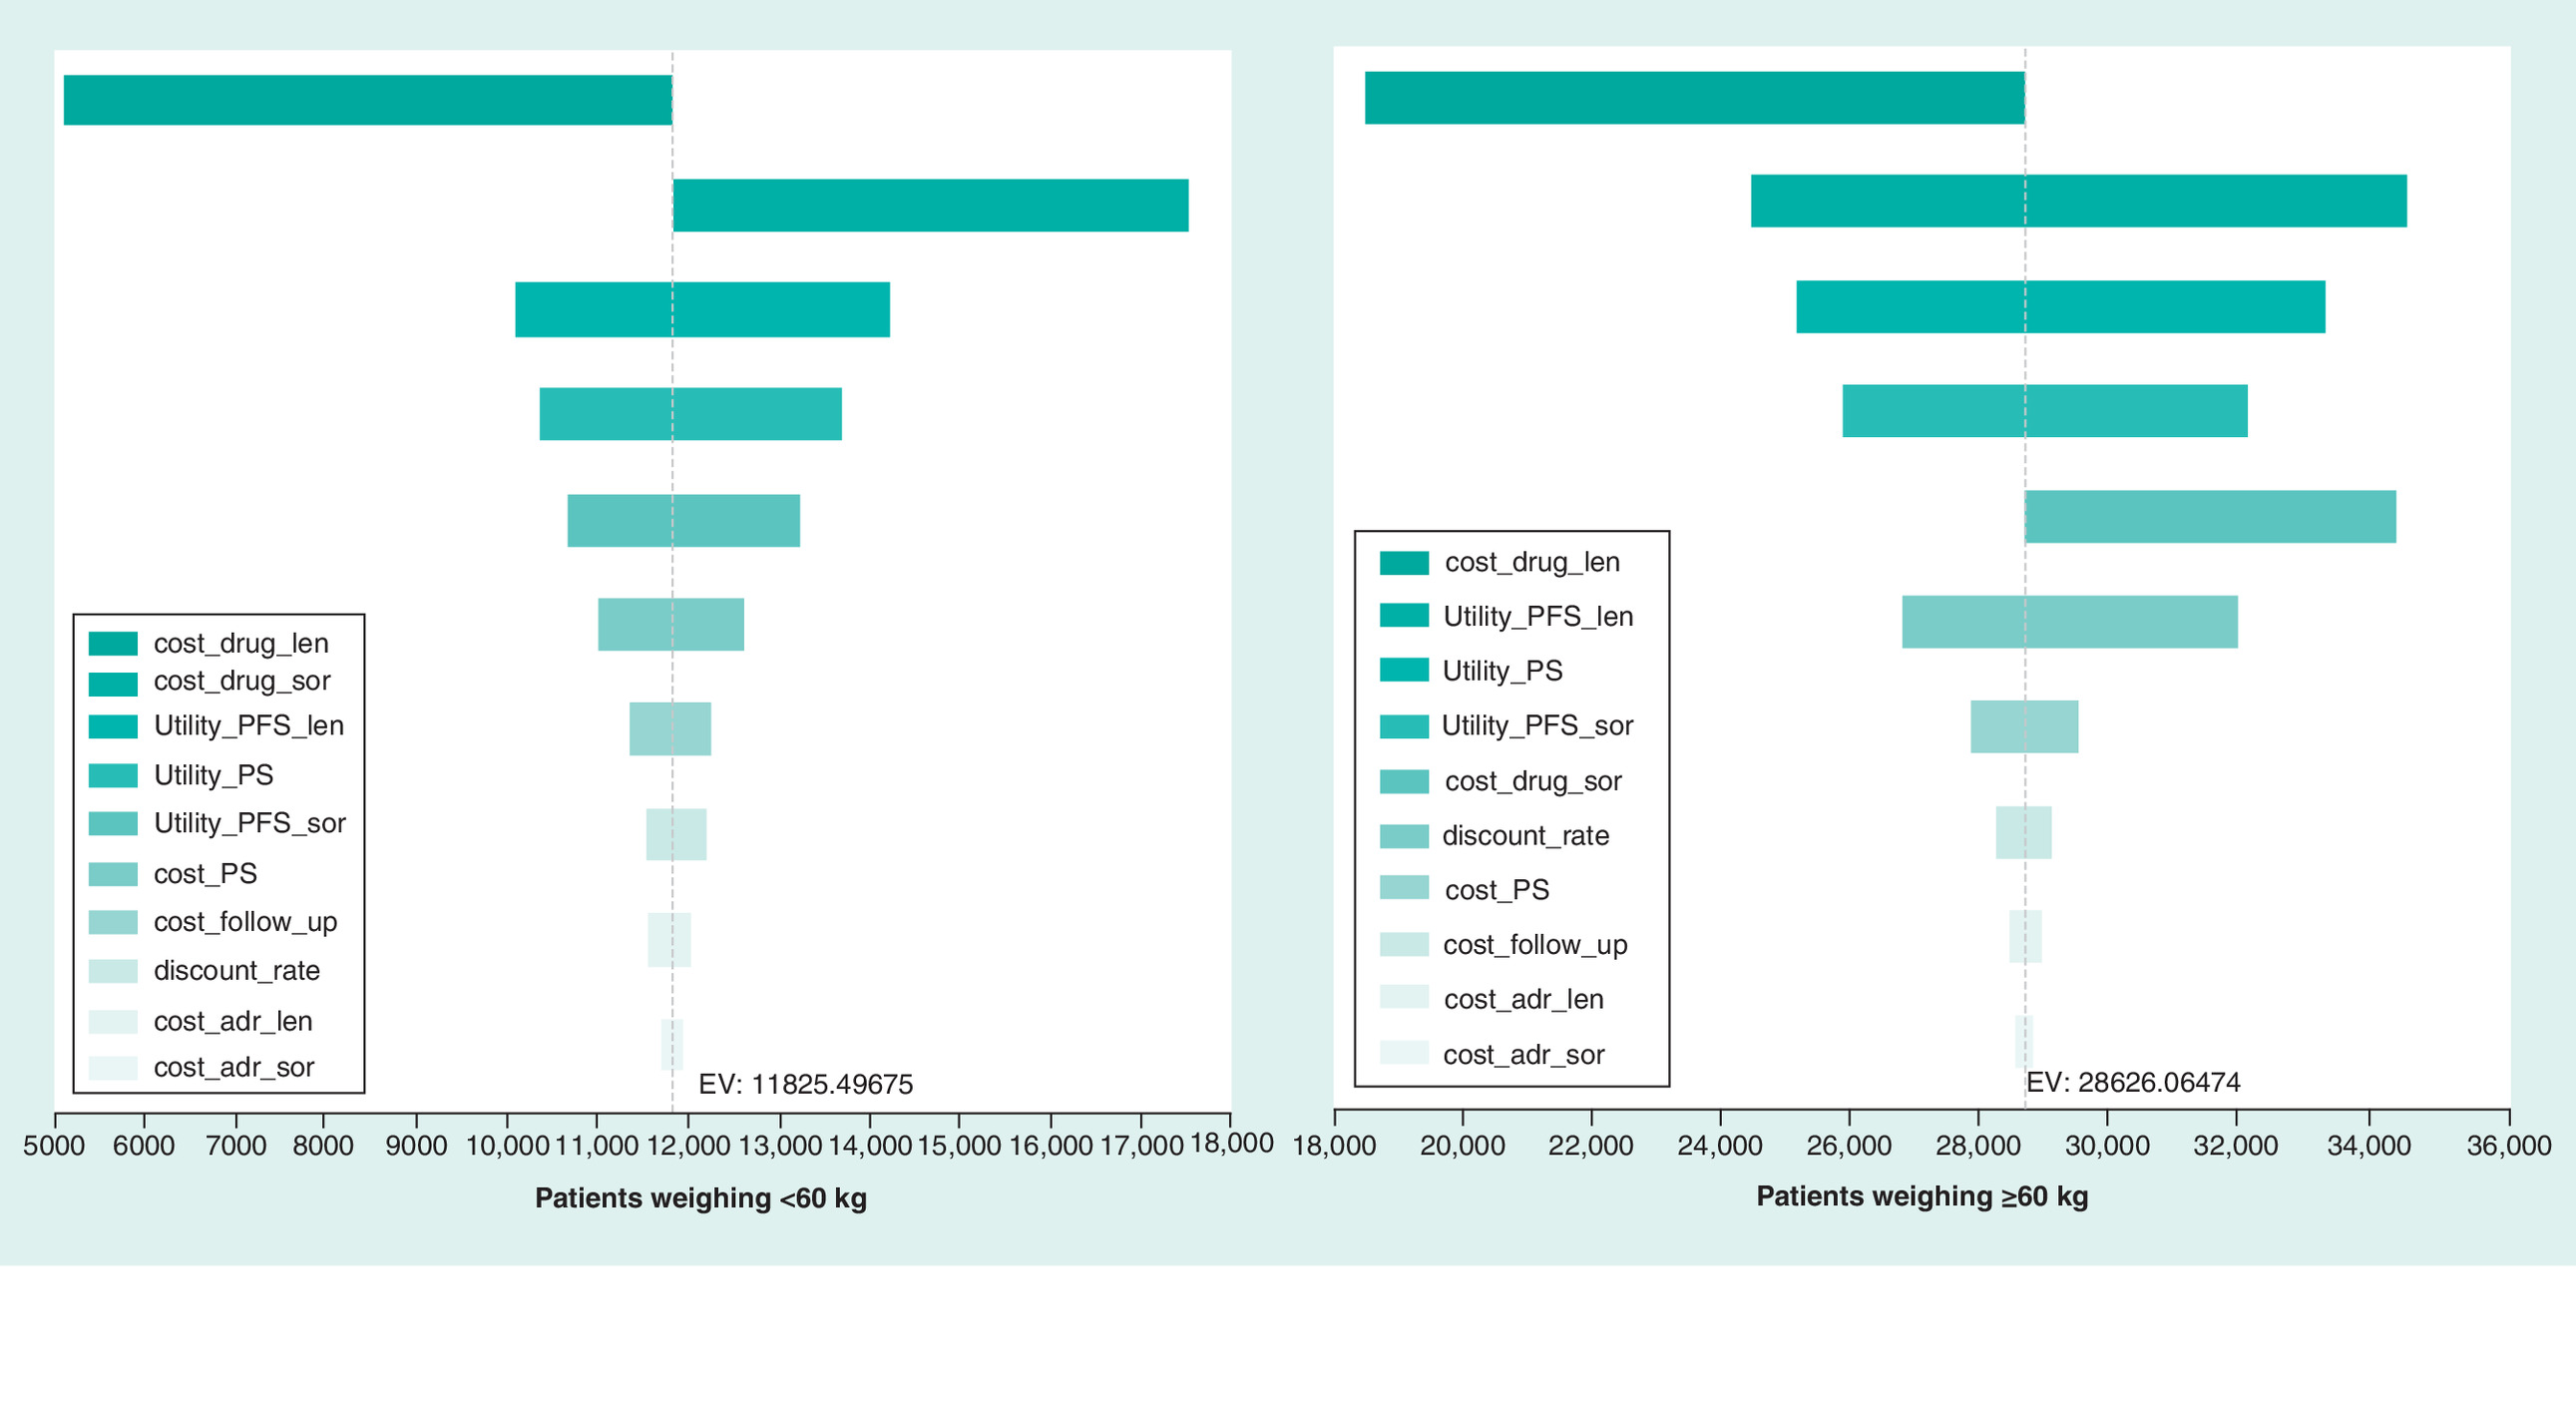
Figure 2. One-way sensitivity analysis.
EV: Expected value; PFS: Progression-free survival; PS: Progressed survival.
The results of probabilistic sensitivity analysis are shown in Figure 3. For patients weighing <60 and ≥60 kg, lenvatinib had 96.7 and 55.6% scatter points above the willingness payment curve compared with sorafenib, and the probability of lenvatinib with cost effect was 96.7 and 55.6%, respectively. The cost-effective acceptable curve shows that the higher the social average willingness to pay, the higher the probability that lenvatinib has a cost effect (Figure 4). For patients weighing ≥60 kg, when the willingness to pay was $586, 12.73, the probability of lenvatinib with cost effect was significantly higher than that of sorafenib (94.5%).
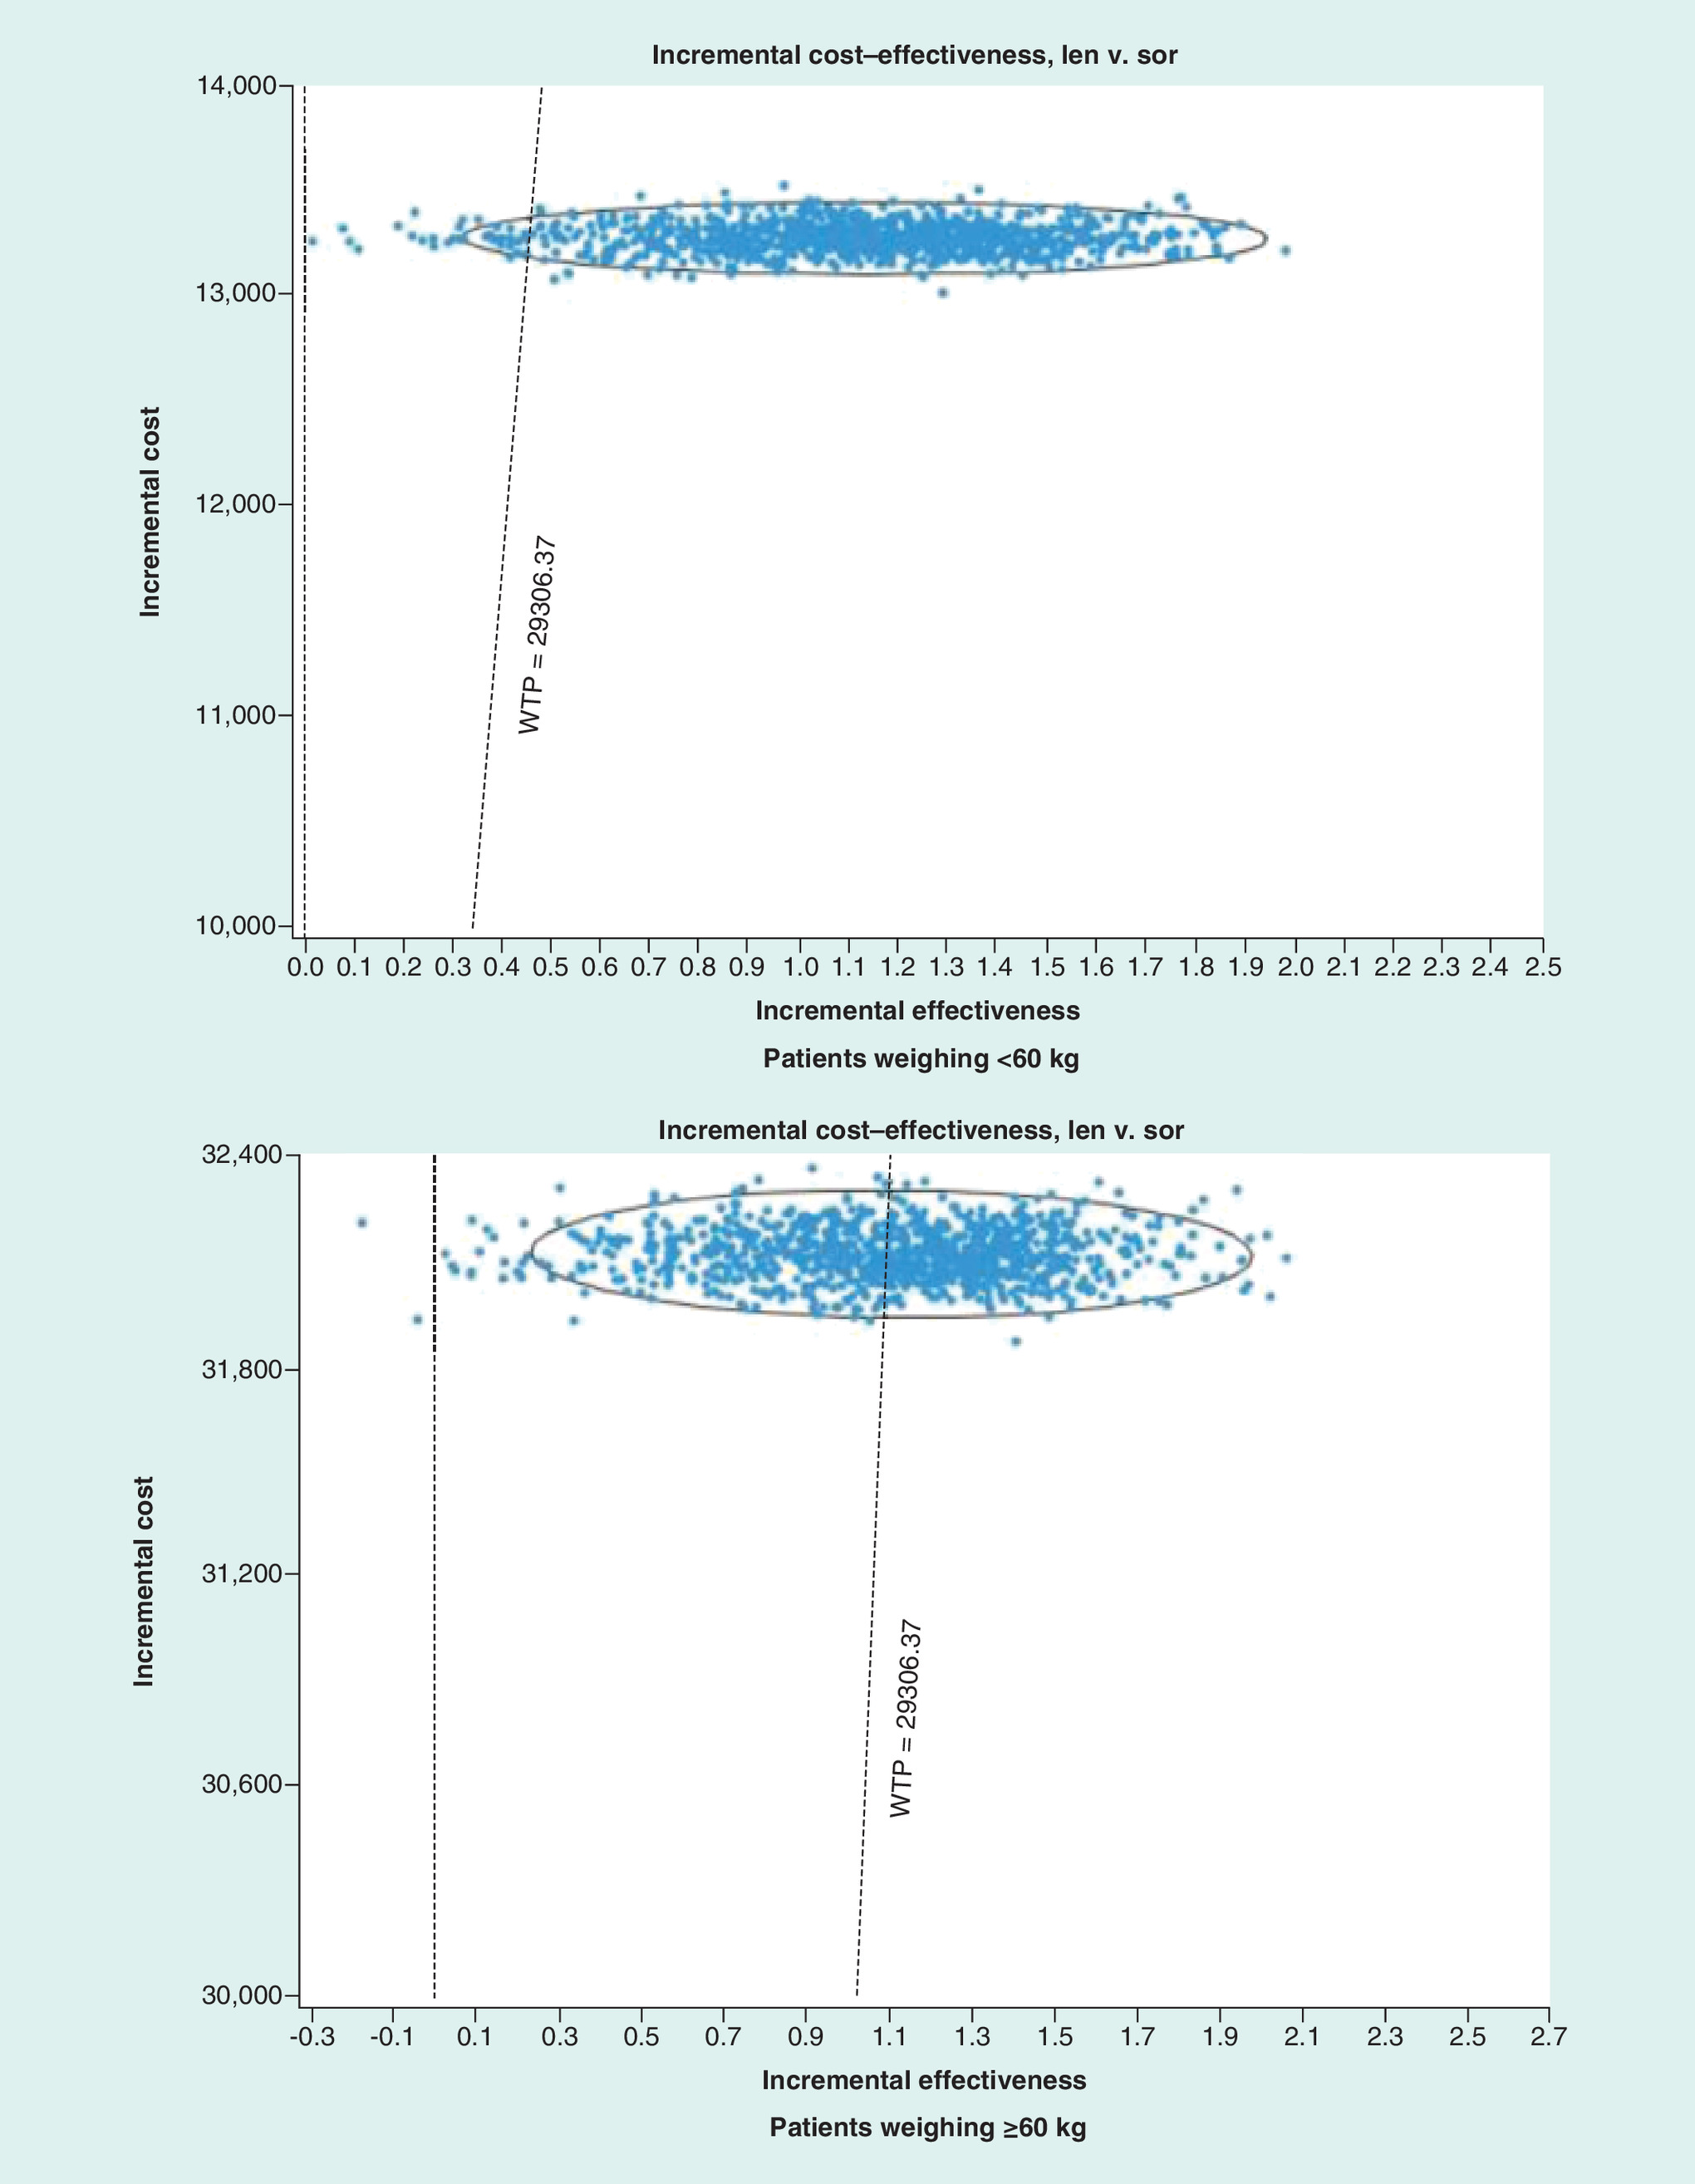
Figure 3. Probabilistic sensitivity analyses of lenvatinib versus sorafenib.
Len: Lenvatinib; Sor: Sorafenib; WTP: Willingness-to-pay.
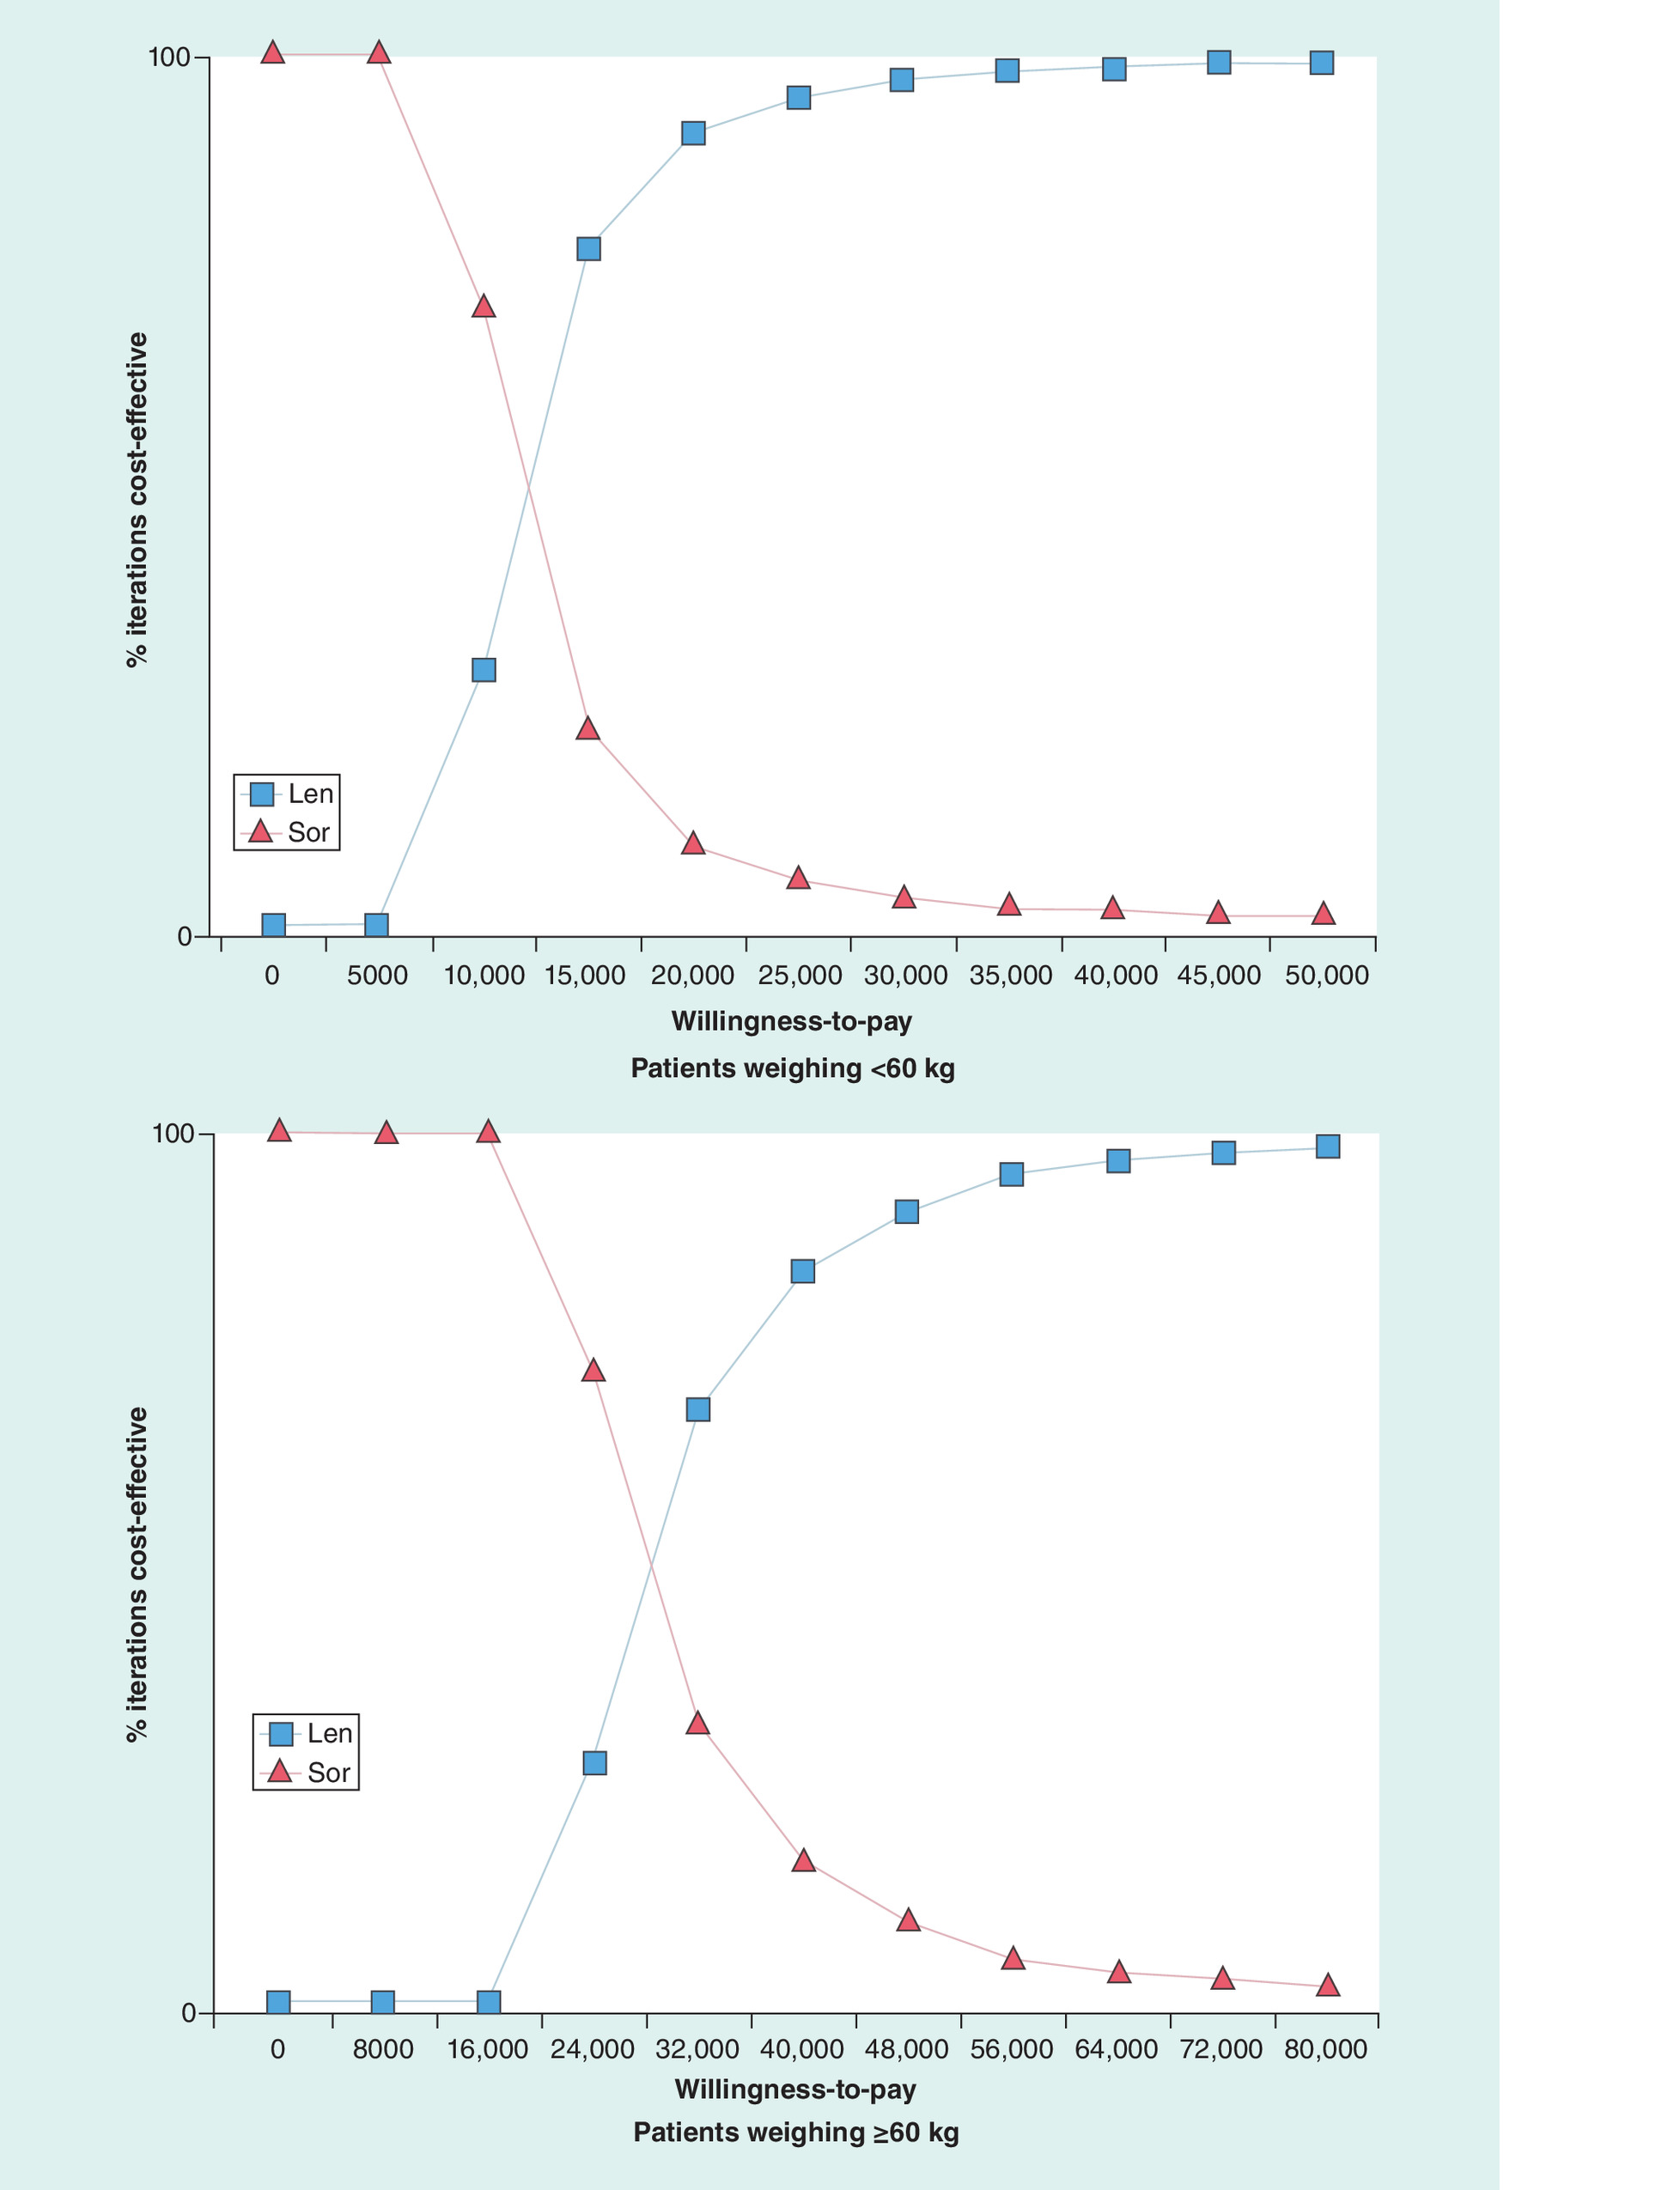
Figure 4. Cost–effectiveness acceptability curves.
Len: Lenvatinib; Sor: Sorafenib.
Discussion
Based on the latest data from the Chinese population in existing clinical studies, this study was the first to analyze the cost–effectiveness of the first-line treatment with lenvatinib and sorafenib for unresectable HCC patients. The dosage of lenvatinib in patients with different weights was not consistent. We studied the economics of the use of two schemes in patients with weights of <60 and ≥60 kg. In comparison with sorafenib, lenvatinib had an improved QALY. The lifetime cost has also increased, but the ICER value was lower than the threshold of China’s triple GDP per capita. Uncertainty factors may exist at all stages of the evaluation of the model. One-way sensitivity analysis shows that drug price and utility were the two most sensitive parameters. To sum up, for patients weighing ≥60 kg, the ICER is close to the acceptability threshold, the probability of lenvatinib being economical is slightly higher than sorafenib. For patients weighing <60 kg, lenvatinib scheme had a comparative advantage of cost effect.
Some economic studies of sorafenib treatment of HCC are available, but they mainly provide comparison with chemotherapy regimens. Zhang [13] and Qin [11] established Markov models to study the cost effects of FOLFOX4 or sorafenib for the first-line treatment of advanced HCC in China. The use of FOLFOX4 may be the most cost effective, given the tripled GDP per capita threshold value. A study on the economy of lenvatinib in the treatment of advanced HCC has been published in Japan, which indicate that the results of the study are more cost effective for lenvatinib that those from the Japan’s study [22]. Another study showed that lenvatinib offered a similar clinical effectiveness at a lower cost than sorafenib, lenvatinib would be a cost-saving alternative in treating unresectable HCC in Canada [26]. However, different countries have different costs and effects, and economic research results cannot be universal. In our study, the QLAY of lenvatinib was 2.916, which was significantly higher than that of the Japan study at 1.88, mainly because the clinical data of the Japan’s study were based from an international multicenter study. The results of the International Multicenter study were slightly inferior to the effect of sorafenib on the end point OS. In the Phase III clinical study, lenvatinib was significantly more effective than sorafenib in Chinese liver cancer patients and HBV-related liver cancer, which was also not consistent with Canada. For Chinese HCC patients and HBV-related HCC patients, the OS of lenvatinib was significantly better than that of sorafenib. In addition, considering that half of the world’s HCC patients are from China, the study is significantly necessary to evaluate the economic nature of lenvatinib and sorafenib treatment of HCC based on Chinese population.
In order to reduce the burden of patient’s medical treatment, the Chinese medical insurance department will make dynamic adjustments to the medical insurance catalog. Innovative-targeted drugs will be negotiated nationally to determine whether they are reimbursed, and to determine payment criteria. Through equal negotiation and consultation between medical insurance and pharmaceutical enterprises, a relatively reasonable payment standard will be formulated. The average decrease rate of drugs for cancer and diabetes is about 65% in 2019 Medical Insurance Catalog [27]. In order to improve the economics of sorafenib, the national medical insurance department could reduce the price through medical insurance negotiations. By combining the level of China’s economic development and the average social willingness to pay, exploring the reasonable medical payment standard of sorafenib will help to further improve the accessibility and compliance of targeted drugs, prolong the survival time of HCC patients, improve the quality of life and ensure that patients can bear the expenses for medical insurance fund.
The study has some limitations. First, the utility value of patients with advanced HCC in China has not been retrieved from the published literature. Hence, the utility value of PFS state and PS state was not derived from patients with advanced HCC in China. Each country or region has differences in ethnic and cultural backgrounds and preferences. China and Japan are Asian countries, and the utility value deviation may be relatively small. Second, the dose of lenvatinib may change as the weight of patients changes during treatment. The study assumes no significant change in the weight of the patient during treatment to simplify the model calculation. Third, the gamma distribution of cost parameters may result in deviation of the model output. Fourth, we have simplified the model and made several hypotheses to reduce the impact of parameter uncertainty. Different treatment options may be available after the progression of the disease, but we do not consider more individualized treatment decisions. Optional drugs after the advanced first-line treatment progression of advanced HCC are very limited. Hence, the study did not discuss the drug selection after the progression of the disease. The adverse reactions were similar in the two groups. Accordingly, the effects of death due to such reactions have not been considered. Hence, the state from PFS to death is not considered in the model. Fifth, the currently published REFLECT study only provides data on the global population. The Chinese population data are only partially described in the aforementioned study, and the PFS and OS curves are not presented. The clinical data of the Chinese subgroup are introduced in detail in the product package insert, including the PFS and OS curves and the adverse reaction data. The package insert is legally valid in China, and the conference paper results are consistent with the labeling. Therefore, we believe that the data are credible. In addition, compared with the results of global population studies, lenvatinib is significantly better than sorafenib for the Chinese HBV-related HCC. Hence, the cost–effectiveness of the first-line treatment of HBV related HCC should be evaluated. However, at present, we cannot obtain the Kaplan–Meier curve of HBV-related HCC in the Chinese subgroup.
Despite some limitations, for patients weighing <60 kg, the variables in the model did not affect the final result. One-way sensitivity analysis showed that the probability, utility and cost data were unlikely to affect the result.
Conclusion
From the perspective of the Chinese health service system, lenvatinib is a cost-effective drug for the targeted treatment of unresectable HCC patients. The results can be used to provide evidence and reference for healthcare policy makers, doctors and patients.
•
This study tested the cost–effectiveness of lenvatinib and sorafenib for unresectable hepatocellular carcinoma in China.
•
The cost–effectiveness analysis suggested that lenvatinib is likely to be cost effective from the perspective of the Chinese medical system.
Author contributions
H Cai assisted in methodology, software, formal analysis, visualization, writing-original draft preparation, writing-review and editing. L Zhang assisted in conceptualization, methodology, supervision, project administration, formal analysis. N Li assisted in writing-original draft preparation, writing-review and editing. B Zheng assisted in formal analysis, visualization. M Liu assisted in methodology, supervision, project administration, resources.
Financial & competing interests disclosure
This study was supported by Fujian Provincial Department of Science & Technology (grant no. 2017Y0035) of the People’s Republic of China and National Natural Science Foundation of China (grant no. 71804025). The authors have no other relevant affiliations or financial involvement with any organization or entity with a financial interest in or financial conflict with the subject matter or materials discussed in the manuscript apart from those disclosed.
No writing assistance was utilized in the production of this manuscript.
References
Papers of special note have been highlighted as: • of interest; •• of considerable interest
1.
Bray F, Ferlay J, Soerjomataram I, Siegel RL, Torre LA, Jemal A. Global cancer statistics 2018: GLOBOCAN estimates of incidence and mortality worldwide for 36 cancers in 185 countries. CA Cancer J. Clin. 68(6), 394–424 (2018).
2.
WHO. World Cancer Report 2014 (2014). www.who.int/cancer/publications/WRC_2014/en/
3.
Chen W, Zheng R, Baade PD et al. Cancer statistics in China, 2015. CA Cancer J. Clin. 66(2), 115–132 (2016).
• Provides background on the epidemiology of hepatocellular carcinoma.
4.
Torre LA, Bray F, Siegel RL, Ferlay J, Lortet-Tieulent J, Jemal A. Global cancer statistics, 2012. CA Cancer J. Clin. 65(2), 87–108 (2015).
5.
Zheng R SK, Zhang S ZH, Zou X CR, Gu X. Report of cancer epidemiology in China, 2015. Chin. J. Oncol. 41(1), 19–28 (2019).
6.
Chinese Society of Clinical Oncology. Guidelines of the Chinese Society of Clinical Oncology (CSCO) hepatocellular carcinoma. People’s Medical Publishing House. 1, 71–90 (2018).
7.
Kudo M, Finn RS, Qin S et al. Lenvatinib versus sorafenib in first-line treatment of patients with unresectable hepatocellular carcinoma: a randomized Phase III noninferiority trial. Lancet 391(10126), 1163–1173 (2018).
•• Global Phase III study of lenvatinib in unresectable hepatocellular carcinoma.
8.
Drug Instructions for Lenvatinib Mesilate Capsules (LENVIMA®) in China. Date of Approval: 4 September 2018 (2018). www.beaconpharma.net/uploads/media/Lenvanix-instructions.pdf
•• The clinical data of the Chinese subgroup (lenvatinib vs sorafenib) are introduced in detail in the product package insert, including the progression-free survival and overall survival curves and the adverse reaction data.
9.
Qin S. Subgroup analysis of Chinese patients in a Phase IIIstudy of lenvatinib versus sorafenib in first-line treatment of patients with unresectable hepatocellular carcinoma. Presented at: CSCO Academic Conference. Xiamen, China (2017).
10.
Ministry of Human Resources and Social Security. Notice on the inclusion of 36 drugs in the Category B of the National Basic Medical Insurance, Work Injury Insurance and Maternity Insurance Drug List (2018). www.gov.cn/xinwen/2018-10/10/content_5328891.htm
11.
Qin S, Kruger E, Tan SC, Cheng S, Wang N, Liang J. Cost–effectiveness analysis of FOLFOX4 and sorafenib for the treatment of advanced hepatocellular carcinoma in China. Cost Eff. Resour. Alloc. 16, 29 (2018).
12.
Zhang P, Yang Y, Wen F et al. Cost–effectiveness of sorafenib as a first-line treatment for advanced hepatocellular carcinoma. Eur. J. Gastroenterol. Hepatol. 27(7), 853–859 (2015).
13.
Zhang P, Wen F, Li Q. FOLFOX4 or sorafenib as the first-line treatments for advanced hepatocellular carcinoma: a cost–effectiveness analysis. Dig. Liver Dis. 48(12), 1492–1497 (2016).
14.
Zhao RC, Zhou J, Wei YG et al. Cost–effectiveness analysis of transcatheter arterial chemoembolization with or without sorafenib for the treatment of unresectable hepatocellular carcinoma. Hepatobiliary Pancreat. Dis. Int. 16(5), 493–498 (2017).
15.
National Bureau of Statistics. Statistical Bulletin of National Economic and Social Development in 2018 (2018). www.stats.gov.cn/tjsj/zxfb/201902/t20190228_1651265.html
16.
Cai H, Zhang L, Li N et al. Cost–effectiveness of osimertinib as first-line treatment and sequential therapy for EGFR mutation-positive non-small-cell lung cancer in China. Clin. Ther. 41(2), 280–290 (2019).
17.
Wan X, Zhang Y, Tan C, Zeng X, Peng L. First-line nivolumab plus ipilimumab vs sunitinib for metastatic renal cell carcinoma: a cost–effectiveness analysis. JAMA Oncol. 5(4), 491–496 (2019).
18.
Wu B, Gu X, Zhang Q. Cost–effectiveness of osimertinib for EGFR mutation-positive non-small-cell lung cancer after progression following first-line EGFR TKI therapy. J. Thorac. Oncol. 13(2), 184–193 (2018).
19.
Wu B, Yao Y, Zhang K, Ma X. RAS testing and cetuximab treatment for metastatic colorectal cancer: a cost–effectiveness analysis in a setting with limited health resources. Oncotarget 8(41), 71164–71172 (2017).
20.
Liu M, Zhang L, Huang Q, Li N, Zheng B, Cai H. Cost–effectiveness analysis of ceritinib and alectinib versus crizotinib in the treatment of anaplastic lymphoma kinase-positive advanced non-small-cell lung cancer. Cancer Manag. Res. 11, 9195–9202 (2019).
21.
Sparling YH, Younes N, Lachin JM, Bautista OM. Parametric survival models for interval-censored data with time-dependent covariates. Biostatistics 7(4), 599–614 (2006).
22.
Kobayashi M, Kudo M, Izumi N et al. Cost–effectiveness analysis of lenvatinib treatment for patients with unresectable hepatocellular carcinoma (uHCC) compared with sorafenib in Japan. J. Gastroenterol. 54(6), 558–570 (2019).
•• This is the primary source for derivation of quality-adjusted life years in the model.
23.
Zhang TT, Wang S, Wan N, Zhang L, Zhang Z, Jiang J. Cost–effectiveness of daratumumab-based triplet therapies in patients with relapsed or refractory multiple myeloma. Clin. Ther. 40(7), 1122–1139 (2018).
24.
Liu G. 2015 China Guidelines for Pharmacoeconomic Evaluations and Manual. Science Press, Beijing, China (2015).
25.
World Health Organization. Cost Effectiveness Thresholds. WHO, Geneva, Switzerland (2011).
26.
Kim JJ, McFarlane T, Tully S, Wong WWL. Lenvatinib versus sorafenib as first-line treatment of unresectable hepatocellular carcinoma: a cost-utility analysis. Oncologist 25(3), e512–e519 (2020).
27.
Cai H, Zhang L, Li N, Zheng B, Liu M. Cost–effectiveness analysis on binary/triple therapy on the basis of ixazomib or bortezomib for refractory or relapsed multiple myeloma. Leuk. Lymphoma 60(12), 2951–2959 (2019).
Information & Authors
Information
Published In
Pages: 553 - 562
PubMed: 32419473
Copyright
© 2020 Future Medicine Ltd.
History
Received: 3 March 2020
Accepted: 7 April 2020
Published online: 18 May 2020
Keywords:
Topics
Authors
Metrics & Citations
Metrics
Article Usage
Article usage data only available from February 2023. Historical article usage data, showing the number of article downloads, is available upon request.
Citations
How to Cite
Lenvatinib versus sorafenib for unresectable hepatocellular carcinoma: a cost–effectiveness analysis. (2020) Journal of Comparative Effectiveness Research. DOI: 10.2217/cer-2020-0041
Export citation
Select the citation format you wish to export for this article or chapter.
Citing Literature
- Paolo De Simone, Daniela Peritore, Juri Ducci, Lucia Romano, Donato Longo, Antonio Giuliani, Daniela Campani, Fabio Vistoli, A systematic review of comparative economic analyses of systemic therapies for hepatocellular carcinoma, Hepatoma Research, 10.20517/2394-5079.2025.77, (2026).
- XueYin Xu, Lian Tang, XiangHua Piao, ShaoQing Zhan, Yong Chen, PanFeng Feng, Economic evaluation of finotonlimab plus bevacizumab as first-line therapy for advanced hepatocellular carcinoma, PLOS One, 10.1371/journal.pone.0349044, 21, 5, (e0349044), (2026).
- Thang Xuan Do, Ha Thi Nguyen, Phuong Thi Lan Nguyen, Mai Thi Tuyet Kieu, Tuan Viet Duong, Van Nu Hanh Pham, Cost-utility analysis of lenvatinib and sorafenib for the first-line treatment of unresectable hepatocellular carcinoma in Vietnam: Evidence from a lower-middle income country, PLOS One, 10.1371/journal.pone.0345212, 21, 4, (e0345212), (2026).
- JinDi Liu, Lian Tang, LongXun Zhu, Yong Chen, PanFeng Feng, Cost-Effectiveness Analysis of Anlotinib Plus Penpulimab Versus Sorafenib in the First-Line Treatment of Unresectable Hepatocellular Carcinoma in China, Clinical Drug Investigation, 10.1007/s40261-026-01543-1, 46, 6, (631-640), (2026).
- Heng Xiang, Zhihua She, Liting Wang, Ye Peng, Lei Zhang, Chongqing Tan, Comparison of Atezolizumab plus Aevacizumab and Atezolizumab plus Aabozantinib for advanced hepatocellular carcinoma: A cost-effectiveness analysis, PLOS One, 10.1371/journal.pone.0337606, 20, 12, (e0337606), (2025).
- Mohammad Mahdi Raeis Zadeh, Behzad Fatemi, Neshaut Mashreghi Mohammadi, Fatemeh Soleymani, Cost-utility analysis of Lenvatinib vs. Sorafenib in unresectable hepatocellular carcinoma in Iran, Expert Review of Pharmacoeconomics & Outcomes Research, 10.1080/14737167.2025.2543465, 25, 10, (1497-1504), (2025).
- Yuhang Chen, Suoyi Dai, Chien-shan Cheng, Lianyu Chen, Lenvatinib and immune-checkpoint inhibitors in hepatocellular carcinoma: mechanistic insights, clinical efficacy, and future perspectives, Journal of Hematology & Oncology, 10.1186/s13045-024-01647-1, 17, 1, (2024).
- Hongyu Gong, Siew Chin Ong, Fan Li, Yan Shen, Zhiying Weng, Keying Zhao, Zhengyou Jiang, Meng Wang, Cost-effectiveness of immune checkpoint inhibitors as a first-line therapy for advanced hepatocellular carcinoma: a systematic review, Health Economics Review, 10.1186/s13561-024-00526-2, 14, 1, (2024).
- Giuseppe Cabibbo, Bruno Daniele, Mauro Borzio, Andrea Casadei-Gardini, Umberto Cillo, Agostino Colli, Massimiliano Conforti, Vincenzo Dadduzio, Francesco Dionisi, Fabio Farinati, Ivan Gardini, Edoardo Giovanni Giannini, Rita Golfieri, Maria Guido, Andrea Mega, Michela Cinquini, Fabio Piscaglia, Lorenza Rimassa, Laura Romanini, Anna Pecorelli, Rodolfo Sacco, Marta Scorsetti, Luca Viganò, Alessandro Vitale, Franco Trevisani, Multidisciplinary treatment of hepatocellular carcinoma in 2023: Italian practice Treatment Guidelines of the Italian Association for the Study of the Liver (AISF), Italian Association of Medical Oncology (AIOM), Italian Association of Hepato-Bilio-Pancreatic Surgery (AICEP), Italian Association of Hospital Gastroenterologists (AIGO), Italian Association of Radiology and Clinical Oncology (AIRO), Italian Society of Pathological Anatomy and Diagnostic Cytology (SIAPeC-IAP), Italian Society of Surgery (SIC), Italian Society of Gastroenterology (SIGE), Italian Society of Medical and Interventional Radiology (SIRM), Italian Organ Transplant Society (SITO), and Association of Patients with Hepatitis and Liver Disease (EpaC) – Part II – Non-surgical treatments, Digestive and Liver Disease, 10.1016/j.dld.2023.10.028, 56, 3, (394-405), (2024).
- Zixuan He, Xianqin Huang, Dingyi Chen, Guoan Wang, Yuezhen Zhu, Huangqianyu Li, Sheng Han, Luwen Shi, Xiaodong Guan, Sponsorship bias in published pharmacoeconomic evaluations of national reimbursement negotiation drugs in China: a systematic review, BMJ Global Health, 10.1136/bmjgh-2023-012780, 8, 11, (e012780), (2023).