Medicaid spending burden among beneficiaries with treatment-resistant depression
Abstract
Aim: To evaluate Medicaid spending and healthcare resource utilization (HRU) in treatment-resistant depression (TRD). Materials & methods: TRD beneficiaries were identified from Medicaid claims databases (January 2010–March 2017) and matched 1:1 with major depressive disorder (MDD) beneficiaries without TRD (non-TRD-MDD) and randomly selected patients without MDD (non-MDD). Differences in HRU and per-patient-per-year costs were reported in incidence rate ratios (IRRs) and cost differences (CDs), respectively. Results: TRD beneficiaries had higher HRU than 1:1 matched non-TRD-MDD (e.g., inpatient visits: IRR = 1.41) and non-MDD beneficiaries (N = 14,710 per cohort; e.g., inpatient visits: IRR = 3.42, p < 0.01). TRD beneficiaries incurred greater costs versus non-TRD-MDD (CD = US$4382) and non-MDD beneficiaries (CD = US$8294; p < 0.05). Conclusion: TRD is associated with higher HRU and costs versus non-TRD-MDD and non-MDD. TRD poses a significant burden to Medicaid.
Major depressive disorder (MDD) is estimated to affect 15.4 million people in the USA, representing nearly 6.7% of the total population [1]. In 2015, the societal cost burden of people with MDD was quantified at US$210.5 billion, highlighting the substantial economic burden of this condition [2]. While antidepressants can effectively treat MDD, approximately half of pharmacologically treated MDD patients do not respond to an adequate trial of an antidepressant medication, and a significant proportion of these patients do not respond to subsequent lines of pharmacotherapy [3]. Failure to respond adequately to at least two antidepressant treatments of adequate dose and duration is often referred to as treatment-resistant depression (TRD), although a universally accepted definition is lacking [4].
Mental illness disproportionately affects disadvantaged populations of lower socioeconomic status [5]. Medicaid is a US federal program that, jointly with the Children's Health Insurance Program, provides basic health insurance to over 72.5 million Americans with a low income [6]. Eligibility groups made mandatory across all states include low-income families, qualified pregnant women and children, and citizens receiving supplemental security income [6]. As of 2015, approximately 9.1 million low-income adult Medicaid beneficiaries had mental illness, and 2.5 million reported an unmet need for mental health treatment [7]. Moreover, although accounting for approximately 20% of the population, patients with behavioral health conditions account for 48% of Medicaid spending [7]. In the USA, it is estimated that almost a third of low-income Medicaid beneficiaries have been diagnosed with depression, representing twice the rate of the nation [8,9]. With most research efforts to date focusing on commercially insured patients, there is a need to assess the burden of TRD among low-income Medicaid beneficiaries [10–12]. The wealth of data that can be extracted from Medicaid, the largest single source of financing for mental health services in the USA [8], makes it a particularly suitable data source to address this research question.
This retrospective cohort study was conducted to assess the cost and healthcare resource utilization (HRU) burden of TRD in Medicaid beneficiaries using a design similar to that of a commercial analysis performed by Amos et al. [10], allowing indirect comparisons to be made between both studies. Our study also aimed to assess the robustness and replicability of results recently published in a Medicaid-insured population [13]. To our knowledge, no other study has been conducted to date.
Methods
Data source
This study was conducted using Medicaid healthcare claims databases, which included the states of Iowa, Missouri, Mississippi, Kansas, New Jersey and Wisconsin. Data were available from 1 July 2009 through 31 March 2017 for all states except New Jersey and Wisconsin, for which data were available through 31 March 2014 and 31 December 2013, respectively. The Medicaid databases contain medical and drug claims data representing approximately 26.6 million Medicaid eligible persons. Information on medical claims (e.g., payment and days of supplied data by provider, and date of service; International Classification of Diseases, 9th revision [ICD-9-CM] diagnoses; International Classification of Diseases, 10th revision [ICD-10-CM] diagnoses; Current Procedural Terminology codes), prescription drug claims and eligibility (e.g., age, gender, and enrollment start and end dates) were also available. All data were compliant with the Health Insurance Portability and Accountability Act, and thus no ethical review was necessary.
Study design & cohorts
The study used a retrospective longitudinal-matched cohort design where beneficiaries with TRD were compared with two control cohorts: beneficiaries with MDD who did not have TRD (non-TRD MDD cohort) and beneficiaries without MDD (non-MDD cohort).
The TRD and non-TRD MDD cohorts consisted of adult (i.e., ≥18 years of age) patients who had greater than or equal to one diagnosis for MDD (ICD-9-CM: 296., ICD-10-CM: F32.x [excluding F32.8]; F33.x, [excluding F33.8]; see Supplementary Table 1 for the code definitions) between 1 July 2009 and 31 March 2017; had greater than or equal to one claim for an antidepressant starting from January 2010 (defined as the index date) without antidepressant claims 6 months before (defined as the baseline period); had greater than or equal to one diagnosis for depression (ICD-9-CM: 296.2x, 296.3x, 300.4x, 311.x, 309.0x or 309.1x; ICD-10-CM: F32.x, F33.x, F34.1 or F43.21; see Supplementary Table 1 for the code definitions) during the baseline or observation period; and had claims for greater than or equal to one antidepressant agent with an adequate dose and duration on or after the index date. Adequate dose was defined as the minimum starting dose recommended by the American Psychiatric Association treatment guidelines [14]. Adequate duration was defined as ≥6 weeks of continuous therapy with no gaps longer than 14 days.
MDD patients were classified in the TRD cohort if they received two antidepressant treatment courses (i.e., augmentation therapy with anticonvulsant, anxiolytic, antipsychotic, lithium, psychostimulant and thyroid hormone medications) with adequate dose and duration during the observation period and then initiated a third, with the assumption that patients doing well on a treatment course would not progress to another line of therapy. Failure of a treatment course was defined as a switch of antidepressant (<180 days after the end of the previous treatment), the addition of an antidepressant or the initiation of an augmentation therapy. Beneficiaries with MDD who did not meet the above criteria for TRD were classified in the non-TRD MDD cohort.
A total of 1,000,000 adult patients without an MDD diagnosis at any time during the study period were randomly selected and subsequently assessed for study eligibility. The index date was randomly assigned during 1 January 2010–31 March 2017.
For each study cohort, patients were excluded from the study if they met any of the following criteria: diagnoses for specific psychiatric comorbidities (i.e., psychosis [ICD-9-CM: 298.xx; ICD-10-CM: F23.x, F25.x, F44.89], schizophrenia [ICD-9-CM: 295.xx; ICD-10-CM: F20.x, F25.x], bipolar disorder/manic depression [ICD-9-CM: 296.0x, 296.1x, 296.4x, 296.5x, 296.6x, 296.7x, 296.8x; ICD-10-CM: F30.x, F31.x] or dementia [ICD-9-CM: 290.xx, 294.1x; ICD-10-CM: F01.x, F02.x, F03.x]; see Supplementary Table 1 for the code definitions) between 1 July 2009–31 March 2017; and <6 months of continuous eligibility pre- and post-index date.
Baseline characteristics were evaluated during the baseline period. Study outcomes were evaluated from the index date up until the earliest among 2 years postindex, end of continuous eligibility or end of data availability (i.e., the observation period).
Study outcomes
Study outcomes included antidepressant treatment patterns, HRU and costs. Antidepressant treatments comprised selective serotonin reuptake inhibitors (SSRIs), norepinephrine–dopamine reuptake inhibitors (NDRIs), serotonin–norepinephrine reuptake inhibitors (SNRIs), serotonin modulators (i.e., nefazodone, trazodone, vilazodone, venlafaxine), tricyclics and tetracyclics, norepinephrine–serotonin modulators, monoamine oxidase inhibitors and others (i.e., olanzapine–fluoxetine). The proportion of patients using antidepressant medication during the observation period was reported for each cohort.
HRU and cost outcomes were stratified into all-cause, behavioral health (including depression) and depression-related. For each stratum, the following categories were evaluated: inpatient visits, inpatient days, emergency department visits, outpatient visits, home care, mental-health institute admissions, long-term care admissions and other visits.
Behavioral health medical HRU and costs were identified using the following primary or secondary ICD-9-CM diagnostic codes: 290.xx-319. xx, and ICD-10-CM diagnostic codes: F01.xxx-F99.xxx; see Supplementary Table 1 for the code definitions. Depression-related medical costs were identified using the following primary or secondary ICD-9-CM diagnostic codes: 296.2x, 296.3x, 300.4x, 309.0x, 309.1x, 311. xx and ICD-10-CM: F32.x, F33.x, F34.1 or F43.21; see Supplementary Table 1 for the code definitions. Behavioral health pharmacy costs included anxiolytics, anticonvulsants/mood stabilizers, antipsychotics, antidepressants and other mood stabilizers (e.g., lithium). Depression-related pharmacy costs included SSRIs, NDRIs, SNRIs, serotonin modulators, tricyclics and tetracyclics, norepinephrine–serotonin modulators, monoamine oxidase inhibitors and olanzapine–fluoxetine.
Statistical analysis
To control for potential confounding, control cohorts (i.e., the non-TRD MDD and non-MDD cohorts) were matched 1:1 to the TRD cohort based on demographic characteristics using exact matching factor (i.e., state) and propensity scores (PS). The PS was defined as the conditional probability of having TRD based on observable characteristics, and was estimated from a logistic regression model, in which belonging to the TRD cohort (yes/no) was the binary-dependent variable, and patient characteristics were predictors. PS were modeled using multivariate logistic regression controlling for age, sex, year of the index date, dual eligibility coverage (i.e., dual Medicaid/Medicare coverage) and Medicaid health managed care organization coverage. Differences in baseline characteristics before and after matching were compared using standardized differences, with an acceptance threshold of ≤10% [15–17]. Rates of HRU were compared using multivariate negative binomial regression and reported using incidence rate ratios. Costs were expressed per patient per year (PPPY; 2016 US$), and adjusted cost differences were calculated using multivariate ordinary least squares regression, with the TRD cohort serving as reference for those calculations. Multivariate models were adjusted for baseline total healthcare costs and Quan–Charlson comorbidity index. Cost differences, CIs and p-values were obtained from a nonparametric bootstrap procedure (499 replications). Continuous variables were reported using means, standard deviations and medians; categorical variables were reported using frequencies and percentages.
Unadjusted all-cause healthcare costs were also compared as part of a sensitivity analysis.
Results
Demographic & clinical characteristics
Among 54,405 beneficiaries with MDD who received treatment of adequate dose and duration, 14,170 (26.1%) met the criteria to be classified in the TRD cohort, and 40,235 were classified in the non-TRD MDD cohort. A total of 223,799 patients were included in the non-MDD cohort. Patients in the TRD cohort had an average age of 42.5 years (standard deviation: 12.3) and were primarily female (73.4%; Supplementary Table 2).
Matched control cohorts (N = 14,170 in each cohort) were generally well balanced to the TRD cohort with respect to demographic characteristics (Supplementary Table 2). The all-cause medical (US$12,673 [TRD] vs US$11,732 [non-TRD MDD] PPPY) and all-cause pharmacy (US$1290 [TRD] vs US$1374 [non-TRD MDD] PPPY) costs during the baseline period were balanced between the TRD and non-TRD MDD cohorts (all standardized difference <10%). With respect to clinical characteristics, the matched TRD and non-TRD MDD cohorts were well balanced for all evaluated characteristics except other mental health diagnoses medication use (38.1% [TRD] vs 29.9% [non-TRD MDD]). Demographic characteristics were generally well balanced between the TRD and non-MDD cohorts as well. The mean durations of the observation period were 21.8, 20.6 and 17.8 months in the TRD, non-TRD MDD and the non-MDD cohort, respectively.
Treatment patterns
The antidepressant classes most commonly used were SSRIs (84.8 vs 77.6%; order hereinafter representing TRD vs non-TRD MDD, respectively), serotonin modulators (50.0 vs 22.3%), SNRIs (49.6 vs 24.6%), NDRIs (34.4 vs 16.8%) and tricyclics/tetracyclics (31.4 vs 12.3%; Figure 1). The same top five classes were found for patients in the non-MDD cohort, but utilization rates were much lower (Figure 1).

Figure 1. Medication treatment patterns during the observation period of patients in the treatment-resistant depression, non-treatment-resistant depression major depressive disorder and non-major depressive disorder cohorts in the USA (1 January 2010–31 March 2017).
†The small proportions of patients in the nonmajor depressive disorder cohort who had claims for antidepressants may reflect use of antidepressants for approved indications other than major depressive disorder, or off-label use.
‡Serotonin modulators included the following individual agents: nefazodone, trazodone, vilazodone and vortioxetine.
*p < 0.05 (comparator: treatment-resistant depression cohort).
MAOI: Monoamine oxidase inhibitor; MDD: Major depressive disorder; NDRI: Norepinephrine–dopamine reuptake inhibitor; SNRI: Serotonin-norepinephrine reuptake inhibitor; SSRI: Selective serotonin reuptake inhibitor; TRD: Treatment-resistant depression.
HRU outcomes
With respect to all-cause HRU, beneficiaries with TRD had significantly higher rates of all evaluated HRU categories during the observation period compared with either the non-TRD MDD or non-MDD cohort (e.g., 1.4- and 3.4-times the rate of inpatient visits vs beneficiaries with non-TRD MDD and non-MDD, respectively; all p < 0.01; Figure 2). With respect to behavioral health- and depression-related HRU, the same trends were observed: Relative to the non-TRD MDD and non-MDD cohorts, beneficiaries with TRD had higher rates of behavioral-health HRU (e.g., 1.9- and 10.9-times the rate of inpatient visits, respectively; all p < 0.01; Supplementary Table 3) and depression-related HRU (e.g. 1.7-times the rate of inpatient visits vs beneficiaries with non-TRD MDD; p < 0.01; Supplementary Table 3). Of the eight all-cause HRU categories evaluated (i.e., inpatient visits, number of inpatient days, emergency department visits, outpatient visits, home care visits, mental-health institute admissions, long-term care admissions and other visits), all except the other visits category had rates increased by >20% in the TRD versus non-TRD MDD comparison, and all but home care visits and other visits had rates increased by more than twofold in the TRD versus non-MDD comparison (Figure 2).
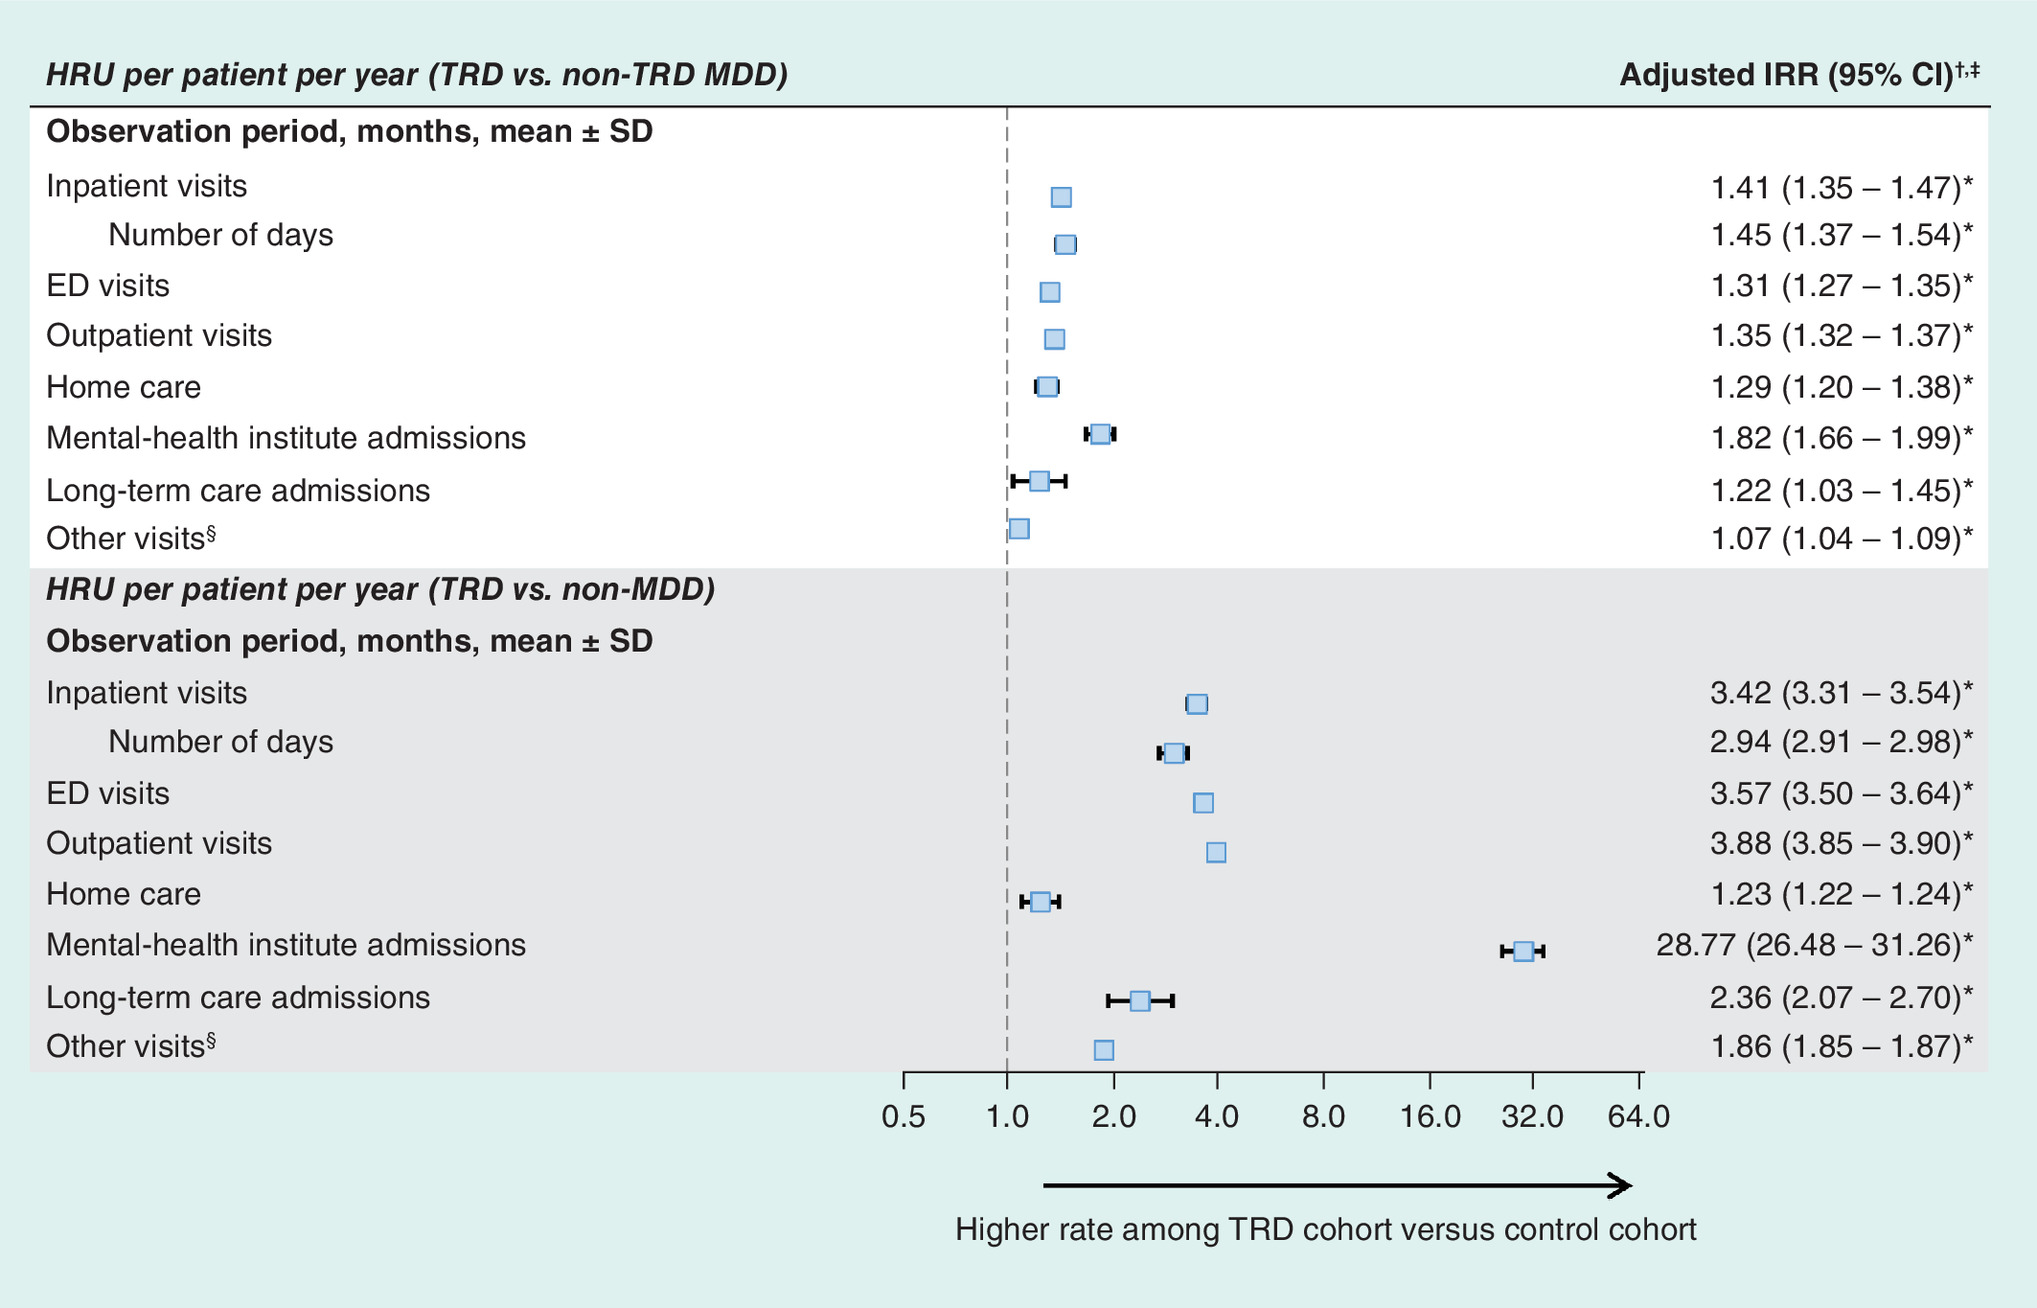
Figure 2. All-cause healthcare resource utilization measured from the index date up to 2 years postindex date in the USA (1 January 2010–31 March 2017).
†Incidence rate ratios, 95% CIs and p-values were estimated using multivariate (adjusting for baseline total healthcare cost and Quan–Charlson comorbidity index) generalized linear model with a negative binomial distribution.
‡An incidence rate ratio greater than one indicates that the TRD cohort had higher adjusted rate of healthcare resource utilization than control cohorts.
§Any visit not previously classified as a hospitalization, outpatient visit, emergency visit, long-term care, home visit or mental institute visit.
*p < 0.05.
ED: Emergency department; HRU: Healthcare resource utilization; IRR: Incidence rate ratio; MDD: Major depressive disorder; TRD: Treatment-resistant depression.
Cost outcomes
With respect to costs, patients with TRD, non-TRD MDD and non-MDD incurred a total of US$16,654, US$12,133 and US$5812 in all-cause costs PPPY, respectively (Table 1 & Figure 3). Across all three study cohorts, medical costs accounted for the majority of total costs (TRD = US$12,403 [74.5%], non-TRD MDD = US$9520 [78.5%], non-MDD = US$4662 [80.2%]). After adjusting for baseline healthcare costs and Quan-Charlson comorbidity index, TRD beneficiaries incurred US$4382 and US$8294 higher PPPY total costs than non-TRD MDD and non-MDD beneficiaries, respectively (all p < 0.01; Figure 3). This difference appeared largely driven by higher medical costs (e.g., US$2767 higher PPPY costs vs non-TRD MDD, p < 0.01) and, to a lesser extent, by higher pharmacy costs (e.g., US$1616 higher PPPY costs vs non-TRD MDD, p < 0.01; Table 1). When using the non-MDD cohort as a comparator, the adjusted differences in medical and pharmacy costs reached US$5736 and US$2558, respectively (all p < 0.01; Table 1).
| Healthcare costs (US$2016) per patient per year | Mean ± SD (median) | Adjusted cost difference†,‡ (95% CI) | |||||
|---|---|---|---|---|---|---|---|
| TRD cohort | Non-TRD MDD cohort | Non-MDD cohort | Non-TRD MDD cohort | p-value | Non-MDD cohort | p-value | |
| All-cause costs | |||||||
| Total costs | 16,654 ± 25,388 (10,170) | 12,133 ± 22,212 (5985) | 5812 ± 18826 (415) | 4382 (3878; 4886) | < 0.001* | 8294 (7755; 8851) | < 0.001* |
| Pharmacy costs | 4251 ± 9876 (1814) | 2612 ± 8659 (637) | 1150 ± 5755 (3) | 1616 (1414; 1819) | < 0.001* | 2558 (2355; 2775) | < 0.001* |
| Medical costs | 12,403 ± 21,130 (6700) | 9520 ± 18,832 (4383) | 4662 ± 17,099 (133) | 2767 (2335; 3188) | < 0.001* | 5736 (5289; 6204) | < 0.001* |
| – Inpatient costs | 3688 ± 13128 (0) | 2773 ± 12,248 (0) | 1023 ± 8770 (0) | 866 (588; 1130) | < 0.001* | 1928 (1,661; 2,204) | < 0.00* |
| – ED costs | 259 ± 655 (45) | 191 ± 678 (4) | 61 ± 603 (0) | 67 (50; 82) | < 0.001* | 185 (168; 199) | < 0.001* |
| – Outpatient costs | 4126 ± 6717 (2275) | 2813 ± 5052 (1289) | 964 ± 4886 (0) | 1299 (1170; 1430) | < 0.001* | 2840 (2,699; 2,975) | < 0.001* |
| – Home care costs | 1196 ± 5510 (0) | 1038 ± 5639 (0) | 809 ± 6440 (0) | 140 (16; 261) | 0.024* | 8 (-142; 158) | 0.890 |
| – Mental-health institute costs | 220 ± 1322 (0) | 110 ± 837 (0) | 10 ± 462 (0) | 111 (81; 136) | < 0.001* | 208 (182; 232) | < 0.001* |
| – Long-term care cost | 599 ± 8089 (0) | 521 ± 6497 (0) | 226 ± 5030 (0) | 57 (-106; 226) | 0.537 | 50 (-118; 186) | 0.557 |
| – Other costs | 2314 ± 4702 (581) | 2075 ± 5635 (410) | 1568 ± 7848 (0) | 227 (117; 341) | < 0.001* | 518 (341; 693) | < 0.001* |
†Adjusted (total baseline healthcare cost and Charlson comorbidity index) cost differences were estimated using an ordinary least squares regression model and 95% CIs, and p-values were estimated using a non-parametric bootstrap procedure (N = 499).
‡A cost difference greater than zero indicates that the TRD cohort had higher costs than non-TRD MDD control cohorts.
*p < 0.05.
ED: Emergency department; MDD: Major depressive disorder; SD: Standard deviation; TRD: Treatment-resistant depression.
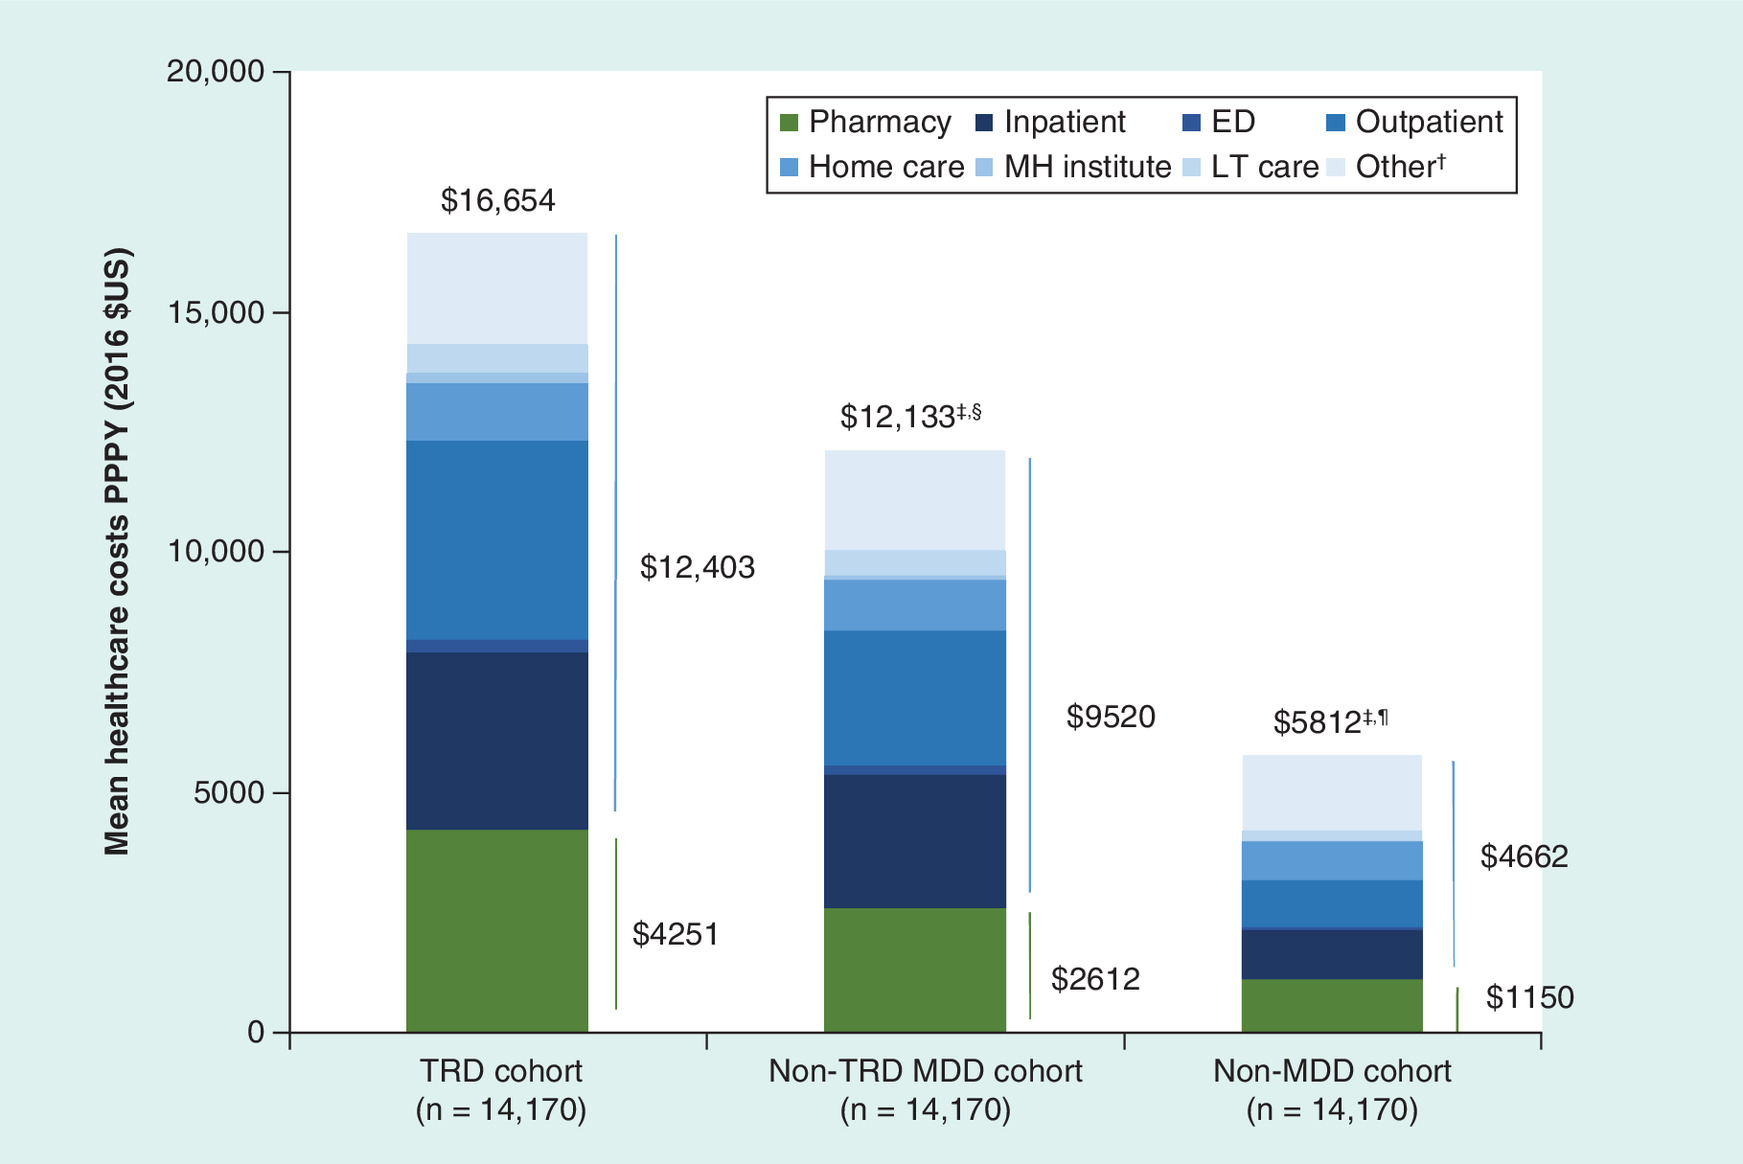
Figure 3. Medicaid spending measured from the index date up to 2 years postindex date in the USA (1 January 2010–31 March 2017).
†Any visit not previously classified as a hospitalization, outpatient visit, emergency visit, long-term care, home visit or mental institute visit.
‡Control patients (i.e., non-TRD MDD or non-MDD) were matched 1:1 on demographic characteristics to TRD patients based on exact matching factors (i.e., state) and on propensity score.
§The per-patient-per-year difference in all-cause costs reached US$4382 (95% CI: US$3878; US$4886) between the TRD and non-TRD MDD cohort. Cost differences were adjusted for baseline total healthcare costs and Quan–Charlson comorbidity index. p-values and CIs were obtained using a non-parametric bootstrap procedure (B = 499).
¶The per-patient-per-year difference in all-cause costs reached US$8294 (95% CI: US$7755; US$8851) between the TRD and non-MDD cohort. Cost differences were adjusted for baseline total healthcare costs and Quan–Charlson comorbidity index. p-values and CIs were obtained using a non-parametric bootstrap procedure (B = 499).
*p < 0.05.
ED: Emergency department; LT: Long term; MDD: Major depressive disorder; MH: Mental health; PPPY: Per patient per year; TRD: Treatment-resistant depression.
Behavioral-health costs accounted for US$2861 (17.2%) of total PPPY costs in the TRD cohort; US$1644 (13.5%) of total PPPY costs in the non-TRD MDD cohort; and US$495 (8.5%) of total PPPY costs in the non-MDD cohort (Supplementary Table 4). Similarly, depression-related costs accounted for US$1224 (7.3%) of total PPPY costs in the TRD cohort; US$696 (5.7%) of total PPPY costs in the non-TRD MDD cohort; and US$59 (1.0%) of total PPPY costs in the non-MDD cohort (Supplementary Table 4). However, when compared with the non-TRD MDD cohort, patients in the TRD cohort incurred US$1204 higher behavioral-health costs, representing 27.3% of the difference in all-cause costs (Supplementary Table 4). This difference reached US$2227 PPPY (26.9% of the all-cause cost difference) when using the non-MDD cohort as the comparator group (Supplementary Table 4). In proportion, the incremental increase in pharmacy costs for TRD versus non-TRD MDD was higher than that of medical costs during the observation period (e.g., 62.7% increase in pharmacy costs and 30.3% increase in medical costs vs non-TRD MDD).
When comparing unadjusted costs as part of a sensitivity analysis, the all-cause costs PPPY for the demographically matched TRD cohort were not substantially different from the adjusted costs described above, with cost differences reaching US$4521 and US$10,842 compared with the non-TRD MDD cohort and non-MDD cohorts, respectively (all p < 0.01).
Discussion
In this retrospective study of Medicaid beneficiaries, the cost and HRU burden of TRD was assessed and compared with two matched cohorts: one comprising patients with MDD who were not treatment resistant (i.e., the non-TRD MDD cohort), and one comprising patients without MDD (i.e., the non-MDD cohort). Approximately one out of four MDD patients met the study definition of TRD, a proportion seemingly higher than those previously reported in other real-world studies [10,18–21]. Patients with TRD had at least 20% higher rates of all-cause HRU across most HRU dimensions compared with matched patients with non-TRD MDD, highlighting the unmet needs of patients with TRD and the high healthcare burden of this condition. The all-cause healthcare costs of patients with TRD PPPY were US$4382 and US$8294 higher than those of patients with non-TRD MDD and non-MDD, respectively. This suggests the need for new effective therapeutic strategies aiming to improve the outcomes of TRD patients, which may translate into improved outcomes. Overall, these results support the high prevalence and high cost burden of TRD among Medicaid beneficiaries and establish the robustness of the cost and HRU estimates recently reported by Olfson et al. for a TRD Medicaid population [13].
The current study allows for the evaluation of the replicability and robustness of findings reported by Olfson et al., who evaluated the cost and HRU burden in a Medicaid population [13]. In spite of some differences in study design – including the stratification of the 2-year follow-up period as two consecutive 1-year periods (as done by Olfson et al.), and the use of a matching procedure (as done here) – the cost and HRU estimates provided in the present study are largely consistent with those of Olfson et al. [13]. Perhaps the most striking similarity is the prevalence of TRD, which Olfson et al. also estimated at 26% [13]. Furthermore, the results presented here build on those of Olfson et al. by additionally describing the treatment patterns in this population and by providing relative cost and HRU differences of TRD using patients without MDD as comparator. Another noteworthy difference is that the Medicaid claims data used by Olfson et al. did not allow the population's state of residency to be described, an element that may be particularly relevant in light of geographical disparities in the application of the Medicaid expansion.
Although the burden of TRD in a Medicaid population has been assessed, the putative incremental burden of TRD in a Medicaid population versus a commercial population remained unclear due to the use of different analytical methods and study designs among previous publications [10,13,19–21]. The present study used a nearly identical design to Amos et al. [10], who assessed the burden of TRD in a commercially insured population. Because of the similarity in design between this study and Amos et al.'s study, indirect comparisons of the burden of TRD in commercially insured employed patients with Medicaid patients were possible.
When comparing antidepressant treatment patterns of TRD patients with those observed by Amos et al. [10], three antidepressant categories appeared to be used differently in both populations: serotonin modulators (i.e., Amos et al.: 39.8%, current study: 50.0%) and tricyclics/tetracyclics (i.e., Amos et al.: 17.5%, current study: 31.4%) were more commonly used in the present Medicaid population, whereas NDRIs (i.e., Amos et al.: 52.6%, current study: 34.4%) were more commonly used in the population analysis by Amos et al. Since there appears to be only modest differences in the efficacy of the different antidepressants currently available (within and between classes) [14], much of these differences in treatment patterns are likely driven by physicians’ judgment of the impact of side effects on these two populations (although other factors, such as patients’ preference, may also contribute). For example, tricyclics may be particularly effective in hospitalized patients with more severe depression [14], which may explain its use being more common in the Medicaid population since the proportion of Medicaid patients with a baseline inpatient visit was almost twice as high as that observed in a commercial population [10]. Bupropion, an NDRI, is associated with limited weight gain or even weight loss, making it a valuable treatment option for overweight or obese patients [14]. The greater use of bupropion among commercially insured patients may reflect different priorities of patients with commercial insurance versus Medicaid, or the clinician's assumption of different priorities among commercially insured patients.
Socioeconomic status is a well-known predictor of the risk of mental illness [5], and sociodemographic variables like higher educational attainment and residence in middle- to high-income census tracts are associated with better responses to antidepressants and remission, respectively [22,23]. While previous real-world estimates of the prevalence of TRD among patients with MDD ranged between approximately 10–15% [18–21], the current study reported a seemingly high proportion of 26%, which may well reflect these differences in socioeconomic status, while Amos et al.'s study reported a proportion of 16% [10]. This supports the view that effective therapeutic strategies aiming to overcome treatment resistance may be particularly important in low-income populations like Medicaid beneficiaries. One of the most important limitations of currently available antidepressants is that patients may only notice clinically meaningful improvements in their condition several weeks after initiating treatment [24]. This delayed onset of action can negatively impact patients’ attitudes toward treatment and, in turn, medication adherence [24]. Given the known association between lower economic status and adherence to antidepressants [25,26], this limitation may be particularly important among Medicaid beneficiaries, hence the need for more rapidly effective treatments in this population.
The observed total all-cause costs of each cohort, and cost differences between study cohorts, appeared largely similar to those reported by Amos et al. [10], albeit the non-TRD MDD cohort having seemingly higher costs in the current study (i.e., mean costs PPPY: Amos et al. = US$10,161 [2016]; current study = US$12,133 [2016], note that costs in Amos et al. were inflated to 2016 USD using the US Medical Care consumer price index from the Bureau of Labor Statistics from the US Department of Labor) [10]. Interestingly, despite the TRD population having lower total all-cause costs in the current study versus Amos et al. [10], pharmacy costs were 18% higher in the current study (i.e., Amos et al.: US$3597 [2016], current study: US$4251 [2016]). With respect to pharmacy costs, this difference may be driven by the use of higher doses of antidepressants and differences in treatment patterns discussed above, as well as differences in the use of other medications not related to mental health. However, it should be noted that Medicaid rebates were not accounted for in the analyses performed here, which may lead to an overestimation of the real proportion of pharmacy costs. In the USA, drug manufacturers are compelled to apply a rebate in exchange for Medicaid coverage of their product. These rebates are not paid directly to Medicaid, but are shared between the states and federal government, hence their presence not being accounted for in the current analyses. With respect to the difference in total costs, this may be driven by lower reimbursements of medical care by Medicaid. In fact, even though the Medicaid population had more inpatient visits (i.e., Amos et al.: 0.74 PPPY, current study: 0.38 PPPY), inpatient costs were nonetheless lower in the Medicaid population (i.e., Amos et al.: US$4644 [2016], current study: US$3688).
For each cohort, the majority of total costs were not behavioral health-related, and, thus, cost differences between study cohorts were mostly driven by other types of healthcare expenditures. This is consistent with Amos et al.'s study, which showed that behavioral health costs accounted for a minority of total costs among TRD and non-TRD MDD patients [10], and also with another real-world study that focused on MDD as a whole (i.e., no stratification for TRD) [2]. This result adds up to the view that comorbid conditions may account for substantial economic burden of TRD [10] and MDD [2]. Of note, some studies suggested that comorbid physical illness may be associated with poorer response to treatment [27–29], although others failed to see any difference [30–33]. Moreover, it has been reported that individuals with severe mental illness are at an increased risk for a large number of physical comorbidities [34], and that they are more likely to report difficulties in accessing care to get their medical needs met [35].
The current study is subject to limitations. First, the algorithm used to identify TRD patients relied on pharmacy claims and could not incorporate other clinical considerations to specifically assess treatment failure, response and remission. Second, the study population may not be representative of all patients with TRD or MDD. For example, including patients who received an adequate dose and duration of antidepressant may have favored the inclusion of adherent patients. Moreover, patients with depression may also have other psychiatric comorbidities, but patients with concurrent diagnoses for psychosis, bipolar, manic disorder, schizophrenia or dementia were excluded to ensure the index antidepressant was prescribed for depression. Third, patients in the non-MDD cohort had a shorter follow-up compared with both MDD cohorts, and reasons for this difference could not be assessed. However, study outcomes were reported on a PPPY basis to account for the differential lengths of follow-up between cohorts. Fourth, as with all observational studies, these comparisons may be subject to residual confounding due to unmeasured confounders. Finally, this analysis focused on beneficiaries using a six-state Medicaid claims database, and therefore, findings may not be generalizable to the whole TRD population.
Conclusion
In this study of Medicaid beneficiaries, patients with TRD were observed to have higher HRU and costs compared with non-TRD MDD and non-MDD beneficiaries, which is in-line with literature describing the burden of TRD [13,19–21]. TRD poses a significant cost and HRU burden to Medicaid, which was mainly driven by nonbehavioral health HRU and costs, further demonstrating the need for developing effective treatments and patient management strategies beyond those currently available.
Recent findings in a privately-insured population have shown that treatment-resistant depression (TRD) poses a substantial burden to healthcare payers.
Thus, this study was conducted to evaluate Medicaid spending and healthcare resource utilization (HRU) in beneficiaries with TRD.
A retrospective longitudinal matched-cohort study was conducted using multistate Medicaid claims databases to identify adults diagnosed with major depressive disorder (MDD) between January 2010–March 2017, with the date of the first antidepressant defined as the index date.
MDD patients were considered to have TRD (i.e., the TRD cohort) after failing more than or equal to two antidepressant treatment regimens (including augmentation therapy) at adequate dose and duration, and initiating a third one. TRD beneficiaries were matched 1:1 to MDD beneficiaries without TRD (i.e., the non-TRD MDD cohort) and a randomly selected group of beneficiaries without MDD (i.e., the non-MDD cohort). HRU and cost outcomes were measured up to 2 years post-index date.
Per-patient-per-year costs and HRU (in incidence rate ratios [IRRs]) were compared, respectively, using ordinary least squares (p-value obtained using a nonparametric bootstrap) and negative binomial regressions.
In total, 54,405 beneficiaries with MDD – including 14,710 (26.0%) TRD patients, 40,235 (74.0%) non-TRD MDD patients – and 223,799 non-MDD patients were identified. TRD beneficiaries had higher rates of HRU than non-TRD MDD (e.g., inpatient visits: IRR [95% CI] = 1.41 [1.35–1.47]; emergency department visits: IRR [95% CI] = 1.31 [1.27–1.35]) and non-MDD cohorts (inpatient visits: IRR [95% CI] = 3.42 [3.31–3.54]; emergency department visits: IRR [95% CI] = 3.57 [3.50–3.64]).
Furthermore, TRD beneficiaries incurred significantly greater per-patient-per-year all-cause healthcare costs relative to non-TRD MDD beneficiaries (US$16,654 vs US$12,133, adjusted cost difference: US$4382; p < 0.05) and relative to non-MDD beneficiaries (US$16,654 vs US$5812, adjusted cost difference: US$8294; p < 0.05).
Medicaid beneficiaries with TRD had higher HRU and costs compared with non-TRD MDD and non-MDD beneficiaries. TRD poses a significant economic and HRU burden to Medicaid, further demonstrating the need for developing effective treatments and patient management strategies beyond those currently available for patients with MDD.
Supplementary data
To view the supplementary data that accompany this paper please visit the journal website at: www.futuremedicine.com/doi/full/10.2217/cer-2018-0140
Acknowledgments
Medical writing assistance was provided by S Rochette, an employee of Analysis Group, Inc.
Financial & competing interests disclosure
This work was funded by Janssen Scientific Affairs, and the study sponsor was involved in the research and manuscript preparation. D Pilon, D Lejeune, P Lefebvre and PE Greenberg are employees of Analysis Group, Inc., which received consultancy fees from Janssen Scientific for the conduct of this study. At the time this study was conducted, P Jacques was an employee of Janssen Scientific Affairs, LLC. At the time this study was conducted, D Singer was an employee of Janssen Scientific Affairs, LLC. JJ Sheehan and H Szukis are employees of Janssen Scientific Affairs, LLC and may own Johnson & Johnson stock/stock options. The authors have no other relevant affiliations or financial involvement with any organization or entity with a financial interest in or financial conflict with the subject matter or materials discussed in the manuscript apart from those disclosed.
Open access
This work is licensed under the Attribution-NonCommercial-NoDerivatives 4.0 Unported License. To view a copy of this license, visit http://creativecommons.org/licenses/by-nc-nd/4.0/
Ethical conduct of research
The authors state that they have obtained appropriate institutional review board approval or have followed the principles outlined in the Declaration of Helsinki for all human or animal experimental investigations. In addition, for investigations involving human subjects, informed consent has been obtained from the participants involved.
Supplementary Material
File (suppl_data.doc)
- Download
- 281.00 KB
References
Papers of special note have been highlighted as: • of interest; •• of considerable interest
1.
National Institute of Mental Health. Major depression (2018). www.nimh.nih.gov/health/statistics/major-depression.shtml.
2.
Greenberg PE, Fournier AA, Sisitsky T, Pike CT, Kessler RC. The economic burden of adults with major depressive disorder in the United States (2005 and 2010). J. Clin. Psychiatry 76(2), 155–162 (2015).
• This study quantified the direct and indirect cost burden of major depressive disorder (MDD) in the USA.
3.
Rush AJ, Trivedi MH, Wisniewski SR et al. Acute and longer-term outcomes in depressed outpatients requiring one or several treatment steps: a STAR• D report. Am. J. Psychiatry 163(11), 1905–1917 (2006).
4.
Shelton RC, Osuntokun O, Heinloth AN, Corya SA. Therapeutic options for treatment-resistant depression. CNS Drugs 24(2), 131–161 (2010).
5.
Hudson CG. Socioeconomic status and mental illness: tests of the social causation and selection hypotheses. Am. J. Orthopsychiatry 75(1), 3–18 (2005).
6.
United States Government. Eligibility (2018). www.medicaid.gov/.
7.
Zur J, Musumeci M, Garfield R. Medicaid's Role in Financing Behavioral Health Services for Low-Income Individuals. Kaiser Family Foundation, Menlo Park, USA (2017). www.kff.org/medicaid/issue-brief/medicaids-role-in-financing-behavioral-health-services-for-low-income-individuals/.
8.
Garfield RL. Mental health financing in the United States (2011). https://kaiserfamilyfoundation.files.wordpress.com/2013/01/8182.pdf.
9.
Baicker K, Allen HL, Wright BJ, Taubman SL, Finkelstein AN. The effect of Medicaid on management of depression: evidence from the Oregon Health Insurance Experiment. Milbank Q 96(1), 29–56 (2018).
10.
Amos TB, Tandon N, Lefebvre P et al. Direct and indirect cost burden and change of employment status in treatment-resistant depression: a matched-cohort study using a US Commercial Claims Database. J. Clin. Psychiatry 79(2), pii:17m11725 (2018).
•• This retrospective study used a design similar to the present study to evaluate treatment patterns, healthcare resource utilization (HRU) and costs in commercially insured patients with treatment-resistant depression (TRD), non-TRD MDD, and without MDD.
11.
Greenberg P, Corey-Lisle PK, Marynchenko M, Claxton A. Economic implications of treatment-resistant depression among employees. Pharmacoeconomics 22(6), 363–373 (2004).
12.
Mrazek DA, Hornberger JC, Altar CA, Degtiar I. A review of the clinical, economic, and societal burden of treatment-resistant depression: 1996-2013. Psychiatric Serv. 65(8), 977–987 (2014).
13.
Olfson M, Amos TB, Benson C, Mcrae J, Marcus SC. Prospective service use and health care costs of Medicaid beneficiaries with treatment-resistant depression. J. Manag. Care Spec. Pharm. 24(3), 226–236 (2018).
•• This study included Medicaid-insured patients and evaluated their HRU and costs, but used a study design different from that in the present study.
14.
Work Group on Major Depressive Disorder. Practice Guidelines for the Treatment of Patients with Major Depressive Disorder (3rd Edition). American Psychiatric Association (2010).
15.
Cohen J. The t test for means. In : Statistical Power Analysis for the Behavorial Sciences. Academic Press, Ontario, Canada (1977).
16.
Austin PC. Using the standardized difference to compare the prevalence of a binary variable between two groups in observational research. Commun. Stat. 38(6), 1228–1234 (2009).
17.
Normand ST, Landrum MB, Guadagnoli E et al. Validating recommendations for coronary angiography following acute myocardial infarction in the elderly: a matched analysis using propensity scores. J. Clin. Epidemiol. 54(4), 387–398 (2001).
18.
Cepeda MS, Reps J, Fife D, Blacketer C, Stang P, Ryan P. Finding treatment-resistant depression in real-world data: how a data-driven approach compares with expert-based heuristics. Depress. Anxiety 35(3), 220–228 (2018).
• This study developed a data-driven definition of TRD and evaluated its ability to detect patients with TRD.
19.
Cepeda MS, Reps J, Ryan P. Finding factors that predict treatment-resistant depression: results of a cohort study. Depress. Anxiety 35(7), 668–673 (2018).
• This retrospective claims study identified risk factors for developing TRD.
20.
Corey-Lisle PK, Birnbaum HG, Greenberg PE, Marynchenko MB, Claxton AJ. Identification of a claims data ‘signature’ and economic consequences for treatment-resistant depression. J. Clin. Psychiatry 63(8), 717–726 (2002).
• This study developed a treatment pattern algorithm based on health insurance claims data to classify patients with MDD as TRD likely and TRD unlikely, and compared their HRU and costs.
21.
Ivanova JI, Birnbaum HG, Kidolezi Y, Subramanian G, Khan SA, Stensland MD. Direct and indirect costs of employees with treatment-resistant and non-treatment-resistant major depressive disorder. Curr. Med. Res. Opin. 26(10), 2475–2484 (2010).
• This study compared the direct and indirect costs between TRD and non-TRD MDD patients.
22.
Cohen A, Houck PR, Szanto K, Dew MA, Gilman SE, Reynolds CF 3rd. Social inequalities in response to antidepressant treatment in older adults. Arch. Gen. Psychiatry 63(1), 50–56 (2006).
23.
Trivedi MH, Rush AJ, Wisniewski SR et al. Evaluation of outcomes with citalopram for depression using measurement-based care in STAR*D: implications for clinical practice. Am. J. Psychiatry 163(1), 28–40 (2006).
24.
Reus VI, Fochtmann LJ, Eyler AE et al. The American Psychiatric Association practice guideline on the use of antipsychotics to treat agitation or psychosis in patients with dementia. Am. J. Psychiatry 173(5), 543–546 (2016).
25.
Hansen DG, Vach W, Rosholm JU, Sondergaard J, Gram LF, Kragstrup J. Early discontinuation of antidepressants in general practice: association with patient and prescriber characteristics. Fam. Pract. 21(6), 623–629 (2004).
26.
Olfson M, Marcus SC, Tedeschi M, Wan GJ. Continuity of antidepressant treatment for adults with depression in the United States. Am. J. Psychiatry 163(1), 101–108 (2006).
27.
Papakostas GI, Petersen T, Sonawalla SB et al. Serum cholesterol in treatment-resistant depression. Neuropsychobiology 47(3), 146–151 (2003).
28.
Popkin MK, Callies AL, Mackenzie TB. The outcome of antidepressant use in the medically ill. Arch. Gen. Psychiatry 42(12), 1160–1163 (1985).
29.
Sonawalla SB, Papakostas GI, Petersen TJ et al. Elevated cholesterol levels associated with nonresponse to fluoxetine treatment in major depressive disorder. Psychosomatics 43(4), 310–316 (2002).
30.
Amital D, Fostick L, Silberman A et al. Physical co-morbidity among treatment resistant vs treatment responsive patients with major depressive disorder. Eur. Neuropsychopharmacol. 23(8), 895–901 (2013).
31.
Miller MD, Lenze EJ, Dew MA et al. Effect of cerebrovascular risk factors on depression treatment outcome in later life. Am. J. Geriatr. Psychiatry 10(5), 592–598 (2002).
32.
Perlis RH, Iosifescu DV, Alpert J, Nierenberg AA, Rosenbaum JF, Fava M. Effect of medical comorbidity on response to fluoxetine augmentation or dose increase in outpatients with treatment-resistant depression. Psychosomatics 45(3), 224–229 (2004).
33.
Small GW, Birkett M, Meyers BS, Koran LM, Bystritsky A, Nemeroff CB. Impact of physical illness on quality of life and antidepressant response in geriatric major depression. Fluoxetine Collaborative Study Group. J. Am. Geriatr. Soc. 44(10), 1220–1225 (1996).
34.
De Hert M, Correll CU, Bobes J et al. Physical illness in patients with severe mental disorders. I. Prevalence, impact of medications and disparities in health care. World Psychiatry 10(1), 52–77 (2011).
35.
Bradford DW, Kim MM, Braxton LE, Marx CE, Butterfield M, Elbogen EB. Access to medical care among persons with psychotic and major affective disorders. Psychiatric Serv. 59(8), 847–852 (2008).
Information & Authors
Information
Published In
Copyright
© 2019 D Pilon, JJ Sheehan, H Szukis, D Singer, P Jacques, D Lejeune, P Lefebvre & PE Greenberg.
History
Received: 3 December 2018
Accepted: 22 January 2019
Published online: 8 February 2019
Keywords:
Topics
Authors
Metrics & Citations
Metrics
Article Usage
Article usage data only available from February 2023. Historical article usage data, showing the number of article downloads, is available upon request.
Citations
How to Cite
Medicaid spending burden among beneficiaries with treatment-resistant depression. (2019) Journal of Comparative Effectiveness Research. DOI: 10.2217/cer-2018-0140
Export citation
Select the citation format you wish to export for this article or chapter.
Citing Literature
- Julia C. Schmidt, Rachel Davis, Erica Rapp, Micol Rothman, Elizabeth Fenstermacher, Case Report: Personalizing Transcranial Magnetic Stimulation Therapy for Treatment-Resistant Depression for a Patient with Complex Medical History, Harvard Review of Psychiatry, 10.1097/HRP.0000000000000443, 33, 6, (319-327), (2025).
- Anton L. V. Avanceña, Linh Vuong, James G. Kahn, Elliot Marseille, Psilocybin-assisted therapy for treatment-resistant depression in the US: a model-based cost-effectiveness analysis, Translational Psychiatry, 10.1038/s41398-025-03556-4, 15, 1, (2025).
- Kristin Clemens, Amanda Teeple, Benoit Rive, Noam Kirson, Urvi Desai, Jason Doran, Diab Eid, Alice Qu, Hannah Bowrey, Kruti Joshi, Cost-per-remitter for esketamine nasal spray versus quetiapine for treatment-resistant depression, Journal of Comparative Effectiveness Research, 10.57264/cer-2024-0092, 14, 7, (2025).
- Mi Seon Youn, Se Hwan Ahn, Ju Han Kim, Pharmacogenomic profiling of the South Korean population: Insights and implications for personalized medicine, Frontiers in Pharmacology, 10.3389/fphar.2024.1476765, 15, (2024).
- Christie Teigland, Iman Mohammadi, Barnabie C. Agatep, Dusica Hadzi Boskovic, Dawn Velligan, Relationship between social determinants of health and hospitalizations and costs in patients with major depressive disorder, Journal of Managed Care & Specialty Pharmacy, 10.18553/jmcp.2024.30.9.978, 30, 9, (978-990), (2024).
- Esmeralda Maricela Estrada Zamora, María Belén Trujillo Chávez, Andrés Jacobo Suarez Idrovo, Verónica Gabriela Salinas Velastegui, Byron Josue Coronel Miranda, Salud mental de los estudiantes universitarios: episodio depresivo mayor, LATAM Revista Latinoamericana de Ciencias Sociales y Humanidades, 10.56712/latam.v4i2.859, 4, 2, (2023).
- Marco Antonio Caldieraro, Teng Chei Tung, Lina Maria Agudelo Baena, Manuel Vilapriño Duprat, Ricardo Marcelo Corral, Luis Daniel Alviso de la Serna, Erasmo Saucedo, Gabriela Kanevsky, Patricia Cabrera, Depression and suicidality severity among TRD patients after 1-year under standard of care: Findings from the TRAL study, a multicenter, multinational, observational study in Latin America, Spanish Journal of Psychiatry and Mental Health, 10.1016/j.rpsm.2022.06.002, 16, 2, (85-94), (2023).
- José Almeida, Paulo Santos, Ricardo Neves, Bruno Costa, Pharmacogenomic Landscape of South Korea: Implications for Tailored Medical Treatments, Specialty Journal of Pharmacognosy, Phytochemistry, and Biotechnology, 10.51847/39Z3o1BxGE, 3, 1, (116-129), (2023).
- Yingying Huang, Ping Sun, Zhiguo Wu, Xiaoyun Guo, Xiaohui Wu, Jun Chen, Lu Yang, Xiao Wu, Yiru Fang, Comparison on the clinical features in patients with or without treatment-resistant depression: A National Survey on Symptomatology of Depression report, Psychiatry Research, 10.1016/j.psychres.2022.114972, 319, (114972), (2023).
- Simon C. Mathews, Sergey Izmailyan, Frances A. Brito, Jose-Miguel Yamal, Osama Mikhail, Frances L. Revere, Prevalence and Financial Burden of Digestive Diseases in a Commercially Insured Population, Clinical Gastroenterology and Hepatology, 10.1016/j.cgh.2021.06.047, 20, 7, (1480-1487.e7), (2022).