Comparative effectiveness of teriflunomide and dimethyl fumarate in patients with relapsing forms of MS in the retrospective real-world Teri-RADAR study
Abstract
Aim: Head-to-head clinical trials of teriflunomide (TFM) versus dimethyl fumarate (DMF) have not been conducted. Objectives: To compare the real-world effectiveness of TFM versus DMF. Methods: Anonymized data were collected from patients with relapsing multiple sclerosis (MS) initiating treatment with teriflunomide (N = 50) or DMF (N = 50). Results: On follow-up magnetic resonance imaging (MRI) compared with baseline, with TFM versus DMF treatment, the proportion of patients with new/enlarging T2 or gadolinium-enhancing lesions was 30.0 versus 40.0% (p = 0.2752). However, median annualized percent whole brain volume change was -0.1 versus -0.5 (p = 0.0212). There were no significant treatment differences on additional MRI and clinical end points and no unexpected safety signals. Conclusion: The effectiveness of teriflunomide was superior to DMF on whole brain atrophy and similar to DMF on other MRI/clinical end points.
Limited information is available on the comparative effectiveness of oral disease modifying therapies (DMTs) for the treatment of relapsing multiple sclerosis (RMS), despite increasing use of these agents. Head-to-head clinical trials have not been conducted, and direct cross-trial comparisons are generally not valid due to differences in study populations, design and outcome measures.
Teriflunomide (TFM) is an oral immunomodulator that selectively and reversibly inhibits dihydroorotate dehydrogenase, a mitochondrial enzyme essential for de novo pyrimidine synthesis [1]. In two randomized, double-blind, placebo-controlled Phase III studies in patients with RMS, TEMSO (NCT00134563) and TOWER (NCT00751881), TFM 14 mg once daily demonstrated significant efficacy over 2 years in reducing annualized relapse rate (ARR) and risk of 12-week confirmed disability worsening [2,3]. In TEMSO, TFM was superior to placebo on MRI end points including total T2-hyperintense lesion volume, number of gadolinium-enhancing (Gd+) lesions, volume of T1-hypointense lesions and T2-hyperintense lesions, number of unique active lesions and brain volume loss [3,4]. No MRI end points were obtained in TOWER [3].
Dimethyl fumarate (DMF) is an oral anti-inflammatory agent with putative cytoprotective effects mediated in part via modulation of the nuclear factor (erythroid-derived 2)-like 2 pathway [5]. In two randomized, double-blind, placebo-controlled Phase III studies in patients with relapsing-remitting MS, DEFINE (NCT00420212) and CONFIRM (NCT00451451), DMF 240 mg twice daily demonstrated significant efficacy over 2 years in reduction in ARR, number of Gd+ lesions and number of new or enlarging T2-hyperintense lesions [6,7]. DMF significantly reduced the risk of 12-week confirmed disability worsening versus placebo in DEFINE but not in CONFIRM [6,7].
Teri-RADAR is a retrospective real-world study designed to compare the effectiveness of TFM and DMF in clinical practice using data collected across several MS centers in the US. The primary objective was to assess the effect of the treatments on brain lesions and brain volume changes. Several clinical end points were also assessed as secondary outcome measures.
Methods
Study design
This Phase IV retrospective, real-world, longitudinal cohort study included patients with RMS initiating treatment with TFM or DMF at five US MS centers. Anonymized patient data including demographics, Expanded Disability Status Scale (EDSS) scores, and relapses with associated hospitalizations or corticosteroid use were collected from medical charts, and MRI scans were obtained from local Picture Archiving and Communication Systems (PACS). Participating centers supplied physician-collected electronic case report forms as part of routine clinical practice.
The date of first use of TFM or DMF was considered the index date. Collected data were classified into the following time periods: pre-index (18 months to 6 months prior to the index date), index (6 months before to 2 weeks after the index date) and follow-up (9–30 months after the index date for clinical data and 9–24 months after the index date for MRI).
Demographic, clinical and MRI data were blinded to the sponsor, contract research organization researchers and the coordinating neuroimaging analysis center where quantitative MRI analyses were performed by neuroimaging experts.
Eligibility criteria & patient selection
Eligible patients were 18–65 years of age, had been diagnosed with RMS as of the index date, and were newly initiating treatment with TFM or DMF. Patients were required to have ≥1 baseline MRI scan during the index period; ≥1 physician visit within 12 months before either the index date or the baseline MRI scan, whichever occurred earlier; and ≥1 MRI scan 9–24 months after the index date. All patients were treated with TFM 14 mg once daily or DMF 240 mg twice daily for at least three consecutive months after index date initiation. Patients were excluded if they had prior use of leflunomide (e.g., for rheumatoid arthritis or psoriatic arthritis; TFM cohort) or alemtuzumab, cladribine, rituximab, mitoxantrone or natalizumab.
To reduce the potential for enrollment bias at centers, patients who met the selection criteria were consecutively enrolled into the study. Each center identified potential TFM patients first, then searched for matching DMF patients who were within ± 3 years of age and ± 2 years of MS diagnosis year. Additional details of patient selection are available in the Supplementary Material.
MRI analysis
MRI exams were carried out using 1.5 or 3 T scanners at participating centers. The study utilized MRIs from real-world acquisition and no prior standardization was expected [8,9]. All eligible scans were required to have a 2D or 3D fluid-attenuated inversion recovery (FLAIR) sequence or a 2D or 3D T1-weighted image (T1-WI) with and/or without Gd contrast. All scans were transferred and inspected visually by experienced raters at the Buffalo Neuroimaging Analysis Center, where rater-blinded, systematic, quantitative analysis of MRI outcomes between the index and post-index scans was performed [8–10].
Gd+ and new/enlarging T2 lesion number and volume were measured on postcontrast T1 and FLAIR images, respectively [11]. T1-hypointense lesions were measured on precontrast T1 images [12].
For the baseline analyses of whole brain volume on 2D or 3D T1-WI, Structural Image Evaluation using Normalisation of Atrophy (SIENAX) software was used (version 2.6), while for longitudinal changes, the SIENA annualized percent brain volume change (PBVC) was calculated [13], as this method is used commonly in clinical trials to measure longitudinal change in whole brain volume from images acquired at different time points [4]. The lateral ventricle volume (LVV) at baseline and annualized percent LVV change (PLVVC) over follow-up were compared in the study cohorts using Neurological Software Tool for REliable Atrophy Measurement (NeuroSTREAM) on FLAIR scans [14].
End points
MRI measures were evaluated at baseline (index) and follow-up. The primary end point was the proportion of patients with new and/or enlarging T2 or Gd+ lesions. Key MRI secondary end points included the proportion of patients with new and enlarging T2 lesions; proportion of patients with Gd+ lesions; volume and number of T2 and Gd+ lesions; and whole brain and LVV changes, including proportion reaching annualized pathological cut-off for brain volume changes as reported previously [15,16].
Key clinical secondary end points included number and proportion of patients with physician-confirmed relapses and related steroid use or hospitalization; adjusted ARR (pre-index and follow-up relapses); proportion of patients achieving No Evidence of Disease Activity (NEDA-3); and post-index adverse events. NEDA-3 was a composite measure of the absence of clinically meaningful EDSS score progression (defined as a change of ≥1.0 point in patients with a reported or calculated baseline EDSS < 5.5, or a change of ≥0.5 point in patients with baseline EDSS ≥ 5.5), relapse, and new/enlarging T2 or Gd+ lesions.
Statistical analysis
A sample size of 50 per treatment group in this study was determined to generate preliminary evidence of treatment difference between the groups (i.e., without powering for any specific difference) in this real-world study.
Descriptive statistics were reported for all variables by treatment cohort.
For the primary end point, the odds of having new and/or enlarging T2 or Gd+ lesions between the two cohorts were compared using a logistic regression model, with adjustments for presence of Gd+ lesions on the baseline MRI scan (presence vs absence) and number of relapses during the pre-index period. The odds ratio (OR) estimated from the model, together with its 95% CI, are reported.
Between-cohort comparisons of percentage changes in whole brain or LVV were carried out using Wilcoxon tests, while the comparison of the proportion of patients with brain volume loss above the annualized pathological percent cut-off of -0.4% [15] for PBVC or 3.5% for PLVVC [16] was done using a χ2 test.
Statistical analysis of clinical end points is described in the Supplementary Material. All analyses were conducted using SAS version 9.3 (SAS Institute Inc., NC, USA).
Ethical conduct of the study
The study was carried out in accordance with the ethical principles outlined in the Declaration of Helsinki, the International Conference on Harmonisation Good Clinical Practice, and other applicable regulations. The study protocol and case report forms were submitted to a central Institutional Review Board (IRB) and center-specific local IRBs prior to patient recruitment.
Results
Patients
A total of 100 patients were enrolled, including 50 treated with TFM and 50 treated with DMF. The proportion of patients with relapse in the 18 months prior to the index date (22 vs 10%), ARR in the pre-index period (0.274 vs 0.083; p = 0.0227) and proportion of patients reporting baseline comorbidities (24 vs 4%; p = 0.0040) were higher in the TFM cohort (Table 1). Baseline comorbidities reported with TFM versus DMF included cardiovascular disease (16 vs 0%), Crohn's disease (12 vs 2%), ulcerative colitis (8 vs 4%), dyslipidemia (4 vs 0%), chronic obstructive pulmonary disease (2 vs 0%) and cancer (2 vs 0%). Other patient demographics and baseline disease characteristics were similar between cohorts.
| Patient characteristic | Teriflunomide (N = 50) | Dimethyl fumarate (N = 50) | p-value |
|---|---|---|---|
| Age, mean (SD), years | 49.5 (6.8) | 48.4 (7.3) | p = 0.4043† |
| Male, n (%) | 11 (22.0) | 14 (28.0) | p = 0.4884‡ |
| White, n (%) | 48 (96.0) | 45 (90.0) | p = 0.4360§ |
| Time since first diagnosis of MS, mean (SD), years | 11.8 (8.6) | 11.6 (8.5) | p = 0.8667† |
| Time since first symptoms of MS, mean (SD), years | 13.8 (8.9) | 13.1 (9.2) | p = 0.7204† |
| Comorbid conditions, n (%) | 12 (24.0)† | 2 (4.0)† | p = 0.0040‡ |
| Patients with relapse in the 18 months before index, n (%) | 11 (22.0) | 5 (10.0) | p = 0.1017‡ |
| ARR over pre-index period (95% CI) | 0.274 (0.154–0.487) | 0.083 (0.036–0.193) | p = 0.0227¶ |
| Baseline EDSS score – Mean (SD) – Median (range) | 3.0 (1.8)# 3.0 (0.0–6.5) | 3.3 (1.7)†† 3.0 (1.0–6.5) | p = 0.6438† p = 0.7108‡‡ |
| Patients with at least 1 Gd+ lesion at baseline, n (%)§§ | 9 (19.1) | 10 (21.3) | p = 0.7973‡ |
| Prior treatment with DMT, n (%)¶¶ | 45 (90.0) | 42 (84.0) | p = 0.3724‡ |
| – Interferon beta-1a IM | 28 (56.0) | 27 (54.0) | p = 0.8407‡ |
| – Interferon beta-1a SC | 13 (26.0) | 8 (16.0) | p = 0.2196‡ |
| – Interferon beta-1b | 5 (10.0) | 3 (6.0) | p = 0.7150§ |
| – Glatiramer acetate | 27 (54.0) | 24 (48.0) | p = 0.5484‡ |
| – Fingolimod | 6 (12.0) | 2 (4.0) | p = 0.2687§ |
| – Other | 3 (6.0) | 1 (2.0) | p = 0.6173§ |
†t-test.
‡χ2 test.
§Fisher exact test.
¶rate ratio of baseline number of relapses between TFM versus DMF (3.304).
#n = 31.
††n = 34.
‡‡Wilcoxon rank test.
§§out of patients with non-missing baseline Gd scans (teriflunomide, n = 47; DMF, n = 47).
¶¶Patients may have received >1 prior DMT.
ARR: Annualized relapse rate; DMT: Disease modifying therapy; EDSS: Expanded Disability Status Scale; IM: Intramuscular; SC: Subcutaneous; SD: Standard deviation.
Prior to initiation of index treatment, 90.0% of patients in the TFM cohort and 84.0% in the DMF cohort had received prior treatment with other MS DMTs, most commonly intramuscular IFN-β-1a and glatiramer acetate (Table 1). The proportions of patients with two prior DMTs (28.9 vs 21.4%), three prior DMTs (20.0 vs 16.7%), or ≥4 prior DMTs (4.4 vs 0%) were higher in the TFM cohort.
At follow-up, mean (range) treatment exposure was 15.2 (8.9–23.0) months in the TFM cohort and 15.7 (8.2–26.7) months in the DMF cohort. All TFM-treated patients remained on 14 mg once daily until the end of follow-up. More than a third of DMF patients (38%) started at the recommended dosage in the US Prescribing Information (120 mg twice daily), and all of these patients received the recommended maintenance dose of 240 mg twice daily for more than 3 months by the end of follow-up.
MRI end points
The mean ± standard deviation (SD) time between baseline and follow-up MRI scans was 17.3 ± 4.5 months in the TFM cohort and 17.3 ± 4.9 months in the DMF cohort.
At follow-up, 30.0% (n = 15) of patients in the TFM cohort and 40.0% (n = 20) of patients in the DMF cohort had a new and/or enlarging T2 lesion or Gd+ lesion (primary end point); this difference did not reach statistical significance (OR: 0.617, 95% CI: 0.26–1.47, p = 0.2752, Figure 1). The difference between cohorts was driven primarily by a difference in the proportion of patients with new and/or enlarging T2 lesions (26.0% with TFM vs 40.0% with DMF); the proportion of patients with Gd+ lesions was 16.7 and 12.8%, respectively.
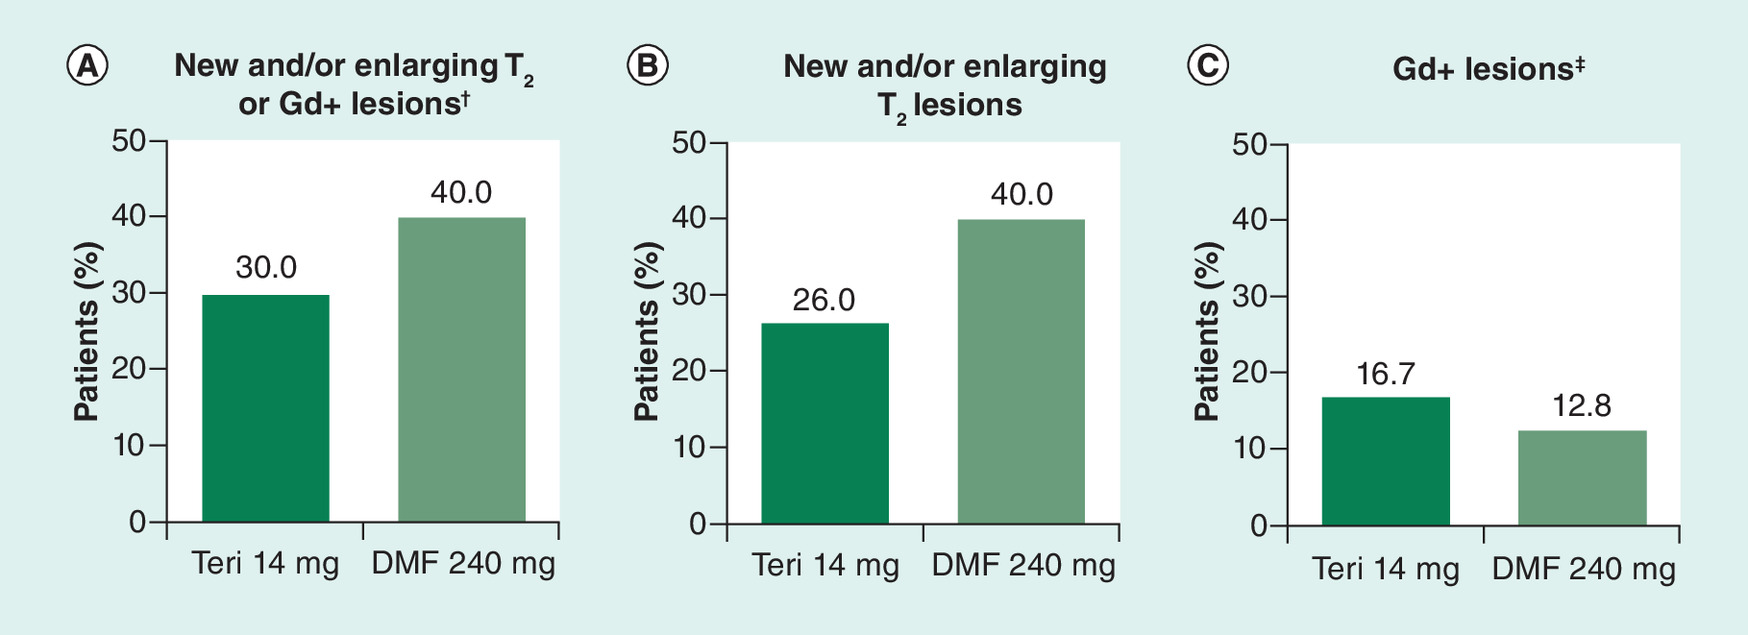
Figure 1. Proportion of patients at follow-up with (A) new and/or enlarging T2 or Gd+ lesions; (B) new and/or enlarging T2 lesions; and (C) new Gd+ lesions.
†p = 0.2752.
‡Proportion of patients with Gd+ lesions based on number of patients with follow-up scans: n = 48 for teriflunomide 14 mg; n = 47 for DMF.
DMF: Dimethyl fumarate; GD+ Gadolinium-enhancing; Teri: Teriflunomide.
PBVC was measurable only on a subset of patients (TFM, n = 27; DMF, n = 29) due to missing scans and hardware, software and protocol changes that affected reliable PBVC measurement on quality control (QC). Annualized PBVC between index and follow-up scans was significantly lower in the TFM cohort compared with DMF (median change: -0.1 vs -0.5, p = 0.0212, Figure 2A and Table 2). The proportion of patients who developed brain atrophy, with an annualized PBVC of <–0.4% [15] was significantly smaller for TFM compared with DMF (25.9% [n = 7] vs 58.6% [n = 17], p = 0.0135). Nonannualized PBVC is shown in Figure 2C and Table 2.
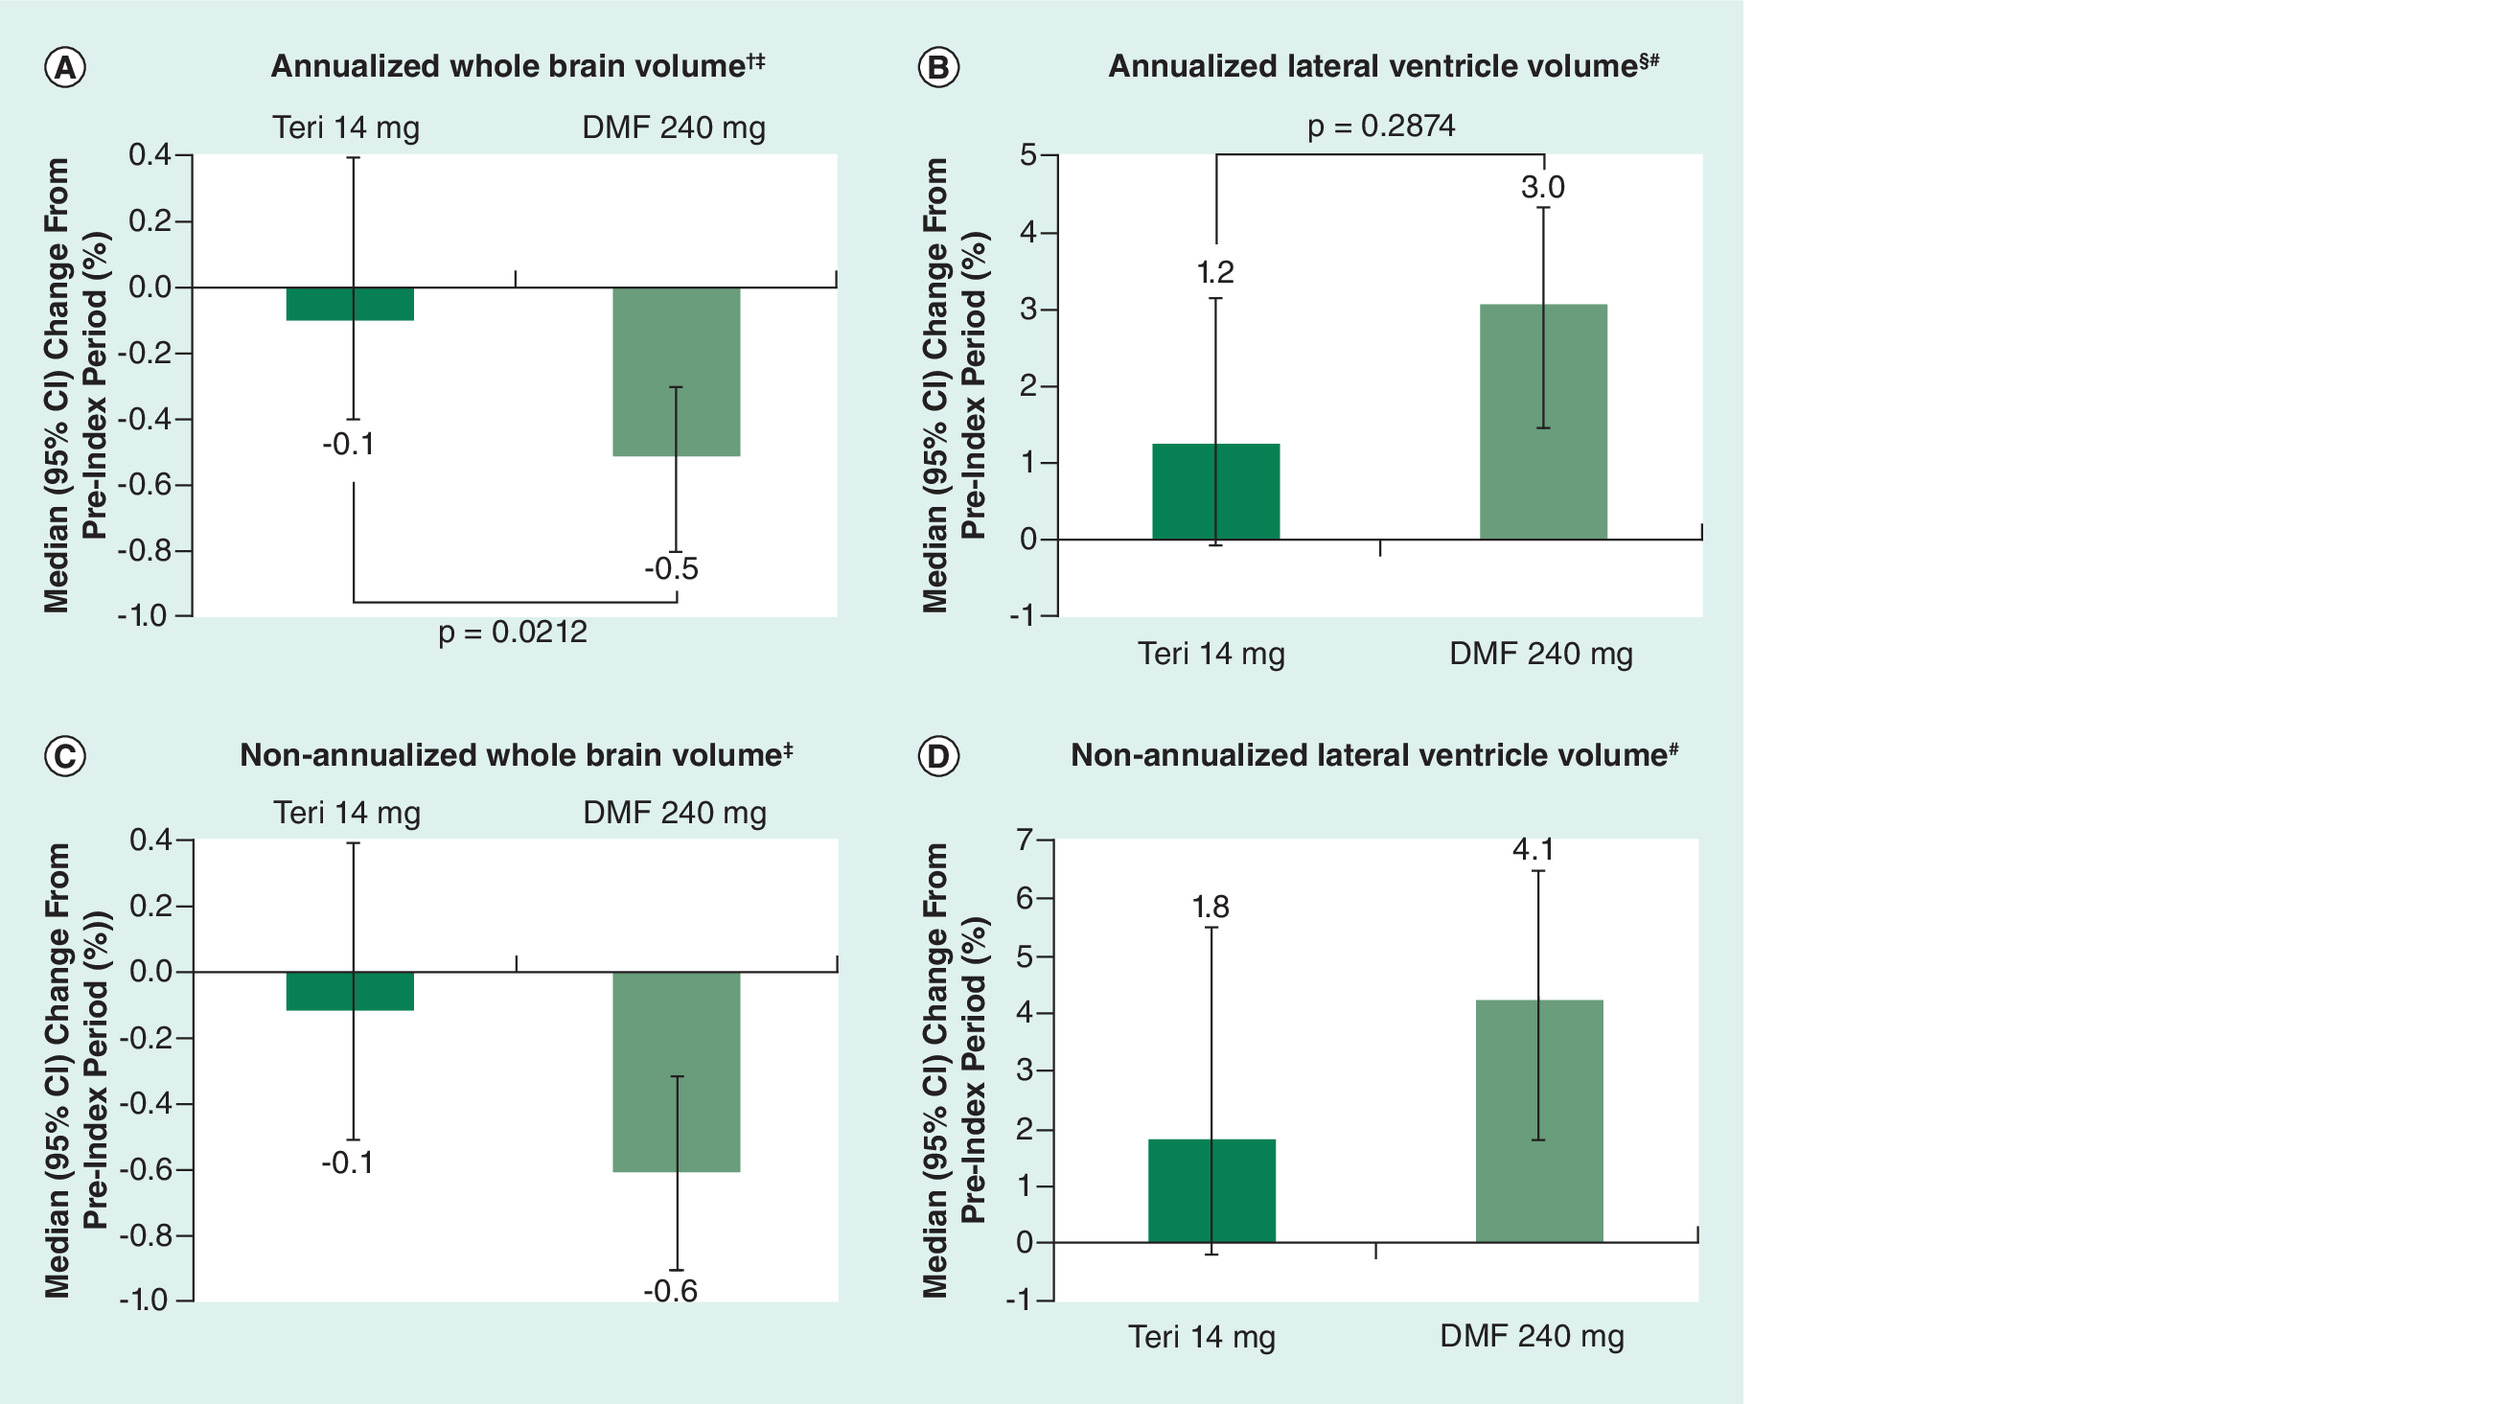
Figure 2. Change in (A) annualized whole brain volume, (B) annualized lateral ventricle volume, (C) non-annualized whole brain volume, and (D) non-annualized lateral ventricle volume, during follow-up versus the pre-index period.
†p = 0.0212.
‡Teri-treated patients, n = 27; DMF-treated patients, n = 29.
§p = 0.2874.
#Teri-treated patients, n = 50; DMF-treated patients, n = 49.
DMF: Dimethyl fumarate; Teri: Teriflunomide.
| Teriflunomide (N = 50) | Dimethyl fumarate (N = 50) | p value | |
|---|---|---|---|
| Annualized PBVC | |||
| Patients with reported annualized whole brain volume change, n (%) | 27 (54.0) | 29 (58.0) | |
| Mean (95% CI); SD | -0.2 (-0.5, 0.1); 0.8 | -0.5 (-0.9, -0.2); 0.9 | |
| Median (Q1–Q3) | -0.1 (-0.5, 0.4) | -0.5 (-0.9, -0.2) | p = 0.0212 |
| Range | -3.0:0.9 | -2.7:2.2 | |
| Patients with annualized PBVC <- 0.4%, n (%) | 7 (25.9) | 17 (58.6) | p = 0.0135 |
| Patients with annualized PBVC ≥- 0.4%, n (%) | 20 (74.1) | 12 (41.4) | |
| Non-annualized PBVC | |||
| Patients with reported PBVC, n (%) | 27 (54.0) | 29 (58.0) | |
| Mean (95% CI); SD | -0.2 (-0.5, 0.1); 0.8 | -0.7 (-1.1, -0.3); 1.1 | |
| Median (Q1–Q3) | -0.1 (-0.7, 0.4) | -0.6 (-1.1, -0.3) | |
| Range | -3.0:0.9 | -3.6:2.2 | |
| Annualized PLVVC | |||
| Patients with reported annualized lateral ventricular volume change, n (%) | 50 (100.0) | 49 (98.0) | |
| Mean (95% CI); SD | 1.5 (-0.2, 3.3); 6.2 | 2.3 (0, 4.5); 7.8 | |
| Median (Q1–Q3) | 1.2 (-1.7, 4.5) | 3.0 (-0.4, 6.0) | p = 0.2874 |
| Range | -13.4:13.9 | -26.9:26.5 | |
| Patients with annualized PLVVC < 3.5%, n (%) | 34 (68.0) | 28 (57.1) | |
| Patients with annualized PLVVC ≥ 3.5%, n (%) | 16 (32.0) | 21 (42.9) | p = 0.2643 |
| Non-annualized PLVVC | |||
| Patients with reported PLVVC, n (%) | 50 (100.0) | 49 (98.0) | |
| Mean (95% CI); SD | 2.2 (-0.3, 4.6); 8.5 | 4.1 (1.3, 6.8); 9.4 | |
| Median (Q1–Q3) | 1.8 (-2.7, 6.0) | 4.1 (-0.8, 8.4) | |
| Range | -20.4:24.8 | -26.3:28.1 | |
†Average time between baseline MRI scan and follow-up MRI scan was 17.3 months for both cohorts.
FLAIR: Fluid-attenuated inversion recovery; max: Maximum; min: Minimum; MRI: Magnetic resonance imaging; PBVC: Percent whole brain volume change; PLLVC: Percent lateral ventricular volume change; Q1: First quartile; Q3: Third quartile; SD: Standard deviation.
PLVVC was measurable in all but one patient (TFM, n = 50; DMF, n = 49). Annualized PLVVC was numerically lower in TFM-treated patients versus DMF-treated patients, but the difference was not statistically significant (median change: 1.2 vs 3.0, p = 0.2874, Figure 2B and Table 2). The proportion of patients with annualized PLVVC of >3.5% [16] was also numerically lower in the TFM cohort (32.0% [n = 16] vs 42.9% [n = 21]; p = 0.2643). Nonannualized PLVVC is shown in Figure 2D and Table 2.
There were no notable differences between cohorts in brain lesion volume changes between baseline and follow-up (Supplementary Table 1) or number of T2, Gd+, or T1 hypointense lesions (Table 3).
| Teriflunomide (N = 50) | Dimethyl fumarate (N = 50) | |
|---|---|---|
| Number of new or enlarging T2 lesions at follow-up per person, n | ||
| Number of patients with non-missing T2 scans, n (%) | 50 (100.0) | 50 (100.0) |
| Mean (95% CI); SD | 1.0 (0.4, 1.7); 2.4 | 1.0 (0.5, 1.5); 1.9 |
| Median (Q1–Q3) | 0.0 (0.0, 1.0)‡ | 0.0 (0.0, 1.0)‡ |
| Range | 0.0:12.0 | 0.0:9.0 |
| Number of Gd+ lesions, n | ||
| Number of patients with non-missing follow-up Gd scans, n (%) | 48 (96.0) | 47 (94.0) |
| Mean (95% CI); SD | 0.9 (-0.1, 1.8); 3.4 | 0.7 (-0.2, 1.6); 3.1 |
| Median (Q1–Q3) | 0.0 (0.0, 0.0)‡ | 0.0 (0.0, 0.0)‡ |
| Range | 0.0:22.0 | 0.0:20.0 |
| Number of new and/or enlarging T1 hypointense lesions, n | ||
| Number of patients with precontrast T1 follow-up scan, n (%) | 46 (92.0) | 48 (96.0) |
| Mean (95% CI); SD | 0.5 (0.2, 0.8); 1.0 | 0.4 (0.2, 0.7); 0.9 |
| Median (Q1–Q3) | 0.0 (0.0, 1.0)‡ | 0.0 (0.0, 0.5)‡ |
| Range | 0.0:5.0 | 0.0:4.0 |
†Average time between baseline MRI scan and follow-up MRI scan was 17.3 months for both cohorts.
‡No significant difference between the teriflunomide and DMF cohorts (p > 0.05).
Gd+: Gadolinium-enhancing; max: Maximum; min: Minimum; MRI: Magnetic resonance imaging; Q1: First quartile; Q3: Third quartile; SD: Standard deviation.
Clinical end points
Compared with the pretreatment period, there was a decrease in ARR in the TFM cohort and an increase in the DMF cohort. ARRs for the TFM cohort were 0.274 (95% CI: 0.154–0.487) during the pre-index period and 0.209 (95% CI: 0.113–0.386) over the follow-up period, corresponding to a 24% relative reduction. ARRs for the DMF cohort were 0.083 (95% CI: 0.036–0.193) during the pre-index period and 0.119 (95% CI: 0.055–0.258) over the follow-up period, corresponding to a 43% relative increase, driven largely by the low pre-index ARR.
In the pre-index period, physician-confirmed relapses were observed in 22.0% (n = 11) of TFM-treated patients and 10.0% (n = 5) of DMF-treated patients. A total of 14.0% (n = 7) of patients in the TFM cohort experienced pre-index relapses requiring treatment with corticosteroids, compared with 8.0% (n = 4) of patients in the DMF cohort. Over the follow-up, physician-confirmed relapses were observed in 22.0% (n = 11) of TFM-treated patients and 16.0% (n = 8) of DMF-treated patients. No patients experienced a relapse requiring hospitalization during the follow-up period.
EDSS scores at follow-up were available for 33 TFM-treated patients and 34 DMF-treated patients. Median (interquartile range) EDSS scores were 3.0 (2.0, 3.5) in the TFM cohort and 3.0 (1.5, 4.0) in the DMF cohort. For patients with reported data at both time points (n = 31 for TFM, n = 34 for DMF), there was no change in EDSS scores between the pre-index period and follow-up in either cohort, on average (mean [SD] change: 0.0 [1.1] for TFM and 0.0 [0.7] for DMF).
At follow-up, the proportion of patients with NEDA-3 was the same in both cohorts (46%) (Supplementary Table 2).
Adverse events
Treatment-related adverse events (AEs) were reported in 24 and 28% of TFM- and DMF-treated patients, respectively (Supplementary Tables 3 & 4). The most common treatment-related AE with TFM was diarrhea (16%) and with DMF was rash (28%). There were no serious AEs observed.
Discussion
No randomized, controlled, prospective, comparative clinical trial data are available to evaluate the relative efficacy of TFM versus DMF for the treatment of RMS. Indirect evidence-based approaches such as number needed to treat suggest that the two agents exhibit comparable efficacy across key clinical outcomes [17], but analyses of this type are subject to limitations, and comparisons of results across clinical trials are generally not considered valid [18]. Teri-RADAR is a retrospective, real-world, longitudinal cohort study comparing the effectiveness of TFM and DMF in patients with RMS initiating treatment in clinical practice in the US.
The primary end point was the proportion of patients with new and/or enlarging T2 or Gd+ lesions on follow-up MRI (9–24 months after treatment initiation) compared with baseline MRI (6 months before treatment initiation to 2 weeks after treatment initiation). There was a numerical but not statistically significant difference between the TFM and DMF cohorts (30.0 vs 40.0%, respectively; p = 0.2752). The effect appeared to be dominated by a difference in new/newly enlarging T2 lesions (26.0 vs 40.0%), with a relatively smaller difference in Gd+ lesions (16.7 vs 12.8%). There were no significant differences on other lesion measures including number and volume of T2, Gd+, and T1 lesions. These findings suggest comparable effectiveness of TFM and DMF on traditional, lesion-based MRI measures of disease activity.
Brain atrophy, characterized by loss of gray and/or white matter, as well as enlargement of ventricles, occurs over time in MS patients and is increasingly utilized as an end point in clinical trials [19] due in part to its relation to clinical outcomes such as long-term disability progression [8,20]. In Teri-RADAR, longitudinal changes in whole brain volume were assessed as SIENA annualized PBVC, and longitudinal changes in LVV were assessed as annualized PLVVC. PBVC analyses were based on a subset of patients (56%) for whom PBVC data were available (TFM, n = 27; DMF, n = 29). PLVVC data were available for nearly all patients (TFM, n = 50; DMF, n = 49).
Annualized PBVC was significantly lower with TFM versus DMF (median change: -0.1 vs -0.5; p = 0.0212), suggesting slowing of whole brain atrophy with TFM treatment. The clinical meaningfulness of this finding was supported by using a cut-off value for pathological whole brain volume loss (annualized PBVC change of <-0.4%), which has been shown to discriminate MS patients from healthy controls with 67% sensitivity and 80% specificity [14]. The proportion of patients with annualized whole brain volume loss greater than this cutoff was significantly smaller with TFM versus DMF (25.9 vs 58.6%; p = 0.0135). These findings suggest a meaningful reduction in whole brain atrophy rate with TFM, consistent with results of pivotal clinical studies [2–4,19] and suggesting that brain volume change may be a valid outcome measure in studies within the context of routine clinical practice [8–10].
On annualized PLVVC, there was a numeric, but not statistically significant, reduction with TFM versus DMF (median change: 1.2 vs 3.0, respectively; p = 0.2874), and no statistically significant difference in the proportion of patients with PLVVC exceeding a cutoff value for pathological change (annualized PLVVC >3.5%) [16] with TFM versus DMF (32.0 vs 42.9%, respectively; p = 0.2643), the lack of statistical significance possibly due in part to small cohort size. Although measurement of LVV on FLAIR is emerging as a clinically relevant measure in real-world studies [9], it has not been widely applied in MS clinical trials.
This relatively small (N = 100) study was not powered to examine differences in clinical outcomes. However, clinical measures including number and proportion of patients with relapses, ARR and proportion of patients achieving NEDA-3 were among the secondary end points, none of which showed a significant difference between the TFM and DMF cohorts. Potentially confounding differences at baseline included proportion of patients with comorbidities (24 vs 4%), proportion of patients with relapse in the 18 months prior to the index date (22 vs 10%), baseline ARR (0.274 vs 0.083), proportion of patients with relapses requiring steroids (14.0 vs 8.0%) and proportion of patients with 2, 3 or ≥4 prior DMTs (28.9 vs 21.4%, 20.0 vs 16.7%, and 4.4 vs 0%, respectively).
There were no unexpected safety signals for either treatment. Reported AEs were consistent with the known profiles of these drugs.
A major limitation of the Teri-RADAR study is that it is retrospective, nonrandomized and nonblinded, as opposed to a randomized controlled clinical trial. Hence, there was no strict standardization in terms of patient selection, timing of assessments after initiating treatment with TFM or DMF, or MRI scanner/protocol acquisition. However, our focus was to examine outcomes in a community-based, real-world practice setting, with its inherent variability, in which the great majority of MS patients are cared for. The feasibility and utility of retrospectively assessing longitudinal brain MRI changes in routine clinical practice, using different MRI scanners and without prior standardization of the MRI protocol, has been demonstrated previously [9]. Results from a similar observational, retrospective, real-world study – the MS-MRIUS study – demonstrated the feasibility of assessing clinical and MRI outcomes under these conditions [8,9]. With regard to brain atrophy, the investigators determined that MRI scans obtained in nonacademic centers were of sufficient quality for analysis, and outcomes were not impacted significantly by changes in imaging software, coil or protocol from index to post-index scans [9]. Importantly, clinical and MRI outcomes including Gd+ and T2 lesion volume, annualized PBVC and PLVVC, and achievement of NEDA status were similar in patients treated with fingolimod in the real-world setting compared with pivotal clinical trials [21–24].
Matching of patients was based only on age and disease duration and not on disability. As only a subset of patients had a baseline EDSS score in their chart, restricting the sample to patients with a baseline EDSS score could have introduced limitations in terms of generalizability of providers or patients in a real-world study.
It is notable that, at baseline, there were more patients with relapses in the TFM cohort (n [%] of patients with relapse in prior 18 months: 11 [22.0] with TFM vs 5 [10.0] with DMF), but more patients with Gd+ lesions in the DMF cohort (n [%] of patients with at least 1 Gd+ lesion: 9 [19.1] with TFM vs 10 [21.3] with DMF), which could be seen as contradictory. It is possible that some Gd+ lesions could have been missed depending on the timing of MRI scans, whereas typically all relapses are captured in a patient's chart.
Other limitations of this study include the relatively small sample size, inclusion of mostly (>90%) white patients, limited availability of clinical and treatment history of the patients, and relatively short follow-up period (9–24 months for MRI). Furthermore, observed differences between treatment groups on clinical measures at pre-index/index and number of patients with data available at both pre-index and post-index make comparisons of clinical outcomes of limited value. With regard to the MRI outcomes, the increased baseline ARR in TFM-treated patients compared with DMF-treated patients may be indicative of increased inflammatory activity, which could have potentially influenced the changes of brain volume measures after introduction of these treatments. However, despite potentially higher inflammatory activity at baseline in the TFM-treated subjects, we found a slower rate of brain volume loss over the follow-up in that treatment group, which make the findings even more conservative and less likely to be related to the potential pseudoatrophy effect [25]. In addition, the study included only patients who recently began treatment with TFM or DMF, whose index and post-index MRI scans were available, and the data were limited to existing information recorded in medical records, introducing a potential for unobserved confounding factors. Finally, observational data do not allow for measurement of a causal relationship between exposure and outcome.
Conclusion
In conclusion, these findings, obtained in a real-world setting, suggest that TFM had comparable effectiveness to DMF on several MRI and clinical end points and superior effectiveness on measures of whole brain atrophy. These findings reinforce the efficacy of TFM for the treatment of RMS as established in pivotal clinical trials [2–4,19].
Future perspective
The great expense and selection bias inherent in large, prospective clinical trials argue in favor of increased utilization of real-time post-marketing, clinical practice-based, so-called ‘real-world’, studies of comparative efficacy, and safety of disease-modifying agents. With future improvements in patient selection, standardization of clinical and MRI documentation, and information technology-based electronic data collection and sharing, the community-based clinical research platform may become the standard for comparative efficacy research, creating for the first time a practical approach that embraces the participation of more clinics, more investigators and more patients, in a setting that more genuinely reflects patient and clinician experiences.
No randomized, controlled, prospective, comparative clinical trial data are available to evaluate the relative efficacy of teriflunomide (TFM) versus dimethyl fumarate (DMF) for the treatment of relapsing multiple sclerosis (RMS).
Teri-RADAR is a retrospective real-world study designed to compare the effectiveness of TFM and DMF in clinical practice using data collected across several MS centers in the US. Anonymized data from patients with RMS initiating treatment with TFM (N = 50) or DMF (N = 50) were collected from medical records and magnetic resonance imaging (MRI) scans.
On follow-up MRI (9–24 months after treatment initiation) compared with baseline MRI (6 months before treatment initiation to 2 weeks after treatment initiation), the proportion of patients with new and/or enlarging T2 or gadolinium-enhancing (Gd+) lesions was numerically lower with TFM versus DMF (30.0 vs 40.0%; p = 0.2752).
There were no significant differences on other lesion measures including number and volume of T2, Gd+ and T1 lesions, suggesting comparable effectiveness of TFM and DMF on traditional, lesion-based MRI measures of disease activity.
Annualized percent whole brain volume change was significantly lower with TFM versus DMF (median change: -0.1 vs -0.5, p = 0.0212), and the proportion of patients with annualized whole brain volume loss greater than a cutoff value for pathological change (annualized percent brain volume change of <–0.4%) was significantly smaller with TFM versus DMF (25.9 vs 58.6%; p = 0.0135), suggesting a meaningful reduction in whole brain atrophy rate with TFM.
On annualized percent lateral ventricular volume change (PLVVC), there was a numeric but not statistically significant reduction with TFM versus DMF (median change: 1.2 vs 3.0; p = 0.2874), and no statistically significant difference in the proportion of patients with PLVVC exceeding a cutoff value for pathological change (annualized PLVVC >3.5%; 32.0 vs 42.9%, respectively; p = 0.2643).
Effects on clinical end points were similar between the two treatments, and there were no unexpected safety signals for either treatment.
These findings suggest that TFM had comparable effectiveness to DMF on several MRI and clinical end points and superior effectiveness on measures of whole brain atrophy.
Supplementary data
To view the supplementary data that accompany this paper please visit the journal website at: Supplementary Material
Acknowledgments
The authors would like to thank the patients, their families and all investigators involved in this study.
Financial & competing interests disclosure
This work was supported by Sanofi. Statistical support was provided by A Seetasith, K Wada and Y-C Lee of IQVIA and Elizabeth Poole of Sanofi. Medical writing and editorial support was provided under the direction of the authors by J Hoffman, PharmD, RPh, of Onyx (Knutsford, UK), funded by Sanofi, and K Liu, PhD, of Sanofi. The manuscript was reviewed by DP Baker, PhD and J Valenzano, PharmD, of Sanofi. The sponsor was involved in the study design, collection, analysis, and interpretation of data, as well as verification of the data presented in the manuscript. The authors had unrestricted access to study data, were responsible for all content and editorial decisions, and received no honoraria related to the development of this publication.
R Zivadinov reports speaking and consultant fees from Celgene, EMD Serono, Genzyme, Novartis; financial support for research activities from Genzyme, Novartis, Penumbra, Protembis, QuintilesIMS; and is on the editorial board of BioMed Research International, BMC Medicine, BMC Neurology, Clinical CNS Drugs, Conf Pap Neurosci, Journal of Alzheimer's Disease, and Vein and Lymphatics.
K Kresa-Reahl reports speaking and/or consultant fees from Biogen, Celgene, EMD Serono, Genentech, Sanofi/Genzyme, Novartis, and Teva Neuroscience, and research support from Biogen, Genentech, Sanofi/Genzyme, and Novartis.
B Weinstock-Guttman has participated in speaker's bureaus and/or served as a consultant for Biogen Idec, Teva Neuroscience, EMD Serono, Novartis, Genzyme & Sanofi and Genentech and Celgene. Dr. Weinstock-Guttman also has received grant/research support from the agencies previously listed. She serves on the editorial board for BMJ Neurology, Journal of International MS, CNS Drugs and Frontiers in Neurology.
K Edwards reports research support from Biogen, Genentech, Genzyme/Sanofi, and Hoffman-La Roche.
C Burudpakdee is an employee of IQVIA and reports consulting fees from Genzyme.
N Bergsland has nothing to disclose.
MG Dwyer reports consulting fees from Claret Medical and EMD Serono, and research support from Novartis.
B Khatri reports consulting fees from Bayer, Biogen Idec, Genzyme, Novartis, Pfizer, Questcor, Serono, Terumo, and Teva, and is on speaker bureaus for Bayer, Biogen Idec, Genzyme, Novartis, Pfizer, Questcor, Serono, Terumo, and Teva.
K Thangavelu is an employee of Sanofi, with ownership interest.
J Chavin is an employee of Sanofi.
M Mandel was an employee at Sanofi at the time the study was conducted, with ownership interest.
S Cohan reports consulting fees, scientific advisory board, speaking honoraria, or other activities (Acorda, Biogen, Roche Genentech, Novartis, Sanofi Genzyme); and research steering committees, research support (Biogen, MedDay, Novartis, Roche Genentech, Sanofi Genzyme).
The authors have no other relevant affiliations or financial involvement with any organization or entity with a financial interest in or financial conflict with the subject matter or materials discussed in the manuscript apart from those disclosed.
Ethical conduct of research
The authors state that they have obtained appropriate institutional review board approval or have followed the principles outlined in the Declaration of Helsinki for all human or animal experimental investigations.
Open access
This work is licensed under the Attribution-NonCommercial-NoDerivatives 4.0 Unported License. To view a copy of this license, visit http://creativecommons.org/licenses/by-nc-nd/4.0/
Supplementary Material
File (supplementary_materials.docx)
- Download
- 27.31 KB
References
Papers of special note have been highlighted as: • of interest; •• of considerable interest
1.
Gold R, Wolinsky JS. Pathophysiology of multiple sclerosis and the place of teriflunomide. Acta Neurol. Scand. 124, 75–84 (2011).
2.
Confavreux C, O'Connor P, Comi G et al. Oral teriflunomide for patients with relapsing multiple sclerosis (TOWER): a randomised, double-blind, placebo-controlled, Phase 3 trial. Lancet Neurol. 13, 247–256 (2014).
3.
O'Connor P, Wolinsky JS, Confavreux C et al. Randomized trial of oral teriflunomide for relapsing multiple sclerosis. N. Engl. J. Med. 365, 1293–1303 (2011).
4.
Radue EW, Sprenger T, Gaetano L et al. Teriflunomide slows BVL in relapsing MS: A reanalysis of the TEMSO MRI data set using SIENA. Neurol. Neuroimmunol. Neuroinflamm. 4, e390 (2017).
5.
Linker RA, Gold R. Dimethyl fumarate for treatment of multiple sclerosis: mechanism of action, effectiveness, and side effects. Curr. Neurol. Neurosci. Rep 13, 394 (2013).
6.
Fox RJ, Miller DH, Phillips JT et al. Placebo-controlled Phase 3 study of oral BG-12 or glatiramer in multiple sclerosis. N. Engl. J. Med. 367, 1087–1097 (2012).
7.
Gold R, Kappos L, Arnold DL et al. Placebo-controlled Phase 3 study of oral BG-12 for relapsing multiple sclerosis. N. Engl. J. Med. 367, 1098–1107 (2012).
8.
Zivadinov R, Khan N, Medin J et al. An observational study to assess brain MRI change and disease progression in multiple sclerosis clinical practice – the MS-MRIUS study. J. Neuroimaging 27, 339–347 (2017).
9.
Zivadinov R, Bergsland N, Korn JR et al. Feasibility of brain atrophy measurement in clinical routine without prior standardization of the MRI protocol: results from MS-MRIUS, a longitudinal observational, multicenter real-world outcome study in patients with relapsing-remitting MS. AJNR Am. J. Neuroradiol. 39, 289–295 (2018).
• Demonstrates feasibility of retrospectively assessing longitudinal brain magnetic resonance imaging changes in routine clinical practice.
10.
Weinstock-Guttman B, Medin J, Khan N et al. Assessing ‘no evidence of disease activity’ status in patients with relapsing-remitting multiple sclerosis receiving fingolimod in routine clinical practice: a retrospective analysis of the Multiple Sclerosis Clinical and Magnetic Resonance Imaging Outcomes in the USA (MS-MRIUS) study. CNS Drugs 32, 75–84 (2018).
11.
Zivadinov R, Havrdova E, Bergsland N et al. Thalamic atrophy is associated with development of clinically definite multiple sclerosis. Radiology 268, 831–841 (2013).
12.
Zivadinov R, Dwyer M, Barkay H, Steinerman JR, Knappertz V, Khan O. Effect of glatiramer acetate three-times weekly on the evolution of new, active multiple sclerosis lesions into T1-hypointense “black holes”: a post hoc magnetic resonance imaging analysis. J. Neurol. 262, 648–653 (2015).
13.
Smith SM, Zhang Y, Jenkinson M et al. Accurate, robust, and automated longitudinal and cross-sectional brain change analysis. Neuroimage 17, 479–489 (2002).
• Describes method used to measure longitudinal change in whole brain volume from images acquired at different time points.
14.
Dwyer MG, Silva D, Bergsland N et al. Neurological software tool for reliable atrophy measurement (NeuroSTREAM) of the lateral ventricles on clinical- quality T2-FLAIR MRI scans in multiple sclerosis. Neuroimage Clin. 15, 769–779 (2017).
• Demonstrates that measurement of lateral ventricle volume changes relates to clinical outcomes.
15.
De Stefanox N, Stromillo ML, Giorgio A et al. Establishing pathological cut-offs of brain atrophy rates in multiple sclerosis. J. Neurol. Neurosurg. Psychiatry 87, 93–99 (2016).
•• Provides evidence-based cut-off for pathological brain atrophy rate in multiple sclerosis (MS) (% brain volume change per year of -0.4%) and demonstrates clinical relevance.
16.
Dwyer MG, Hagemeier J, Bergsland N et al. Establishing pathological cut-offs for lateral ventricular volume expansion rates. Neuroimage Clin. 18, 494–501 (2018).
•• Provides evidence-based cut-off for pathological lateral ventricular volume expansion rate in MS (% lateral ventricular volume change per year of 3.5%) and demonstrates clinical relevance.
17.
Freedman MS, Montalban X, Miller AE et al. Comparing outcomes from clinical studies of oral disease-modifying therapies (dimethyl fumarate, fingolimod, and teriflunomide) in relapsing MS: Assessing absolute differences using a number needed to treat analysis. Mult. Scler. Relat. Disord. 10, 204–212 (2016).
18.
Freedman MS, Hughes B, Mikol DD et al. Efficacy of disease-modifying therapies in relapsing remitting multiple sclerosis: a systematic comparison. Eur. Neurol. 60, 1–11 (2008).
19.
Miller AE, Wolinsky JS, Kappos L et al. Oral teriflunomide for patients with a first clinical episode suggestive of multiple sclerosis (TOPIC): a randomised, double-blind, placebo-controlled, Phase 3 trial. Lancet Neurol. 13, 977–986 (2014).
20.
Popescu V, Agosta F, Hulst HE et al. Brain atrophy and lesion load predict long term disability in multiple sclerosis. J. Neurol. Neurosurg. Psychiatry 84, 1082–1091 (2013).
21.
Zivadinov R, Khan N, Korn JR et al. No evidence of disease activity in patients receiving fingolimod at private or academic centers in clinical practice: a retrospective analysis of the Multiple Sclerosis, Clinical, and Magnetic Resonance Imaging Outcomes in the USA (MS-MRIUS) study. Curr. Med. Res. Opin. 34, 1431–1440 (2018).
22.
Zivadinov R, Medin J, Khan N et al. Fingolimod's impact on MRI brain volume measures in multiple sclerosis: results from MS-MRIUS. J. Neuroimaging 28, 399–405 (2018).
23.
Zivadinov R, Medin J, Khan N et al. Impact of fingolimod on clinical and magnetic resonance imaging outcomes in routine clinical practice: a retrospective analysis of the Multiple Sclerosis, Clinical and MRI Outcomes in the USA (MS-MRIUS) study. Mult. Scler. Relat. Disord. 27, 65–73 (2018).
24.
Weinstock-Guttman B, Medin J, Khan N et al. Assessing ‘no evidence of disease activity’ status in patients with relapsing-remitting multiple sclerosis receiving fingolimod in routine clinical practice: a retrospective analysis of the Multiple Sclerosis Clinical and Magnetic Resonance Imaging in the USA (MS-MRIUS) Study. CNS Drugs 32, 75–84 (2018).
25.
Zivadinov R, Reder AT, Filippi M et al. Mechanisms of action of disease-modifying agents and brain volume changes in multiple sclerosis. Neurology 71, 136–144 (2008).
Information & Authors
Information
Published In
Copyright
© 2019 Stanley Cohan.
History
Received: 28 November 2018
Accepted: 10 January 2019
Published online: 13 February 2019
Keywords:
Topics
Authors
Metrics & Citations
Metrics
Article Usage
Article usage data only available from February 2023. Historical article usage data, showing the number of article downloads, is available upon request.
Citations
How to Cite
Comparative effectiveness of teriflunomide and dimethyl fumarate in patients with relapsing forms of MS in the retrospective real-world Teri-RADAR study. (2019) Journal of Comparative Effectiveness Research. DOI: 10.2217/cer-2018-0135
Export citation
Select the citation format you wish to export for this article or chapter.
Citing Literature
- Nicole Vasilenko, Maria P. Tieck, Tanja Michel, Sonja Schembecker, Patricia Schwarz, Anna Guenther, Christoph Ruschil, Sven Poli, Ulf Ziemann, Antje Giede-Jeppe, Gisela Gabernet, Alex Dulovic, Markus C. Kowarik, In-depth analysis of serum antibodies against Epstein-Barr virus lifecycle proteins, and EBNA1, ANO2, GlialCAM and CRYAB peptides in patients with multiple sclerosis, Frontiers in Immunology, 10.3389/fimmu.2024.1487523, 15, (2024).
- Rui Li, Jing Zhou, Haotian Wu, Yuge Wang, Juanjuan Chen, Sustained Effectiveness and Safety Over Time of Teriflunomide in Chinese Patients with Relapsing Multiple Sclerosis in the Greater Bay Area of China: Insights from Real-World Data, Neurology and Therapy, 10.1007/s40120-024-00599-5, 13, 4, (1117-1133), (2024).
- Stefan Verweij, Wouter Ahmed, Guiling Zhou, Dimitris Mavridis, Stavros Nikolakopoulos, Andre J. Elferink, Katrien Oude Rengerink, Maarten J. Bijlsma, Peter G. M. Mol, Eelko Hak, Do efficacy results obtained from randomized controlled trials translate to effectiveness data from observational studies for relapsing–remitting multiple sclerosis?, Pharmacoepidemiology and Drug Safety, 10.1002/pds.5810, 33, 5, (2024).
- Hongmei Tan, Xiang Li, Yuxin Li, Fanru He, Jingzi ZhangBao, Lei Zhou, Liqin Yang, Chongbo Zhao, Chuanzhen Lu, Qiang Dong, Haiqing Li, Chao Quan, Real-world experience of teriflunomide in relapsing multiple sclerosis: paramagnetic rim lesions may play a role, Frontiers in Immunology, 10.3389/fimmu.2024.1343531, 15, (2024).
- Luca Prosperini, Shalom Haggiag, Serena Ruggieri, Carla Tortorella, Claudio Gasperini, Dimethyl Fumarate or Teriflunomide for Relapsing–Remitting Multiple Sclerosis: A Meta-analysis of Post-marketing Studies, Neurotherapeutics, 10.1007/s13311-023-01416-x, 20, 5, (1275-1283), (2023).
- Damiano Marastoni, Francesco Crescenzo, Anna I Pisani, Carmela Zuco, Gianmarco Schiavi, Giulia Benedetti, Giuseppe K Ricciardi, Stefania Montemezzi, Francesca B Pizzini, Agnese Tamanti, Massimiliano Calabrese, Two years’ effect of dimethyl fumarate on focal and diffuse gray matter pathology in multiple sclerosis, Multiple Sclerosis Journal, 10.1177/13524585221104014, 28, 13, (2090-2098), (2022).
- Yao Zhang, Hexiang Yin, Dingding Zhang, Yan Xu, Bin Peng, Liying Cui, Real-world outcomes of teriflunomide in relapsing–remitting multiple sclerosis: a prospective cohort study, Journal of Neurology, 10.1007/s00415-022-11118-7, 269, 9, (4808-4816), (2022).
- Aaron E Miller, An Updated Review of teriflunomide’s Use in Multiple Sclerosis, Neurodegenerative Disease Management, 10.2217/nmt-2021-0014, 11, 5, (387-409), (2021).
- Viktoria Papp, Mathias Due Buron, Volkert Siersma, Peter Vestergaard Rasmussen, Zsolt Illes, Matthias Kant, Claudia Hilt, Zsolt Mezei, Homayoun Roshanisefat, Tobias Sejbæk, Arkadiusz Weglewski, Janneke van Wingerden, Svend Sparre Geertsen, Stephan Bramow, Finn Sellebjerg, Melinda Magyari, Real-world outcomes for a complete nationwide cohort of more than 3200 teriflunomide-treated multiple sclerosis patients in The Danish Multiple Sclerosis Registry, PLOS ONE, 10.1371/journal.pone.0250820, 16, 5, (e0250820), (2021).
- Robert Zivadinov, Michael G. Dwyer, Ellen Carl, Elizabeth M. Poole, Steve Cavalier, Paraskevi Briassouli, Niels Bergsland, Slowing of brain atrophy with teriflunomide and delayed conversion to clinically definite MS, Therapeutic Advances in Neurological Disorders, 10.1177/1756286420970754, 13, (2020).