Guidance for a causal comparative effectiveness analysis emulating a target trial based on big real world evidence: when to start statin treatment
Publication: Journal of Comparative Effectiveness Research
Abstract
Aim: The aim of this project is to describe a causal (counterfactual) approach for analyzing when to start statin treatment to prevent cardiovascular disease using real-world evidence. Methods: We use directed acyclic graphs to operationalize and visualize the causal research question considering selection bias, potential time-independent and time-dependent confounding. We provide a study protocol following the ‘target trial’ approach and describe the data structure needed for the causal assessment. Conclusion: The study protocol can be applied to real-world data, in general. However, the structure and quality of the database play an essential role for the validity of the results, and database-specific potential for bias needs to be explicitly considered.
Background
Statin treatment in the prevention of cardiovascular events
There is an ongoing debate on the optimal use of statin treatment in the prevention of cardiovascular events. In 2016, the European Society of Cardiology (ESC) published new guidelines for the prevention of cardiovascular disease [1]. These guidelines recommend lipid-lowering treatment such as statins for excessive-risk individuals with overt cardiovascular disease, diabetes, chronic kidney disease, familial hypercholesterolemia, or very high levels of individual risk factors. Outside this excessive-risk group, the ESC Systematic Coronary Risk Evaluation (SCORE) [2] is recommended for total disease risk assessment [1]. This country-adapted SCORE system intends to assess a patient’s 10-year risk of undergoing a fatal cardiovascular event. The risk estimation is based on age, sex, total cholesterol (with an optional use of high-density lipoprotein cholesterol), smoking status and blood pressure, and it should be repeated every 5 years. Patients are divided into four risk categories, low (<1% SCORE), moderate (1–5% SCORE), high (5–10% SCORE) and very high (>10% SCORE). The target for low-density lipoprotein cholesterol (LDL-C) levels and the recommended treatment and treatment dose depend on the risk category and the LDL-C level [2]. Immediate statin treatment is recommended for a risk score ≥10 and an LDL-C level ≥70 mg/dl or a risk score ≥5 and <10, and an LDL-C level ≥100 mg/dl. However, for all risk scores ≥5, drug treatment could be considered [1,2].
The American College of Cardiology and the American Heart Association (ACC/AHA) released new recommendations in November 2013 [3], in which the threshold indication for statin therapy was lowered for primary prevention. Instead of LDL-C thresholds, these recommendations focus on total atherosclerotic cardiovascular disease (CVD) risk, which is defined by new Pooled Cohort Equations [3]. Statin treatment is recommended when the atherosclerotic CVD risk equals or exceeds 7.5%. Pandya estimated the cost–effectiveness of various risk thresholds in the US American setting and concluded that more lenient thresholds of 4% or higher would be optimal using a threshold of $100,000 per quality adjusted life year (QALY) gained [4].
This raises the question whether there is evidence that a policy oriented purely on the risk score and that is using a more lenient threshold would also be beneficial in the European setting. Vancheri and others could not demonstrate an association between an increased statin utilization and coronary mortality or its rate of change in European countries between 2000 and 2012 [5]. However, this study did not have access to data on adherence, indication for statin treatment and industry campaigns on doctor’s decision making, which could have confounded the results. Adherence to statin treatment for instance, is known to be negatively associated with mortality as well as with the intensity of statin regimen [6,7].
Challenges in real-world data: causal inference
Real-world evidence (RWE) is a widely propagated source to gain information outside the artificial setting of clinical trials [8–10]. However, these data bear their own difficulties, including confounding, missing or nonreliable data, no clear treatment assignment, imperfect compliance, dynamic treatment regimes, switching and multiple-line treatments. Several approaches exist that may help conducting studies that allow drawing causal conclusions from observational studies and RWE data [11]. Visual, structural and statistical techniques exist to understand and estimate causal relations using RWE [11–42].
Directed acyclic graphs are graphical models that help in visualizing causal relations. In addition, causal-directed acyclic graphs help to understand the nature of confounding, to assess identifiability, and to guide the selection of the appropriate statistical analytic approach [18,22,32–37,39,41,42].
A prominent structural approach is the so-called ‘target trial’ approach described by Hernan, Robins, Cain and others [11,13–15,23,25] combined with statistical methods controlling for time-dependent confounding. The target trial approach suggests designing any observational data analysis as if one would design a randomized clinical trial. This approach is consistent with counterfactual theory in the analysis of causality, and additionally, it is structurally close to the randomized trial approach, and therefore, facilitates the communication to medical researchers familiar with clinical trial design. In addition to comparison of treatments, this approach allows researchers to answer the question of when to start a specific treatment (e.g., when to start statin) [14].
Causal statistical methods include the (parametric) g-formula, marginal structural models with inverse probability weighting and structural nested models with g-estimation. These are complex and validated statistical methods that can be applied when time-dependent confounding is present. These techniques are all based on the counterfactual approach and differ regarding their assumptions [12,13,16,17,19–21,24,26–32,38,40]. In the counterfactual approach, one estimates the outcome assuming the individual had received no treatment.
A combination of these visual, structural and statistical causal methods allows estimating causal relations using RWE and is particularly useful to determine risk thresholds for initiation of preventive medication such as statin use.
Aim
The overall goal of this project is to demonstrate how causal inference methods can be applied to RWE to obtain unbiased estimates. We focus on statin treatment to prevent CVD events in individuals with and without a history of a cardiovascular event. In the absence of a clinical trial evaluating the optimal start of statin treatment, we would like to guide the use of available real-world data and causal inference methods. We aim to provide a study protocol to answer the question of when to start statin treatment to optimally prevent CVD events. It is not the intention of this paper to present the results of the data analysis.
Methods
For the development of the study protocol, we operationalized the research question, developed a causal graph to identify potential confounders and followed the target trial approach [11,14,15,23,25].
Causal graph
Real-world data analyses are particularly prone to confounding and selection bias. Unlike in a randomized clinical trial, the intervention – in our case the (time of starting) statin treatment – is not administered at random but based on individual clinical information. When the same factors that influence the decision whether or not treatment should be provided, also influence the outcome, in our case CVD events, controlling for confounding is essential for obtaining valid causal effect measures. To provide the basis for the selection of variables needed to be controlled for in a causal analysis, we generated a causal graph including variables that are directly or indirectly associated with the intervention statin treatment and the outcome CVD (Figure 1). The assumptions on the presence or absence of associations were based on published literature [43–47] and expert opinions. We searched the literature for CVD-risk evaluations and risk prediction models as well as for clinical treatment guidelines. We then asked the clinical experts which factors they base their decision on when starting or not starting statin treatment. We included those factors into the causal graph irrespective of their availability in the datasets. Some factors such as birth date and sex may not change after the treatment decision has been made and can be included as baseline variables. However, other variables, such as any disease-specific and treatment variables may change over time and should be included in the analyses as time-varying variables. The assumed causal direction is indicated by the arrows. Some variables are connected by links pointing in both directions. Those cases represent relationships with feedback loops over time.

Figure 1. Causal graph.
Arrows between the variables represent potential causal effects. Age and sex may have an influence on all of the parameters, and prior cardiovascular disease events may also be influenced by all parameters other than ‘statin’ and ‘coronary heart disease’. For space reasons, those arrows are only indicated. The absence of an arrow represents the assumption of the absence of any causal effects.
BMI: Body mass index; CHD: Coronary heart disease; CVD: Cardiovascular disease.
The causal graph (Figure 1) shows that confounding can be eliminated by blocking the backdoor paths from statin treatment to cardiovascular events, that is, controlling for age, sex and the ESC SCORE, or when the ESC score is not available, all the variables being included in the ESC SCORE as well as diabetes and severe kidney disease. Similarly, as the variables included in the risk score, the variables severe kidney disease and diabetes may change over time, and therefore, should be included in the model as baselines variables and time-varying variables.
The ESC SCORE, and newly diagnosed severe kidney disease and newly diagnosed diabetes are time-dependent confounders [24,32]. On one side, they are influencing the probability of physicians prescribing the start of statin treatment, and on the other side, they are themselves affected by statin treatment (Figure 2). This creates a feedback loop between time-dependent treatment and time-dependent confounder, and hence, causal methods such as g-methods [32] need to be applied to draw valid (unbiased) causal conclusions.
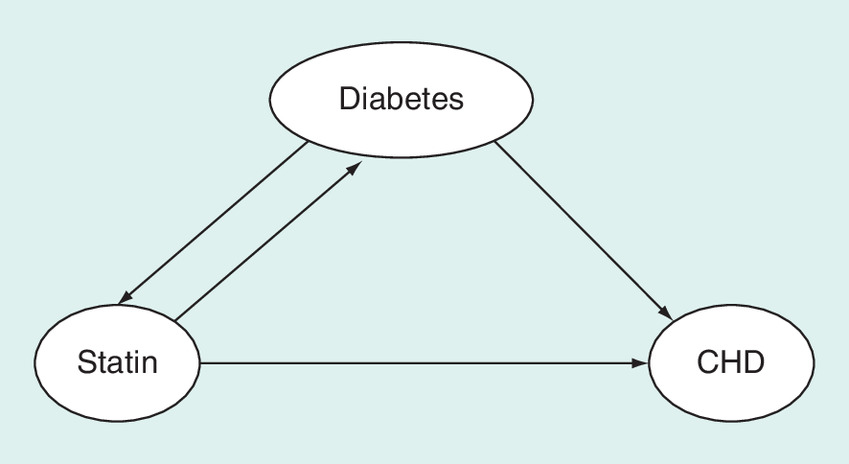
Figure 2. Time-dependent confounding.
Diabetes is a confounder and intermediate step, a so-called time-dependent confounder.
CHD: Coronary heart disease.
Target trial protocol
In the absence of a randomized clinical trial comparing multiple strategies for when to start statin treatment, we based our protocol on the target trial approach, which emulates a trial using real-world observational data: when designing a target trial, one formulates the study protocol as if one was designing a randomized controlled trial. This approach assures that the timely sequence and analytic strategy is appropriate and biases such as immortal-time bias are avoided [25]. The target trial emulates (mimics) a randomized controlled trial, and therefore consists of the same components as a randomized controlled trial. These components include eligibility criteria, treatment strategies, assignment procedures, follow-up period, outcomes, causal contrasts of interest (i.e., the estimands), and analysis plan and start with a well-formulated research question [11].
For our statins study, each component of the protocol was carefully considered and defined according to the operationalized research question. As result, we describe each component of the target trial study protocol.
Operationalization of the research question
To assess the optimal (i.e., most effective) timing of starting statin treatment, several comparative strategies with different treatment starting points must be defined. Currently, the statin treatment strategy is based on the ESC SCORE, which assesses the individual 10-year risk of undergoing a fatal cardiovascular event based on age, sex, total cholesterol, smoking status and blood pressure, and the LDL-C level [1]. Our intention is to define the treatment strategies by describing the starting point of statin treatment entirely based on ESC SCORE thresholds.
As in a randomized clinical trial, the individuals in the compared strategies should be as similar as possible. Individuals are therefore included in each strategy at the time of study inclusion. Just the defined treatment starting point differs. Figure 3 shows that while being in the study, the risk may increase as time passes by, and the individual may cross the specific risk threshold of a certain given strategy. At that time point, treatment should start.

Figure 3. Treatment strategies.
Time does not reflect the risk score increase proportionally. The colors reflect the treatment as defined for each strategy in the protocol. Light gray indicates that the individual has a risk score below the given risk threshold and should not take statin treatment; dark gray indicates that the individual risk levels crossed the risk threshold of the corresponding strategy and the individual should be treated with statins. The shaded gray indicates the grace period, which is 3 months after crossing the risk threshold, in which an individual may start the stating treatment. A given subject not following the protocol will be censored at the time of protocol violation.
tx: Treatment.
The operationalized research question is shown in the following population, intervention, comparison and outcome (PICO) structure:
Population: Men and women aged 40–75 years of the general Austrian population.
Interventions:
•
Immediate statin treatment when risk score equals or exceeds 1%.
•
Immediate statin treatment when risk score equals or exceeds 2%.
•
Immediate statin treatment when risk score equals or exceeds 3%.
•
Immediate statin treatment when risk score equals or exceeds 5%.
Comparator: No statin treatment.
Outcomes: Primary: CVD defined as composite end point major adverse cardiovascular event (MACE), that is, myocardial infarction (MI) or stroke, or cardiovascular death; secondary: overall survival.
This research question reflects the study population, treatment strategies and outcomes as defined below.
Study population & eligibility criteria
Following the target trial concept, only those individuals are included into the analyses who could be randomized to one of the four treatment strategies or the comparator. Hence, we plan to include the general population between the age of 40 and 75 years who are not classified yet as excessive risk, that is, no overt CVD, diabetes, chronic kidney disease, familial hypercholesterolemia, very high levels of individual risk factors or an acute cardiovascular event. Individuals are included into the study when they first show to have crossed the 10-year risk of undergoing a fatal cardiovascular event threshold of 1%. Note that inclusion in the study does not mean immediate statin treatment as treatment depends on the strategy-specific threshold.
Our exclusion criteria are age <40 years or >75 years, diagnosis of stroke ≤1 month prior of the start of the emulated trial (ICD10: I60–64), diagnosis of MI ≤1 month prior of the start of the emulated trial (ICD10: I21–25), diabetes (ICD10: E10–14), chronic kidney disease (ICD10: N18) and familial hypercholesterolemia (ICD10: Z82)
Individuals with and without a history of prior cardiovascular events are included in the study. The analyses will be conducted in subgroups: without prior cardiovascular events (primary prevention); and with prior cardiovascular events (secondary prevention).
Treatment strategies
Five treatment strategies (i.e., four statin strategies and the comparator no statin treatment) will be compared, differing in whether and when to start statin treatment as shown above.
All individuals enter the study at a similar state of risk, that is, when they first show to have crossed the 10-year risk of undergoing a fatal cardiovascular event threshold of 1%. This implies that individuals in the treatment strategies who start statin treatment at a high-risk threshold wait and will be monitored until they cross the risk threshold corresponding to the particular treatment strategy they are assigned to (Figure 3).
The statin treatment used in the observational study is defined by prescription of any available statin filed in the database. The dose of statin treatment is not considered for treatment definition. By applying the prescription of statins as indicator of statin use, it is assumed that individuals take the medication as it was prescribed.
Assignment procedure
Subjects will be assigned to a treatment arm at the beginning of the study. Rather than randomizing subjects to a single treatment arm, so called ‘replicates’ (‘copies’ or ‘clones’) of each subject in the dataset will be created. One replicate of each subject is then analytically being allocated to each of the treatment strategies, and subjects not following the assigned treatment protocol will be censored at the time of protocol violation. For example, for a subject A starting treatment with a risk score of 3%, the subject’s data are copied five-times and each copy is then allocated to a different treatment strategy at the beginning of the study. In the 1% threshold strategy, the replicate of subject A would then be censored right at the beginning of the study, as the protocol is to start treatment when crossing the 1% risk threshold and subject A does not start until the risk exceeds 3%. In contrast, in the 2% threshold strategy, the data of the replicate of the same subject A are censored at the time she/he has a 2% risk of cardiovascular event. As treatment is not started, it is violating the 2% threshold protocol. In the 3% threshold strategy, the data of the replicate of subject A are not censored, as treatment is started at a 3% risk, which is following the protocol. In the 5% threshold strategy and the no-treatment strategy, the data of the replicate of subject A are censored at the time of treatment start, as this is the time when the observation indicates assigned treatment violation. As censoring is informative, adjustment for baseline and time-dependent confounders of the censoring–outcome relation must be performed to derive valid causal treatment effects and is described in the analysis plan.
Individuals assigned to one of the four immediate treatment arms receive statin treatment after crossing the corresponding risk threshold (Figure 3). We allow for a ‘grace period’ of 3 months during which the treatment may be started after crossing the respective threshold, as individuals may not start treatment immediately due to nonmedical reasons, such as vacation, family holidays, travel and other personal reasons. Individuals not starting statin treatment within this grace period will be censored at the end of the grace period (i.e., 3 months after crossing the risk threshold). Individuals who had started treatment according to the protocol and stop it for more than 3 months are also planned to be censored 3 months after the last statin intake. The impact of the length of the grace period on the results should be tested in sensitivity analyses.
The individuals in the no-treatment arm must not receive statin treatment at any time. Therefore, individuals in this arm who start treatment at any time are being censored at the time of first statin use.
Follow-up periods
The study baseline is at the time of eligibility, which is the time point when an individual’s ESC-SCORE exceeds 1%. The study’s follow-up period starts at baseline and ends at the end of the 15-year follow-up time, occurrence of the outcome, loss of follow-up or treatment violation, whichever occurs first.
Outcomes
Our primary end point (outcome) is defined as any major cardiovascular event (MACE), including MI, stroke or death due to CVD during the time of follow-up. Our secondary end point is death from any cause during the time of follow-up. As frequency measures to be compared between the treatment arms, we use the 15-year incidences (risks) of the outcomes.
Causal contrast(s) of interest
Although a clinical trial may be analyzed to estimate the intention-to-treat effect, this is usually often not possible when using existing real-world data. In contrast, when using the target trial approach, all subjects are replicated and each subject is assigned to each treatment arm. Subsequently the causal per protocol effect of the respective sustained treatment strategy is estimated, that is, the effect of the assigned treatment strategy if all individuals in the trial had sustained statin treatment until end of study as indicated in the protocol. As censoring due to treatment violation or censoring due to loss to follow-up maybe informative, methods must be applied that account for informative censoring (see below).
Analysis plan
Descriptive analyses
Descriptive statistics will summarize the data. The descriptive statistics should start with a flowchart clearly indicating the number of individuals included and excluded by the various reasons. The study population will then be described within each treatment arm and subgroup. As all subjects are assigned to each treatment arm, not all individuals assigned to the treatment arms will be described but those that follow the protocol, and those that are censored. These statistics will describe age, sex, the presence of each risk factor, comorbidities and survival for adherent and censored individuals within each treatment group and compare between groups.
Causal analyses
The causal analysis will be performed for the entire population as well as the subgroups with and without prior cardiovascular events, with inverse probability weighting with marginal structural models [13,15,17,19,21,23,26,29–32,40]. According to the causal graph, the analysis will be adjusted for age, sex, prior cardiovascular events, blood pressure and cholesterol as baseline variables and cholesterol, new onset of severe kidney disease and diabetes as time-dependent confounders [17,28,29,31,32].
Time intervals will be created to properly adjust for time-dependent confounding. The length of the interval depends on the available data. The time-varying variables must be defined within each interval. Hence, intervals need to be short enough to avoid bias through time-dependent confounding.
One replicate of each subject is assigned to each of the compared treatment arms, in order to emulate perfect randomization [11,25]. Within each treatment arm, each subject will be censored at the time when this subject stops following (i.e., violates) her/his assigned treatment protocol. In other words, for each subject, only information is used that is compatible with the assigned treatment at each time point. In order to allow for a causal interpretation of the analytic results, the fact that censoring due to protocol violation may be informative needs to be considered. Therefore, adjustment for informative censoring by performing an analysis with inverse probability of censoring weighting will be performed. Individuals will be weighted using the predicted probability of not being censored due to protocol violation in a given time interval in each assigned treatment arm. The inverse of that probability is the assigned weight for that person interval. A low probability of not being censored, therefore, results in a high weight. As very high weights (e.g., values >100) may generate unstable results, the distribution of estimated weights will be assessed.
The intervals are set at 3 months, as data collection mechanisms are often implemented per quarter due to quarterly reimbursement. When the data indicate that those intervals are too long because variables are measured several times within one interval or too short as no changes occur between intervals, the length of the intervals may be adjusted and explored in sensitivity analyses.
Each subject per interval will have an assigned weight, which is estimated using a model predicting the start of statin treatment, the so called ‘treatment selection model’. This probability will then be used to indicate the probability of being censored in a given treatment strategy and turned into a weight. This weight will then be used in the so called ‘outcome model’, which relates the treatment arm to the outcome. In the outcome model, the study population hazard ratios for MACE for each treatment strategy will be approximated from a marginal Cox proportional hazards model with the odds ratio from a pooled logistic regression comparing MACE between assigned treatment arms within intervals [19]. Robust variance estimators will be used to adjust for dependence between different person time (intervals) of subjects; and the replicates generated from each particular subject. In addition, we will compare the 15-year proportions (cumulative incidences) of CVD events and deaths between all arms.
Missing data
In many datasets, variables that are based on ICD10 codes may have no indicator whether they contain missing variables or not. In the case of no data entry, one could assume that no diagnosis is present or that the information is missing. This introduces unmeasured confounding and may be systematic when this information is not entered for a specific patient group or reason related to the outcome.
Depending on the database, diagnosis data may not be well monitored and therefore not valid. In those cases, other variables such as medication use, age and sex could be used to predict and impute diagnoses [48]. In cases where no diagnosis data (e.g., ICD10 code) indicate the absence of disease but the prediction based on medication indicate a probability of disease >80%, it will be assumed that the disease is present. This assumption needs to be tested in sensitivity analyses. To reflect the uncertainty associated with the estimation of the missing data, multiple imputations will be performed [49].
Many variables of our study have repeated measurements. These variables might not have values for each time point. The method of the last value carried forward will be applied assuming that the physician deciding on the treatment bases the decision on the last available information.
Data sources
To follow the study protocol, several variables need to be available at baseline (e.g., age, sex, and prior diagnoses of CVD, diabetes, chronic kidney disease, and familial hypercholesterolemia). Variables that require repeated measures include diagnoses, laboratory values, behaviors and measurements of blood pressure. Depending on the data source, not all of these data might be available. Continuous information on laboratory values, behaviors and clinical measurements are often lacking. This information could be indirectly estimated or approximated using data on diagnoses or on filled prescriptions.
If not all data are available from one source, the necessary information may be obtained by linking several databases containing administrative reimbursement data, specialized registry data, clinical information and operative data.
Discussion
As statin treatment is a widely accepted and reimbursed treatment for the prevention of CVD events, it is unlikely that an expensive trial will be designed to find the best starting point of statin treatment. However, real-world data on statin treatment and outcomes are available from routine clinical practice. Conclusively, these data could be used to find the optimal treatment strategy. We describe a causal approach to use RWE to answer the causal question of when starting statin treatment is optimal from the patient perspective. Although using real-world data to estimate the comparative effectiveness of statin treatment avoids the artificial setting of a clinical trial and reflects reality better than clinical trials, these analyses are only valid if complete information of baseline and time-dependent confounders is available. We described the data necessary for a causal analysis of observational data. This information should be used when making decisions on the observational database that is analyzed.
In medical practice, data are often collected for various reasons, including assessing the long-term safety and effectiveness of different regimens in routine clinical care, as well as issues with adherence. However, payment or reimbursement often is the primary reason for data collection and data on diagnoses, procedures, prescriptions, and visits reflect the billing procedures but not necessarily the clinical process and reality. Using these data for clinical analyses comprises some challenges. First, clinical and reimbursement data may diverge slightly in primary versus secondary diagnoses. Second, big real-world data are not monitored closely and time intervals are irregular. Missing data are, therefore, difficult to identify.
The target trial concept is relatively innovative and only few conceptual publications exist describing this approach [11,13–15]. The target trial concept differs from disease area to disease area. Before applying the target trial concept, we used the causal graph (Figure 1) to identify variables that must be included into the analysis as baseline or time-varying covariates and based the target trial protocol on those findings. This preparatory step is the basis for controlling for confounding and selection bias. To our knowledge, no target trial protocol exists yet for the comparison of different when to start statin treatment strategies using real-world databases. The evaluation of real-world data becomes especially essential as machine learning (ML) and artificial intelligence (AI) are becoming increasingly important in medicine. However, ML and AI can only be successful when the data are reliable and biases are avoided by applying the appropriate analytical methods based on explicit causal assumptions.
The suggested approach requires comprehensive data, including ambulatory, laboratory, behavioral information and measurements of blood pressure. High-quality data are essential for drawing valid and reliable conclusions. European countries provide only limited access to such data. However, we know that data are collected in almost all parts of life including medicine. On the other hand, generic availability of statins has resulted in a change in statin prescribing behavior. Hence, the consequences of different statin prescription patters are reflected in such data. If and when these data will be made available, the described protocol can be applied. As analyses following this type of protocol will provide good insight on the effectiveness of different treatment strategies at a much lower cost than a clinical trial, it should be debated whether necessary data could be linked and made accessible without violating patients’ rights.
This proposed protocol for the design and analysis of an emulated target trial using observational RWE has several limitations. When defining the study population, we excluded individuals with a cardiovascular event within 1 month prior of start of emulated trial. This washout phase might be too short. Also, prior statin treatment and prior cardiovascular events might not always be identifiable. Thus, a few individuals might be classified as having a risk score of 1% when it is actually higher.
Data that are included in the ESC SCORE are crucial for the proposed analyses. If these data are not reliable, the analyses may be biased. We might not only have misclassification when allocating the treatment strategies, we would also not correctly adjust for confounding. As the causal graph (Figure 1) shows, the ESC SCORE is influencing the treatment and is itself influenced by the treatment. Hence, the ESC SCORE is a time-dependent confounder, where the influence of the risk score on the treatment needs to be controlled for. The physician is calculating the risk in the practice based on the direct measurements of blood pressure cholesterol level and other patient-specific information. We might not have the ESC SCORE value that the physician sees and have to estimate it using the available underlying data. When this leads to misclassification, the link between the score and the treatment initiation is not correctly analyzed.
We intended to compare five treatment strategies (Figure 3). Theoretically, many more treatment strategies could be compared even if they seem unethical. This proposed target trial is applied to observational data. Hence, the actual treatment of an individual is not influenced by the protocol. However, whenever analyzed strategies diverge from current guidelines, it might be questionable whether a sufficient number of cases follow the protocol of those treatment strategies. Data must be sufficient to predict protocol violation. For cases where only few individuals have the same covariates that predict treatment, the weights would become very large; this is one of the limitations of inverse probability of censoring weighting. To avoid large weights, one could truncate the weights. However, large databases reflecting all treatment arms and covariate strata are always preferable and yield more reliable results.
The primary study outcome chosen in our protocol is MACE, which includes cardiovascular death. However, the databases do not always differentiate between all-cause mortality and sudden cardiovascular death. When a subject died due to a cardiovascular event before reaching the hospital, death may only be considered as all-cause mortality.
The protocol demands an immediate start of statin intake after crossing the risk threshold corresponding to a given treatment strategy. In the real world, individuals may want to delay the start of the treatment due to personal nonmedical reasons. We account for that by allowing for a grace time of 3 months after crossing the risk threshold indicating treatment start and test the impact of the length of the grace period with sensitivity analyses. During this grace time period, individuals are supposed to start the indicated treatment. Only individuals that have not started treatment by the end of the grace-time period are perceived as violating the protocol.
Often, study protocols include independently adjudicated outcome validation to avoid potential differential information bias. However, we believe that MACE is a relatively well-defined outcome leaving no room for too much interpretation. Furthermore, at the time of data collection, no connection between the different statin treatment strategies and the outcome was made. Hence, the misclassification would potentially be nondifferential. We also included overall survival as secondary end point in our analysis, as this outcome is less prone to information bias. However, the disadvantage is that due to limited number of deaths in population studies, the power for differentiating between the slightly different strategies is very limited.
Although we design the observational study as if it was a clinical trial, the trial should be seen as a pragmatic trial, where the treatment strategies reflect the real-world conditions. Such a trial can be analyzed according to the causal per-protocol principle for sustained treatment strategies, which avoids some biases when compliance is incomplete [50].
Currently, access to comprehensive data including data from the outpatient setting is limited in Europe. The FFG COMET project, Decision Support for Health Policy and Planning (DEXHELPP), aims to develop new methods, models and technologies to support analysis, planning and control of healthcare systems [51–53]. One part of the project is to extend causal inference methods in order to estimate causal relationships from routine data, especially for the parameterization of decision-analytic models [54]. Within the project DEXHELPP, large Austrian databases are linked to RWE on a per-project basis as well as a service for data owners as stable foundation for various research purposes. Differing sources including closed, nonpublic databases with highly sensitive data as well as publicly available, open data are utilized. ‘GAP-DRG’ (General Approach for Patient oriented Outpatient-based diagnosis-related group [DRG]) [55,56], a database built up and managed on behalf of the Main Association of Austrian Social Security Institutions, is one of the outstanding assets of the project. It comprises of administrative claims data from many sections of the healthcare system as hospital discharges, ambulatory outpatient contacts with general practitioners (GPs) and specialists as well as filled in prescriptions and leaves of absence. DEXHELPP and preceding projects linked these databases and added additional information, meta-data and documentation.
After designing the study protocol, the next step is to perform the study for the Austrian population. Once the data and their structure accessible through the DEXHELPP consortium meet the necessary data quality for the proposed protocol, this protocol will be applied to estimate the most efficient start of statin treatment for the Austrian setting.
Conclusion
We successfully developed a study protocol for estimating the comparative effectiveness of different starting points for statin treatment to prevent cardiovascular events. The study protocol follows the target trial approach to allow drawing causal conclusions from real-world observational databases. It can be applied to clinical as well as reimbursement databases or the combination of both. The quality of the databases plays an essential role for the reliability of the results. The proposed study protocol has some limitations that need to be acknowledged when applying it to any data and interpreting the results. We conclude that the proposed protocol can be applied to different databases to estimate the comparative effectiveness of different starting points for statin treatment to avoid cardiovascular events. However, the database this protocol will be applied to needs to be carefully selected, and database-specific potential for bias must be carefully considered.
Future perspective
Over the last decades, computers and electronic tools arrived in basically all parts of our lives, including medicine. The storage of health-related data is increasing, and potentials of linking different databases are growing, analytical techniques are emerging, and ML and AI in medicine become a widely debated topic [57]. We believe that in 5–10 years, artificial intelligence will be more and more accepted in several parts of medicine. Especially, risk prediction and causal inference will facilitate accurate personalized medicine. However, the potentials of future performance of artificial intelligence depend on current research in the field of causal inference from real-world data.
•
It is questionable whether a more lenient threshold for the use of statin treatment than currently proposed in European guidelines leads to better clinical outcome.
•
Common challenges occurring with real-world evidence are confounding, missing/misclassified data, no clear treatment strategy assignment, dynamic treatment regimens and treatment switching.
•
The aim of this project is to describe a causal (counterfactual) approach for analyzing real-world observational data to estimate the optimal risk threshold for the start of statin treatment.
•
Visual, structural and statistical techniques existing to estimate causal relations using real-world evidence are applied to generate a study protocol.
•
We operationalize the research question, describe the data structure needed for the causal assessment and address potential biases that might occur.
•
Using causal graphs, we identified age, sex, prior diagnosis of cardiovascular disease, diabetes, chronic kidney disease and familial hypercholesterolemia as baseline (time-independent) confounders. We found new onset of diabetes or chronic kidney disease, cholesterol and blood pressure as time-dependent confounders.
•
Crucial parts of the protocol are the treatment allocation at the beginning of the trial, a per-protocol analysis with correct censoring and a statistical analyses accounting for informative censoring such as inverse probability of censoring weighting.
•
The proposed protocol can be applied to different databases to estimate the comparative effectiveness of different starting points for statin treatment to avoid cardiovascular events. The database-specific potential for bias needs to be estimated and considered.
Financial & competing interests disclosure
The research project DEXHELPP (Decision Support for Health Policy and Planning: Methods, Models and Technologies based on Existing Health Care Data, grant no. 843550) is in the frame of COMET-Competence Centers for Excellent Technologies. DEXHELPP is supported by Federal Ministry of Transport, Innovation and Technology (BMVIT), Federal Ministry of Science, Research and Economics (BMWFW) and the state Vienna. The COMET program is transacted by the Austrian Research Promotion Agency (FFG). In parts, this work has also been financially supported through Erasmus Mundus Western Balkans (ERAWEB), a project funded by the European Commission. The funding body did not have any influence on the design of the study, and collection, analysis and interpretation of data, and in manuscript writing. The authors have no other relevant affiliations or financial involvement with any organization or entity with a financial interest in or financial conflict with the subject matter or materials discussed in the manuscript apart from those disclosed.
No writing assistance was utilized in the production of this manuscript.
References
Papers of special note have been highlighted as: • of interest
1.
Catapano AL, Graham I, De Backer G et al. 2016 ESC/EAS guidelines for the management of dyslipidaemias. Eur. Heart J. 37(39), 2999–3058 (2016).
2.
Perk J, De Backer G, Gohlke H et al. European Guidelines on cardiovascular disease prevention in clinical practice (version 2012). The Fifth Joint Task Force of the European Society of Cardiology and Other Societies on Cardiovascular Disease Prevention in Clinical Practice (constituted by representatives of nine societies and by invited experts). Eur. Heart J. 33(13), 1635–1701 (2012).
3.
Andrus B, Lacaille D. 2013 ACC/AHA guideline on the assessment of cardiovascular risk. J. Am. Coll. Cardiol. 63(25 Pt A), 2886 (2014).
4.
Pandya A, Sy S, Cho S, Weinstein MC, Gaziano TA. Cost–effectiveness of 10-year risk thresholds for initiation of statin therapy for primary prevention of cardiovascular disease. JAMA 314(2), 142–150 (2015).
5.
Vancheri F, Backlund L, Strender LE, Godman B, Wettermark B. Time trends in statin utilisation and coronary mortality in western European countries. BMJ Open 6(3), e010500 (2016).
6.
Deshpande S, Quek RG, Forbes CA et al. A systematic review to assess adherence and persistence with statins. Curr. Med. Res. Opin. 33(4), 769–778 (2017).
7.
Rodriguez F, Maron DJ, Knowles JW, Virani SS, Lin S, Heidenreich PA. Association of statin adherence with mortality in patients with atherosclerotic cardiovascular disease. JAMA Cardiol. (2019) (Epub ahead of print).
8.
Berger ML, Sox H, Willke RJ et al. Good practices for real-world data studies of treatment and/or comparative effectiveness: recommendations from the joint ISPOR-ISPE Special Task Force on real-world evidence in health care decision making. Value Health 20(8), 1003–1008 (2017).
9.
Greenfield S. Making real-world evidence more useful for decision making. Value Health 20(8), 1023–1024 (2017).
10.
Wang SV, Schneeweiss S, Berger ML et al. Reporting to improve reproducibility and facilitate validity assessment for healthcare database studies V1.0. Value Health 20(8), 1009–1022 (2017).
11.
Hernan MA, Robins JM. Using big data to emulate a target trial when a randomized trial is not available. Am. J. Epidemiol. 183(8), 758–764 (2016).
• Introduces the ‘target trial’ framework. It discusses each component of the target trial.
12.
Bellamy SL, Lin JY, Ten Have TR. An introduction to causal modeling in clinical trials. Clin. Trials 4(1), 58–73 (2007).
13.
Cain LE, Caniglia EC, Phillips A et al. Efavirenz versus boosted atazanavir-containing regimens and immunologic, virologic, and clinical outcomes: a prospective study of HIV-positive individuals. Medicine (Baltimore) 95(41), e5133 (2016).
14.
Cain LE, Robins JM, Lanoy E, Logan R, Costagliola D, Hernán MA. When to start treatment? A systematic approach to the comparison of dynamic regimes using observational data. Int. J. Biostat. 6(2), Article 18 (2010).
15.
Cain LE, Saag MS, Petersen M et al. Using observational data to emulate a randomized trial of dynamic treatment-switching strategies: an application to antiretroviral therapy. Int. J. Epidemiol. 45(6), 2038–2049 (2015).
16.
Cole SR, Hernan MA. Fallibility in estimating direct effects. Int. J. Epidemiol. 31(1), 163–165 (2002).
17.
Daniel RM, Cousens SN, De Stavola BL, Kenward MG, Sterne JA. Methods for dealing with time-dependent confounding. Stat. Med. 32(9), 1584–1618 (2013).
18.
Greenland S, Pearl J, Robins JM. Causal diagrams for epidemiologic research. Epidemiology 10(1), 37–48 (1999).
• Nicely lays out the principles of directed acyclic graphs. Shows why they are important and discusses unnecessary and harmful adjustment.
19.
Hernan MA, Brumback B, Robins JM. Marginal structural models to estimate the causal effect of zidovudine on the survival of HIV-positive men. Epidemiology 11(5), 561–570 (2000).
20.
Hernán MA, Cole SR, Margolick J, Cohen M, Robins JM. Structural accelerated failure time models for survival analysis in studies with time-varying treatments. Pharmacoepidemiol. Drug Saf. 14(7), 477–491 (2005).
21.
Hernan MA, Hernandez-Diaz S. Beyond the intention-to-treat in comparative effectiveness research. Clin. Trials 9(1), 48–55 (2012).
22.
Hernán MA, Hernández-Díaz S, Werler MM, Mitchell AA. Causal knowledge as a prerequisite for confounding evaluation: an application to birth defects epidemiology. Am. J. Epidemiol. 155(2), 176–184 (2002).
23.
Hernan MA, Robins JM. Estimating causal effects from epidemiological data. J. Epidemiol. Community Health 60(7), 578–586 (2006).
24.
Hernan MA, Robins JM. Causal Inference. Chapman & Hall/CRC, FL, USA (forthcoming) (2019).
25.
Hernán MA, Sauer BC, Hernández-Díaz S, Platt R, Shrier I. Specifying a target trial prevents immortal time bias and other self-inflicted injuries in observational analyses. J. Clin. Epidemiol. 2016(79), 70–75 (2016).
• Focuses on importance of the correct timing of starting the trial, eligibility and treatment strategy assignment.
26.
Latimer NR, Abrams KR, Lambert PC, Morden JP, Crowther MJ. Assessing methods for dealing with treatment switching in clinical trials: a follow-up simulation study. Stat. Methods Med. Res. 27(3), 765–784 (2018).
27.
Morden JP, Lambert PC, Latimer N, Abrams KR, Wailoo AJ. Assessing methods for dealing with treatment switching in randomised controlled trials: a simulation study. BMC Med. Res. Methodol. 11, 4 (2011).
28.
Robins JM. Marginal structural models. In: Proceedings of the Section on Bayesian Statistical Science. American Statistical Association, VA, USA, 1–10 (1997).
29.
Robins JM. Marginal structural models versus structural nested models as tools for causal inference. In: Statistical Models in Epidemiology, the Environment, and Clinical Trials. Springer, NY, USA, 95–133 (2000).
30.
Robins JM, Finkelstein DM. Correcting for noncompliance and dependent censoring in an AIDS clinical trial with inverse probability of censoring weighted (IPCW) log-rank tests. Biometrics 56(3), 779–788 (2000).
31.
Robins JM, Hernan MA, Brumback B. Marginal structural models and causal inference in epidemiology. Epidemiology 11(5), 550–560 (2000).
32.
Robins JM, Hernán MA, Siebert U. Effects of multiple interventions. Comparative quantification of health risks: global and regional burden of disease attributable to selected major risk factors. 1, 2191–2230 (2004).
33.
VanderWeele TJ, Hernán MA, Robins JM. Causal directed acyclic graphs and the direction of unmeasured confounding bias. Epidemiology 19(5), 720–728 (2008).
34.
VanderWeele TJ, Robins JM. Directed acyclic graphs, sufficient causes, and the properties of conditioning on a common effect. Am. J. Epidemiol. 166(9), 1096–1104 (2007).
35.
VanderWeele TJ, Robins JM. Four types of effect modification: a classification based on directed acyclic graphs. Epidemiology 18(5), 561–568 (2007).
36.
VanderWeele TJ, Shpitser I. A new criterion for confounder selection. Biometrics 67(4), 1406–1413 (2011).
37.
VanderWeele TJ, Tan Z. Directed acyclic graphs with edge-specific bounds. Biometrika 99(1), 115–126 (2012).
38.
Westreich D, Cole SR, Young JG et al. The parametric g-formula to estimate the effect of highly active antiretroviral therapy on incident AIDS or death. Stat. Med. 31(18), 2000–2009 (2012).
39.
Westreich D, Greenland S. The table 2 fallacy: presenting and interpreting confounder and modifier coefficients. Am. J. Epidemiol. 177(4), 292–298 (2013).
40.
White IR. Methods for handling treatment switching: rank-preserving structural nested failure time models, inverseprobability-of-censoring weighting, and marginal structural models. Workshop: Methods for Adjusting for Treatment Switches in Late-Stage Cancer Trials (2012). www.methodologyhubs.mrc.ac.uk/workshop_summaries/treatment_switches.aspx
41.
Williamson EJ, Aitken Z, Lawrie J, Dharmage SC, Burgess JA, Forbes AB. Introduction to causal diagrams for confounder selection. Respirology 19(3), 303–311 (2014).
42.
Yuan Y, Shen X, Pan W. Maximum likelihood estimation over directed acyclic gaussian graphs. Stat. Anal. Data Min. 5(6), (2012).
43.
D'Agostino RB Sr, Vasan RS, Pencina MJ et al. General cardiovascular risk profile for use in primary care: the Framingham Heart Study. Circulation 117(6), 743–753 (2008).
44.
Fox CS. Cardiovascular disease risk factors, Type 2 diabetes mellitus, and the Framingham Heart Study. Trends Cardiovasc. Med. 20(3), 90–95 (2010).
45.
Payne RA. Cardiovascular risk. Br. J. Clin. Pharmacol. 74(3), 396–410 (2012).
46.
Siontis GC, Tzoulaki I, Siontis KC, Ioannidis JP. Comparisons of established risk prediction models for cardiovascular disease: systematic review. BMJ 344, e3318 (2012).
47.
Wilson PW, D'Agostino RB, Levy D, Belanger AM, Silbershatz H, Kannel WB. Prediction of coronary heart disease using risk factor categories. Circulation 97(18), 1837–1847 (1998).
48.
Filzmoser P, Eisl A, Endel F. ATC – ICD: determination of the reliability for predicting the ICD code from the ATC code. Hauptverband der Österreichischen Sozialversicherungsträger, EBM Bericht (2009). www.academia.edu/17416378/ATC_ICD_Determination_of_the_reliability_for_predicting_the_ICD_code_from_the_ATC_code
49.
Kang H. The prevention and handling of the missing data. Korean J. Anesthesiol. 64(5), 402–406 (2013).
50.
Hernan MA, Robins JM. Per-protocol analyses of pragmatic trials. N. Engl. J. Med. 377(14), 1391–1398 (2017).
51.
DEXHELPP: Decision support for health policy and planning. Comet K-Project DEXHELPP (2018). www.dexhelpp.at/
52.
Popper N, Endel F, Mayer R, Bicher M, Glock B. Planning future health: developing big data and system modelling pipelines for health system research. Sim. Notes Europe 27(4), 203–208 (2017).
53.
Zauner G, Popper N, Breitenecker F. State of the art research in Austria: DEXHELPP – decision support for health policy and planning: methods, models and technologies based on existing healthcare data. Value Health 17(7), A452 (2014).
54.
Murray EJ, Robins JM, Seage GR 3rd et al. Using observational data to calibrate simulation models. Med. Decis. Making 38(2), 212–224 (2018).
55.
Endel F, Duftschmid G. Secondary use of claims data from the Austrian health insurance system with i2b2: a pilot study. Stud. Health Technol. Inform. 223, 245–252 (2016).
56.
Endel F, Endel G, Pfeffer N. PRM34 routine data in HTA: record linkage in Austria’s GAP-DRG database. Value Health 15(7), A466 (2012).
57.
Peek N, Combi C, Marin R, Bellazzi R. Thirty years of artificial intelligence in medicine (AIME) conferences: a review of research themes. Artif. Intell. Med. 65(1), 61–73 (2015).
Information & Authors
Information
Published In
Pages: 1013 - 1025
PubMed: 31512926
Copyright
© 2019 Future Medicine Ltd.
History
Received: 1 October 2018
Accepted: 5 July 2019
Published online: 12 September 2019
Keywords:
Topics
Authors
Metrics & Citations
Metrics
Article Usage
Article usage data only available from February 2023. Historical article usage data, showing the number of article downloads, is available upon request.
Citations
How to Cite
Guidance for a causal comparative effectiveness analysis emulating a target trial based on big real world evidence: when to start statin treatment. (2019) Journal of Comparative Effectiveness Research. DOI: 10.2217/cer-2018-0103
Export citation
Select the citation format you wish to export for this article or chapter.
Citing Literature
- Faye D. Baldwin, Rukun K. S. Khalaf, Ruwanthi Kolamunnage-Dona, Andrea L. Jorgensen, Methodologies for the Emulation of Biomarker-Guided Trials Using Observational Data: A Systematic Review, Journal of Personalized Medicine, 10.3390/jpm15050195, 15, 5, (195), (2025).
- Stijntje W. Dijk, Maurice Korf, Jeremy A. Labrecque, Ankur Pandya, Bart S. Ferket, Lára R. Hallsson, John B. Wong, Uwe Siebert, M. G. Myriam Hunink, Directed Acyclic Graphs in Decision-Analytic Modeling: Bridging Causal Inference and Effective Model Design in Medical Decision Making, Medical Decision Making, 10.1177/0272989X241310898, 45, 3, (223-231), (2025).
- Felicitas Kuehne, Lára Hallsson, Marjan Arvandi, Sibylle Puntscher, Beate Jahn, Gaby Sroczynski, Uwe Siebert, Vergleich der Effektivität von multiplen dynamischen Behandlungsstrategien unter Nutzung der Target-Trial-Emulierung, Prävention und Gesundheitsförderung, 10.1007/s11553-023-01033-8, (2023).
- Julia Wicherski, Katharina Schneider, Jörg Zinserling, Steffen Heß, Britta Haenisch, Karl Broich, Real-world-Daten in der Arzneimittelregulation – aktuelle Entwicklungen und Ausblick, Prävention und Gesundheitsförderung, 10.1007/s11553-022-01010-7, (2023).
- Felicitas Kuehne, Marjan Arvandi, Lisa M. Hess, Douglas E. Faries, Raffaella Matteucci Gothe, Holger Gothe, Julie Beyrer, Alain Gustave Zeimet, Igor Stojkov, Nikolai Mühlberger, Willi Oberaigner, Christian Marth, Uwe Siebert, Causal analyses with target trial emulation for real-world evidence removed large self-inflicted biases: systematic bias assessment of ovarian cancer treatment effectiveness, Journal of Clinical Epidemiology, 10.1016/j.jclinepi.2022.10.005, 152, (269-280), (2022).
- Felicitas Kuehne, Ursula Rochau, Noman Paracha, Jennifer M. Yeh, Eduardo Sabate, Uwe Siebert, Estimating Treatment-Switching Bias in a Randomized Clinical Trial of Ovarian Cancer Treatment: Combining Causal Inference with Decision-Analytic Modeling, Medical Decision Making, 10.1177/0272989X211026288, 42, 2, (194-207), (2021).
- Deirdre K Tobias, Martín Lajous, What would the trial be? Emulating randomized dietary intervention trials to estimate causal effects with observational data, The American Journal of Clinical Nutrition, 10.1093/ajcn/nqab169, 114, 2, (416-417), (2021).
- Lukas Fiedler, Lára Hallsson, Maximilian Tscharre, Sabrina Oebel, Michael Pfeffer, Robert Schönbauer, Lyudmyla Tokarska, Laura Stix, Anton Haiden, Johannes Kraus, Hermann Blessberger, Uwe Siebert, Franz Xaver Roithinger, Upstream Statin Therapy and Long-Term Recurrence of Atrial Fibrillation after Cardioversion: A Propensity-Matched Analysis, Journal of Clinical Medicine, 10.3390/jcm10040807, 10, 4, (807), (2021).
- Eleanor J Murray, Brandon D L Marshall, Ashley L Buchanan, Emulating Target Trials to Improve Causal Inference From Agent-Based Models, American Journal of Epidemiology, 10.1093/aje/kwab040, 190, 8, (1652-1658), (2021).
- Evelyn Walter, Sophie-Christin Hausberger, Evelyn Groß, Uwe Siebert, Health-related quality of life, work productivity and costs related to patients with inflammatory bowel disease in Austria, Journal of Medical Economics, 10.1080/13696998.2020.1801187, 23, 10, (1061-1071), (2020).