Budget impact of adding lesinurad for second-line treatment of gout: a US health plan perspective
Publication: Journal of Comparative Effectiveness Research
Abstract
Aim: To estimate budget impact of adopting lesinurad as add-on to allopurinol for urate-lowering therapy in gout. Methods: A budget impact model was developed for a US payer perspective, using a Markov model to estimate costs, survival and discontinuation in a one-million-member health plan. The population included patients failing first-line gout therapy, followed for 5 years. Results: Incremental costs of adding lesinurad versus no lesinurad were US$241,907 and US$1,098,220 in first and fifth years, respectively. Cumulative 5-year incremental cost was US$3,633,440. Estimated incremental mean cost per treated patient with gout per year was US$112. The mean per-member per-month cost increased by US$0.06. Conclusion: Initiating lesinurad would result in an incremental per-member per-month cost of US$0.06 over 5 years.
Gout is the most common type of inflammatory arthritis in adults, affecting approximately eight million people in the USA [1]. Gout occurs when serum uric acid (sUA) supersaturates in the serum and begins to precipitate as monosodium urate crystal deposits in the joints, tendons and other soft tissues [2–5]. Hyperuricemia, defined as an sUA level above 6.8 mg/dl, can be asymptomatic, but the shedding of urate crystals into the joint space may cause joint inflammation and severe pain known as gout flares or gouty arthritis [6]. Severe cases of gout may result in the development of tophi, which are deposits of monosodium urate crystals [7]. Moreover, hyperuricemia is associated with cardiovascular [8–11] and renal morbidity [12] and an increased risk of mortality [13,14].
In 2010, gout was responsible for 2.3% of 38.6 million hospitalizations and approximately five million ambulatory care visits [15]. Patients with gout incur greater direct and indirect costs compared with those without gout [16]. The total all-cause cost of care for US patients with gout is estimated to be US$11,663 per person or US$31.8 billion overall, while the cost of gout-attributable expenses is estimated to be US$2805 per person or US$7.7 billion overall [17]. Another published analysis found the incremental annual cost of care for a gout patient to exceed US$3000 compared with nongouty individuals [18]. Available data show that the costs (total, medical and pharmacy costs) of care associated with uncontrolled gout are substantial and increase with disease severity (defined as higher sUA levels, greater frequency of flares or tophaceous gout) [16,19]. Gout is also associated with poor health-related quality of life, even adjusting for comorbidities [20].
The current standard of care for gout includes patient education on diet, lifestyle, treatment objectives, medication adherence and management of comorbidities. Xanthine oxidase inhibitor (XOI) therapy with allopurinol or febuxostat is indicated as the first-line pharmacologic urate-lowering therapy (ULT) to aid patients in achieving an sUA target of <6 mg/dl [21]. Allopurinol, a purine analog, has been the dominant ULT in the USA since 1966 and febuxostat is a nonpurine, selective inhibitor of xanthine oxidase introduced in 2009 [22]. Both allopurinol and febuxostat reduce the production of uric acid; however, allopurinol is cleared exclusively by the kidneys while febuxostat is cleared by both the kidneys and liver, which is relevant to XOI selection for patients with reduced renal function [23,24]. Allopurinol is indicated in the management of patients with signs and symptoms of primary or secondary gout (acute attacks, tophi, joint destruction, uric acid lithiasis and/or nephropathy) [23]. The most frequent adverse event occurring in patients taking allopurinol is skin rash [23]. Febuxostat is indicated for the chronic management of hyperuricemia in patients with gout, and the most common adverse events in patients taking febuxostat are liver function abnormalities, nausea, arthralgia and rash [24]. Recently, in patients with gout and coexisting cardiovascular disease, patients treated with febuxostat were found to have an increased risk of cardiovascular death compared with those treated with allopurinol [25].
Although monotherapy use of XOIs can be efficacious, there are challenges associated with the utilization of XOIs and with patients achieving sUA target. These challenges include inadequate dosing, lack of follow-up monitoring and dose adjustment, as well as poor drug adherence [26]. A low proportion of patients maintain adherence to allopurinol [27] and, even in randomized controlled trials, discontinuation is high [28–30].
Allopurinol dosing recommended by the US FDA starts at 100 mg/day, increasing by 100 mg each week up to 800 mg/day or until an sUA target of <6.0 mg/dl is reached [23,31]. However, dosing at more than 300 mg/day is uncommon and fewer than a half of patients treated with allopurinol as monotherapy achieve their target sUA at physician-prescribed doses [32]. In the USA, febuxostat is approved at 40- and 80-mg daily doses, with the recommendation that patients are started on 40 mg and titrated to 80 mg if the target sUA is not achieved after 2 weeks [22,24,29,33].
In contrast to the XOIs that reduce the production of sUA, uricosuric agents lower sUA levels by increasing clearance of sUA by the kidneys [21]. Older uricosurics – probenecid, benzbromarone and sulfinpyrazone – are rarely used today because of their side effects or interactions with other treatments and, in the USA, only probenecid is available. Lesinurad (Zurampic®), a newer uricosuric, reduces uric acid reabsorption by specific inhibition of two transporters, URAT1 and organic anion transporter 4 (OAT4) [34]. Two clinical Phase III studies (CLEAR 1 and CLEAR 2) showed that lesinurad in combination with allopurinol reduces sUA to target levels in many patients who are unable to reach target on allopurinol monotherapy [35,36]. Lesinurad 200 mg daily is approved by the FDA in combination with an XOI for the treatment of hyperuricemia associated with gout in patients who have not achieved target sUA levels with an XOI alone.
The current analysis was conducted to assess the budget impact of the addition of lesinurad to allopurinol in patients who have failed to reach an sUA target of <6 mg/dl while on allopurinol monotherapy.
Methods
Model structure
A Microsoft Excel-based, budget impact model (BIM) was built from a US payer’s perspective. The model relies on a Markov cohort cost–effectiveness model for estimation of efficacy, mortality, treatment discontinuation and costs associated with adverse events, flares and tophi. The US cost–effectiveness model is similar to the models described in National Institute for Health and Care Excellence (NICE) submissions [37]. A cohort of prevalent gout patients, supplemented by incident patients added to the treatment pool every 6 months, was followed over a time horizon of 5 years. Increasing proportions of lesinurad and febuxostat treatment were applied to the incident population to match overall market share projections.
A current scenario based on using either allopurinol or febuxostat monotherapy was compared with a future scenario in which lesinurad in combination with allopurinol gained market share only from allopurinol monotherapy. The initial prevalent population receiving second-line treatment was estimated by multiplying an arbitrary one-million-member plan by the gout prevalence, the proportion taking ULT (29%) [38] and the proportion of those not reaching sUA target on first-line treatment (approximately 58%) (Figure 1) [35,36].
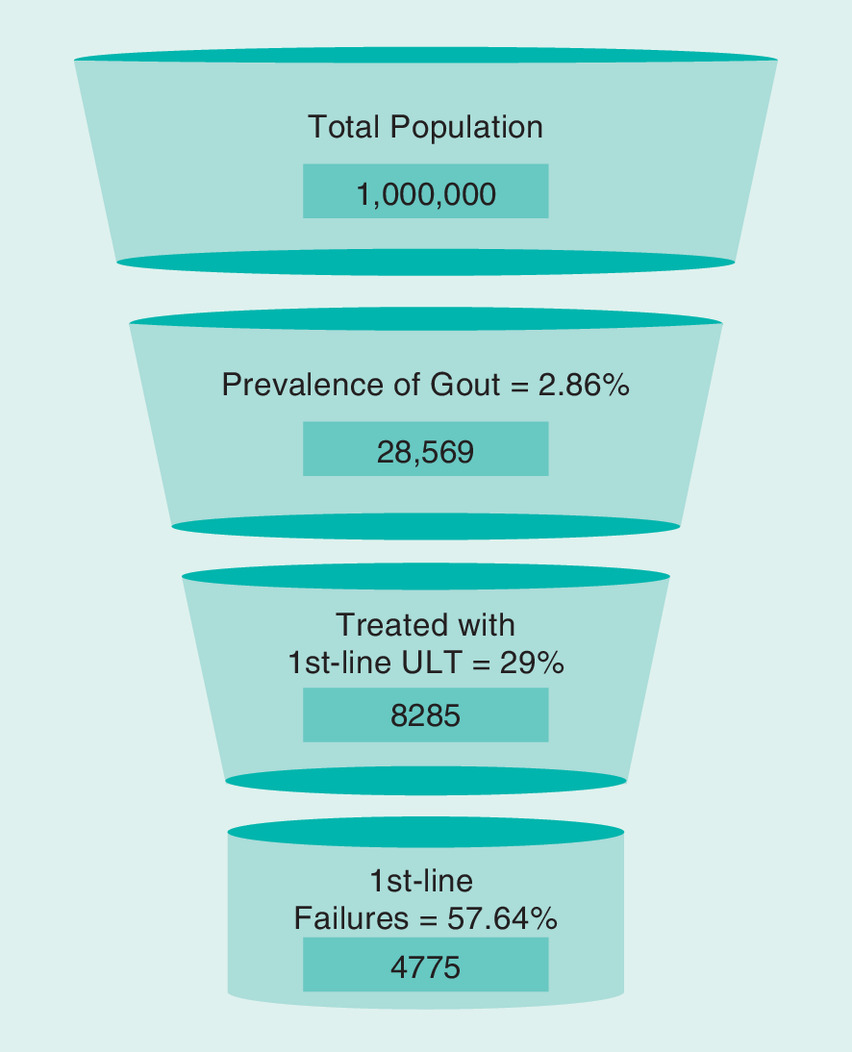
Figure 1. Population funnel.
ULT: Urate-lowering therapy.
Because the base case assumes that lesinurad takes market share only from allopurinol monotherapy, the febuxostat market share grew by the same amount irrespective of the inclusion of lesinurad.
Treatments
The only alternative treatments to lesinurad included in the model are second-line allopurinol or febuxostat monotherapy. Allopurinol monotherapy comprises over 90% of the US market for ULT, and second-line allopurinol treatment (as defined in this model) is a common clinical scenario [32] even though the sUA is not reached.
Model flow
Health states within the underlying cost-effective model were based on sUA bands and the presence or absence of tophi. Proportions in each sUA band (<5, 5–<6, 6–<8, 8–<10 or ≥10 mg/dl), shown in Supplemental Material Appendix A, were assigned based on pooled data from the CLEAR studies for allopurinol alone and in combination with lesinurad [35,36]. All patients were assumed to have received prophylaxis (colchicine or nonsteroidal anti-inflammatory drugs) [40] during the first 5 months of the initial 6-month cycle. All patients entering the model had been diagnosed and treated with allopurinol for gout but failed to reach an sUA level <6 mg/dl. All titration of allopurinol was assumed to occur during first-line treatment. Dosage proportions for allopurinol were taken from pooled CLEAR baseline data. Patients on lesinurad in combination with allopurinol who discontinued because of adverse events were assumed to revert to allopurinol monotherapy and thus to the sUA level attained on first-line treatment. Discontinuations for all other reasons resulted in untreated sUA levels estimated from the Long-term Allopurinol Safety Study Evaluating Outcomes in Gout Patients (LASSO) study [41]. Treatment make-up and dosage was continued without change, except for discontinuations.
Changes in sUA were assumed to occur only in the first cycle with the initiation of treatment. The first-year state transitions and flare rates were based on pooled analyses of the CLEAR 1 and CLEAR 2 studies and comparative effectiveness for febuxostat [28–30,35,36,39]. The model flow, reflecting sUA level and tophi status, is depicted in Figure 2. Tallies of costs and events were recorded as each simulated patient flowed through the model, including the costs of ULT, prophylaxis, monitoring, flare and optional tophi treatments and adverse events.
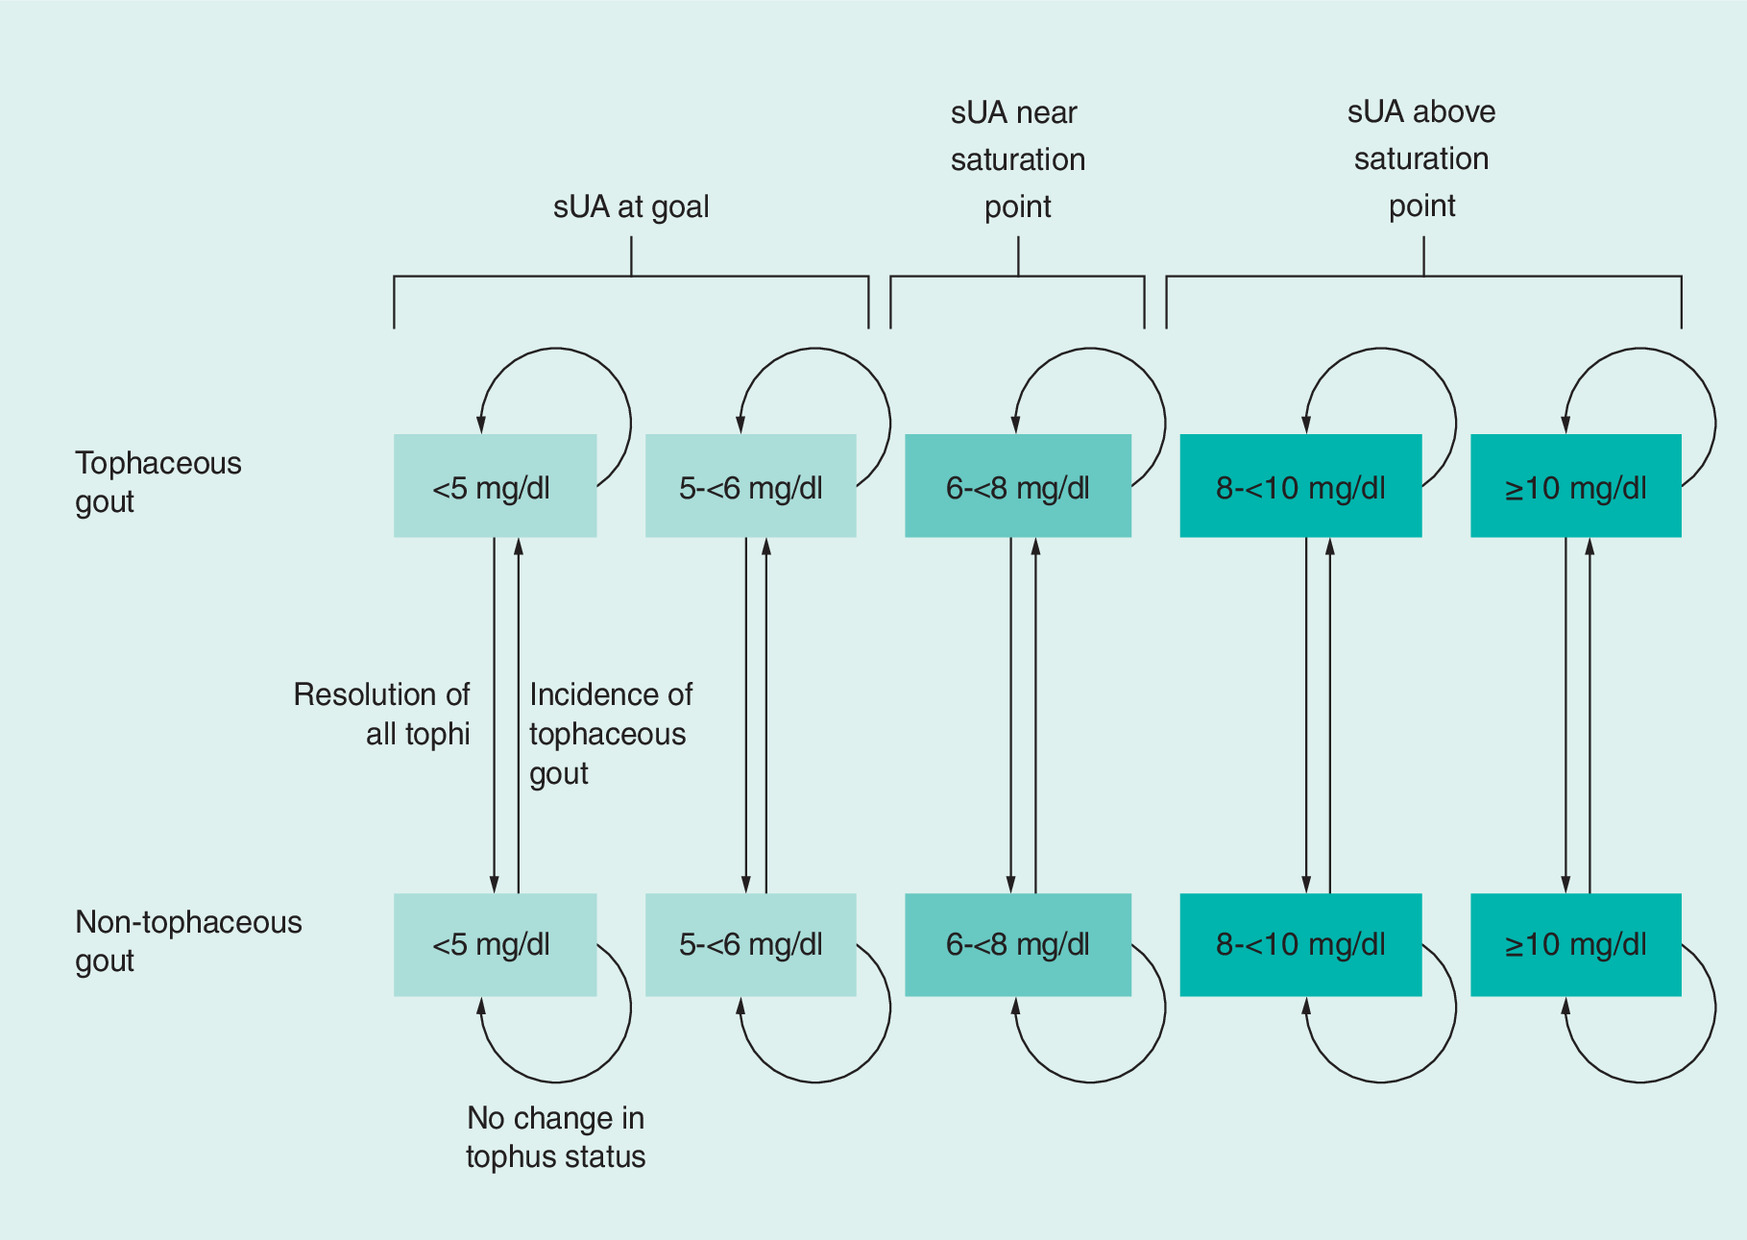
Figure 2. Flow of underlying disease state model.
sUA: Serum uric acid.
For the BIM, clinical effectiveness was evaluated for each treatment – allopurinol monotherapy, febuxostat and lesinurad in combination with allopurinol – to estimate average costs, survival and discontinuation at 6-month intervals over 5 years. Estimates of the total prevalent second-line population and market share were matched by making incidence account for death, discontinuation and changing market share.
Model inputs
Pharmaceutical costs used RED BOOK prices for allopurinol and febuxostat [42]. Medical costs due to flare or tophi treatment, adverse events and monitoring were converted to 2016 US dollars using the medical component of the Consumer Price Index as needed [43]. Treatment-specific distributions derived from the CLEAR studies and indirect comparison for febuxostat were used to estimate flare rates in the first year of second-line treatment. For subsequent years, changes in flare rates and estimates of tophi resolution and incidence were dependent on sUA. These flare- and tophi-related variables are listed in Supplemental Material Appendix A [35,36,44,45]. Other key noncost inputs are also reported in Supplemental Material Appendix A [1,13,46,47]. Costs used in the model are shown in Table 1 [21,35,36,42,43,48–50].
| Factors | Cost | Ref. |
|---|---|---|
| ULTs | Per month | |
| Lesinurad + allopurinol | US$365.21 | [35,36,42] |
| Allopurinol | US$15.21 | [35,36,42] |
| Febuxostat | US$275.65 | [35,36,42] |
| Monitoring | Per 6-month cycle | |
| Lesinurad + allopurinol (cycle 1) | US$54.37 | [21,48,49] |
| Allopurinol (cycle 1) | US$54.37 | [21,48,49] |
| Febuxostat (cycle 1) | US$135.63 | [21,48,49] |
| Lesinurad + allopurinol (subsequent) | US$108.75 | [21,48,49] |
| Allopurinol (subsequent) | US$108.75 | [21,48,49] |
| Febuxostat (subsequent) | US$108.75 | [21,48,49] |
| Events | Per occurrence | |
| Prophylaxis | US$1127.61 | [35,36,40] |
| Flare treatment | US$379.89 | [43,50] |
| Tophi surgical excision | US$578.27 | [21,48] |
| Pegloticase | US$15,600.74 | [21,48,49] |
ULT: Urate-lowering therapy.
Adverse events associated with treatments were included in the model based on rates found in the CLEAR studies. Adverse events are not described in this manuscript because none were major, common or expensive, causing minimal incremental difference in budget impact.
Assumptions
The model relies on a number of assumptions:
•
Patients who initiated ULT were titrated to a medically appropriate dose on first-line allopurinol, so allopurinol titration was not part of the model;
•
A 6-month model cycle was sufficiently granular;
•
sUA returned to untreated levels immediately after discontinuation;
•
Prophylaxis began at treatment initiation and lasted 5 months;
•
All adverse events occurred in the first 6-month cycle;
•
One cycle was the minimum length of treatment;
•
Persistent patients were costed as if fully adherent with efficacy comparable to the trials;
•
All patients who did not die stayed in the plan for the full 5 years, but to match market share projections of treatments, incident patients replaced those who died or discontinued treatment;
•
Resolution and incidence of tophi were a function of sUA regardless of treatment;
•
Febuxostat efficacy data (80-mg dose) was based on indirect comparison against allopurinol;
•
Severity of gout as indicated by the presence of tophi was a predictor of mortality;
•
Febuxostat- or lesinurad-treated patients were able to discontinue and return to allopurinol only and then were assigned to the sUA levels attained on first-line treatment;
•
Projected market share and gout prevalence increase are as shown in Supplementary File B.
Sensitivity analysis
One-way sensitivity analyses were performed to assess model sensitivity to uncertainty and to test the importance of specific input value choices. Ranges for all variables were ±10%.
Results
The incremental budgetary results are displayed in Table 2. The model estimated that a total of 8228 or 8205 patients would be treated with a second-line ULT in the without and with lesinurad treatment mixes, respectively. The difference was due to replacing different numbers of patients who die or discontinue. With an assumed lesinurad market share increase from 1.2 to 5.2% over 5 years, the associated incremental costs were US$241,907 (US$0.02 per-member per-month [PMPM]) in the first year and US$1,098,220 in the fifth year (US$0.09 PMPM), for a cumulative 5-year incremental cost of US$3,633,440 (US$0.06 PMPM). Mean incremental 5-year cost per treated patient per year was US$112. The total incremental costs were mitigated by a reduction in prophylaxis and flare costs. Because the base case does not take share from febuxostat, any change in its projected shares has minimal effect on these results.
| Cost | Year 1 | Year 2 | Year 3 | Year 4 | Year 5 | Total |
|---|---|---|---|---|---|---|
| Difference (with lesinurad/allopurinol) vs (without lesinurad/allopurinol) | ||||||
| Pharmaceutical | US$240,627 | US$494,301 | US$784,757 | US$1,036,826 | US$1,119,386 | US$3,675,897 |
| Prophylaxis | US$0 | (US$3467) | (US$5239) | (US$7965) | (US$9564) | (US$26,235) |
| Monitoring | US$1 | US$160 | US$275 | US$329 | US$355 | US$1121 |
| Flare | US$906 | US$331 | (US$1797) | (US$5855) | (US$11,681) | (US$18,096) |
| Adverse events | US$372 | US$324 | US$259 | US$76 | (US$276) | US$754 |
| Total costs | US$241,907 | US$491,649 | US$778,255 | US$1,023,410 | US$1,098,220 | US$3,633,440 |
| Per treated patient per year | US$50 | US$81 | US$116 | US$141 | US$141 | US$112 |
| Incremental PMPM | US$0.020 | US$0.041 | US$0.065 | US$0.085 | US$0.092 | US$0.061 |
Parentheses indicate a reduction.
PMPM: Per-member per-month cost.
Sensitivity analysis results
Sensitivity analysis indicated the model was most sensitive to the proportion of patients receiving lesinurad, male gout prevalence and lesinurad + allopurinol cost, each with a range of total incremental costs exceeding US$750,000 or PMPM US$0.01. Gout prevalence in females, allopurinol cost, allopurinol discontinuation rate and annual gout prevalence increase were the only other inputs tested with a 5-year incremental cost range exceeding US$100,000. The results of the one-way sensitivity analysis are depicted in the tornado diagram (Figure 3).

Figure 3. Tornado diagram showing sensitivity with the ten most influential factors on per-member per-month results.
PMPM: Per member per month.
Scenario analysis
A scenario in which the market share of febuxostat was an incremental 1% higher each year, in the absence of lesinurad, was evaluated to observe the effect of lesinurad taking share from febuxostat rather than only from allopurinol monotherapy. The result was a decrease of almost US$800,000 in incremental costs compared with the base case, and the estimated incremental PMPM over 5 years was US$0.05.
In order to investigate the effect of a greater and more rapid market uptake, market shares for lesinurad + allopurinol were set to 2, 4, 8, 12 and 16% in years 1 through 5, respectively. The assumption that all lesinurad + allopurinol share is taken from allopurinol monotherapy makes this a max case analysis. The resulting incremental PMPM costs were US$0.03, US$0.07, US$0.14, US$0.21 and US$0.29, respectively, for years 1 through 5, with a 5-year average of US$0.15. The average cost per treated patient over 5 years increased by US$271.
Discussion
This analysis estimated the budgetary impact of introducing the use of lesinurad added to allopurinol as ULT in a cohort of patients who failed to achieve sUA target when using allopurinol alone.
It is estimated that over a half of patients treated with allopurinol monotherapy do not reach the guideline-recommended sUA target of <6 mg/dl. The CLEAR studies showed that approximately twice as many patients with gout reached the sUA target of <6.0 mg/dl when treated for 6 months with lesinurad 200 mg added to allopurinol when compared with allopurinol alone (54.2 vs 27.9% in CLEAR 1; 55.4 vs 23.3% in CLEAR 2) [35,36]. In view of the difficulty in achieving target sUA, combination therapy with lesinurad and allopurinol represents a new treatment option for patients with gout who are inadequately controlled on allopurinol alone.
Assuming the lesinurad market share increases from 1.2 to 5.2% over 5 years, we estimated the incremental cost for a million member plan to be approximately US$242,000 in the first year, increasing to about US$1.1 million by the fifth year.
Sensitivity analyses demonstrated that the incremental cost was due almost entirely to the pharmaceutical cost of lesinurad with small offsets due to fewer flares, a reduction in prophylaxis medications and fewer patients starting treatment to replace those patients who die or discontinue treatment. According to the scenario analysis if, in the absence of lesinurad, the febuxostat market share would increase faster, such that lesinurad is actually taking some of its market share from febuxostat, then the budget impact would be smaller. This is based upon the higher branded febuxostat cost compared with the lower generic allopurinol cost.
As with most BIMs, a major limitation is that market share for a new treatment is hypothetical and the treatments from which those shares are taken is always speculative. In the base case, market share was taken only from allopurinol monotherapy. A scenario analysis examined the effect if, in the absence of lesinurad, the second-line market share of febuxostat would have a greater increase. Probenecid was not included in the model because the few patients who use probenecid are unlikely to be affected by the introduction of lesinurad. An additional limitation is that this model was developed for a US healthcare perspective and it does not include indirect costs, such as lost work.
The assumption that adverse events occur rarely and can be ignored after the first year would matter only if they occurred at vastly different rates between the treatments. Early extension data for lesinurad has not indicated this to be the case. An extreme analysis that assumed lesinurad's adverse events persist indefinitely, while allopurinol's AEs do not, increased the PMPM by only US$0.02 to US$0.08. The model assumed that efficacy and persistence were the same as in the trials and that all prescribed treatments were costed, which may not be the case in a real-world setting. Patients exited the model upon discontinuation of treatment. Several inputs describing efficacy and patient characteristics were based on information from randomized clinical studies and may not be generalizable to a broader population. Due to the paucity of tophi resolution data after 1 year, these data were extrapolated based on the velocity of tophus reduction reported by Perez-Ruiz et al., (2002) [44]. Utilizing extrapolated data may not be reflective of a real-world clinical setting.
Conclusion
Despite the availability of XOIs, patients with gout experience challenges in achieving the sUA target of <6 mg/dl. In clinical studies, lesinurad in combination with allopurinol resulted in a significantly greater proportion of patients with gout achieving target sUA when compared with allopurinol plus placebo. From a US payer’s perspective, the budget impact of this new therapeutic option – lesinurad in combination with allopurinol – is estimated to result in a moderate increase in total incremental and PMPM costs.
•
Gout is the most common type of inflammatory arthritis, affecting approximately eight million people in the USA.
•
First-line treatments to lower serum uric acid (sUA) are the xanthine oxidase inhibitors (XOIs): allopurinol and febuxostat, but XOI treatment alone may not achieve sUA targets.
•
Lesinurad is a uricosuric approved in combination with an XOI for patients who do not achieve sUA targets with an XOI alone.
•
The current analysis estimated the budget impact of adopting lesinurad as an add-on to allopurinol in a one-million US population that failed first-line gout therapy, with an assumed lesinurad market share increase from 1.2 to 5.2% over 5 years.
•
Incremental costs of adding lesinurad versus no lesinurad were US$241,907 and US$1,098,220 in the first and fifth years, respectively, for a cumulative 5-year incremental cost of US$3,633,440 (US$0.06 per-member per-month [PMPM]).
•
The mean cost per treated patient per year increased US$112 from US$968 to US$1080 over 5 years.
•
Total incremental costs were mitigated by a reduction in prophylaxis and flare costs.
•
Sensitivity analysis indicated the model was most sensitive to the proportion of patients receiving lesinurad, male gout prevalence and lesinurad + allopurinol cost, each with a range of total incremental costs exceeding US$750,000 or PMPM US$0.01.
•
From a US payer’s perspective, the budget impact of this new therapeutic option – lesinurad in combination with allopurinol – is estimated to result in a moderate increase in total incremental and PMPM costs.
Acknowledgements
The authors would like to thank K Kelton and J Gahn of Medical Decision Modeling, Inc., for designing and programming the cost–effectiveness model adapted to estimate patient costs and events in the budget impact model. The authors would also like to thank R McCracken of The Lockwood Group and B Wolvey of PAREXEL International for providing medical writing support.
Prior presentation
Poster presentation at the AMCP Managed Care & Specialty Pharmacy Annual Meeting 2017, Denver, Colorado; 27–30 March 2017.
Availability of data & material
The datasets generated and/or analyzed during the current study are not publicly available due to their proprietary nature, but the model is available from the corresponding author upon request from healthcare decision-makers. Moreover, the inputs used for the default case are in tables in the appendices and all inputs are modifiable in the model.
Financial & competing interests disclosure
This study was funded by AstraZeneca. S Kabadi and K Szymanski are employees of AstraZeneca. R Klein, F Cinfio and C Bly are employees of Medical Decision Modeling, Inc., which was contracted by AstraZeneca to build and analyze a budget impact model evaluating the use of lesinurad for second-line treatment of gout. D Taylor is an employee of Ironwood Pharmaceuticals with stock and stock options. The authors have no other relevant affiliations or financial involvement with any organization or entity with a financial interest in or financial conflict with the subject matter or materials discussed in the manuscript apart from those disclosed.
R McCracken of The Lockwood Group and B Wolvey of PAREXEL International provided medical writing support, which was funded by AstraZeneca.
Open access
This work is licensed under the Attribution-NonCommercial-NoDerivatives 4.0 Unported License. To view a copy of this license, visit http://creativecommons.org/licenses/by-nc-nd/4.0/
Supplementary Material
File (suppl_data.docx)
- Download
- 54.72 KB
References
Papers of special note have been highlighted as: • of interest; •• of considerable interest
1.
Zhu Y, Pandya BJ, Choi HK. Prevalence of gout and hyperuricemia in the US general population: the National Health and Nutrition Examination Survey 2007–2008. Arthritis Rheum. 63(10), 3136–3141 (2011).
• Estimate of the national prevalence of gout in the US population.
2.
Chhana A, Callon KE, Dray M et al. Interactions between tenocytes and monosodium urate monohydrate crystals: implications for tendon involvement in gout. Ann. Rheum. Dis. 73(9), 1737–1741 (2014).
3.
Dalbeth N, Clark B, Gregory K et al. Mechanisms of bone erosion in gout: a quantitative analysis using plain radiography and computed tomography. Ann. Rheum. Dis. 68(8), 1290–1295 (2009).
4.
Dalbeth N, Aati O, Kalluru R et al. Relationship between structural joint damage and urate deposition in gout: a plain radiography and dual-energy CT study. Ann. Rheum. Dis. 74(6), 1030–1036 (2015).
5.
Kuo CF, Grainge MJ, Mallen C, Zhang W, Doherty M. Rising burden of gout in the UK but continuing suboptimal management: a nationwide population study. Ann. Rheum. Dis. 74(4), 661–667 (2015).
6.
Doherty M. New insights into the epidemiology of gout. Rheumatology (Oxford) 48(Suppl. 2), ii2–ii8 (2009).
7.
Boss GR, Seegmiller JE. Hyperuricemia and gout. Classification, complications and management. N. Engl. J. Med. 300(26), 1459–1468 (1979).
8.
Chen JH, Lan JL, Cheng CF et al. Effect of urate-lowering therapy on the risk of cardiovascular disease and all-cause mortality in patients with gout: a case-matched cohort study. J. Rheumatol. 42(9), 1694–1701 (2015).
9.
Kleber ME, Delgado G, Grammer TB et al. Uric acid and cardiovascular events: a Mendelian randomization study. J. Am. Soc. Nephrol. 26(11), 2831–2838 (2015).
10.
Niskanen LK, Laaksonen DE, Nyyssonen K et al. Uric acid level as a risk factor for cardiovascular and all-cause mortality in middle-aged men: a prospective cohort study. Arch. Intern. Med. 164(14), 1546–1551 (2004).
11.
Zhao G, Huang L, Song M, Song Y. Baseline serum uric acid level as a predictor of cardiovascular disease related mortality and all-cause mortality: a meta-analysis of prospective studies. Atherosclerosis 231(1), 61–68 (2013).
12.
Roughley MJ, Belcher J, Mallen CD, Roddy E. Gout and risk of chronic kidney disease and nephrolithiasis: meta-analysis of observational studies. Arthritis Res. Ther. 17, 90 (2015).
13.
Perez-Ruiz F, Martinez-Indart L, Carmona L, Herrero-Beites AM, Pijoan JI, Krishnan E. Tophaceous gout and high level of hyperuricaemia are both associated with increased risk of mortality in patients with gout. Ann. Rheum. Dis. 73(1), 177–182 (2014).
14.
Stack AG, Hanley A, Casserly LF et al. Independent and conjoint associations of gout and hyperuricaemia with total and cardiovascular mortality. QJM 106(7), 647–658 (2013).
15.
The United States Bone and Joint Initiative. Chapter 4: Arthritis. In: The Burden Of Musculoskeletal Diseases In The United States (3rd Ed.). IL, USA (2014).
16.
Rai SK, Burns LC, De Vera MA, Haji A, Giustini D, Choi HK. The economic burden of gout: A systematic review. Semin. Arthritis Rheum. 45(1), 75–80 (2015).
17.
Cisternas MG, Murphy LB, Pasta DJ, Yelin EH, Helmick CG. Annual medical care expenditures among US adults with gout, 2005–2011. Arthritis Rheum. 66(S10), S888–S888 (2014).
18.
Wertheimer A, Morlock R, Becker MA. A revised estimate of the burden of illness of gout. Curr. Ther. Res. Clin. Exp. 75, 1–4 (2013).
19.
Kabadi S, Myers J, Bly C. Health economics of uncontrolled gout in the United States: a systematic literature review. Presented at: ACR/ARHP Annual Meeting. Washington, DC, USA, 11–16 November 2016.
20.
Chandratre P, Roddy E, Clarson L, Richardson J, Hider SL, Mallen CD. Health-related quality of life in gout: a systematic review. Rheumatology (Oxford) 52(11), 2031–2040 (2013).
• Assessment of the health-related quality of life in gout patients.
21.
Khanna D, Fitzgerald JD, Khanna PP et al. 2012 American College of Rheumatology guidelines for management of gout. Part 1: systematic nonpharmacologic and pharmacologic therapeutic approaches to hyperuricemia. Arthritis Care Res. (Hoboken) 64(10), 1431–1446 (2012).
•• The current US guidelines for treatment of gout.
22.
Dubchak N, Falasca GF. New and improved strategies for the treatment of gout. Int. J. Nephrol. Renovasc. Dis. 3, 145–166 (2010).
23.
24.
25.
White WB, Saag KG, Becker MA et al. Cardiovascular safety of febuxostat or allopurinol in patients with gout. N. Engl. J. Med. 378(13), 1200–1210 (2018).
26.
Mikuls TR, Farrar JT, Bilker WB, Fernandes S, Saag KG. Suboptimal physician adherence to quality indicators for the management of gout and asymptomatic hyperuricaemia: results from the UK General Practice Research Database (GPRD). Rheumatology (Oxford) 44(8), 1038–1042 (2005).
27.
Reach G. Treatment adherence in patients with gout. Joint Bone Spine 78(5), 456–459 (2011).
28.
Becker MA, Schumacher HR, Jr., Wortmann RL et al. Febuxostat compared with allopurinol in patients with hyperuricemia and gout. N. Engl. J. Med. 353(23), 2450–2461 (2005).
29.
Becker MA, Schumacher HR, Espinoza LR et al. The urate-lowering efficacy and safety of febuxostat in the treatment of the hyperuricemia of gout: the CONFIRMS trial. Arthritis Res. Ther. 12(2), R63 (2010).
30.
Schumacher HR Jr, Becker MA, Wortmann RL et al. Effects of febuxostat versus allopurinol and placebo in reducing serum urate in subjects with hyperuricemia and gout: a 28-week, Phase III, randomized, double-blind, parallel-group trial. Arthritis Rheum. 59(11), 1540–1548 (2008).
31.
US Food and Drug Administration. Allopurinol drug details: FDA approved drug products. (2017). www.accessdata.fda.gov/scripts/cder/daf/index.cfm?event=overview.process&ApplNo=203154
32.
Becker MA, Chohan S. We can make gout management more successful now. Curr. Opin. Rheumatol. 20(2), 167–172 (2008).
33.
Hainer BL, Matheson E, Wilkes RT. Diagnosis, treatment, and prevention of gout. Am. Fam. Physician 90(12), 831–836 (2014).
34.
Miner J, Tan PK, Hyndman D et al. Lesinurad, a novel, oral compound for gout, acts to decrease serum uric acid through inhibition of urate transporters in the kidney. Arthritis Res. Ther. 18(1), 214 (2016).
35.
Bardin T, Keenan RT, Khanna PP et al. Lesinurad in combination with allopurinol: a randomised, double-blind, placebo-controlled study in patients with gout with inadequate response to standard of care (the multinational CLEAR 2 study). Ann. Rheum. Dis. 76(5), 811–820 (2016).
•• One of two Phase III trials of lesinurad in combination with allopurinol that demonstrated the superior serum uric acid–lowering efficacy of combination treatment.
36.
Saag KG, Fitz-Patrick D, Kopicko J et al. Lesinurad combined with allopurinol: a randomized, double-blind, placebo-controlled study in gout patients with an inadequate response to standard-of-care allopurinol (a US-based study). Arthritis Rheumatol. 69(1), 203–212 (2017).
•• One of two Phase III trials of lesinurad in combination with allopurinol that demonstrated the superior serum uric acid–lowering efficacy of combination treatment.
37.
National Institute for Health and Care Excellence. Lesinurad for treating chronic hyperuricaemia in people with gout. Technology appraisal guidance [TA506] (2018). www.nice.org.uk/guidance/ta506
38.
Juraschek SP, Kovell LC, Miller ER, Iii., Gelber AC. Gout, urate-lowering therapy, and uric acid levels among adults in the United States. Arthritis Care Res. (Hoboken) 67(4), 588–592 (2015).
39.
Becker MA, Schumacher HR, Macdonald PA, Lloyd E, Lademacher C. Clinical efficacy and safety of successful longterm urate lowering with febuxostat or allopurinol in subjects with gout. J. Rheumatol. 36(6), 1273–1282 (2009).
40.
Khanna D, Khanna PP, Fitzgerald JD et al. 2012 American College of Rheumatology guidelines for management of gout. Part 2: therapy and antiinflammatory prophylaxis of acute gouty arthritis. Arthritis Care Res. (Hoboken) 64(10), 1447–1461 (2012).
41.
Becker MA, Fitz-Patrick D, Choi HK et al. An open-label, 6-month study of allopurinol safety in gout: the LASSO study. Semin. Arthritis Rheum. 45(2), 174–183 (2015).
42.
Truven Health Analytics. RED BOOK Online®. Micromedex Solutions (2017).
43.
US Bureau of Labor Statistics. Consumer Price Index (CPI) all urban consumers. (2016). www.bls.gov/news.release/cpi.t01.htm
44.
Perez-Ruiz F, Calabozo M, Pijoan JI, Herrero-Beites AM, Ruibal A. Effect of urate-lowering therapy on the velocity of size reduction of tophi in chronic gout. Arthritis Rheum. 47(4), 356–360 (2002).
45.
Yu TF, Gutman AB. Principles of current management of primary gout. Am. J. Med. Sci. 254(6), 893–907 (1967).
46.
Arias E. United States life tables, 2010. Natl Vital Stat. Rep. 63(7), 1–63 (2014).
47.
US Census Bureau. Current population survey, annual social and economic supplement. (2013). www.census.gov/programs-surveys/saipe/guidance/model-input-data/cpsasec.html
48.
Avalere Health Llc. Aggregate hospital payment-to-cost ratios for private payers, Medicare and Medicaid, 1994–2014. In: Trendwatch Chartbook 2016. American Hospital Association, Washington, DC, USA, 42–42 (2016).
49.
Centers for Medicare and Medicaid Services. Physician fee schedule search (2017). www.cms.gov/apps/physician-fee-schedule/license-agreement.aspx
50.
Saseen JJ, Agashivala N, Allen RR, Ghushchyan V, Yadao AM, Nair KV. Comparison of patient characteristics and gout-related health-care resource utilization and costs in patients with frequent versus infrequent gouty arthritis attacks. Rheumatology (Oxford) 51(11), 2004–2012 (2012).
Information & Authors
Information
Published In
Pages: 807 - 816
PubMed: 29792516
Copyright
© 2018 Ironwood Pharmaceuticals, Inc.
History
Received: 19 December 2017
Accepted: 25 April 2018
Published online: 24 May 2018
Keywords:
Topics
Authors
Metrics & Citations
Metrics
Article Usage
Article usage data only available from February 2023. Historical article usage data, showing the number of article downloads, is available upon request.
Citations
How to Cite
Budget impact of adding lesinurad for second-line treatment of gout: a US health plan perspective. (2018) Journal of Comparative Effectiveness Research. DOI: 10.2217/cer-2017-0103
Export citation
Select the citation format you wish to export for this article or chapter.
Citing Literature
- Xiaoxia Shi, Fengchun Zheng, Quan Wan, Peipei Chai, Guilin Wang, Zhenmiao Pang, Yuedan Ma, Estimation of the current healthcare costs of gout in Liaoning Province from 2015 to 2022 based on the SHA2011 accounting system, Frontiers in Public Health, 10.3389/fpubh.2025.1646950, 13, (2025).
- Md Abu Bakar Siddiq, Tim L. Jansen, Johannes J. Rasker, What is the Place for Uricosuric Agents in Gout Management?, Current Rheumatology Reviews, 10.2174/1573397118666220308160124, 18, 4, (279-285), (2022).
- Hannah A. Blair, Emma D. Deeks, Lesinurad in hyperuricaemia of gout: a profile of its use in the EU, Drugs & Therapy Perspectives, 10.1007/s40267-018-0566-3, 34, 12, (560-566), (2018).