Development of a novel prognostic score for breast cancer patients using mRNA expression of CHAC1
Abstract
Aim: To develop a prognostic score for primary breast cancer patients integrating conventional predictors and the novel biomarker CHAC1 to aid adjuvant chemotherapy decisions. Patients & methods: A prognostic score for overall survival was developed using: conventional predictors from a dataset of 1777 patients and the weight of CHAC1 mRNA expression from an independent dataset of 106 patients using multivariate Cox regression. Results: The new score includes: CHAC1 mRNA expression, age, tumor size, HER2 neu status, lymph node status and degree of malignancy. Using a cut-off value of 11 score points, 10-year survival was 82% in low-risk (n = 34) and 43% in high-risk patients (n = 72). The addition of CHAC1 resulted in 16% reclassification. Conclusion: Including CHAC1 in prognostic prediction may aid (and change) personalized treatment selection.
First draft submitted: 7 March 2017; Accepted for publication: 20 June 2017; Published online: 19 September 2017
Prognostic scores are important for informing patients about potential clinical outcomes, supporting physicians choices about diagnostic tests and appropriate therapies, studying the effect of specific factors on prognosis in observational studies and designing randomized controlled trials [1]. Such scores have an important role in personalized medicine, which aims to improve patient stratification and timing of healthcare interventions by using biological information and biomarkers. Treatments with known adverse effects should only be offered to patients who have a substantial chance of benefit [2].
Advances in breast cancer treatment have led to a reduction in cancer-related mortality. For example, adjuvant chemotherapy can be very beneficial for high-risk patients but may lead to greater harm in low-risk patients due to treatment toxicity. In order to optimize the benefit-harm trade-off, it is necessary to accurately define the low-risk patient population. There are various genetic tests with demonstrated analytic validity [3,4]. Our focus is on a novel biomarker, the CHAC1 mRNA expression [5].
CHAC1 is a cation transport regulator-like protein that was recently identified as a component of the unfolded protein response (UPR) pathway. The UPR is suspected to be responsible for a failed response to chemotherapy in some cancer patients. Therefore, the components of the UPR may be novel therapeutic targets [6]. Recent studies report a positive correlation between poor tumor differentiation and higher CHAC1 mRNA expression levels in breast and ovarian cancer. In addition, high mRNA expressions of CHAC1 or related transcript variants have been shown to be an independent poor prognostic marker for breast cancer outcomes [5]. Further validation studies are ongoing.
The goal of our study was to develop a preliminary prognostic score for primary breast cancer patients in the absence of large datasets. The prognostic score combines established conventional prognostic predictors of overall survival (OS) and additional genetic information on the CHAC1 mRNA expression to aid decisions about adjuvant chemotherapy until further data are available for validation.
Patients & methods
Biomarker CHAC1, RNA isolation & mRNA-expression analyses
ChaC glutathione-specific gamma-glutamylcyclotransferase 1 (CHAC1; abbreviation for Ca2+, H + antiporter C in Escherichia coli, based on sequence homologies; previously also known as MGC4504 or Botch) has been identified as a cytosolic, pro-apoptotic protein downstream the PERK – ATF4 – CHOP branch of the UPR pathway in human aortic endothelial cells [7,8].
The UPR pathway is a stress-signaling pathway in the endoplasmic reticulum. This signal-transduction cascade is activated in a range of human solid tumors including breast cancer [9,10].
CHAC1 expression was observed to be induced upon diverse conditions or treatments leading to endoplasmic reticulum stress in various cell types, including human hepatocellular carcinoma cells [11], human breast cancer cells [12], human head and neck squamous cells [13], human cervical cancer cells [14], in pancreatic carcinoma cells [15], murine retinal ganglion cells [16], human fibrosarcoma cells [17], human T lymphoblastic leukemia cells [18] and human prostatic and pancreatic cancer cells, as well as Hodgkin lymphoma cells [19]. Interestingly, whereas most studies confirm a pro-apoptotic effect upon CHAC1 induction, there is also some evidence for a pro-survival effect of upregulation of CHAC1 expression. Sustained treatment with the peptide hormone gastrin, which may lead to tumor development, resulted in induction of CHAC1 [20]. Moreover, we have previously identified elevated levels of both known CHAC1 transcript variants as putative prognostic biomarkers associated with poorer prognosis in breast and ovarian cancer patients [5].
Altogether, based on the impact on glutathione levels, CHAC1 is suggested to play an important role in the regulation of the redox potential, proliferation and survival of cells, especially during endoplasmic reticulum stress.
The mRNA expression data of the publication from Goebel et al. were used in this work. The methods are described elsewhere [5]. Briefly, “Primers and probe for qRT-PCR for CHAC1 (quantitative reverse transcription PCR [qRT-PCR]) were purchased from Applied Biosystems (Applied Biosystems, CA, USA; Assay ID: Hs00899499_g1). Primers and probes for the TATA box-binding protein (endogenous RNA-control) were used according to Bièche et al. [21]. All reactions were checked if they are specific for mRNA and do not amplify genomic DNA”.
Patients & data sources
The core methodological approach underlying our early prognostic assessment involved combining a large existing dataset of conventional predictors with a new, independent dataset that includes the biomarker of interest (i.e., CHAC1). Therefore, we used a two-step approach to develop an early prognostic score for OS: conventional predictors of OS and their weights were derived from a dataset of 1777 patients and the weight of CHAC1 mRNA expression adjusted for the conventional predictors was derived from this smaller dataset of 106 patients with measured CHAC1 mRNA expression.
Details on the dataset that includes CHAC1 mRNA expression (small dataset; DS1) have been published previously [5]. Briefly, 106 consecutive patients diagnosed with breast cancer at the Department of Gynecology and Obstetrics, Medical University of Innsbruck, Austria between April 1990 and March 2004 were studied to explore the use of CHAC1 mRNA expression in predicting OS. OS was defined as the time from surgery to death from any cause or the time to last clinical examination. Clinical predictors collected included age (dichotomized), tumor size, lymph node status, degree of malignancy, menopausal status, estrogen receptor, progesterone receptor, hormone receptor and HER2 neu status, as well as the application of chemotherapy, endocrine and radiation therapies. Information on the CHAC1 biomarker was obtained from frozen breast-tissue samples. All patients included in DS1 had a primary breast cancer (aged 36–90 years, median age at diagnosis, 60.4 years) and the median period of observation was 7.5 years (0.9–17.0). Clinical and pathological features and treatment information for all patients are summarized in Table 1.
| Characteristics | Frequencies (%) | p-values | |
|---|---|---|---|
| DS1 (n = 106) | DS2 (n = 1777) | ||
| Age (year), mean ± SD | 59.5 ± 13.7 | 57.9 ± 12.8 | 0.0145 |
| Tumor size (T2, T3, T4) | 73 (68.9%) | 487 (27.4%) | <0.0001 |
| Lymph node status (positive) | 56 (56.0%) | 570 (32.8%) | <0.0001 |
| Degree of malignancy: | <0.0001 | ||
| – Grade II | 58 (55.8%) | 1295 (74.8%) | – |
| – Grade III | 20 (19.2%) | 165 (9.5%) | – |
| ER (positive) | 69 (65.1%) | 1486 (84.4%) | <0.0001 |
| PR (positive) | 65 (61.3%) | 1451 (82.4%) | <0.0001 |
| HS (positive) | 72 (67.9%) | 1558 (87.7%) | <0.0001 |
| HER2 neu (score ++/+++) | 34 (39.1%) | 1019 (59.7%) | 0.0001 |
| Radiation therapy (yes) | 69 (65.7%) | 1169 (68.6%) | 0.5307 |
| Chemotherapy (yes) | 50 (47.2%) | 482 (27.6%) | <0.0001 |
| Endocrine therapy (yes) | 65 (61.3%) | 1507 (85.0%) | <0.0001 |
| MP (postmenopausal) | 86 (81.1%) | NA | – |
| CHAC1 mRNA expression (>median [0.8]) | 53 (50.0%) | NA | – |
p-values from χ2 test for categorical/dichotomous variables and the Wilcoxon–Mann–Whitney test for continuous variables.
DS1: Small dataset; DS2: Large dataset; ER: ER status; HER2 neu: HER2 status; HS: Hormone receptor status; MP: Menopausal status; NA: Not available; PR: PR status; SD: Standard deviation.
The second dataset (large dataset; DS2) consists of a convenience sample of 1777 breast cancer patients who were diagnosed at the Department of Gynecology and Obstetrics, Medical University of Innsbruck, Austria in 2000–2011 (age: 22–95 years; median age at diagnosis: 57.4 years). The median observation period was 3.9 years. Clinical and pathological features as well as treatment information for all patients are summarized in Table 1.
Statistical analysis
Overall analytic framework
Information on the new innovative biomarker CHAC1 was only available in the DS1. However, the DS1 is not powered to demonstrate a significant impact for the previously established predictors of OS (e.g., malignancy of the tumor), and therefore, no full multivariate score including traditional predictors and CHAC1 could be assessed in the DS1. In contrast, the DS2 is assumed to be of sufficient size to assess and identify or confirm significant conventional predictors, but CHAC1 expression is missing from this dataset. This reflects a typical situation in the early assessment of new biomarkers, and therefore, our approach was to combine information from both DS2 and DS1 in order to perform the early assessment of a prognostic score that not only includes the new biomarker but also considers conventional predictors (multivariate adjustment effects).
Our full analytic framework consisted of four steps: consistency check of the DS1 and the DS2, identification of potential prognostic predictors, score development and assessment of clinical relevance of the score.
In steps 1 and 2, the purpose of which was to justify the complementary nature of the DS1 and DS2 for score development, univariate screening and multivariate regression analyses were performed in both datasets and the results of the multivariate regression analyses were compared for consistency.
In step 3, the CHAC1 Score was developed using a starting score (Start Score), which consisted of conventional predictors from the multivariate regression analysis of the DS2, complemented by the CHAC1 Score weight derived from the multivariate regression analysis in the DS1.
In step 4, the clinical relevance of the CHAC1 Score was evaluated by assessing the reclassification of patients’ risk based on conventional prognostic predictors (Start Score) and the combination of conventional predictors and the new biomarker CHAC1 (CHAC1 Score). Finally, we assessed and compared the provision of chemotherapy in the risk groups provided by the CHAC1 Score and the Start Score.
Consistency check
For descriptive purposes, univariate screening was performed on clinical and biochemical predictors in the DS1 and the DS2. In order to identify predictor candidates for OS, we performed univariate survival analysis using Kaplan–Meier curves and log-rank tests. As traditional cut-off values of p < 0.05 may fail to identify important parameter in the univariate analysis, we followed the purposeful selection process and used p < 0.20 as cut-off value [22,23]. Logistic regression was performed to analyze the correlation between CHAC1 and other covariates. In the DS1, we used a Cox proportional hazard model to perform a multivariate survival analysis that included all variables identified as predictor candidates and interaction terms between CHAC1 and predictor candidates in the univariate analysis. This multivariate analysis was repeated in the DS2 without the variables for menopause and CHAC1, which were missing in the DS2. Hazard ratio (HR) and related 95% CI were derived from the Cox proportional hazards analysis.
To assess the consistency of both datasets and to justify the combined information used in score development, HRs and 95% CIs of the prognostic predictors derived from the multivariate analyses were compared. It was assumed that in consistent datasets, the CIs of the significant predictors from the DS2 were narrower than corresponding CIs in the DS1, and that at least the HRs of the significant predictors in the DS2 as well as part of the CIs fell within the CI of the respective predictors in the DS1.
Identification of prognostic predictors
Based on multivariate regression analyses, significant predictors (p < 0.05) in the DS1 and the DS2 were identified. HRs for significant predictors in the DS2 were combined with the HR of CHAC1 from the DS1 for score development.
Score development
The CHAC1 Score was developed using the potential prognostic predictor CHAC1 as derived from the DS1 and the Start Score, which consisted of conventional predictors identified in the DS2.
Using cut-off values, the CHAC1 Score and the Start Score separate patients by risk with respect to their OS. We categorized them into two groups (i.e., high risk and low risk) to provide an easily applicable and comprehensive decision aid for treatment selection.
For the Start Score, weights were based on the β-coefficients (i.e., regression coefficients) of the statistically significant predictors in the multivariate Cox model of the DS2. The coefficients were transformed and rounded to integer values (points). The final score value for each patient was the sum of all integer weights. The cut-off value for high-risk patients was determined based on two criteria, as follows: there was a sufficient percentage of patients in each risk group and discrimination between the low- and high-risk patient group was based on their respective survival curves (taking into account HRs). We then examined the observed OS in each group as well as their respective stratified survival curves. Cut-off results were validated against results of automated cut-off finding algorithms (X-tile, Cutoff Finder version 2.1, Budczies et al. (2012), PLoS ONE 7 (12), e51862 [24]).
Next, the Start Score was applied to the DS1, and again, the two criteria were checked.
Because CHAC1 was a statistically significant predictor in the DS1, it was added to the Start Score. For the resulting score (i.e., the CHAC1 Score), a new cut-off value for high-risk patients was identified such that either two very strong prognostic predictors were present or at least two strong and one less strong predictor were present. Within the DS1, the cut-off value for the CHAC1 Score was validated following the same two criteria of sufficient percentages and discrimination as described above.
Assessment of the clinical relevance of the scores
Reclassification of patients’ predicted risk with respect to OS was assessed using cross-tables. Reclassification of patients further supports our argument in favor of including CHAC1 into prognostic assessment as the new biomarker has the potential to change clinical decision making.
It is assumed that a score of clinical relevance can influence future treatment decisions. Therefore, in our database, high-risk patients should tend to get chemotherapy more often than low-risk patients. Two-by-two tables were calculated based on conditional probabilities for chemotherapy for the Start Score in the DS2 and the DS1 and the CHAC1 Score in the DS1 alone. In addition, relative risks were also calculated.
We used SAS® software 9.3 (SAS Institute, NC, USA) for all statistical analyses.
Results
The results of our study are presented in terms of the four steps described in the ‘Patients & methods’ section, namely consistency check, identification of potential prognostic predictors, score development and assessment of clinical relevance.
Consistency check & identification of potential prognostic predictors
In the DS2, univariate screening revealed the following OS predictor candidates: age, tumor size, lymph node status, malignity of the tumor, estrogen receptor status, progesterone receptor status, hormone receptor status and HER2 neu status. In the DS1, age, tumor size, lymph node status, menopausal status and CHAC1 mRNA expression were predictor candidates (see Supplementary Table 1; for correlation of CHAC1 mRNA expression, see Supplementary Table 2).
Table 2 summarizes the results of the multivariate Cox regression survival analyses on OS including HRs, 95% CIs and p-values for the DS1 (analysis I), the DS1 with all predictors applied in the DS2 except menopausal status and CHAC1 mRNA expression (analysis II), and the DS2 (analysis III). All interaction terms between CHAC1 and correlated covariates were not statistically significant and, therefore, were not included in the final score. Age ≥ 60.4 years, tumor size T2/T3/T4, HER2 neu positivity, lymph-node positivity and degree of malignity II/III were all significant negative predictors for OS in the DS2 (III). The inclusion of these predictors in a Cox regression model to explain OS in the smaller dataset DS1 (analysis II) showed that for age, tumor size and lymph node status, the CIs of the HRs for the DS2 (analysis III) fell within the CIs of the DS1 (analysis II), and that the HRs provide similar risk information. For tumor malignity and HER2 neu status, the CIs of the HRs in the DS2 and DS1 were overlapping, the estimated HRs from DS2 fell within the CIs of DS1 but the estimated HRs in the DS1 were 0.99 and not statistically significant. Hormone receptor status remained statistically nonsignificant. In summary, there were no substantial statistical deviations when considering the HR point estimates and CIs of the two analyses, II and III. Column I in Table 2 displays the results of the Cox regression analysis for OS in the DS1 adding menopause status and CHAC1 to the list of explanatory predictors (analysis I). CHAC1 was a statistically significant prognostic predictor (p = 0.0258). Also age remained a statistically significant predictor and the CIs from DS2 (analysis III) fell within those of analysis I. Comparing analyses I and III, again, for the predictors age, tumor stage and lymph node status, the CIs of the HRs of DS2 lie within the CIs of the smaller dataset DS1 and HRs are of same direction and comparable magnitude. In addition, for tumor malignity and HER2 neu, the CIs of the HRs in DS2 and DS1 are also overlapping. The estimated HRs from DS2 fell within the CIs of DS1. Hormone receptor status became a statistically significant predictor in the DS1 but not in the DS2. Altogether, the DS1 (analysis I) and DS2 (analysis III) provided relatively consistent results, no statistically significant contradictions were identified, and therefore, these results offered support for the decision to integrate information on prognostic predictors from both datasets for early score development.
| Variables | Analysis I: DS1 (n = 106) | Analysis II: DS1 (n = 106) | Analysis III: DS2 (n = 1777) | |||
|---|---|---|---|---|---|---|
| p-value if included in Reg. | HR [95% CI] | p-value if included in Reg. | HR [95% CI] | p-value if included in Reg. | HR [95%CI] | |
| Age (>60.4) | 0.0311* | 2.73 [1.10–6.81] | 0.0106* | 2.68 [1.26–5.70] | <0.0001* | 2.72 [1.82–4.06] |
| Tumor size (T2, T3, T4) | 0.0950 | 2.33 [0.86–6.29] | 0.0688 | 2.47 [0.93–6.53] | 0.0025* | 1.87 [1.25–2.79] |
| Lymph node status (positive) | 0.2716 | 1.57 [0.70–3.50] | 0.1610 | 1.74 [0.80–3.76] | 0.0108* | 1.67 [1.13–2.47] |
| Degree of malignancy (II/III) | 0.8625 | 1.50 [0.62–1.76] | 0.9598 | 0.99 [0.60–1.63] | 0.0441* | 1.51 [1.01–2.26] |
| HS (positive) | 0.0304* | 3.23 [1.12–9.34] | 0.2030 | 1.82 [0.72–4.58] | 0.1740 | 0.69 [0.40–1.18] |
| HER2 neu (score ++/+++) | 0.9005 | 1.05 [0.48–2.31] | 0.9868 | 0.99 [0.46–2.14] | 0.0018* | 1.98 [1.29–3.04] |
| MP (postmenopausal) | 0.9248 | 1.06 [0.32–3.46] | NA | – | NA | – |
| CHAC1 mRNA expression (>median) | 0.0258* | 2.49 [1.12–5.57] | NA | – | NA | – |
*Denotes variables that are statistically significant.
DS1: Small dataset; DS2: Large dataset; HR: Hazard ratio; HER2 neu: HER2 status; HS: Hormone receptor status; MP: Menopausal status; NA: Not available; Reg: Regression.
Score development
The Start Score for OS consists of five prognostic predictors: age ≥ 60.4 years (5 points), tumor size ≥ T2 (4 points), HER2 neu positive (4 points), lymph-node positive (3 points) and degree of malignity II/III (3 points). Hence, the total maximum of score is 19 points (see Table 3). The Kaplan–Meier survival curve (see Figure 1A) displays the discrimination between low-risk (<10 score points) and high-risk patients (≥10 score points) in the DS2. A total of 928 patients (52%) were classified as low-risk (median survival time [MST] not yet reached, 10-year survival 89%) and 849 (48%) patients were classified as high-risk (MST not yet reached, 10-year survival 65%). The log-rank test showed a statistically significant difference between the two groups (p < 0.0001). When the score was applied to DS1 (Figure 1B), 41 patients (39%) were classified as low risk (MST not yet reached, 10-year survival 77%) and 65 (61%) patients were classified as high risk (with median OS of 9.4, 10-year survival 41%). Again, the log-rank test showed a statistically significant difference between the two groups (p < 0.001).
| Predictors | Start Score† | CHAC1 Score | ||
|---|---|---|---|---|
| Condition | Points | Condition | Points | |
| Age | ≤Median age | 0 | ≤Median age | 0 |
| >Median age | 5 | >Median age | 5 | |
| Tumor size | T1 | 0 | T1 | 0 |
| T2, T3, T4 | 4 | T2, T3, T4 | 4 | |
| Lymph node status | Negative | 0 | Negative | 0 |
| Positive | 3 | Positive | 3 | |
| Degree of malignancy | I | 0 | I | 0 |
| II, III | 3 | II, III | 3 | |
| HER2 neu | Negative | 0 | Negative | 0 |
| Positive | 4 | Positive | 4 | |
| CHAC1 mRNA expression | – | NA | Low | 0 |
| NA | High | 5 | ||
| Maximum score points | 19 | 24 | ||
| Cut-off values | Low risk | <10 | Low risk | <11 |
| High risk | ≥10 | High risk | ≥11 | |
HER2 neu, based on †OS = 2.72 age + 1.87 tumor stage + 1.67 lymph node status + 1.5 degree of malignancy + 1.98 HER2 neu
HER2 neu: HER2 status; NA: Not available; OS: Overall survival; median age: 60.4 years.
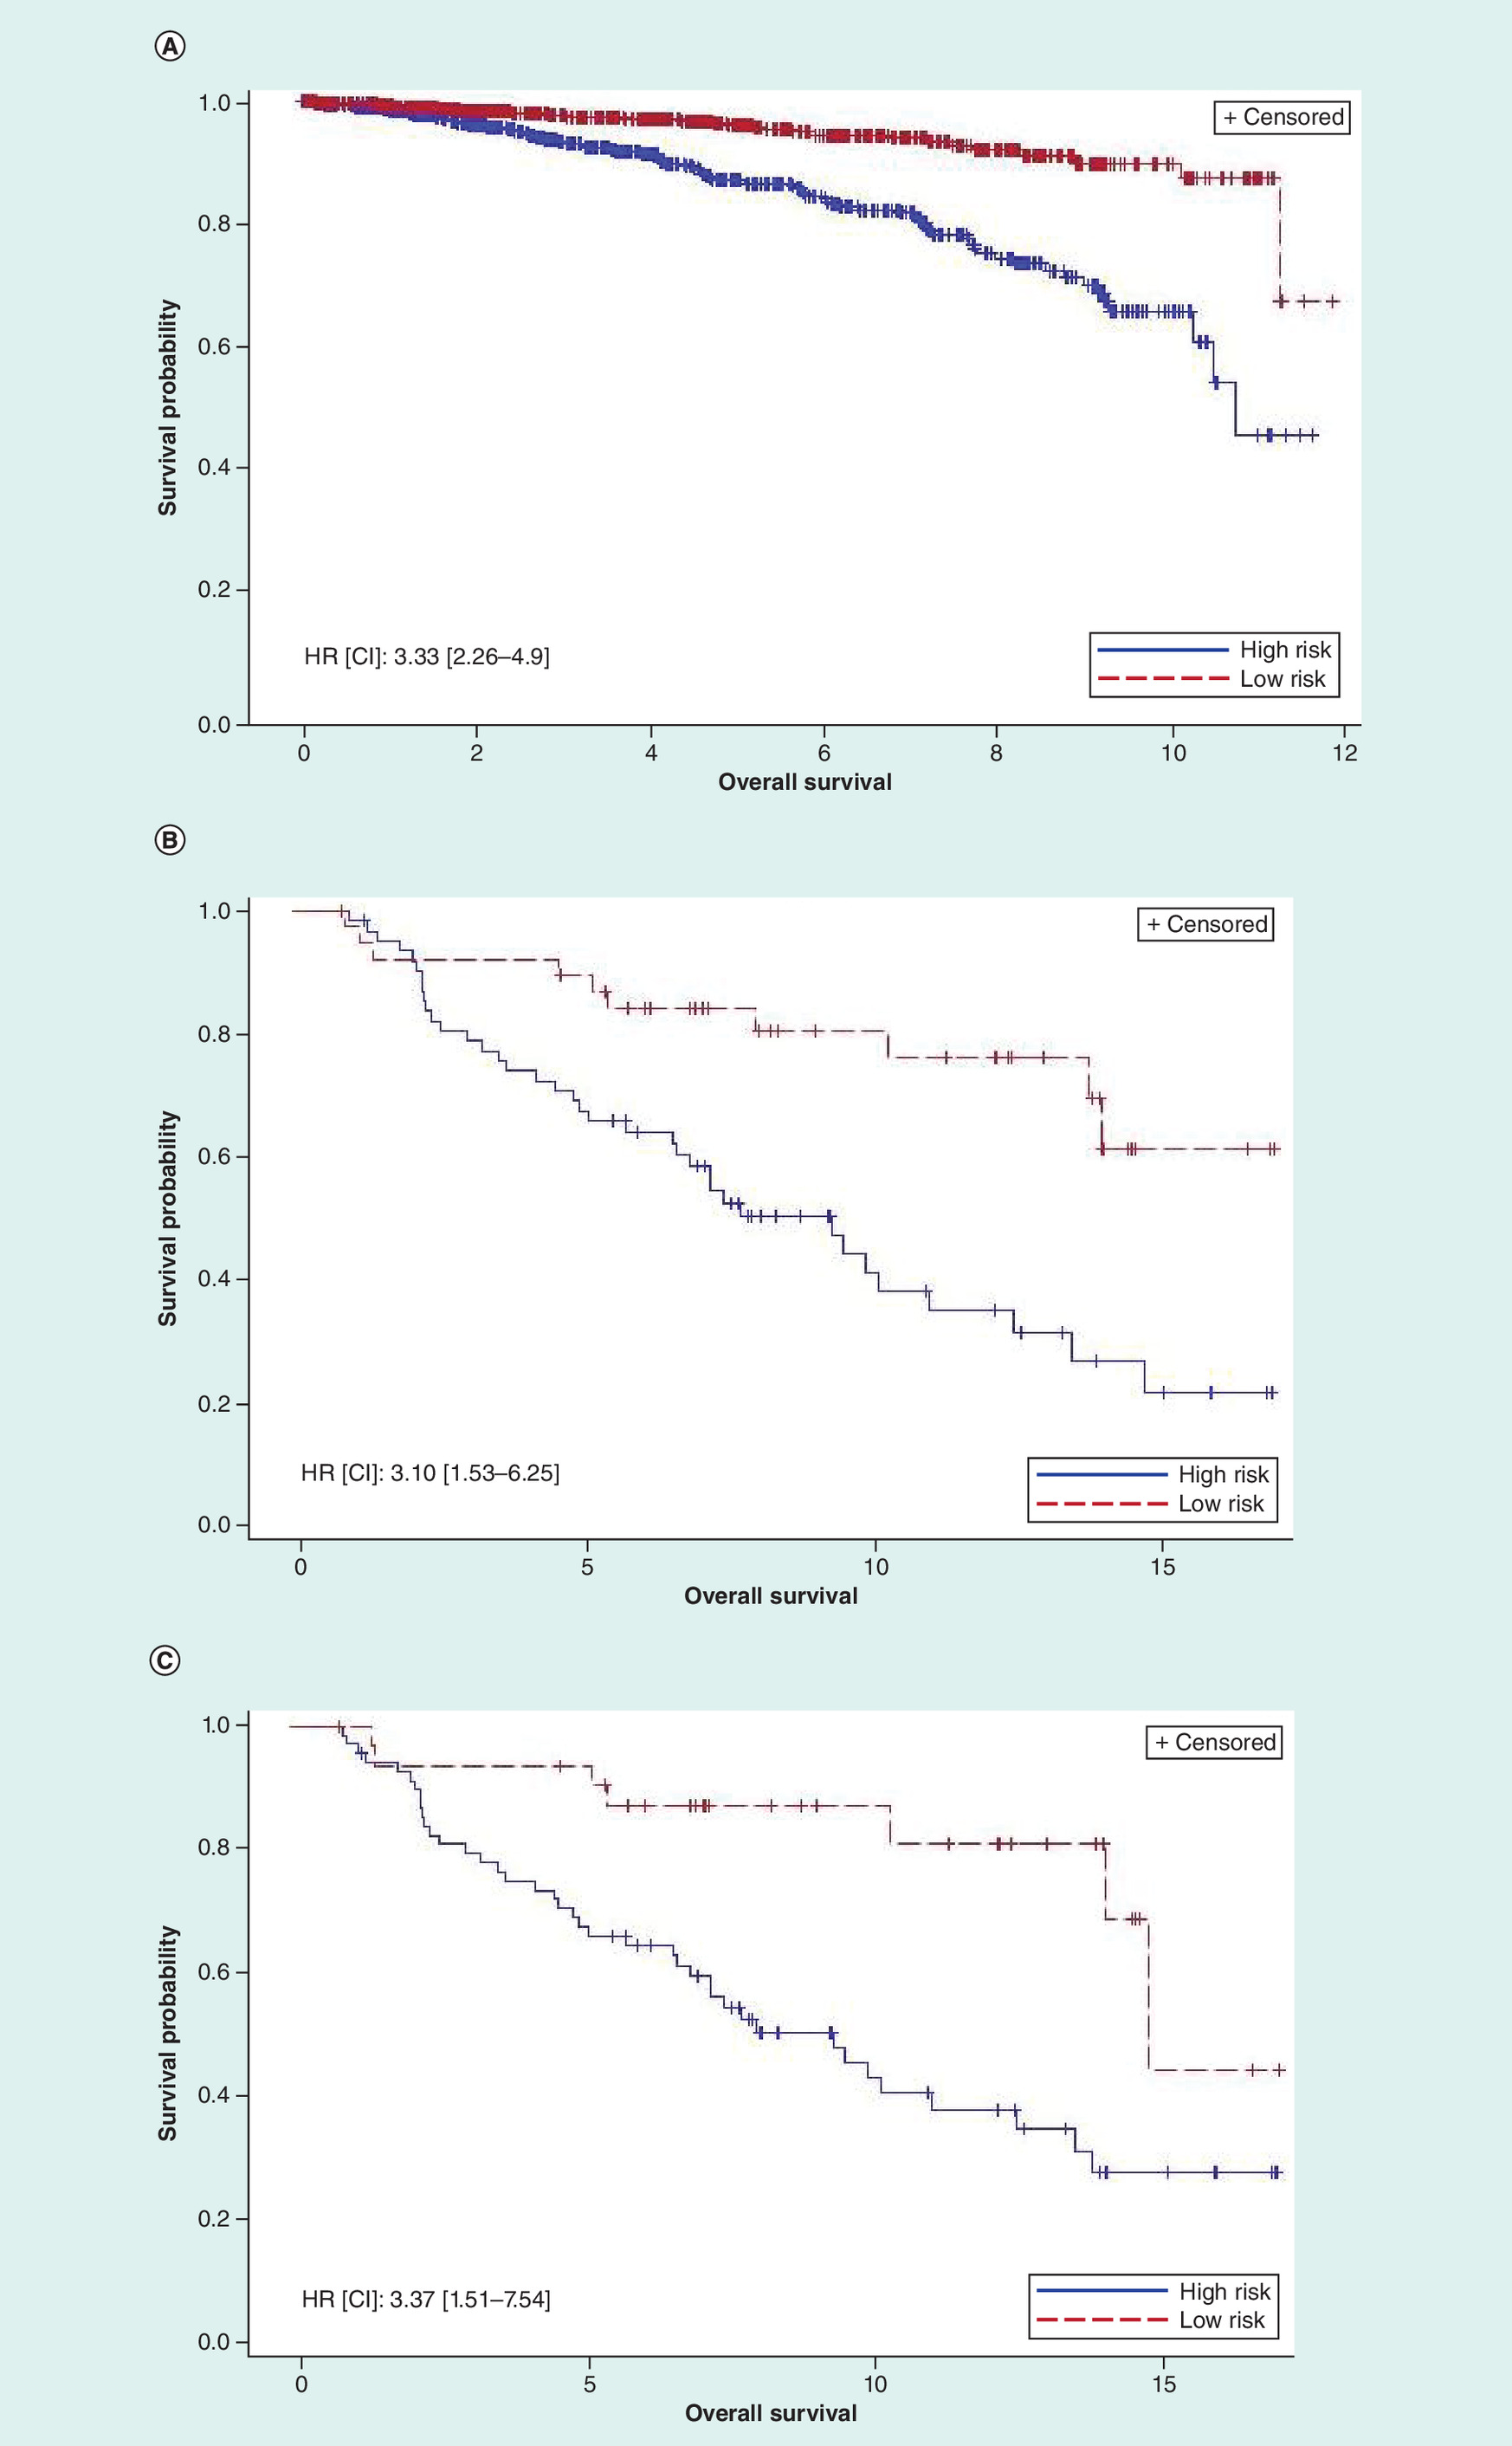
Figure 1. Overall survival in breast cancer patients.
(A) Start Score applied in a large data set (cut-off value 10; 928 low-risk, 849 high-risk patients; log-rank <0.0001; HR [CI]: 3.33 [2.26–4.9]). (B) Start Score applied in a small data set (cut-off value 10; 41 low-risk, 65 high-risk patients, log-rank <0.0010; HR [CI]: 3.10 [1.53–6.25]). (C) CHAC1 Score applied in a small dataset (cut-off value 11; 34 low-risk, 72 high-risk patients, log-rank 0.0017; HR [CI]: 3.37 [1.51–7.54]).
HR: Hazard ratio.
The CHAC1 Score includes the additional prognostic predictor of high CHAC1 mRNA expression (5 points). Hence, the maximum score is 24. The survival curve is presented in Figure 1C. Based on a cut-off value of 11 (i.e., ≥11 high risk), 34 patients (32%) were classified as low risk (median OS 14.8 years, 10-year survival 82%) and 72 (68%) patients were classified as high risk (median OS 9.5 years, 10-year survival 43%), with a statistically significant difference between the two groups (log-rank test p = 0.0017).
Assessment of the clinical relevance of the score
A comparison of the classification of the Start Score and the CHAC1 Score in the DS1 (Table 4) offers insight on the new biomarker, which resulted in the reclassification of 17 of 106 patients (16%). 12 (11.3%) low-risk patients were reclassified as high-risk patients using the CHAC1 Score and five (4.7%) high-risk patients were reclassified as low risk when using the CHAC1 Score.
| Start Score | CHAC1 Score (%) | ||
|---|---|---|---|
| Low | High | Total | |
| Low | 29 (27.4%) | 12 (11.3%) | 41 (11.3%) |
| High | 5 (4.7%) | 60 (56.6%) | 65 (61.3%) |
| Total | 34 (32.1%) | 72 (67.9%) | 106 (100.00%) |
The retrospective analyses of the probability of chemotherapy provision given the risk classification based on our scores in DS1 and the DS2 showed that less than half of the patients received chemotherapy (DS2: 28%; DS1: 47%). With both scoring systems, high-risk patients had an increased probability of receiving chemotherapy. The associated relative risks were 2.27 (Start Score in DS2), 1.80 (Start Score in DS1) and 1.34 (CHAC1 Score in DS1; see Table 5).
| Chemo provided | Start Score | Start Score | CHAC1 Score | ||||||
|---|---|---|---|---|---|---|---|---|---|
| Large dataset | Small dataset | Small dataset | |||||||
| No | Yes | RR [95% CI] | No | Yes | RR [95% CI] | No | Yes | RR [95% CI] | |
| Low-risk group | 758 (82.8%) | 157 (17.2%) | – | 28 (68.3%) | 13 (31.7%) | – | 21 (61.8%) | 13 (38.2%) | – |
| High-risk group | 509 (61.0%) | 325 (39.0%) | – | 28 (43.1%) | 37 (56.9%) | – | 35 (48.6%) | 37 (51.4%) | – |
| Total | 1267 (72.4%) | 482 (27.6%) | 2.27 [1.92–2.95] | 56 (52.8%) | 50 (47.2%) | 1.80 [1.09–2.95] | 56 (52.8%) | 50 (47.2%) | 1.34 [0.83–2.17] |
RR: Relative risk.
When the CHAC1 Score was used, fewer patients were classified as low risk (CHAC1 Score low risk 41% vs Start Score 61%). However, within the group of low-risk patients, almost the same percentage of patients received chemotherapy with each scoring strategy (Start Score 35%, CHAC1 Score 37%).
Discussion
The purpose of this study was to inform personalized decision making about treatment in women with breast cancer and to perform an early assessment of the prognostic value of the novel biomarker CHAC1 mRNA expression. This biomarker has not yet been evaluated in large databases that allow one to assess the incremental predictive power of CHAC1 in a multivariate setting. We have developed a new preliminary prognostic score for OS, which integrates information from two different datasets. This new score supports the classification of primary breast cancer patients according to their OS in order to guide decisions about adjuvant chemotherapy. In addition to conventional prognostic predictors, the new score includes the novel biomarker CHAC1 mRNA expression, and the inclusion of this new biomarker is expected to lead to a substantial change in treatment chemotherapy decisions.
In order to build a clinically useful and easily calculated score to guide binary decisions about chemotherapy treatment, we defined two risk groups. The key part of our framework was the fact that – due to the nature of early assessments of new biomarkers – we needed to integrate information from two datasets to develop a new score. We showed that adding the information about CHAC1 to an initial Start Score led to a new score with good discrimination of OS between low- and high-risk patients. In a prospective study, we expect an even better discriminatory power of the CHAC1 Score because of improved chemotherapy decisions after taking CHAC1 into account. Since with the CHAC1 Score fewer patients are classified as low risk, one could argue that this score is more conservative in terms of deciding against chemotherapy in low-risk patients. However, we show that there is a higher probability of receiving chemotherapy among high-risk patients (relative risks: 2.27 [Start Score in DS2], 1.80 [Start Score in DS1] and 1.34 [CHAC1 Score in DS1]). Moreover, given that our study is a retrospective analysis, we do not know all factors that are considered the final decision regarding chemotherapy. After clinical prognostic predictors, additional factors such as patient preferences and comorbidities are likely to impact this decision. Therefore, our analysis does not replace any future prospective study, but instead provides a first plausibility check regarding the use of CHAC1, which can be further investigated in prospective prognostic studies.
Similar to most breast cancer studies where genetic tests are compared with conventional risk classification [4,25–28], our score combines genetic information and conventional prognostic predictors. We are not aware of a similar clinically meaningful and easily calculated score for primary breast cancer patients. However, Adjuvant! Online [29] is a decision aid that supports treatment decisions. Health professionals can enter patient and tumor characteristics (conventional information) in this online tool and receive information about 10-year survival for specific treatment options. Currently, genomic information, specifically the Oncotype DX, is being integrated and an updated version will be available in the future. We internally discussed building a score based on Adjuvant! Online predictors and adding CHAC1. However, since the prognostic predictors selected from our large dataset were very similar, we did not consider this approach any further. This may be an area for further research.
In order to put the potential role of CHAC1 in prognostic scores in context with other well established prognostic scores and to validate our Start Score, we compared the Start Score and the CHAC1 Score with the widely used Nottingham prognostic index (NPI) [30,31]. Therefore, we first compared score predictor variables, predictor weights and score cut-off rules (Supplementary Table 3). Second, the NPI was applied to our dataset D1. Comparative results of the survival analysis are displayed in Supplementary Figure 1 and reclassification results are displayed in Supplementary Table 4.
The NPI provides a clinicopathological staging system for primary breast cancer [30,31] based on three important criteria: lymph node involvement, tumor size and grade [32,33]. These predictors are also part of the Start Score and the CHAC1 Score. However, the Start Score and the CHAC1 Score include further information, for example, age. Age was a statistically significant predictor in our analysis as well as in other published studies [33,34]. Age was statistically not significant in the original Cox analysis of the NPI [30]. The NPI is measured by tumor size [cm] × 0.2 + lymph node status + grade. In the Start and the CHAC1 Score, we dichotomized these predictors and developed score points (tumor size ≥ T2 [4 points], lymph-node positive [3 points], degree of malignancy II/III [3 points]), which are summed up (see also Supplementary Table 3). The survival analysis applying the scores to the dataset D1 shows that the Start Score and the CHAC1 Score discriminate high- and low-risk patients at least as good as NPI (Start Score, HR [95% CI]: 3.10 [1.53–6.25]; NPI, HR [95% CI]: 2.59 [1.16–5.77]; CHAC1 Score, HR [95% CI]: 3.37 [1.51–7.54]; for Kaplan–Meier survival curves, see Supplementary Figure 1). The reclassification analysis (Supplementary Table 4) shows a high concordance (79%) of the Start Score and the NPI as well as the CHAC1 Score and the NPI (78%). Although these results are not derived from a full external validation, they provide a useful judgment of the face validity of the CHAC1 Score.
In our study, we also provided a case example for the early assessment of the value of including novel biomarkers into a set of existing predictors rather than simply providing univariate correlations between the new biomarker and the outcome of interest. In particular, the good discrimination between the low- and high-risk breast cancer patients using the CHAC1 Score supports further research on this novel biomarker.
There are several limitations to our study. First, we were not able to derive commonly applied prognostic predictors from the same dataset that includes information on CHAC1 expression. Because we focus on a novel biomarker, we had to combine information derived from a large study (1777 patients) with a sample of 106 patients where CHAC1 mRNA expression was available. Based on the small dataset only, we would not have been able to prove the incremental impact of the new biomarker in addition to the impact of commonly accepted prognostic predictors on OS. We performed semi-formal plausibility checks to assess the comparability of the two datasets.
Since clinical studies of the biomarker CHAC1 are still ongoing, we currently do not have a sufficiently large dataset to validate our score with an independent validation sample. In addition, our score relies on a current but not readily available test of CHAC1 mRNA expression. However, the larger goal is to include this biomarker in a test set available to hospital laboratories.
Our most important limitation is that the retrospective analysis may be biased due to clinical decisions that have already guided treatment and consequently altered OS. High-risk patients may have received better treatments that may in turn lead to better survival and vice versa, and the explanatory power of the score may then be decreased. However, for ethical reasons, it is not possible to obtain a ‘pure’ prognostic dataset that reflects the natural history of disease without interventions.
Although we have used two datasets to inform our work, the study deriving the prognostic role of CHAC1 remains a small study (n = 106). However, this explanatory prognostic assessment supports continuation of research on CHAC1 and prospective trials to determine the utility of adding CHAC1 to the existing clinicopathologic risk parameters. Collection of an independent sample of clinical information and breast cancer tissue is currently ongoing that will allow for the validation of the CHAC1 biomarker. Our score will be validated when these data become available. The validated score can then be used to calculate a personalized prognostic score and support comprehensible and individualized patient information and shared decision making about the selection of appropriate treatment. In addition, the new score could be used as eligibility criteria for patient selection or to balance randomization groups in clinical trials.
Conclusion
In this early explanatory prognostic assessment of the novel biomarker CHAC1 mRNA expression, we developed a preliminary risk score that included the potential prognostic predictor CHAC1 as well as conventional prognostic predictors. Our analysis showed that the new score discriminates well between high- and low-risk breast cancer patients and that the inclusion of CHAC1 mRNA expression has the potential to lead to substantial reclassification and a subsequent change in clinical management. Our results therefore support continuation of research on the novel biomarker CHAC1. As soon as results from larger trials become available, the score should be validated and potentially further improved. Our score may aid clinical decision making regarding treatment selection and support further trial planning and research on CHAC1.
The novel biomarker CHAC1 is a promising prognostic predictor.
A prognostic score for primary breast cancer patients that integrates conventional prognostic predictors with CHAC1 mRNA expression to aid decisions about adjuvant chemotherapy was developed.
The final score was the sum of the rounded weights of all predictors.
The prognostic value of adding CHAC1 to the score was assessed using reclassification analysis.
The new score includes: high CHAC1 mRNA expression (5 points), age ≥ 61 years (5 points), tumor size ≥ T2 (4 points), HER2 neu positive (4 points), lymph-node positive (3 points) and degree of malignancy II/III (3 points).
Using a cut-off value of 11 points, 10-year survival was 82% in low-risk (n = 34) and 43% in high-risk patients (n = 72).
The addition of CHAC1 resulted in 16% reclassification.
Integration of CHAC1 with conventional prognostic predictors can improve guidance and personalized clinical decision about adjuvant chemotherapy for primary breast cancer patients.
The comparison of the CHAC1 Score with the Nottingham prognostic index showed good face validity.
Further research on the novel biomarker CHAC1 for the score validation using an independent large dataset is needed.
Supplementary data
To view the supplementary data that accompany this paper please visit the journal website at: Supplementary Material
Authors’ contributions
All involved authors (Jahn B, Arvandi M, Rochau U, Fiegl H, Goebel G, Marth C and Siebert U) stated that they have read the manuscript, have given final approval of the version to be published and have participated in the study to a sufficient extent to be named as authors. Jahn B, Arvandi M, Rochau U, Fiegl H, Goebel G, Marth C and Siebert U contributed to the conception and design of the study, acquisition of data, analysis of data. Jahn B, Arvandi M, Rochau U and Siebert U contributed to the methods development. Jahn B, Arvandi M, Rochau U, Fiegl H, Goebel G, Marth C and Siebert U contributed to the interpretation of the data, drafting and revising the article critically for important intellectual content, final approval of the version to be submitted.
Acknowledgements
We would like to thank J Manne-Goehler, Clinical Fellow in Medicine, Harvard Medical School, for reviewing and editing the manuscript for English language. Parts of the paper were presented at: Arvandi M, Jahn B, Fiegl H et al. Prognostic Scores to Support Decision Making for Women with Breast Cancer Results of a Retrospective Data Analysis [printed]. Seminar of the Austro-Swiss Region of the International Biometric Society, ROeS, 9–12 September 2013, Dornbirn, Austria.
Financial & competing interests disclosure
Financial support for this study was provided in part by the COMET Center ONCOTYROL, which is funded by the Austrian Federal Ministries BMVIT/BMWFJ (via FFG) and the Tiroler Zukunftsstiftung/Standortagentur Tirol (SAT). The following authors are/were employed by the sponsor: U Rochau and U Siebert. The authors have no other relevant affiliations or financial involvement with any organization or entity with a financial interest in or financial conflict with the subject matter or materials discussed in the manuscript apart from those disclosed.
No writing assistance was utilized in the production of this manuscript.
Ethical conduct of research
Clinical, pathological and follow-up data were stored in a database according to the hospital privacy rules. In accordance with the Austrian law, the study was approved by the ethical committee of the Medical University of Innsbruck (reference number: AM3634) and conducted in accordance with the Declaration of Helsinki. All samples were anonymized to guarantee the privacy before performing the analysis. The study including the CHAC1 biomarker evaluation (DS1) was performed in accordance with the Reporting Recommendations for Tumor Marker Prognostic Studies of the National Cancer Institute (REMARK) [35]. Further details on this study have been published previously [5].
Supplementary Material
References
1.
Harrell FE Jr, Lee KL, Mark DB. Multivariable prognostic models: issues in developing models, evaluating assumptions and adequacy, and measuring and reducing errors. Stat. Med. 15(4), 361–387 (1996).
2.
Rogowski W, Payne K, Schnell-Inderst P et al. Concepts of ‘personalization’ in personalized medicine: implications for economic evaluation. Pharmacoeconomics 33(1), 49–59 (2015).
3.
Febbo PG, Ladanyi M, Aldape KD et al. NCCN Task Force report: evaluating the clinical utility of tumor markers in oncology. J. Natl Comp. Canc. Netw. 9(Suppl. 5), S1–S32 (2011).
4.
National Institute for Health and Clinical Excellence. Technology Assessment Report commissioned by the NIHR HTA Programme on behalf of the National Institute for Health and Clinical Excellence – Protocol. Gene expression profiling tests and expanded immunohistochemistry tests to guide selection of chemotherapy regimes in breast cancer management. Final Protocol (2011). www.nice.org.uk/guidance/dg10/documents/gep-and-ihc-tests-for-breast-cancer-assessment-final-protocol2.
5.
Goebel G, Berger R, Strasak AM et al. Elevated mRNA expression of CHAC1 splicing variants is associated with poor outcome for breast and ovarian cancer patients. Br. J. Cancer 106(1), 189–198 (2012).
6.
Scriven P, Brown NJ, Pockley AG, Wyld L. The unfolded protein response and cancer: a brighter future unfolding? J. Mol. Med. (Berl.) 85(4), 331–341 (2007).
7.
Gargalovic PS, Imura M, Zhang B et al. Identification of inflammatory gene modules based on variations of human endothelial cell responses to oxidized lipids. Proc. Natl Acad. Sci. USA 103(34), 12741–12746 (2006).
8.
Mungrue IN, Pagnon J, Kohannim O, Gargalovic PS, Lusis AJ. CHAC1/MGC4504 is a novel proapoptotic component of the unfolded protein response, downstream of the ATF4-ATF3-CHOP cascade. J. Immunol. 182(1), 466–476 (2009).
9.
Fernandez PM, Tabbara SO, Jacobs LK et al. Overexpression of the glucose-regulated stress gene GRP78 in malignant but not benign human breast lesions. Breast Cancer Res. Treat. 59(1), 15–26 (2000).
10.
Scriven P, Coulson S, Haines R, Balasubramanian S, Cross S, Wyld L. Activation and clinical significance of the unfolded protein response in breast cancer. Brit. J. Cancer 101(10), 1692–1698 (2009).
11.
Magne L, Blanc E, Legrand B et al. ATF4 and the integrated stress response are induced by ethanol and cytochrome P450 2E1 in human hepatocytes. J. Hepatol. 54(4), 729–737 (2011).
12.
Galluzzi L, De Santi M, Crinelli R et al. Induction of endoplasmic reticulum stress response by the indole-3-carbinol cyclic tetrameric derivative ctet in human breast cancer cell lines. PLoS ONE 7(8), e43249 (2012).
13.
Joo NE, Ritchie K, Kamarajan P, Miao D, Kapila YL. Nisin, an apoptogenic bacteriocin and food preservative, attenuates HNSCC tumorigenesis via CHAC1. Cancer Med. 1(3), 295–305 (2012).
14.
Tattoli I, Sorbara MT, Vuckovic D et al. Amino acid starvation induced by invasive bacterial pathogens triggers an innate host defense program. Cell Host Microbe 11(6), 563–575 (2012).
15.
Kemmner W, Kessel P, Sanchez-Ruderisch H et al. Loss of UDP-N-acetylglucosamine 2-epimerase/N-acetylmannosamine kinase (GNE) induces apoptotic processes in pancreatic carcinoma cells. FASEB J. 26(2), 938–946 (2012).
16.
Yasuda M, Tanaka Y, Ryu M, Tsuda S, Nakazawa T. RNA sequence reveals mouse retinal transcriptome changes early after axonal injury. PLoS ONE 9(3), e93258 (2014).
17.
Dixon SJ, Patel DN, Welsch M et al. Pharmacological inhibition of cystine-glutamate exchange induces endoplasmic reticulum stress and ferroptosis. eLlife 3, e02523 (2014).
18.
Joo JH, Ueda E, Bortner CD, Yang XP, Liao G, Jetten AM. Farnesol activates the intrinsic pathway of apoptosis and the ATF4-ATF3-CHOP cascade of ER stress in human T lymphoblastic leukemia Molt4 cells. Biochem. Pharmacol. 97(3), 256–268 (2015).
19.
Kimura K, Huang RC. Tetra-O-methyl nordihydroguaiaretic acid broadly suppresses cancer metabolism and synergistically induces strong anticancer activity in combination with etoposide, rapamycin and UCN-01. PLoS ONE 11(2), e0148685 (2016).
20.
Selvik L-KM, Fjeldbo CS, Flatberg A et al. The duration of gastrin treatment affects global gene expression and molecular responses involved in ER stress and anti-apoptosis. BMC Genomics 14(1), 429 (2013).
21.
Bieche I, Onody P, Laurendeau I et al. Real-time reverse transcription-PCR assay for future management of ERBB2-based clinical applications. Clin. Chem. 45(8 Pt 1), 1148–1156 (1999).
22.
Hosmer DW, Lemeshow S. Applied Logistic Regression. Wiley, NY, USA (2000).
23.
Bursac Z, Gauss CH, Williams DK, Hosmer DW. Purposeful selection of variables in logistic regression. Source Code Biol. Med. 3, 17 (2008).
24.
Camp RL, Dolled-Filhart M, Rimm DL. X-tile: a new bio-informatics tool for biomarker assessment and outcome-based cut-point optimization. Clin. Cancer Res. 10(21), 7252–7259 (2004).
25.
Paulden M, Franek J, Pham B, Bedard PL, Trudeau M, Krahn M. Cost-effectiveness of the 21-gene assay for guiding adjuvant chemotherapy decisions in early breast cancer. Value Health 16, 729–739 (2013).
26.
Tsoi DT, Inoue M, Kelly CM, Verma S, Pritchard KI. Cost-effectiveness analysis of recurrence score-guided treatment using a 21-gene assay in early breast cancer. Oncologist 15(5), 457–465 (2010).
27.
Lyman GH, Cosler LE, Kuderer NM, Hornberger J. Impact of a 21-gene RT-PCR assay on treatment decisions in early-stage breast cancer: an economic analysis based on prognostic and predictive validation studies. Cancer 109(6), 1011–1018 (2007).
28.
Hornberger J, Cosler LE, Lyman GH. Economic analysis of targeting chemotherapy using a 21-gene RT-PCR assay in lymph-node-negative, estrogen-receptor-positive, early-stage breast cancer. Am. J. Manag. Care 11(5), 313–324 (2005).
29.
Adjuvant! Online, Inc. Decision making tools for health care professionals. www.adjuvantonline.com/index.jsp.
30.
Haybittle JL, Blamey RW, Elston CW et al. A prognostic index in primary breast cancer. Br. J. Cancer 45(3), 361–366 (1982).
31.
Todd JH, Dowle C, Williams MR et al. Confirmation of a prognostic index in primary breast cancer. Br. J. Cancer 56(4), 489–492 (1987).
32.
Fisher ER, Anderson S, Tan-Chiu E, Fisher B, Eaton L, Wolmark N. Fifteen-year prognostic discriminants for invasive breast carcinoma: National Surgical Adjuvant Breast and Bowel Project Protocol-06. Cancer 91(Suppl. 8), 1679–1687 (2001).
33.
Soerjomataram I, Louwman MW, Ribot JG, Roukema JA, Coebergh JW. An overview of prognostic factors for long-term survivors of breast cancer. Breast Cancer Res. Treat. 107(3), 309–330 (2008).
34.
Paredes-Aracil E, Palazon-Bru A, Folgado-de la Rosa DM, Ots-Gutierrez JR, Compan-Rosique AF, Gil-Guillen VF. A scoring system to predict breast cancer mortality at 5 and 10 years. Sci. Rep. 7(1), 415 (2017).
35.
McShane LM, Altman DG, Sauerbrei W, Taube SE, Gion M, Clark GM. Reporting recommendations for tumor marker prognostic studies (REMARK). J. Natl Cancer Inst. 97(16), 1180–1184 (2005).
Information & Authors
Information
Published In
Copyright
© 2017 Future Medicine Ltd.
History
Published online: 19 September 2017
Keywords:
Topics
Authors
Metrics & Citations
Metrics
Article Usage
Article usage data only available from February 2023. Historical article usage data, showing the number of article downloads, is available upon request.
Citations
How to Cite
Development of a novel prognostic score for breast cancer patients using mRNA expression of CHAC1
. (2017) Journal of Comparative Effectiveness Research. DOI: 10.2217/cer-2017-0015
Export citation
Select the citation format you wish to export for this article or chapter.
Citing Literature
- Ziqiang Liu, Liming Zhao, Tao Gao, Chaoyue Li, Yuxue Sun, Reshaping cell fate: Recent advances in CHAC1-mediated pathways of programmed cell death in disease and prognosis, Biochemical and Biophysical Research Communications, 10.1016/j.bbrc.2025.152849, 789, (152849), (2025).
- Jiasen Sun, Hui Ren, Jiawen Wang, Xiang Xiao, Lin Zhu, Yanyan Wang, Lili Yang, CHAC1: a master regulator of oxidative stress and ferroptosis in human diseases and cancers, Frontiers in Cell and Developmental Biology, 10.3389/fcell.2024.1458716, 12, (2024).
- Tianyi Zhang, Chongjie Yao2, Xu Zhou, Shimin Liu, Li Qi, Shiguo Zhu, Chen Zhao, Dan Hu, Weidong Shen, Glutathione‑degrading enzymes in the complex landscape of tumors (Review), International Journal of Oncology, 10.3892/ijo.2024.5660, 65, 1, (2024).
- Shuiping Liu, Lvjia Zhuo, Lu Chen, Ying He, Xudong Chen, Hao Zhang, Yuan Zhou, Ziheng Ni, Shujuan Zhao, Xiaotong Hu, E3 ubiquitin ligase RNF148 functions as an oncogene in colorectal cancer by ubiquitination-mediated degradation of CHAC2, Carcinogenesis, 10.1093/carcin/bgae002, 45, 4, (247-261), (2024).
- Vikrant Mehta, Prabhat Suman, Harish Chander, High levels of unfolded protein response component CHAC1 associates with cancer progression signatures in malignant breast cancer tissues, Clinical and Translational Oncology, 10.1007/s12094-022-02889-6, 24, 12, (2351-2365), (2022).
- Siyuan Song, Peng Shu, Expression of ferroptosis-related gene correlates with immune microenvironment and predicts prognosis in gastric cancer, Scientific Reports, 10.1038/s41598-022-12800-6, 12, 1, (2022).
- Jianhua Wu, Xuan Wang, Nan Wang, Li Ma, Xin Xie, Hao Zhang, Huafeng Kang, Zhangjian Zhou, Identification of novel antioxidant gene signature to predict the prognosis of patients with gastric cancer, World Journal of Surgical Oncology, 10.1186/s12957-021-02328-w, 19, 1, (2021).
- Yen T. K. Nguyen, Joon Sung Park, Jun Young Jang, Kyung Rok Kim, Tam T. L. Vo, Kyu-Won Kim, Byung Woo Han, Structural and Functional Analyses of Human ChaC2 in Glutathione Metabolism, Biomolecules, 10.3390/biom10010031, 10, 1, (31), (2019).
- Yanchen Liu, Mengyun Li, Danping Shi, Yuguang Zhu, Higher expression of cation transport regulator-like protein 1 (CHAC1) predicts of poor outcomes in uveal melanoma (UM) patients, International Ophthalmology, 10.1007/s10792-019-01129-1, 39, 12, (2825-2832), (2019).
- Yuriko Wada, Kosuke Takemura, Padmaja Tummala, Keisuke Uchida, Keisuke Kitagaki, Asuka Furukawa, Yuuki Ishige, Takashi Ito, Yukichi Hara, Takashige Suzuki, Hitomi Mimuro, Philip G. Board, Yoshinobu Eishi, Helicobacter pylori induces somatic mutations in TP 53 via overexpression of CHAC 1 in infected gastric epithelial cells , FEBS Open Bio, 10.1002/2211-5463.12402, 8, 4, (671-679), (2018).