Variation in adherence to medications across the healthcare system in two comparative effectiveness research cohorts
Abstract
Aim: To assess heterogeneity in adherence to medications in two example comparative effectiveness research studies. Patients & methods: We analyzed data from commercially insured patients initiating a statin or anticoagulant during 2005–2012. We calculated the cross-validated R2 from a series of hierarchical linear models to assess variation in 1-year adherence. Results: There was less heterogeneity in adherence in the statin cohort compared with the anticoagulant cohort, where patient characteristics explained 7.2% of variation in adherence, and adding therapy and provider characteristics increased the proportion of variation explained to 8.0 and 8.5%, cumulatively. Random effects provided essentially no explanatory power, even in the statin cohort with large numbers of patients clustered within each pharmacy, prescriber and provider. Conclusion: The dependence of adherence on the healthcare system was stronger when the healthcare system influenced treatment choice and patient access to medication and when indications for treatment were strong.
Clinically significant variation in healthcare practice and outcomes has been documented at nearly all levels of the healthcare system [1–9]. This variation begins with differing care provided across individual primary care physicians, and it is compounded through variation across medical practices, hospitals, pharmacies and health insurance plans. In particular, patient adherence to medications may be influenced by adherence interventions that are employed selectively across the healthcare system, and adherence is likely the single most important modifier of treatment effectiveness, as treatments are typically ineffective when they are not taken on a consistent basis [10]. Comparative effectiveness research (CER), which focuses on evaluating treatments as used in routine care, occurs within this complex healthcare delivery structure [11]. However, the role of the healthcare system in CER is not well understood, and the majority of CER analyses do not account for variation in care across the healthcare system.
The primary objective of this study was to assess heterogeneity in adherence to medications, as adherence is a major modifier of treatment effectiveness in CER studies. We evaluated heterogeneity across the healthcare system in two example CER cohorts of cardiovascular medications [12–14]. Prior work has shown that patient clinical characteristics alone explain little variation in adherence to cardiovascular medications, while healthcare system characteristics, such as provider–patient relationship, continuity of care and cost may be more important [15–18]. We explored healthcare system factors that explain observed heterogeneity in adherence, including individual providers and pharmacies as well as characteristics of patients’ healthcare environment, such as insurance plan type. We also explored differences in explained heterogeneity across subgroups of patients with varying clinical histories.
Patients & methods
Data source & cohorts
For this study, we used the UnitedHealth Research Database, a large, nationally representative database containing medical and outpatient pharmacy claims for more than 15 million US patients annually enrolled in commercial health plans through UnitedHealth. Within these data, we constructed two example CER cohorts, including a cohort of new oral anticoagulant (NOAC) versus warfarin initiators and a cohort of high versus low-intensity statin initiators, as defined in Supplementary Table 1.
New users of statins or anticoagulants were defined as patients who filled a prescription for a statin or an anticoagulant with at least 365 days of continuous enrollment in UnitedHealth and no prior prescription fill for any medication in the specified class during that period, in other words, no prior fills for statins in the statin cohort. Continuous enrollment was defined as no gaps in enrollment exceeding 30 consecutive days. We included initiators of single therapy products only; however, prior use of a combination product containing statins or anticoagulants was considered prior use of a study medication. We also required that the initial prescription fill contained at least a 30-day supply of medication, which limited the number of patients initiating on a lower dose with plans to titrate up to a higher dose within 30 days.
The index date was defined as the date of the first observed prescription fill for any medication within the class of statins and anticoagulants that met the inclusion criteria described above. Because several trials demonstrating the superior efficacy of high-intensity statins were published during 2004–2005 [19–22], we identified statin initiators between 1 January 2006 and 31 December 2012. We identified anticoagulant initiators between 1 October 2010 and 31 December 2012, a period that approximately coincides with the marketing of dabigatran, the first NOAC approved in the USA.
Patients were required to be at least 18 years of age on the index date, and anticoagulant initiations were required to have a diagnosis of atrial fibrillation during the 365 days prior to index. In order to ensure a fair comparison of adherence across patients, we excluded patients from analyses if they did not have at least 365 days of available follow-up due to death, disenrollment or end of data availability (31 December 2013). Patients were also excluded if they did not have an index visit within 1 year before their index prescription fill, if they did not have an identifiable pharmacy, prescriber, provider or state and if they had any provider type besides cardiologist, primary care provider (PCP) or hospital, as described in Supplementary Table 2. An overview of the study design is shown in Figure 1.
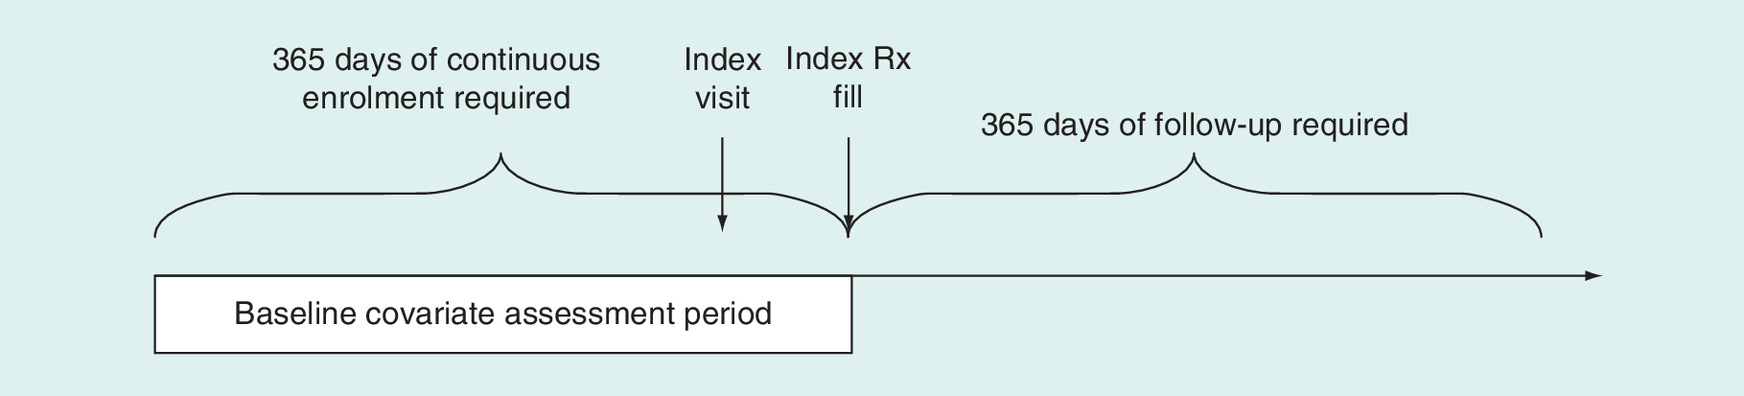
Figure 1. Overview of study design.
Rx: Prescription.
Outcome
In both the statin and anticoagulant cohorts, the outcome was adherence to the chronic medication of interest over 1 year of follow-up [23]. For each patient, a ‘supply diary’ was created for the index medication class, which indicates whether each day during follow-up was covered with medication. The supply diary was created by linking all observed fills within the medication class based on the dispensing date and the days supply. Fills for any medication within a given class were considered exchangeable, and changing doses (titration) or switching among medications in the class did not affect the supply diary. For example, among statin users, a patient could switch from atorvastatin to fluvastatin or from low dose to high dose and still be considered adherent to statins. Switching from the initial therapy to a combination product during follow-up was also still considered to represent adherence to the initial therapy, as long as the combination product contained a medication in the relevant medication class. The supply diary began at the first prescription for the index medication and continued until the end of follow-up (365 days for all patients). Supply from overlapping fills was accumulated up to 180 days excess supply.
Based on the supply diaries, we calculated the proportion of days covered (PDC) during the 365 days of follow-up as the number of days covered divided by 365. Periods of hospitalizations during follow-up were excluded from both the numerator and denominator for the calculation of PDC. One-year PDC is the adherence measure most often used by quality measures, and it has been shown to be highly associated with clinical outcomes [24–26].
Covariates
Based on exploratory hypotheses of an association with medication adherence, we defined the following seven sets of characteristics: patient, therapy, general healthcare, pharmacy, prescriber, provider and state (Table 1). All covariates besides patient characteristics were considered to be describing one part of the patient's healthcare environment. The pharmacy and prescriber were identified from the index pharmacy claim, but had few associated characteristics available in the data. Therefore, most prescriber characteristics were derived by summarizing the prescriber's patients in the cohort. State and some provider characteristics were derived similarly. The provider, assessed based on the most recent medical claim prior to the index prescription fill, came with additional information such as provider type and location of services rendered. It was assumed that the identified provider was the source of the index prescription. Patient characteristics were assessed using claims data accrued during the 365 days up to and including the index date. We used a standard set of comorbidities assessed from medical claims, defined based on International Classification of Diseases, 9th modification codes and dispensed medications, as described in Supplementary Table 3. Healthcare characteristics were assessed from various sources, including the index prescription claim (formulary type) and the patient enrollment file (insurance plan type).
| Variables | Anticoagulant cohort | Statin cohort | ||
|---|---|---|---|---|
| NOAC (n = 4455) | Warfarin (n = 4997) | High intensity (n = 117,453) | Low intensity (n = 311,081) | |
| Proportion of days covered | ||||
| Mean | 0.61 | 0.61 | 0.58 | 0.58 |
| Standard deviation | 0.35 | 0.32 | 0.32 | 0.33 |
| Patient characteristics | ||||
| Age (mean) | 61.7 | 64.0 | 53.5 | 53.4 |
| Female | 28.4 | 31.8 | 37.8 | 45.7 |
| Year: | ||||
| – 2007 | – | – | 3.0 | 3.0 |
| – 2008 | – | – | 24.2 | 22.4 |
| – 2009 | – | – | 19.7 | 21.1 |
| – 2010 | 3.6 | 16.5 | 17.0 | 20.3 |
| – 2011 | 45.4 | 45.4 | 16.9 | 17.9 |
| – 2012 | 51.0 | 38.1 | 19.2 | 15.4 |
| Coronary artery diseases | 31.0 | 38.0 | 21.7 | 11.9 |
| Myocardial infarction | 28.0 | 44.1 | 10.7 | 7.3 |
| Valvular heart disease | 0.6 | 1.3 | 0.2 | 0.1 |
| Revascularization | 2.4 | 5.6 | 5.8 | 2.3 |
| Stroke | 2.8 | 4.5 | 1.3 | 1.1 |
| Peripheral artery disease | 2.5 | 3.8 | 1.1 | 0.8 |
| Asthma | 6.3 | 7.4 | 4.5 | 4.8 |
| Chronic obstructive pulmonary disease | 3.7 | 5.6 | 1.6 | 1.5 |
| Hypertension | 75.7 | 78.4 | 60.5 | 57.6 |
| Diabetes mellitus | 25.2 | 30.0 | 25.6 | 24.9 |
| ESRD | 0.2 | 1.8 | 0.2 | 0.2 |
| Acute renal failure | 4.1 | 9.5 | 1.1 | 0.8 |
| Alzheimer's disease or other dementia | 1.9 | 2.9 | 0.7 | 0.7 |
| Depression | 6.2 | 6.8 | 7.1 | 7.7 |
| Cancer | 20.7 | 21.8 | 11.2 | 11.4 |
| Combined comorbidity score (mean) | 1.8 | 2.6 | 0.1 | 0.1 |
| Number of unique medications (mean) | 10.3 | 11.6 | 7.4 | 7.1 |
| Number of physician office visits (mean) | 8.3 | 9.1 | 5.8 | 5.8 |
| Number of hospitalizations (mean) | 0.5 | 0.8 | 0.2 | 0.1 |
| Therapy characteristics | ||||
| Generic | 0.0 | 100.0 | 23.6 | 88.4 |
| Days supply >30 | 8.4 | 12.4 | 14.9 | 14.1 |
| Out-of-pocket spending (US$, mean) | 53.1 | 7.9 | 28.9 | 11.9 |
| Drug on formulary | 16.5 | 100.0 | 98.3 | 99.6 |
| Dispensed as written | 2.0 | 3.4 | 5.6 | 1.5 |
| Characteristics of healthcare characteristics | ||||
| Formulary type: | ||||
| – Open | 21.8 | 26.7 | 13.4 | 14.3 |
| – Incentive | 76.9 | 71.8 | 85.8 | 85.0 |
| – Other | 1.3 | 1.5 | 0.8 | 0.7 |
| Insurance plan type: | ||||
| – EPO | 11.8 | 11.9 | 15.5 | 15.1 |
| – HMO | 5.1 | 4.4 | 5.4 | 5.0 |
| – IND | 11.5 | 18.5 | 2.9 | 3.3 |
| – POS | 67.7 | 61.4 | 71.7 | 71.9 |
| – PPO | 4.0 | 3.8 | 4.5 | 4.6 |
| Number of providers† (mean) | 12.9 | 15.8 | 7.6 | 7.2 |
| Number of prescribers (mean) | 4.4 | 4.5 | 2.7 | 2.7 |
| Number of pharmacies (mean) | 2.4 | 2.4 | 1.9 | 1.9 |
| Visit with cardiologist and PCP in prior 365 days | 83.8 | 80.2 | 29.5 | 22.2 |
| Copay associated with index office visit (US$, mean) | 213.1 | 227.8 | 90.1 | 53.8 |
| Pharmacy characteristics | ||||
| Mail-order pharmacy | 7.5 | 4.2 | 10.6 | 7.0 |
| Specialty pharmacy | 0.4 | 0.3 | 0.3 | 0.3 |
| Previously-visited pharmacy | 81.6 | 83.9 | 78.7 | 80.9 |
| Prescriber characteristics | ||||
| Prescriber preference‡ | 89.2 | 6.6 | 53.2 | 18.4 |
| Median age of patients | 61.6 | 63.8 | 53.8 | 53.9 |
| Mean number of patients’ physician visits | 8.5 | 9.0 | 6.1 | 5.9 |
| Mean number of patients’ hospitalizations | 0.6 | 0.8 | 0.2 | 0.1 |
| Proportion of patients with Charlson >3 | 14.4 | 26.0 | 2.8 | 2.4 |
| Provider characteristics | ||||
| Provider type and place of service: | ||||
| – Cardiologist – office | 41.6 | 26.1 | 10.9 | 6.9 |
| – Cardiologist – other | 8.0 | 4.4 | 1.8 | 1.2 |
| – Hospital | 31.7 | 43.0 | 11.1 | 7.5 |
| – PCP – office | 15.1 | 22.4 | 74.9 | 83.2 |
| – PCP – other | 3.7 | 4.2 | 1.3 | 1.3 |
| Median age of patients | 60.8 | 62.2 | 53.6 | 53.7 |
| Mean number of patients’ physician visits | 8.7 | 9.1 | 5.9 | 5.8 |
| Median copay of patients’ index visits (US$) | 12.2 | 10.4 | 14.8 | 14.7 |
| State characteristics | ||||
| Proportion of patients that received index prescription inpatient | 42.6 | 42.4 | 4.5 | 4.5 |
| Number of unique prescribers per patient | 4.7 | 4.6 | 2.4 | 2.4 |
| Number of unique providers per patient | 15.8 | 15.7 | 7.8 | 7.8 |
| Median copay of patients’ index visits (US$) | 0.0 | 0.0 | 12.5 | 11.4 |
| Proportion of patients with each plan type: | 12.4 | 11.7 | ||
| – EPO | 6.4 | 6.0 | 15.2 | 14.7 |
| – HMO | 9.7 | 11.0 | 6.2 | 6.2 |
| – IND | 67.8 | 67.6 | 3.5 | 3.8 |
| – POS | 3.6 | 3.6 | 69.4 | 69.5 |
| – PPO | 42.6 | 42.4 | 5.5 | 5.6 |
†Number of providers, prescribers and pharmacies is the total, based on all healthcare claims, for each patient during the 365 days prior to the index date.
‡Prescriber preference is defined as the proportion of patients that the prescriber initiated on an NOAC in the anticoagulant cohort and the proportion initiated on a high-intensity statin in the statin cohort.
EPO: Exclusive provider organization; ESRD: End stage renal disease; HMO: Health maintenance organization; IND: Indemnity; NOAC: New oral anticoagulant; PCP: Primary care provider; POS: Point of service; PPO: Preferred provider organization.
Statistical methods
All analyses were carried out separately in each of the two cohorts. In each cohort, we utilized hierarchical regression models [27] to explore explained and unexplained heterogeneity in adherence across the healthcare system. Hierarchical models, also known as multilevel models, have been used throughout health services research for investigating variation in healthcare use and practice across regions, hospitals, medical practices or individual physicians. The healthcare system levels considered in this study included the pharmacy where the index prescription was filled, the prescriber responsible for the index prescription, the provider where the index prescription was assumed to be written and the state. For each healthcare system level explored, models can contain fixed effects, comprised of healthcare system characteristics measured at that level and random effects, which identify a unit-specific effect on adherence. For example, at the pharmacy level, the type of pharmacy (specialty, mail order, regular) is a potential fixed effect, while the tendency of a specific pharmacy to have patients that are better or worse adherers is a random effect. Together, the pharmacy level fixed and random effects can be included in the model to estimate the cumulative effect of the pharmacy on patient adherence.
From each model, we recorded the estimated R2, which describes the proportion of variance in adherence explained by the model [28]. Because R2 is a measure of variation explained by model components, it must be estimated in a way that accounts for the overoptimism inherent in such measures. We, therefore, estimated R2 using tenfold cross-validation [29].
Primary analyses were carried out in the full cohort for each medication class. In the statin cohort, we additionally considered three subgroups that likely differed in the type of care received: no evidence of prior vascular event (no prior claims for myocardial infarction [MI], stroke or revascularization), secondary prevention (any claim for MI, stroke or revascularization during the year up to and including the index date) and recent hospitalization (discharged from the hospital with a primary diagnosis of MI, stroke or revascularization during the 90 days prior to and including the index date). Secondary analyses of the anticoagulant cohort were stratified according to evidence of prior kidney disease or renal impairment.
Results
Cohort characteristics
We identified 9452 anticoagulant initiators and 428,534 statin initiators who met all cohort inclusion criteria (Supplementary Figures 1A & B). In the anticoagulant cohort, patients utilized 7132 unique pharmacies to fill their index prescription, and they received prescriptions from 7886 unique prescribers; there were 6317 unique providers associated with the index visit (Supplementary Figure 2A). In the statin cohort, patients utilized 45,600 unique pharmacies to fill their index prescription, and they received prescriptions from 119,584 unique prescribers; there were 95,656 unique providers associated with the index visit (Supplementary Figure 2B).
Mean PDC was slightly higher among anticoagulant users compared with statin users (Table 1) but similar between NOAC and warfarin initiators and between high-intensity and low-intensity statin initiators. Overall, the anticoagulant cohort was slightly older than the statin cohort and had more comorbidities and health services usage. Anticoagulants were more likely to be dispensed in supplies of ≤30 days to patients with a higher number of unique providers and unique prescribers.
Within the anticoagulant cohort, patients initiating an NOAC were on average younger (62 years) than patients initiating warfarin (64 years) were less likely to be female (28 vs 32%) and had lower rates of all evaluated comorbidities. NOAC initiators also had higher out-of-pocket costs for their index prescription fill ($53 vs $8) and were more likely to have a point of service insurance plan type (68 vs 61%).
Within the statin cohort, patients initiating high-intensity statins were of similar age to patients initiating low-intensity statins (53.5 vs 53.4 years) but were less likely to be female (38 vs 46%) and were more likely to have nearly all evaluated comorbidities. Patients initiating a high-intensity statin were much less likely to have received a generic for their index statin fill (24 vs 88%) and therefore had higher out-of-pocket spending on their index fill (US$29 vs US$12). High-intensity statin users also had higher costs associated with their index visit (US$90 vs US$54).
Variation in adherence
Anticoagulant cohort
Variation in adherence explained by each model under consideration is reported in Table 2. When evaluating individual sets of fixed effects in the anticoagulant cohort, patient characteristics and prescriber characteristics each explained the largest proportions of variation (7.2 and 4.3%, respectively); however, when patient characteristics were already in the model, adding prescriber characteristics provided no additional explanatory power (8.1 vs 8.0%), suggesting that patient and prescriber characteristics are correlated and explain heterogeneity in adherence in similar ways. Addition of pharmacy and state characteristics also had little impact on R2, but adding provider characteristics, including provider type, increased variation explained from 8.0 to 8.5%. When evaluating random effects alone, there was little heterogeneity in patient adherence across pharmacies, prescribers, providers and states, likely due to the fact that most of these entities contained only one patient in the cohort.
| Models | Fixed effects | Random effects | All effects | |||
|---|---|---|---|---|---|---|
| R2 | CV R2 | R2 | CV R2 | R2 | CV R2 | |
| Anticoagulant cohort | ||||||
| Patient | 0.078 | 0.072 | – | – | – | – |
| Therapy | 0.018 | 0.016 | – | – | – | – |
| Healthcare | 0.027 | 0.024 | – | – | – | – |
| Pharmacy | 0.015 | 0.014 | 0.149 | 0.010 | 0.109 | 0.012 |
| Prescriber | 0.044 | 0.043 | 0.158 | 0.002 | 0.142 | 0.043 |
| Provider | 0.044 | 0.042 | 0.052 | 0.001 | 0.063 | 0.042 |
| State | 0.006 | 0.003 | 0.008 | 0.002 | 0.008 | 0.003 |
| Patient + therapy | 0.087 | 0.080 | – | – | – | – |
| Patient + therapy + healthcare | 0.091 | 0.081 | – | – | – | – |
| Patient + therapy + healthcare + pharmacy | 0.091 | 0.081 | – | – | 0.135 | 0.080 |
| Patient + therapy + healthcare + pharmacy + prescriber | 0.091 | 0.080 | – | – | 0.236 | 0.080 |
| Patient + therapy + healthcare + pharmacy + prescriber + provider | 0.098 | 0.085 | – | – | 0.206 | 0.085 |
| Patient + therapy + healthcare + pharmacy + prescriber + provider + state | 0.099 | 0.085 | – | – | 0.206 | 0.084 |
| Statin cohort | ||||||
| Patient | 0.047 | 0.047 | – | – | – | – |
| Therapy | 0.027 | 0.027 | – | – | – | – |
| Healthcare | 0.014 | 0.014 | – | – | – | – |
| Pharmacy | 0.022 | 0.022 | 0.084 | 0.036 | 0.130 | 0.037 |
| Prescriber | 0.019 | 0.019 | 0.119 | 0.022 | 0.158 | 0.034 |
| Provider | 0.020 | 0.020 | 0.108 | 0.024 | 0.147 | 0.035 |
| State | 0.008 | 0.008 | 0.009 | 0.009 | 0.059 | 0.009 |
| Patient + therapy | 0.067 | 0.066 | – | – | – | – |
| Patient + therapy + healthcare | 0.068 | 0.068 | – | – | – | – |
| Patient + therapy + healthcare + pharmacy | 0.070 | 0.070 | – | – | 0.165 | 0.076 |
| Patient + therapy + healthcare + pharmacy + prescriber | 0.071 | 0.071 | – | – | 0.216 | 0.078 |
| Patient + therapy + healthcare + pharmacy + prescriber + provider | 0.073 | 0.072 | – | – | 0.219 | 0.078 |
| Patient + therapy + healthcare + pharmacy + prescriber + provider + state | 0.076 | 0.076 | – | – | 0.216 | 0.079 |
The factors most associated with better adherence to oral anticoagulants were a prior stroke, hypertension, initiation of rivaroxaban as opposed to dabigatran or warfarin, longer days supply on the index fill and receiving that prescription from a cardiologist in an office setting, as opposed to a nonoffice setting, including hospitals, skilled nursing facilities and the patient's home (Table 3). The factors most strongly associated with worse adherence included prior revascularization and diagnosis with depression.
| Covariates | Anticoagulant cohort | Statin cohort | ||
|---|---|---|---|---|
| Coefficient estimate | 95% CI | Coefficient estimate | 95% CI | |
| Patient characteristics | ||||
| Age | 0.004 | (0.003, 0.005) | 0.004 | (0.004, 0.004) |
| Female | -0.001 | (-0.016, 0.013) | 0.039 | (0.037, 0.041) |
| Year (ref: 2010): | ||||
| – 2011 | 0.000 | (-0.023, 0.023) | 0.027 | (0.021, 0.032) |
| – 2012 | -0.012 | (-0.035, 0.011) | 0.004 | (-0.002, 0.010) |
| Coronary artery diseases | 0.006 | (-0.010, 0.021) | 0.000 | (-0.006, 0.006) |
| Myocardial infarction | 0.008 | (-0.011, 0.028) | -0.006 | (-0.012, 0.000) |
| Valvular heart disease | -0.043 | (-0.110, 0.024) | -0.009 | (-0.015, -0.003) |
| Revascularization | -0.051 | (-0.086, -0.016) | 0.007 | (0.003, 0.010) |
| Stroke | 0.161 | (0.124, 0.197) | 0.013 | (0.008, 0.019) |
| Peripheral artery disease | -0.030 | (-0.069, 0.008) | 0.008 | (-0.017, 0.033) |
| Chronic obstructive pulmonary disease | -0.021 | (-0.048, 0.005) | 0.160 | (0.153, 0.167) |
| Asthma | -0.011 | (-0.043, 0.021) | 0.041 | (0.031, 0.051) |
| Hypertension | 0.056 | (0.038, 0.073) | 0.012 | (0.002, 0.023) |
| Diabetes mellitus | 0.021 | (0.005, 0.037) | -0.019 | (-0.023, -0.014) |
| ESRD | -0.033 | (-0.099, 0.033) | -0.030 | (-0.038, -0.022) |
| Acute renal failure | -0.017 | (-0.046, 0.012) | 0.012 | (0.010, 0.014) |
| Alzheimer's disease or other dementia | -0.010 | (-0.054, 0.033) | -0.015 | (-0.017, -0.012) |
| Depression | -0.044 | (-0.071, -0.017) | -0.012 | (-0.036, 0.012) |
| Cancer | -0.005 | (-0.021, 0.012) | 0.014 | (0.004, 0.025) |
| Combined comorbidity score | 0.002 | (-0.004, 0.007) | -0.001 | (-0.013, 0.011) |
| Number of unique medications | 0.008 | (0.006, 0.009) | 0.005 | (0.002, 0.009) |
| Number of physician office visits | -0.003 | (-0.005, 0.000) | 0.024 | (0.021, 0.027) |
| Number of hospitalizations | -0.012 | (-0.032, 0.007) | -0.007 | (-0.008, -0.006) |
| Characteristics of index prescription fill therapy characteristics | ||||
| Index anticoagulant (ref: dabigatran): | ||||
| – Rivaroxaban | 0.056 | (0.017, 0.095) | – | – |
| – Warfarin | -0.023 | (-0.077, 0.030) | – | – |
| Index statin (ref: low-intensity): | ||||
| – High-intensity | – | – | -0.009 | (-0.012, -0.006) |
| – Generic | – | – | 0.004 | (0.001, 0.007) |
| Days supply >30 | 0.071 | (0.043, 0.100) | 0.097 | (0.093, 0.100) |
| Out-of-pocket spending (per US$10) | -0.001 | (-0.004, 0.001) | -0.002 | (-0.003, -0.002) |
| Drug on formulary | -0.012 | (-0.055, 0.031) | 0.054 | (0.043, 0.065) |
| Dispensed as written | 0.037 | (-0.003, 0.076) | 0.030 | (0.024, 0.036) |
| Characteristics of healthcare characteristics | ||||
| Formulary type (ref: open): | ||||
| – Incentive | -0.021 | (-0.039, -0.003) | -0.012 | (-0.015, -0.009) |
| – Other | 0.002 | (-0.057, 0.061) | -0.006 | (-0.018, 0.005) |
| Insurance plan type (ref: EPO): | ||||
| – HMO | -0.026 | (-0.065, 0.014) | -0.002 | (-0.007, 0.003) |
| – IND | 0.004 | (-0.029, 0.037) | -0.002 | (-0.009, 0.004) |
| – POS | -0.006 | (-0.027, 0.016) | 0.016 | (0.013, 0.018) |
| – PPO | 0.002 | (-0.039, 0.043) | 0.003 | (-0.002, 0.009) |
| Number of providers | 0.000 | (-0.001, 0.001) | 0.001 | (0.001, 0.002) |
| Number of prescribers | -0.008 | (-0.012, -0.004) | 0.001 | (0.000, 0.002) |
| Number of pharmacies | 0.002 | (-0.003, 0.007) | -0.002 | (-0.003, -0.001) |
| Visit with both cardiologist and PCP in prior 365 days | 0.022 | (0.004, 0.040) | -0.005 | (-0.007, -0.002) |
| Copay associated with index office visit (per US$100) | 0.000 | (-0.001, 0.001) | 0.001 | (0.000, 0.001) |
| Pharmacy characteristics | ||||
| Mail-order pharmacy | 0.022 | (-0.016, 0.060) | 0.068 | (0.063, 0.073) |
| Specialty pharmacy | 0.003 | (-0.103, 0.110) | -0.029 | (-0.047, -0.011) |
| Previously-visited pharmacy | 0.006 | (-0.012, 0.025) | 0.022 | (0.020, 0.025) |
| Prescriber characteristics | ||||
| Prescriber preference (per 10%) | -0.003 | (-0.007, 0.000) | -0.002 | (-0.002, -0.001) |
| Median age of patients | 0.000 | (-0.001, 0.002) | 0.001 | (0.001, 0.001) |
| Mean number of patients’ physician visits | -0.001 | (-0.004, 0.002) | 0.000 | (0.000, 0.001) |
| Mean number of patients’ hospitalizations | -0.002 | (-0.022, 0.018) | -0.006 | (-0.011, -0.002) |
| Percent of patients with Charlson >3 (per 10%) | -0.001 | (-0.003, 0.002) | 0.000 | (-0.001, 0.001) |
| Provider characteristics | ||||
| Provider type and place of service (ref: cardiologist – office): | ||||
| – Cardiologist – other | -0.093 | (-0.122, -0.064) | -0.001 | (-0.010, 0.008) |
| – Hospital | -0.063 | (-0.084, -0.043) | -0.017 | (-0.023, -0.012) |
| – PCP – office | -0.033 | (-0.053, -0.014) | -0.020 | (-0.024, -0.016) |
| – PCP – other | -0.069 | (-0.104, -0.033) | -0.060 | (-0.069, -0.051) |
| Median age of patients | 0.000 | (-0.001, 0.002) | 0.001 | (0.000, 0.001) |
| Mean number of patients’ physician visits | 0.000 | (-0.002, 0.003) | -0.001 | (-0.001, 0.000) |
| Median copay of patients’ index visits (per US$10) | 0.000 | (-0.002, 0.002) | -0.003 | (-0.004, -0.003) |
| State characteristics | ||||
| Proportion of patients that received index prescription inpatient | 0.001 | (-0.001, 0.003) | 0.003 | (0.001, 0.006) |
| Number of unique prescribers per patient | -0.017 | (-0.052, 0.019) | -0.027 | (-0.035, -0.019) |
| Number of unique providers per patient | 0.002 | (-0.007, 0.010) | -0.005 | (-0.008, -0.002) |
| Proportion of patients with each plan type: | ||||
| – HMO | 0.021 | (-0.026, 0.069) | -0.002 | (-0.002, -0.001) |
| – IND | 0.021 | (-0.025, 0.068) | -0.002 | (-0.002, -0.001) |
| – POS | 0.021 | (-0.027, 0.068) | 0.001 | (0.000, 0.002) |
| – PPO | 0.020 | (-0.027, 0.067) | 0.001 | (0.000, 0.003) |
EPO: Exclusive provider organization; ESRD: End stage renal disease; HMO: Health maintenance organization; IND: Indemnity; PCP: Primary care provider; POS: Point of service; PPO: Preferred provider organization.
Statin cohort
The variation in adherence explained by model fixed effects was generally lower in the statin cohort compared with the anticoagulant cohort (Table 2). For example, patient characteristics now explain just 4.7% of the variation in adherence and prescriber characteristics explain only 1.9%. Characteristics of the index prescription fill were slightly more important in explaining variation in adherence compared with the anticoagulant cohort at 2.7%. When patient and therapy characteristics were combined, 6.6% of variation was explained, and addition of all other fixed effects added little to model explanatory power.
In the random effects models, 3.6% of the variation in adherence could be attributed to the individual pharmacy where the patient filled his medication. Prescriber and provider random effects were associated with even less heterogeneity, and there was essentially no variation across states. In the models that added these random effects to the fixed effects, there was almost no additional variation explained, suggesting that the little heterogeneity observed across pharmacies, prescribers, providers and states can be explained almost entirely by the characteristics included in the fixed effects.
When considering all fixed effects, the factors with the largest associations with better adherence to statins were diagnosis with chronic obstructive pulmonary disease, index medication supply of >30 days, presence of the index drug on the pharmacy benefits formulary and filling the index prescription from a mail-order pharmacy (Table 3). The factor most strongly associated with poor adherence was having an index visit with a PCP in a nonoffice setting.
Subgroup analyses
Anticoagulant cohort
Within the subgroup of patients with kidney disease or renal impairment (n = 955), adherence to anticoagulant therapy was not explained well by any of the models explored (Supplementary Table 5A). Even patient characteristics were associated with just 0.9% of variation explained. Within the subgroup of patients with no evidence of kidney disease or renal impairment, the explanatory power of models was increased slightly from that observed in the full cohort. The patterns of R2 values were same in this subgroup as in the overall cohort, including the highest R2 associated with patient characteristics and increases in R2 when adding therapy characteristics and provider characteristics to the model.
Statin cohort
In the subgroup of patients with no evidence of a prior coronary event, results were largely similar to the results in the full cohort of statin initiators, although patient characteristics were found to be slightly less important determinants of adherence (Supplementary Table 5B). In the secondary prevention subgroup, patient characteristics were more important in determining adherence to statins, explaining 7.8% of the observed variation. Most other fixed and random effects explained little variation. In the recent hospitalization subgroup, patient factors were again the most important determinant of statin adherence, while other factors, including the hospital from which the patient had been discharged (the provider), provided almost no explanatory power.
Discussion
In the example CER cohorts explored in this study, we found that adherence to study medications varied across the healthcare system, but the amount and type of variation depended on the clinical context. For example, adherence to oral anticoagulants varied considerably across the healthcare system, and much of that variation could be explained by patient, therapy and provider characteristics. In the statin cohort, there was much less heterogeneity in adherence, and it was primarily explained by patient and therapy characteristics. Although the cross-validated proportion of variance explained was generally small across both cohorts, these findings are in line with prior research evaluating adherence prediction [12]. Differences between cohorts may be attributable to differences between these two classes of drugs.
Within the class of anticoagulants, NOACs have only recently been approved, and they are more expensive and not as widely available as warfarin; thus, the healthcare environment and provider characteristics are important determinants of patient access to medication and subsequent adherence. In addition, NOACs and warfarin have essentially identical indications, so the choice between these drugs is more likely to be dependent on those characteristics of the healthcare environment that determine access to the more expensive drug as well as prescriber preference. In contrast, most statins have been on the market for a longer period of time, are available as a generic, and are listed on lower formulary tiers. Therefore, even for high-intensity statins, patient access to medication does not pose a major barrier to adherence, and healthcare system factors that determine access are less influential. Furthermore, treatment choice between high-intensity and low-intensity statins is more likely to be driven by patient clinical characteristics, since high-intensity statins are indicated for patients with a history of cardiovascular events or other strong risk factors for cardiovascular disease. Treatment choice is less likely to be driven by prescriber preference or other healthcare characteristics.
Within each of these cohorts, the importance of healthcare system factors also differed across clinical subgroups. In the anticoagulant cohort, therapy and provider characteristics were no longer important determinants of adherence among patients with potential contraindications for therapy, such as anticoagulant patients with renal impairment. Similarly, among statin patients with less clear indications for therapy, such as those with no prior coronary event, the importance of healthcare system factors on adherence was reduced. These results further support the conclusion that the utility of these variables depends strongly on the clinical context.
Our results also indicate that the proportion of variation explained by the heterogeneity across pharmacies, prescribers and providers did not depend strongly on the number of patients clustered within each unit; both cohorts had little variation in adherence across the random effects. The anticoagulant cohort generally had little clustering. For example, 86% of prescribers contributed just one patient to the cohort. In contrast, the statin cohort had considerably more clustering of patients within the healthcare hierarchies of interest. Only 46% of prescribers contributed just one patient to the cohort. This difference between cohorts is due to the fact that patients could accrue in the statin cohort over a much longer period of time (6 years), allowing individual prescribers to contribute a larger number of patients meeting cohort inclusion criteria. The clustering observed within states was similar between the two cohorts and generally reflects the availability of UnitedHealth insurance plans within each state.
Although we were able to identify a prescriber, provider, pharmacy and state for nearly all patients initiating one of the study drugs, approximately 25% of patients in each cohort were excluded because the index visit was with a provider type that was unlikely to be the source of the prescription, for example, chiropractor, acupuncturist or home health aide. Therefore, the provider identified in the most recent visit may often not be the prescriber, despite the fact that for most patients in both cohorts, the identified index visit occurred a short time prior to the index prescription fill (Supplementary Table 6). For example, 91 and 98% of patients in the statin and anticoagulant cohorts, respectively, had an index visit within 30 days.
In studying medication adherence, pharmacy claims are generally considered to be a highly accurate source of information [30–32]. However, the exact timing of nonadherence behaviors cannot be judged, since patients may stop medication use prior to their observed gap in prescription refills, resulting in overestimation of their overall adherence. Frequent switching among statins due to medication side effects may make statins particularly prone to overestimation of adherence, since we may count pills toward the days supply that were likely thrown away. In addition, the clinical impact of nonadherence is likely to differ across the different drug regimens assessed. Thus, the impact on adherence of specific patient and healthcare factors may translate into larger or smaller clinical impacts, depending on the drug. The use of a commercial insurance claims database, UnitedHealth, may also have limited the generalizability of the findings of this study to uninsured and other noncommercial insurance populations. For example, the impact of costs may be significantly higher in patients with low socioeconomic status, including those receiving coverage from government insurance programs such as Medicare or Medicaid. Lack of any pharmacy benefit coverage would likely overwhelm the impact of all other factors on medication adherence. Furthermore, the proportion of variation explained could be increased through the use of nonlinear terms or interactions; however, the already very large size of these models made the inclusion of many of such terms computationally infeasible.
Conclusion
From these results, we recommend that investigators planning a CER study consider the role of healthcare system factors and their potential to influence medication adherence and effectiveness, particularly if adherence differs between the two comparator drugs. Some variables, such as provider type, could easily be controlled via inclusion in a propensity score or multivariate outcome model. The individual prescriber or provider was less influential on adherence, and therefore it may not be necessary to account for these variables. Further research should evaluate whether controlling for indications for treatment, such as those used to create analytic subgroups in this study, could mitigate potential confounding from healthcare system factors.
Adherence to medication is an important modifier of the comparative effectiveness of medications.
Both adherence and therapeutic preference may vary across the healthcare system, potentially impacting the results of comparative effectiveness research.
Therapy and provider characteristics were the largest sources of heterogeneity in adherence across the healthcare system.
Patient characteristics influencing adherence to oral anticoagulants included prior stroke and end stage renal disease. Important healthcare characteristics included insurance plan type and seeing both a primary care provider and a cardiologist during the year before anticoagulant initiation.
Patient characteristics influencing adherence to statins included prior revascularization; important characteristics of the index prescription fill included longer days supply and presence of the drug on the pharmacy benefits formulary.
The dependence of adherence on the healthcare system was stronger when the healthcare system influenced treatment choice and patient access to medication and when indications for treatment were strong.
Acknowledgements
The authors wish to acknowledge J Lii for help with programming.
Financial & competing interests disclosure
This work was funded by Merck & Co. Brigham and Women's Hospital retained the right to publish any results without approval from Merck. The authors have no other relevant affiliations or financial involvement with any organization or entity with a financial interest in or financial conflict with the subject matter or materials discussed in the manuscript apart from those disclosed.
No writing assistance was utilized in the production of this manuscript.
Ethical conduct of research
The research presented here was approved by the Institutional Review Board of Brigham and Women's Hospital. Because all data were derived from de-identified secondary research databases, patients were not contacted to provide informed consent.
Supplementary Material
File (suppl_materials.docx)
- Download
- 330.61 KB
References
1.
Bronskill SE, Rochon PA, Gill SS et al. The relationship between variations in antipsychotic prescribing across nursing homes and short-term mortality: quality of care implications. Med. Care 47(9), 1000–1008 (2009).
2.
Corallo AN, Croxford R, Goodman DC, Bryan EL, Srivastava D, Stukel TA. A systematic review of medical practice variation in OECD countries. Health Pol. 114(1), 5–14 (2014).
3.
Kalisch BJ, Tschannen D, Lee H, Friese CR. Hospital variation in missed nursing care. Am. J. Med. Qual. 26(4), 291–299 (2011).
4.
O'Hare AM, Rodriguez RA, Hailpern SM, Larson EB, Kurella Tamura M. Regional variation in health care intensity and treatment practices for end-stage renal disease in older adults. JAMA 304(2), 180–186 (2010).
5.
Salisbury AC, Kennedy K, Spertus JA et al. Prevalence, correlates, and inter-hospital variation of early outpatient follow-up after acute myocardial infarction. Abstracts (Missouri Regional Life Sciences Summit) (2010). https://mospace.umsystem.edu/xmlui/handle/10355/6230.
6.
Solomon DH, Brookhart MA, Gandhi TK et al. Adherence with osteoporosis practice guidelines: a multilevel analysis of patient, physician, and practice setting characteristics. Am. J. Med. 117(12), 919–924 (2004).
7.
Solomon DH, Schneeweiss S, Glynn RJ, Levin R, Avorn J. Determinants of selective cyclooxygenase-2 inhibitor prescribing: are patient or physician characteristics more important? Am. J. Med. 115(9), 715–720 (2003).
8.
Song Y, Skinner J, Bynum J, Sutherland J, Wennberg JE, Fisher ES. Regional variations in diagnostic practices. N. Engl. J. Med. 363(1), 45–53 (2010).
9.
Tsai TC, Joynt KE, Orav EJ, Gawande AA, Jha AK. Variation in surgical-readmission rates and quality of hospital care. N. Engl. J. Med. 369(12), 1134–1142 (2013).
10.
Butler RJ, Davis TK, Johnson WG, Gardner HH. Effects of nonadherence with prescription drugs among older adults. Am. J. Manag. Care 17(2), 153–160 (2011).
11.
Schneeweiss S, Avorn J. A review of uses of health care utilization databases for epidemiologic research on therapeutics. J. Clin. Epidemiol. 58(4), 323–337 (2005).
12.
Chan DC, Shrank WH, Cutler D et al. Patient, physician, and payment predictors of statin adherence. Med. Care 48(3), 196–202 (2010).
13.
Curkendall SM, Thomas N, Bell KF, Juneau PL, Weiss AJ. Predictors of medication adherence in patients with Type 2 Diabetes mellitus. Curr. Med. Res. Opin. 29(10), 1275–1286 (2013).
14.
Lewey J, Shrank WH, Bowry AD, Kilabuk E, Brennan TA, Choudhry NK. Gender and racial disparities in adherence to statin therapy: a meta-analysis. Am. Heart J. 165(5), 665–678; 678e661 (2013).
15.
Bokhour BG, Berlowitz DR, Long JA, Kressin NR. How do providers assess antihypertensive medication adherence in medical encounters? J. Gen. Intern. Med. 21(6), 577–583 (2006).
16.
Coleman EA, Smith JD, Raha D, Min SJ. Posthospital medication discrepancies: prevalence and contributing factors. Arch. Intern. Med. 165(16), 1842–1847 (2005).
17.
Jackevicius CA, Li P, Tu JV. Prevalence, predictors, and outcomes of primary nonadherence after acute myocardial infarction. Circulation 117(8), 1028–1036 (2008).
18.
Svensson S, Kjellgren KI, Ahlner J, Saljo R. Reasons for adherence with antihypertensive medication. Int. J. Cardiol. 76(2–3), 157–163 (2000).
19.
Cannon CP, Braunwald E, McCabe CH et al. Intensive versus moderate lipid lowering with statins after acute coronary syndromes. N. Engl. J. Med. 350(15), 1495–1504 (2004).
20.
de Lemos JA, Blazing MA, Wiviott SD et al. Early intensive vs a delayed conservative simvastatin strategy in patients with acute coronary syndromes: Phase Z of the A to Z trial. JAMA 292(11), 1307–1316 (2004).
21.
Larosa JC, Grundy SM, Waters DD et al. Intensive lipid lowering with atorvastatin in patients with stable coronary disease. N. Engl. J. Med. 352(14), 1425–1435 (2005).
22.
Pedersen TR, Faergeman O, Kastelein JJ et al. High-dose atorvastatin vs usual-dose simvastatin for secondary prevention after myocardial infarction: the IDEAL study: a randomized controlled trial. JAMA 294(19), 2437–2445 (2005).
23.
Vrijens B, De Geest S, Hughes DA et al. A new taxonomy for describing and defining adherence to medications. Br. J. Clin. Pharmacol. 73(5), 691–705 (2012).
24.
25.
Quality Measures, Reporting and Performance Standards. www.cms.gov/Medicare/Medicare-Fee-for-Service-Payment/sharedsavingsprogram/Quality-Measures-Standards.html.
26.
Karve S, Cleves MA, Helm M, Hudson TJ, West DS, Martin BC. An empirical basis for standardizing adherence measures derived from administrative claims data among diabetic patients. Med. Care 46(11), 1125–1133 (2008).
27.
Gelman A. Data Analysis Using Regression and Multilevel/Hierarchical Models. Cambridge University Press, NY, USA (2007).
28.
Brookhart MA, Solomon DH, Wang P, Glynn RJ, Avorn J, Schneeweiss S. Explained variation in a model of therapeutic decision making is partitioned across patient, physician, and clinic factors. J. Clin. Epidemiol. 59(1), 18–25 (2006).
29.
Steyerberg EW, Harrell FE Jr, Borsboom GJ, Eijkemans MJ, Vergouwe Y, Habbema JD. Internal validation of predictive models: efficiency of some procedures for logistic regression analysis. J. Clin. Epidemiol. 54(8), 774–781 (2001).
30.
Steiner JF, Koepsell TD, Fihn SD, Inui TS. A general method of compliance assessment using centralized pharmacy records. Description and validation. Med. Care 26(8), 814–823 (1988).
31.
Steiner JF, Prochazka AV. The assessment of refill compliance using pharmacy records: methods, validity, and applications. J. Clin. Epidemiol. 50(1), 105–116 (1997).
32.
Ho PM, Bryson CL, Rumsfeld JS. Medication adherence: its importance in cardiovascular outcomes. Circulation 119(23), 3028–3035 (2009).
Information & Authors
Information
Published In
Copyright
© 2017 Future Medicine Ltd.
History
Received: 16 December 2016
Accepted: 19 June 2017
Published online: 17 October 2017
Keywords:
Topics
Authors
Metrics & Citations
Metrics
Article Usage
Article usage data only available from February 2023. Historical article usage data, showing the number of article downloads, is available upon request.
Citations
How to Cite
Variation in adherence to medications across the healthcare system in two comparative effectiveness research cohorts. (2017) Journal of Comparative Effectiveness Research. DOI: 10.2217/cer-2016-0095
Export citation
Select the citation format you wish to export for this article or chapter.