Clinical outcomes of pressure-enabled drug delivery for trans-arterial chemoembolization and radioembolization
Publication: Journal of Comparative Effectiveness Research
Abstract
Aim: Prior research observed that pressure-enabled drug delivery (PEDD) counteracts intra-tumoral pressure during trans-arterial chemoembolization (TACE) and radioembolization (TARE), improving drug penetration, yet real-world evidence remains limited. This study examined outcomes associated with PEDD use, including in high-adopter facilities, and assessed potential cost avoidance associated with PEDD. Materials & methods: We used the Clarivate Real World Data repository to identify adults with hepatocellular carcinoma or secondary liver metastases who received TACE or TARE procedures (January 2020–March 2024). We compared baseline characteristics between PEDD and non-PEDD cohorts, then used a two-stage matching approach to develop a matched sample for comparative analyses. Facilities in the top fifth percentile of PEDD volume were examined separately. Results: In total, 603 PEDD and 16,210 non-PEDD patients were identified. PEDD patients had higher baseline disease burden on average. In matched analyses, PEDD was associated with reduced rates of fatigue overall (20.9% vs 26.4%, p < 0.05) and 30-day inpatient visits among patients receiving TACE procedures (8.0% vs 20.5%, p < 0.05). In high-adopter facilities, PEDD use was associated with reduced lymphopenia among all patients (0.6% vs 5.2%, p < 0.05) and reduced fatigue (19.2% vs 39.7%, p < 0.05) and lymphopenia (0.0% vs 8.2%, p < 0.05) among patients with secondary liver metastases. PEDD use was linked to a per-patient charge avoidance of $7734 through fewer complications ($4599) and inpatient stays ($3135). Conclusion: Despite greater patient comorbidity, PEDD use was associated with fewer post-procedure complications and lower healthcare resource utilization. Greater institutional experience may enhance patient outcomes. Reduced complications and hospitalizations can translate into cost avoidance, reinforcing the value of PEDD technology in clinical practice.
Plain language summary
What is this article about?
This study assessed a treatment method called pressure-enabled drug delivery (PEDD), which is used with procedures that deliver chemotherapy (trans-arterial chemoembolization, or TACE) or radiation (trans-arterial radioembolization, or TARE). The goal was to evaluate whether PEDD improves patient outcomes compared with standard methods and whether hospitals with more experience using PEDD achieve better results. The study also examined whether PEDD use can reduce costs by lowering the need for extra treatment after procedures.
What were the results?
The study included 603 people treated with PEDD and 16,210 treated without it. People who received PEDD generally were sicker at the start. PEDD patients had lower rates of fatigue and fewer hospital stays within 30 days after chemotherapy-based procedures. At hospitals that used PEDD more frequently, patients also had fewer blood-related problems and, for those with secondary liver metastases, lower rates of fatigue and lymphopenia. PEDD use was linked to avoided medical charges of $3135 from fewer hospital stays and $4599 from fewer complications per patient.
What do the results mean?
These findings suggest that PEDD can help patients recover with fewer side effects and hospital visits, even for those who are sicker at the start of treatment. Hospitals with more experience using PEDD may see the greatest benefits. Because PEDD reduces complications and hospital stays, it can also lower medical costs, supporting its value in clinical practice.
Radiation therapy and chemotherapy play a key role in the management of liver tumors, both as a primary treatment and in combination with locoregional therapies [1]. Trans-arterial chemoembolization (TACE) and trans-arterial radioembolization (TARE) are widely used for delivering high-dose chemotherapy or radiopharmaceuticals directly to tumors, often complementing other strategies [2]. However, embolization efficacy is limited by high intra-tumoral pressure, which can restrict drug penetration and reduce therapeutic effect, requiring higher doses that may lead to adverse events [3–5]. Pressure-enabled drug delivery (PEDD) is an approach designed to enhance drug uptake by modulating intra-arterial pressure and flow dynamics [2,6,7].
Understanding how PEDD performs compared with conventional embolization (non-PEDD) in real-world settings is important for optimizing therapy choices and improving treatment outcomes. This is particularly relevant given the substantial burden of liver malignancies and the central role of embolization-based therapies such as TACE and TARE in their management. An estimated 2.1% of new US cancer cases are liver and intrahepatic bile duct cancers, including 41,630 new cases in 2024 [8,9]. Hepatocellular carcinoma (HCC) is the most common form of primary liver cancer and the liver is also one of the most common locations of metastases from other cancers (e.g., colorectal cancer and renal cell carcinoma). Many patients with liver malignancies are not candidates for curative therapies such as resection or transplantation and instead rely on locoregional treatments, including TACE and TARE, underscoring the importance of optimizing these procedures in clinical practice [1].
Because these procedures can be associated with post-procedure complications and healthcare resource utilization (HRU), improvements in treatment delivery may have meaningful implications for patient outcomes and resource use. A prior study found that despite PEDD patients presenting greater baseline disease burden and clinical complexity, post-procedure HRU and complication rates were comparable to those observed in non-PEDD patients [10]. These findings suggest that PEDD may offer a viable treatment option for more complex cases. However, the prior analysis was constrained by sample size, limiting the ability to conduct robust subgroup assessments and cost evaluations using the latest data.
This study aimed to evaluate the real-world clinical impact of PEDD compared with non-PEDD methods using a larger, comprehensive, and up-to-date dataset. Specifically, we sought to characterize baseline demographic and clinical characteristics of patients undergoing PEDD versus non-PEDD embolization, compare post-procedure clinical outcomes after adjusting for differences in baseline characteristics, assess potential cost avoidance associated with PEDD, and examine whether outcomes differ by facility-level adoption of PEDD procedures, hypothesizing that deeper institutional experience with PEDD may be associated with improved clinical outcomes.
Materials & methods
Data source
This study utilized Clarivate’s Real World Data Repository to construct a study cohort using data available from 1 January 2020 to 31 March 2024. The Clarivate Real World Data Repository database is comprised of open-source claims data including longitudinal information on more than 300 million covered lives from all states in the US. The Clarivate dataset consists of extensive medical and pharmaceutical claims, as well as patient, payer and provider-related information. The inclusion of these varied types of data allowed for a comprehensive examination of patient-level treatment and broad interactions with the healthcare system.
Data were de-identified and complied with the Health Insurance Portability and Accountability Act (HIPAA) requirements. Institutional Review Board (IRB) approval was not required as the study was a retrospective analysis of anonymized health insurance claims.
Study design
This study employed a retrospective, longitudinal cohort design to evaluate patient characteristics and clinical outcomes among patients undergoing embolization procedures with and without the PEDD device. A comprehensive list of diagnosis, treatment and procedure codes used for cohort identification and the assessment of study variables is provided in Supplementary Table A1.
Patients were classified into two distinct cohorts: those who ever received embolization using the PEDD device (PEDD cohort) and those who underwent embolization without the PEDD device (non-PEDD cohort). The PEDD cohort consisted of patients with at least one medical claim indicating the use of the PEDD device (i.e., including Healthcare Common Procedure Coding System [HCPCS] code C1982). To ensure clinical relevance, included patients were required to have evidence of at least one claim with a documented diagnosis of primary HCC or secondary liver metastases. Eligible patients’ PEDD claims were required to be within 5 days of at least one embolization claim and a claim for locally infused chemotherapy (PEDD-TACE) or radiopharmaceutical therapy (PEDD-TARE). The date of the first such PEDD claim was assigned as the index date for PEDD patients. Patients were required to have at least one claim within 3 months before and after the index date.
The non-PEDD cohort comprised patients who underwent embolization procedures without the use of the PEDD device. Patients were included if they had at least one medical claim for embolization with a corresponding claim for either locally infused chemotherapy or radiopharmaceutical therapy within 10 days (defined as non-PEDD-TACE or non-PEDD-TARE, respectively). Additionally, these patients were required to have evidence of at least one claim with a documented diagnosis of primary HCC or secondary liver metastases. The index date for non-PEDD patients was assigned as the first occurrence of such embolization procedure. Similar to the PEDD cohort, patients included were required to have at least one claim within 3 months before and after the index date. The index procedure had to occur between 1 January 2020 and 31 March 2024 for both cohorts. The analysis was conducted at the patient level using a single qualifying index episode per patient. For patients with more than one qualifying procedure, the first qualifying episode during the study period was used to define cohort assignment and index date.
Both cohort definitions allow a comparable maximum interval between embolization and the associated treatment (i.e., chemotherapy or radiopharmaceutical therapy), despite the different anchoring claims. In the PEDD cohort, the episode was anchored on the PEDD-specific HCPCS claim (C1982). Because the embolization procedure and the associated treatment may be billed separately, each component was required to occur within 5 days of the PEDD claim. This allows embolization and treatment to occur on opposite sides of the PEDD claim, resulting in a maximum interval of up to 10 days between the two components. In the non-PEDD cohort, the episode was anchored on the embolization procedure, with the associated treatment required within 10 days.
Baseline characteristics
To assess the comparability between the PEDD and non-PEDD cohorts, baseline characteristics including patient demographic characteristics at index and clinical characteristics during the pre-index period were described. Demographic characteristics included age, sex, geographic region and the calendar year of the index date. Comorbidity burden was measured by the Charlson Comorbidity Index (CCI), which captures the presence of chronic and other conditions that may impact patient outcomes. Baseline clinical complications, such as ascites, fatigue, liver function test (LFT) abnormalities and portal hypertension, were assessed. Additionally, we evaluated HRU within 3 months before index, including the number of inpatient (IP) days, hospital outpatient (OP) visits and emergency room (ER) visits. We also examined use of systemic cancer therapy before index, such as the use of chemotherapy, immunotherapy and targeted therapies. These baseline characteristics were compared between the PEDD and non-PEDD cohorts to evaluate potential differences in patient distribution.
Outcomes
Multiple clinical outcomes were assessed to compare post-procedural clinical disposition between the PEDD and non-PEDD cohorts and to evaluate potential impact of PEDD use. The key outcomes included any hospital IP visits within 30 days post-index, indicating the burden of post-procedure complications requiring hospitalization. ER visits within 7 days post-index were assessed as an indicator of acute post-procedural events. In addition, we evaluated the rates of clinical complications at any time post-index, including ascites, fatigue, gastritis, LFT abnormalities and portal hypertension, which can be associated with lack of disease control or treatment-related adverse events. We also described the use of paracentesis post-index to examine fluid accumulation requiring interventional management. Any systemic therapy use after at least 3 months post-index was included in the analysis to evaluate subsequent lines of treatment postembolization. The assessment of these outcomes provides insights into the treatment effect and potential clinical benefits associated with PEDD use.
Statistical analysis
Mutually exclusive groups of patients were created based on disease type (HCC vs secondary liver metastases) and embolization type (TACE vs TARE) to conduct all analyses. Descriptive analyses were performed to assess baseline differences between the PEDD and non-PEDD cohorts and matching-adjusted comparative analyses were used to evaluate post-procedure clinical and economic outcomes. All analyses were conducted using the statistical software R version 4.2.1.
Baseline clinical profile comparison
Baseline demographic and clinical characteristics were analyzed for the overall sample and for subgroup populations stratified by disease type (HCC vs secondary liver metastases) and embolization type (TACE vs TARE).
To summarize baseline characteristics, categorical variables were reported as frequencies and percentages, while continuous variables were summarized using means, medians and standard deviations (SDs). Standardized mean differences (SMDs) were computed for all variables to assess balance between the PEDD and non-PEDD cohorts, with an SMD threshold of 0.1 used to indicate significant differences between groups.
Comparative analysis of outcomes
To ensure comparability between PEDD and non-PEDD cohorts, a two-stage matching approach was used within subgroup samples stratified by disease type and embolization type to adjust for patient baseline differences and construct comparable groups of PEDD and non-PEDD patients. The first stage was coarsened exact matching, where patients were matched exactly on the quarter and year of index date, specifically, quarter one and quarter two of 2020, to account for effects of the COVID-19 pandemic. In the second stage, propensity score matching was conducted to estimate the probability of PEDD use based on patient characteristics (age at index, number of hospital IP days, number of hospital OP visits, number of ER visits, any use of systemic therapy, any clinical complication, and CCI score) at baseline using a logistic regression model. One-to-one nearest-neighbor matching was performed using the computed propensity scores.
After matching, baseline statistics were re-evaluated among the matched sample to assess the balance between the PEDD and non-PEDD cohorts. This included reassessment of balance on embolization type within the matched sample. Further, clinical outcomes were summarized, and descriptive statistics compared. T-tests were used for continuous variables, while chi-square tests were applied for categorical outcomes. Separately, we compared the number of procedure units of doxorubicin use within the matched PEDD and non-PEDD cohorts of patients receiving TACE procedures. Because matching was conducted within subgroup samples stratified by disease type and embolization type, balance on embolization type was preserved in the matched sample.
Comparative analysis of patient outcomes in high-adopter facilities
To assess the role of facility experience, we defined high-adopter facilities based on PEDD procedure volume. Facility-level PEDD volume was calculated as the total number of PEDD procedures performed at each facility during the study period. Facilities in the top fifth percentile among those performing at least one PEDD procedure were classified as high-adopters, corresponding to seven facilities among 137 total facilities. Baseline demographic and clinical characteristics were compared between the PEDD and non-PEDD cohorts within high-adopter facilities to evaluate patient profiles in those facilities. Similar comparative analyses of post-procedure outcomes were conducted among a matching-adjusted sample of PEDD and non-PEDD patients using the same two-stage matching approach as discussed above.
Cost avoidance associated with PEDD use
Because charges accrue with each occurrence of an event, we used an event-based approach to estimate the cost impact of PEDD use, capturing differences in the frequency of utilization and complications (and corresponding difference in charges) rather than whether an event occurred at least once. We calculated per-patient (pp) charge avoidance for each clinical outcome as the difference in the average number of events pp between PEDD and non-PEDD cohorts multiplied by the unit charge associated with the event. Unit charges were defined as the average billed charges across all claims associated with the event among PEDD patients. Because PEDD procedures are typically performed in facilities that also deliver non-PEDD embolization, these charges serve as a reasonable proxy for the care settings represented in both cohorts. Applying a common set of unit charges across cohorts ensures that estimated charge avoidance reflects differences in event frequency rather than differences in charges across providers or care settings. The pp total cost avoidance associated with PEDD use was evaluated separately for each clinical outcome. Total charge avoidance associated with clinical complications was calculated by summing per-patient charge avoidance estimates across all individual complication categories. Costs were adjusted to 2023 US dollars using the medical care component of the Consumer Price Index [11].
Results
Baseline clinical profile comparison between PEDD & non-PEDD cohorts
Figure 1 displays a flowchart of sample generation. Overall, the study identified 603 PEDD patients and 16,210 non-PEDD patients. Among them, 515 (85.4%) of PEDD patients and 10,825 (66.8%) of non-PEDD patients received TARE treatment. Baseline descriptive statistics indicated more common use of TACE or TARE procedures among male than female patients for both PEDD and non-PEDD cohorts (65.5% vs 34.5% for PEDD cohort; 67.1% vs 32.9% for non-PEDD cohort) (Table 1). Patients undergoing TACE or TARE were located across all US regions, with the South contributing the most cases, and PEDD more heavily weighted to the South than non-PEDD (52.6% of all PEDD patients were from the South vs 36.8% of all non-PEDD patients). Average age at index was similar between cohorts (PEDD: 68.5 years old vs non-PEDD: 67.8 years old).
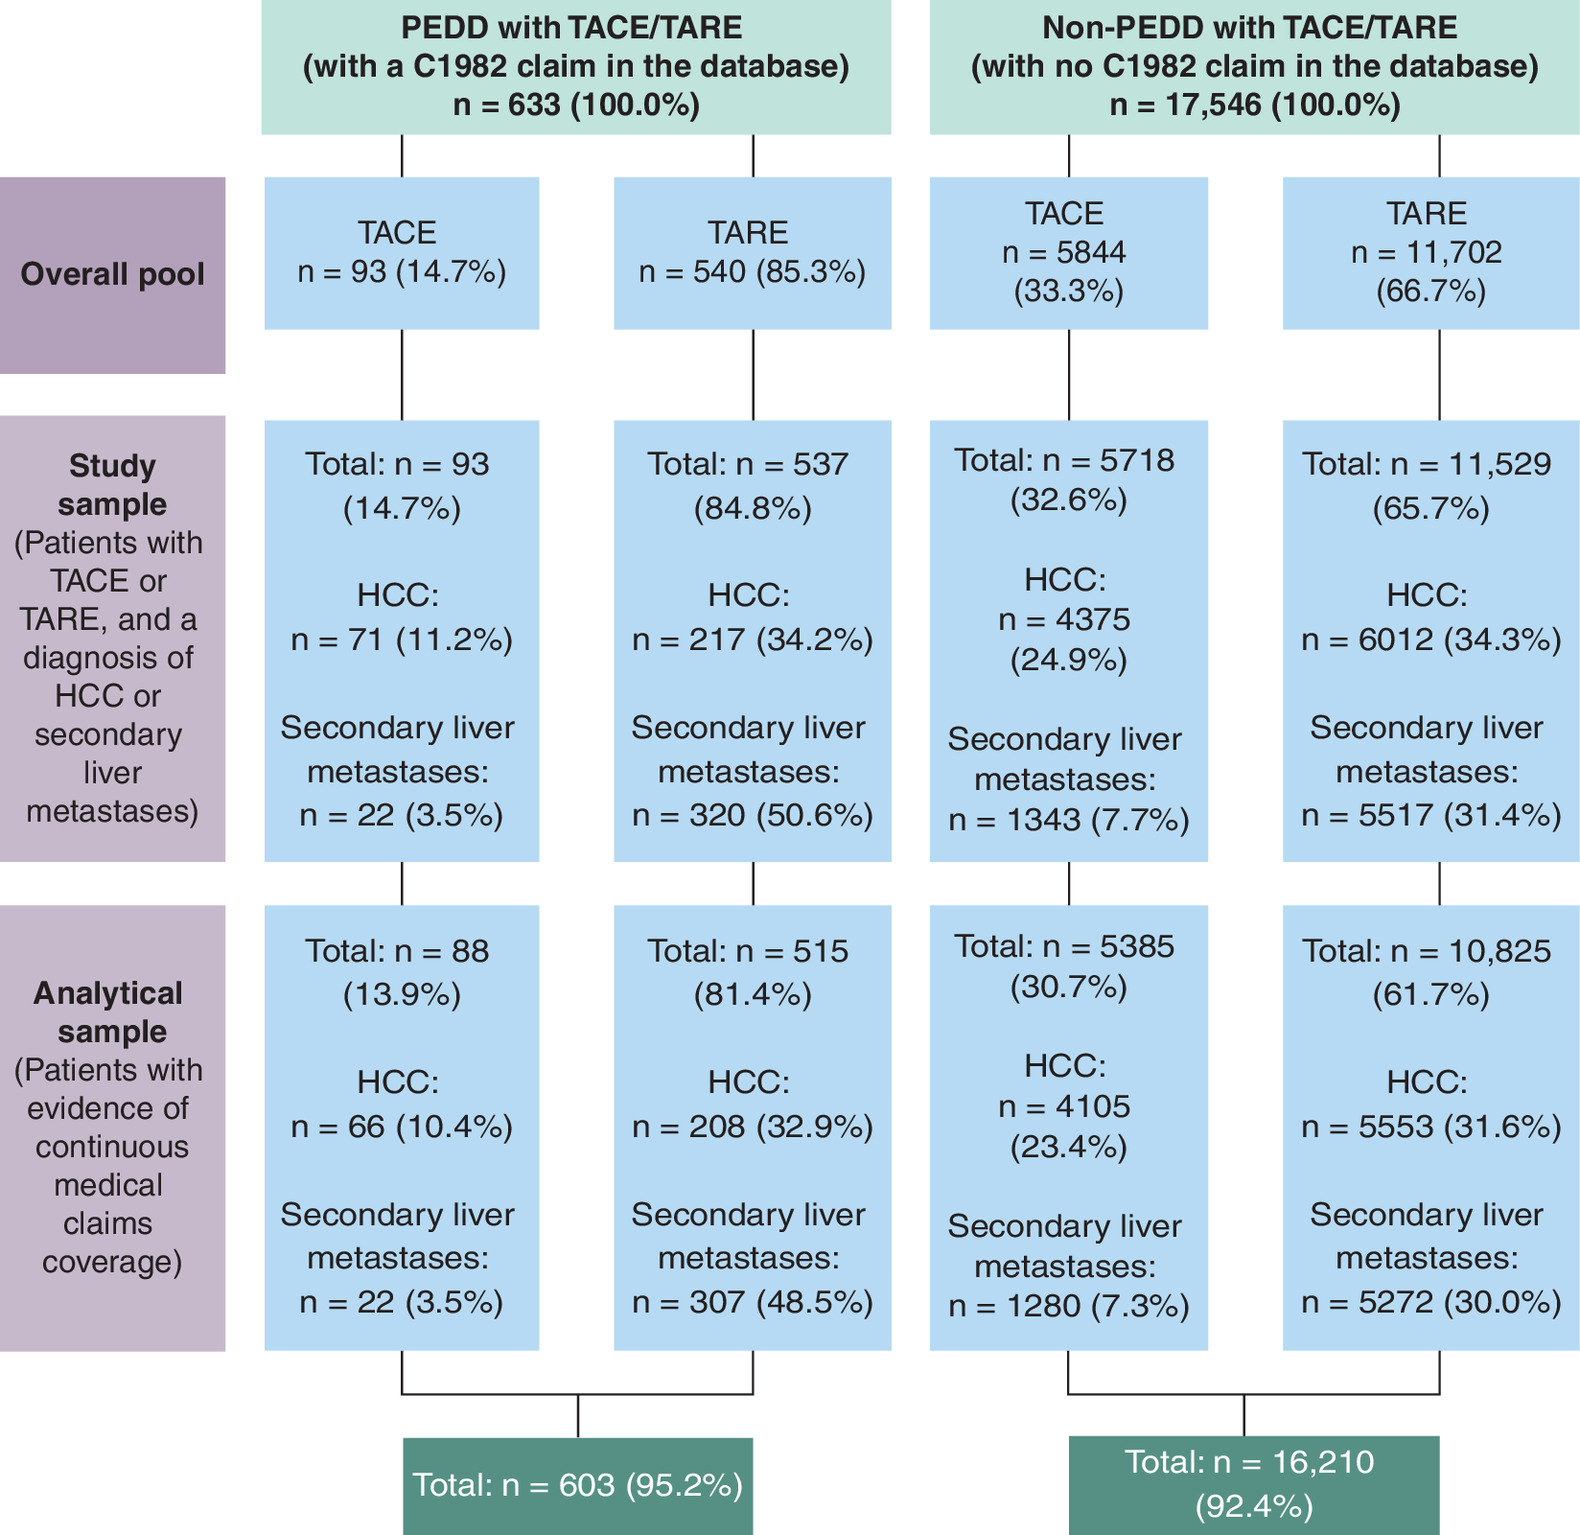
Figure 1. Sample selection flowchart.
Patients with diagnoses for both HCC and secondary liver metastases were classified as having liver metastases. Patients in the PEDD group were required to have evidence of a C1982 claim in the database. Patients were assigned to the TACE group if they had evidence of locally infused chemotherapy and embolization within 10 days (at most) of each other, and each within 5 days (at most) of a C1982 procedure. Patients were assigned to the TARE group if they had evidence of radiotherapy and embolization within 10 days (at most) of each other, and each within 5 days (at most) of a C1982 procedure. Patients in the non-PEDD group were required to have no evidence of a C1982 claim in the database. Patients were assigned to the TACE group if they had evidence of locally infused chemotherapy and embolization within 10 days (at most) of each other. Patients were assigned to the TARE group if they had evidence of radiotherapy and embolization within 10 days (at most) of each other. 243 non-PEDD patients that satisfied both the TACE and TARE definitions within the required time duration were assigned to the TARE group. Patients are included in the analytical sample if they had at least one claim within 3 months pre-index and one claim within 3 months post-index.
HCC: Hepatocellular carcinoma; PEDD: Pressure-enabled drug delivery; TACE: Trans-arterial chemoembolization; TARE: Trans-arterial radioembolization.
| Group | SMD | ||
|---|---|---|---|
| PEDD (n = 603) | Non-PEDD (n = 16,210) | ||
| Population | |||
| Embolization, n (%) | 0.448 | ||
| TACE | 88 (14.6%) | 5385 (33.2%) | |
| TARE | 515 (85.4%) | 10,825 (66.8%) | |
| Diagnosis, n (%) | 0.286 | ||
| Patients with HCC | 274 (45.4%) | 9658 (59.6%) | |
| Patients with secondary liver metastases | 329 (54.6%) | 6552 (40.4%) | |
| Demographics | |||
| Sex, n (%) | 0.035 | ||
| Female | 208 (34.5%) | 5326 (32.9%) | |
| Male | 395 (65.5%) | 10,884 (67.1%) | |
| Age at index (years), mean ± SD | 68.47 ± 10.60 | 67.78 ± 10.38 | 0.066 |
| Geographic region, n (%) | 0.371 | ||
| Northeast | 95 (15.8%) | 2671 (16.5%) | |
| Midwest | 97 (16.1%) | 3034 (18.7%) | |
| South | 317 (52.6%) | 5970 (36.8%) | |
| West | 85 (14.1%) | 4244 (26.2%) | |
| Other/unknown | 9 (1.5%) | 291 (1.8%) | |
| Year of index date, n (%) | 0.514 | ||
| 2020 | 66 (11.0%) | 4549 (28.1%) | |
| 2021 | 123 (20.4%) | 3948 (24.4%) | |
| 2022 | 165 (27.4%) | 3694 (22.8%) | |
| 2023 | 221 (36.7%) | 3550 (21.9%) | |
| 2024 | 28 (4.6%) | 469 (2.9%) | |
| Charlson comorbidity index (CCI) | |||
| Mean ± SD | 7.09 ± 2.30 | 6.42 ± 2.35 | 0.287 |
| Healthcare resource utilization (during 3 months pre-index) | |||
| Hospital IP days, mean ± SD | 0.22 ± 0.71 | 0.21 ± 0.66 | 0.017 |
| Hospital OP visits, mean ± SD | 6.46 ± 5.63 | 5.03 ± 4.71 | 0.275 |
| ER visits, mean ± SD | 0.30 ± 0.97 | 0.26 ± 0.74 | 0.043 |
| Clinical complications (during 3 months pre-index) | |||
| Any clinical complication, n (%) | 202 (33.5%) | 5405 (33.3%) | 0.003 |
| Ascites, n (%) | 53 (8.8%) | 1809 (11.2%) | 0.079 |
| Cholecystitis, n (%) | 4 (0.7%) | 69 (0.4%) | 0.032 |
| Fatigue, n (%) | 53 (8.8%) | 967 (6.0%) | 0.108 |
| Gastric ulcer, n (%) | 6 (1.0%) | 147 (0.9%) | 0.009 |
| Gastritis, n (%) | 18 (3.0%) | 426 (2.6%) | 0.022 |
| Jaundice, n (%) | 6 (1.0%) | 112 (0.7%) | 0.033 |
| LFT increase, n (%) | 42 (7.0%) | 1056 (6.5%) | 0.018 |
| Lymphopenia, n (%) | 1 (0.2%) | 22 (0.1%) | 0.008 |
| Portal hypertension, n (%) | 88 (14.6%) | 2762 (17.0%) | 0.067 |
| Post embolization syndrome, n (%) | 0 (0.0%) | 4 (0.0%) | 0.022 |
| Systemic therapy use (pre-index) | |||
| Any use of systemic therapy, n (%) | 148 (24.5%) | 2601 (16.1%) | 0.212 |
| Chemotherapy, n (%) | 98 (16.3%) | 1633 (10.1%) | 0.184 |
| TKI, n (%) | 6 (1.0%) | 223 (1.4%) | 0.035 |
| Anti-VEGF, n (%) | 2 (0.3%) | 36 (0.2%) | 0.021 |
| Atezolizumab + bevacizumab, n (%) | 13 (2.2%) | 207 (1.3%) | 0.068 |
| Atezolizumab, n (%) | 18 (3.0%) | 253 (1.6%) | 0.096 |
| Bevacizumab, n (%) | 77 (12.8%) | 963 (5.9%) | 0.236 |
| Immunotherapy, n (%) | 9 (1.5%) | 320 (2.0%) | 0.037 |
| Anti-HER2, n (%) | 3 (0.5%) | 44 (0.3%) | 0.037 |
Systemic therapy types were identified as follows:
Chemotherapy: capecitabine; irinotecan; leucovorin, fluorouracil and irinotecan (observed on the same day); or leucovorin, fluorouracil and oxaliplatin (observed on the same day). TKI: cabozantinib, lenvatinib, regorafenib or sorafenib. Anti-VEGF: ramucirumab. Immunotherapy: pembrolizumab; durvalumab and tremelimumab (observed on the same day); or nivolumab and ipilimumab (observed on the same day). Anti-HER2: trastuzumab.
Anti-HER2: Antihuman epidermal growth factor receptor 2; Anti-VEGF: Antivascular endothelial growth factor; ER: Emergency room; HCC: Hepatocellular carcinoma; IP: Inpatient; LFT: Liver function test; OP: Outpatient; PEDD: Pressure-enabled drug delivery; SD: Standard deviation; SMD: Standardized mean difference; TACE: Trans-arterial chemoembolization; TARE: Trans-arterial radioembolization; TKI: Tyrosine kinase inhibitor.
Patients with PEDD had a higher baseline disease burden than non-PEDD patients, on average having a significantly higher mean CCI (7.1 vs 6.4, SMD = 0.29) and more prevalent baseline complications, including fatigue (8.8% vs 6.0%, SMD = 0.11). They also had higher HRU rates, reflected by more hospital OP visits in the 3 months pre-index (6.46 vs 5.03, SMD = 0.28), and higher rates of pre-index systemic therapy use (24.5% vs 16.1%, SMD = 0.21). These patterns held across subgroups by disease type (HCC vs secondary liver metastases) and embolization type (TACE vs TARE).
Comparative analysis of outcomes
The two-stage matching approach generated a well-balanced matched sample, with SMDs below 0.1 across all key demographic and clinical characteristics (Supplementary Table A2). The comparative analyses of post-procedure outcomes were conducted using the matching-adjusted sample of 603 pairs of matched PEDD and non-PEDD patients, with results presented in Tables 2 & 3. The average follow-up duration was similar between cohorts, 11.96 months for PEDD patients and 12.97 months for non-PEDD patients. PEDD patients experienced significantly lower rates of fatigue any time post-index compared with non-PEDD patients in the overall sample (20.9% vs 26.4% in non-PEDD patients, p < 0.05) and in the subgroup of patients receiving TARE treatment (20.4% vs 27.4%, p < 0.05). Additionally, among patients treated with TACE, PEDD use was associated with significantly lower rates of IP visits within 30 days post-index (8.0% vs 20.5%, p < 0.05). Although not statistically significant, lower rates of clinical complications (overall) post-index were also observed among PEDD patients in the TARE subgroup (59.2% vs 64.9%, p = 0.07). Similarly, among patients with HCC, PEDD use was associated with reduced rates of gastric ulcer (1.8% vs 4.7%, p = 0.09) and jaundice (3.7% vs 7.3%, p = 0.09), although these associations were not statistically significant. TACE patients receiving PEDD had significantly higher procedure units of doxorubicin compared with non-PEDD TACE patients (mean procedure units within a 1-day window of index: 13.9 vs 9.4, p < 0.01) (Supplementary Table A3).
| Group | p-value | ||
|---|---|---|---|
| PEDD (n = 603) | Non-PEDD (n = 603) | ||
| Healthcare resource utilization | |||
| Any hospital IP visits during 30 days post-index, n (%) | 45 (7.5%) | 53 (8.8%) | 0.46 |
| Any ER visits during 7 days post-index, n (%) | 21 (3.5%) | 17 (2.8%) | 0.62 |
| Clinical complications (post-index) | |||
| Any clinical complication, n (%) | 372 (61.7%) | 399 (66.2%) | 0.12 |
| Ascites, n (%) | 225 (37.3%) | 244 (40.5%) | 0.29 |
| Cholecystitis, n (%) | 9 (1.5%) | 7 (1.2%) | 0.8 |
| Fatigue, n (%) | 126 (20.9%) | 159 (26.4%) | <0.05* |
| Gastric ulcer, n (%) | 19 (3.2%) | 19 (3.2%) | >0.99 |
| Gastritis, n (%) | 38 (6.3%) | 43 (7.1%) | 0.65 |
| Jaundice, n (%) | 41 (6.8%) | 48 (8.0%) | 0.51 |
| LFT increase, n (%) | 131 (21.7%) | 127 (21.1%) | 0.83 |
| Lymphopenia, n (%) | 5 (0.8%) | 6 (1.0%) | >0.99 |
| Portal hypertension, n (%) | 151 (25.0%) | 168 (27.9%) | 0.3 |
| Post embolization syndrome, n (%) | 0 (0.0%) | 0 (0.0%) | – |
| Paracentesis | |||
| Any paracentesis post-index, n (%) | 100 (16.6%) | 109 (18.1%) | 0.54 |
| Systemic therapy use (after at least 3 months post-index) | |||
| Any use of systemic therapy, n (%) | 115 (19.1%) | 130 (21.6%) | 0.32 |
| Chemotherapy, n (%) | 50 (8.3%) | 54 (9.0%) | 0.76 |
| TKI, n (%) | 11 (1.8%) | 16 (2.7%) | 0.44 |
| Anti-VEGF, n (%) | 2 (0.3%) | 0 (0.0%) | 0.5 |
| Atezolizumab + bevacizumab, n (%) | 30 (5.0%) | 31 (5.1%) | >0.99 |
| Atezolizumab, n (%) | 20 (3.3%) | 16 (2.7%) | 0.61 |
| Bevacizumab, n (%) | 35 (5.8%) | 39 (6.5%) | 0.72 |
| Immunotherapy, n (%) | 10 (1.7%) | 16 (2.7%) | 0.32 |
| Anti-HER2, n (%) | 1 (0.2%) | 3 (0.5%) | 0.62 |
Systemic therapy types were identified as follows:
Chemotherapy: capecitabine; irinotecan; leucovorin, fluorouracil and irinotecan (observed on the same day); or leucovorin, fluorouracil and oxaliplatin (observed on the same day). TKI: cabozantinib, lenvatinib, regorafenib or sorafenib. Anti-VEGF: ramucirumab; Immunotherapy: pembrolizumab; durvalumab and tremelimumab (observed on the same day); or nivolumab and ipilimumab (observed on the same day). Anti-HER2: trastuzumab.
Anti-HER2: Antihuman epidermal growth factor receptor 2; Anti-VEGF: Antivascular endothelial growth factor; ER: Emergency room; IP: Inpatient; LFT: Liver function test; PEDD: Pressure-enabled drug delivery; TACE: Trans-arterial chemoembolization; TARE: Trans-arterial radioembolization; TKI: Tyrosine kinase inhibitor.
| TACE | TARE | HCC | Secondary liver metastases | |||||||||
|---|---|---|---|---|---|---|---|---|---|---|---|---|
| PEDD (n = 88) | Non-PEDD (n = 88) | p-value | PEDD (n = 515) | Non-PEDD (n = 515) | p-value | PEDD (n = 274) | Non-PEDD (n = 274) | p-value | PEDD (n = 329) | Non-PEDD (n = 329) | p-value | |
| Healthcare resource utilization | ||||||||||||
| Any hospital IP visits during 30 days post-index, n (%) | 7 (8.0%) | 18 (20.5%) | <0.05* | 38 (7.4%) | 35 (6.8%) | 0.81 | 20 (7.3%) | 23 (8.4%) | 0.75 | 25 (7.6%) | 30 (9.1%) | 0.57 |
| Any ER visits during 7 days post-index, n (%) | 7 (8.0%) | 7 (8.0%) | >0.99 | 14 (2.7%) | 10 (1.9%) | 0.54 | 9 (3.3%) | 11 (4.0%) | 0.82 | 12 (3.7%) | 6 (1.8%) | 0.23 |
| Clinical complications (post-index) | ||||||||||||
| Any clinical complication, n (%) | 67 (76.1%) | 65 (73.9%) | 0.86 | 305 (59.2%) | 334 (64.9%) | 0.07 | 182 (66.4%) | 196 (71.5%) | 0.23 | 190 (57.8%) | 203 (61.7%) | 0.34 |
| Ascites, n (%) | 40 (45.5%) | 44 (50.0%) | 0.65 | 185 (35.9%) | 200 (38.8%) | 0.37 | 114 (41.6%) | 129 (47.1%) | 0.23 | 111 (33.7%) | 115 (35.0%) | 0.81 |
| Cholecystitis, n (%) | 0 (0.0%) | 1 (1.1%) | >0.99 | 9 (1.8%) | 6 (1.2%) | 0.6 | 2 (0.7%) | 3 (1.1%) | >0.99 | 7 (2.1%) | 4 (1.2%) | 0.55 |
| Fatigue, n (%) | 21 (23.9%) | 18 (20.5%) | 0.72 | 105 (20.4%) | 141 (27.4%) | <0.05* | 48 (17.5%) | 64 (23.4%) | 0.11 | 78 (23.7%) | 95 (28.9%) | 0.16 |
| Gastric ulcer, n (%) | 2 (2.3%) | 3 (3.4%) | >0.99 | 17 (3.3%) | 16 (3.1%) | >0.99 | 5 (1.8%) | 13 (4.7%) | 0.09 | 14 (4.3%) | 6 (1.8%) | 0.11 |
| Gastritis, n (%) | 4 (4.6%) | 9 (10.2%) | 0.25 | 34 (6.6%) | 34 (6.6%) | >0.99 | 21 (7.7%) | 28 (10.2%) | 0.37 | 17 (5.2%) | 15 (4.6%) | 0.86 |
| Jaundice, n (%) | 3 (3.4%) | 7 (8.0%) | 0.33 | 38 (7.4%) | 41 (8.0%) | 0.81 | 10 (3.7%) | 20 (7.3%) | 0.09 | 31 (9.4%) | 28 (8.5%) | 0.78 |
| LFT increase, n (%) | 23 (26.1%) | 24 (27.3%) | >0.99 | 108 (21.0%) | 103 (20.0%) | 0.76 | 58 (21.2%) | 49 (17.9%) | 0.39 | 73 (22.2%) | 78 (23.7%) | 0.71 |
| Lymphopenia, n (%) | 0 (0.0%) | 0 (0.0%) | – | 5 (1.0%) | 6 (1.2%) | >0.99 | 3 (1.1%) | 1 (0.4%) | 0.62 | 2 (0.6%) | 5 (1.5%) | 0.45 |
| Portal hypertension, n (%) | 41 (46.6%) | 38 (43.2%) | 0.76 | 110 (21.4%) | 130 (25.2%) | 0.16 | 120 (43.8%) | 133 (48.5%) | 0.3 | 31 (9.4%) | 35 (10.6%) | 0.7 |
| Post embolization syndrome, n (%) | 0 (0.0%) | 0 (0.0%) | – | 0 (0.0%) | 0 (0.0%) | – | 0 (0.0%) | 0 (0.0%) | – | 0 (0.0%) | 0 (0.0%) | – |
| Paracentesis | ||||||||||||
| Any paracentesis post-index, n (%) | 13 (14.8%) | 21 (23.9%) | 0.18 | 87 (16.9%) | 88 (17.1%) | >0.99 | 46 (16.8%) | 54 (19.7%) | 0.44 | 54 (16.4%) | 55 (16.7%) | >0.99 |
| Systemic therapy use (after at least 3 months post-index) | ||||||||||||
| Any use of systemic therapy, n (%) | 16 (18.2%) | 12 (13.6%) | 0.54 | 99 (19.2%) | 118 (22.9%) | 0.17 | 36 (13.1%) | 35 (12.8%) | >0.99 | 79 (24.0%) | 95 (28.9%) | 0.18 |
| Chemotherapy, n (%) | 3 (3.4%) | 1 (1.1%) | 0.62 | 47 (9.1%) | 53 (10.3%) | 0.6 | 2 (0.7%) | 2 (0.7%) | >0.99 | 48 (14.6%) | 52 (15.8%) | 0.74 |
| TKI, n (%) | 5 (5.7%) | 3 (3.4%) | 0.72 | 6 (1.2%) | 13 (2.5%) | 0.16 | 6 (2.2%) | 8 (2.9%) | 0.79 | 5 (1.5%) | 8 (2.4%) | 0.58 |
| Anti-VEGF, n (%) | 0 (0.0%) | 0 (0.0%) | – | 2 (0.4%) | 0 (0.0%) | 0.5 | 1 (0.4%) | 0 (0.0%) | >0.99 | 1 (0.3%) | 0 (0.0%) | >0.99 |
| Atezolizumab + bevacizumab, n (%) | 6 (6.8%) | 7 (8.0%) | >0.99 | 24 (4.7%) | 24 (4.7%) | >0.99 | 23 (8.4%) | 22 (8.0%) | >0.99 | 7 (2.1%) | 9 (2.7%) | 0.8 |
| Atezolizumab, n (%) | 4 (4.6%) | 1 (1.1%) | 0.37 | 16 (3.1%) | 15 (2.9%) | >0.99 | 14 (5.1%) | 10 (3.7%) | 0.53 | 6 (1.8%) | 6 (1.8%) | >0.99 |
| Bevacizumab, n (%) | 3 (3.4%) | 2 (2.3%) | >0.99 | 32 (6.2%) | 37 (7.2%) | 0.62 | 4 (1.5%) | 3 (1.1%) | >0.99 | 31 (9.4%) | 36 (10.9%) | 0.61 |
| Immunotherapy, n (%) | 0 (0.0%) | 1 (1.1%) | >0.99 | 10 (1.9%) | 15 (2.9%) | 0.42 | 1 (0.4%) | 3 (1.1%) | 0.62 | 9 (2.7%) | 13 (4.0%) | 0.52 |
| Anti-HER2, n (%) | 0 (0.0%) | 0 (0.0%) | – | 1 (0.2%) | 3 (0.6%) | 0.62 | 0 (0.0%) | 0 (0.0%) | – | 1 (0.3%) | 3 (0.9%) | 0.62 |
Systemic therapy types were identified as follows:
Chemotherapy: capecitabine; irinotecan; leucovorin, fluorouracil and irinotecan (observed on the same day); or leucovorin, fluorouracil and oxaliplatin (observed on the same day). TKI: cabozantinib, lenvatinib, regorafenib or sorafenib. Anti-VEGF: ramucirumab; Immunotherapy: pembrolizumab; durvalumab and tremelimumab (observed on the same day); or nivolumab and ipilimumab (observed on the same day). Anti-HER2: trastuzumab.
Anti-HER2: Antihuman epidermal growth factor receptor 2; Anti-VEGF: Antivascular endothelial growth factor; ER: Emergency room; HCC: Hepatocellular carcinoma; IP: Inpatient; LFT: Liver function test; PEDD: Pressure-enabled drug delivery; TACE: Trans-arterial chemoembolization; TARE: Trans-arterial radioembolization; TKI: Tyrosine kinase inhibitor.
Comparative analysis of patient outcomes in high-adopter facilities
Similar improvements in post-procedure clinical outcomes were observed in high-adopter facilities as in the overall sample (Table 4). Among all patients in high-adopter facilities, PEDD use was associated with significantly lower rates of lymphopenia post-index (0.6% vs 5.2% in non-PEDD patients, p < 0.05). Additionally, among patients with secondary liver metastases in these facilities, PEDD patients experienced significantly lower rates of fatigue (19.2% vs 39.7%, p < 0.05) and lymphopenia (0.0% vs 8.2%, p < 0.05) post-index.
| Overall | TACE | TARE | HCC | Secondary liver metastases | |||||||||||
|---|---|---|---|---|---|---|---|---|---|---|---|---|---|---|---|
| PEDD (n = 172) | Non-PEDD (n = 172) | p-value | PEDD (n = 37) | Non-PEDD (n = 37) | p-value | PEDD (n = 135) | Non-PEDD (n = 135) | p-value | PEDD (n = 99) | Non-PEDD (n = 99) | p-value | PEDD (n = 73) | Non-PEDD (n = 73) | p-value | |
| Healthcare resource utilization | |||||||||||||||
| Any hospital IP visits during 30 days post-index, n (%) | 10 (5.8%) | 13 (7.6%) | 0.67 | 4 (10.8%) | 4 (10.8%) | >0.99 | 6 (4.4%) | 9 (6.7%) | 0.6 | 7 (7.1%) | 7 (7.1%) | >0.99 | 3 (4.1%) | 6 (8.2%) | 0.49 |
| Any ER visits during 7 days post-index, n (%) | 6 (3.5%) | 4 (2.3%) | 0.75 | 2 (5.4%) | 2 (5.4%) | >0.99 | 4 (3.0%) | 2 (1.5%) | 0.68 | 2 (2.0%) | 2 (2.0%) | >0.99 | 4 (5.5%) | 2 (2.7%) | 0.68 |
| Clinical complications (post-index) | |||||||||||||||
| Any clinical complication, n (%) | 119 (69.2%) | 124 (72.1%) | 0.64 | 31 (83.8%) | 32 (86.5%) | >0.99 | 88 (65.2%) | 92 (68.2%) | 0.7 | 76 (76.8%) | 75 (75.8%) | >0.99 | 43 (58.9%) | 49 (67.1%) | 0.39 |
| Ascites, n (%) | 76 (44.2%) | 73 (42.4%) | 0.83 | 20 (54.1%) | 19 (51.4%) | >0.99 | 56 (41.5%) | 54 (40.0%) | 0.9 | 51 (51.5%) | 48 (48.5%) | 0.78 | 25 (34.3%) | 25 (34.3%) | >0.99 |
| Cholecystitis, n (%) | 3 (1.7%) | 1 (0.6%) | 0.62 | 0 (0.0%) | 1 (2.7%) | >0.99 | 3 (2.2%) | 0 (0.0%) | 0.25 | 0 (0.0%) | 0 (0.0%) | – | 3 (4.1%) | 1 (1.4%) | 0.62 |
| Fatigue, n (%) | 39 (22.7%) | 49 (28.5%) | 0.27 | 8 (21.6%) | 11 (29.7%) | 0.59 | 31 (23.0%) | 38 (28.2%) | 0.4 | 25 (25.3%) | 20 (20.2%) | 0.5 | 14 (19.2%) | 29 (39.7%) | <0.05* |
| Gastric ulcer, n (%) | 4 (2.3%) | 6 (3.5%) | 0.75 | 1 (2.7%) | 3 (8.1%) | 0.61 | 3 (2.2%) | 3 (2.2%) | >0.99 | 1 (1.0%) | 5 (5.1%) | 0.21 | 3 (4.1%) | 1 (1.4%) | 0.62 |
| Gastritis, n (%) | 11 (6.4%) | 14 (8.1%) | 0.68 | 1 (2.7%) | 3 (8.1%) | 0.61 | 10 (7.4%) | 11 (8.2%) | >0.99 | 5 (5.1%) | 8 (8.1%) | 0.57 | 6 (8.2%) | 6 (8.2%) | >0.99 |
| Jaundice, n (%) | 7 (4.1%) | 17 (9.9%) | 0.06 | 1 (2.7%) | 1 (2.7%) | >0.99 | 6 (4.4%) | 16 (11.9%) | <0.05* | 4 (4.0%) | 9 (9.1%) | 0.25 | 3 (4.1%) | 8 (11.0%) | 0.21 |
| LFT increase, n (%) | 42 (24.4%) | 42 (24.4%) | >0.99 | 12 (32.4%) | 11 (29.7%) | >0.99 | 30 (22.2%) | 31 (23.0%) | >0.99 | 29 (29.3%) | 22 (22.2%) | 0.33 | 13 (17.8%) | 20 (27.4%) | 0.24 |
| Lymphopenia, n (%) | 1 (0.6%) | 9 (5.2%) | <0.05* | 0 (0.0%) | 0 (0.0%) | – | 1 (0.7%) | 9 (6.7%) | <0.05* | 1 (1.0%) | 3 (3.0%) | 0.62 | 0 (0.0%) | 6 (8.2%) | <0.05* |
| Portal hypertension, n (%) | 55 (32.0%) | 62 (36.1%) | 0.49 | 19 (51.4%) | 23 (62.2%) | <0.001 | 36 (26.7%) | 39 (28.9%) | 0.79 | 46 (46.5%) | 51 (51.5%) | 0.57 | 9 (12.3%) | 11 (15.1%) | 0.81 |
| Post embolization syndrome, n (%) | 0 (0.0%) | 0 (0.0%) | – | 0 (0.0%) | 0 (0.0%) | – | 0 (0.0%) | 0 (0.0%) | – | 0 (0.0%) | 0 (0.0%) | – | 0 (0.0%) | 0 (0.0%) | – |
| Paracentesis | |||||||||||||||
| Any paracentesis post-index, n (%) | 28 (16.3%) | 33 (19.2%) | 0.57 | 4 (10.8%) | 10 (27.0%) | 0.14 | 24 (17.8%) | 23 (17.0%) | >0.99 | 19 (19.2%) | 20 (20.2%) | >0.99 | 9 (12.3%) | 13 (17.8%) | 0.49 |
| Systemic therapy use (after at least 3 months post-index) | |||||||||||||||
| Any use of systemic therapy, n (%) | 27 (15.7%) | 29 (16.9%) | 0.88 | 6 (16.2%) | 5 (13.5%) | >0.99 | 21 (15.6%) | 24 (17.8%) | 0.74 | 11 (11.1%) | 11 (11.1%) | >0.99 | 16 (21.9%) | 18 (24.7%) | 0.84 |
| Chemotherapy, n (%) | 7 (4.1%) | 8 (4.7%) | >0.99 | 0 (0.0%) | 1 (2.7%) | >0.99 | 7 (5.2%) | 7 (5.2%) | >0.99 | 0 (0.0%) | 0 (0.0%) | – | 7 (9.6%) | 8 (11.0%) | >0.99 |
| TKI, n (%) | 2 (1.2%) | 7 (4.1%) | 0.17 | 2 (5.4%) | 1 (2.7%) | >0.99 | 0 (0.0%) | 6 (4.4%) | <0.05 * | 2 (2.0%) | 3 (3.0%) | >0.99 | 0 (0.0%) | 4 (5.5%) | 0.12 |
| Anti-VEGF, n (%) | 0 (0.0%) | 0 (0.0%) | – | 0 (0.0%) | 0 (0.0%) | – | 0 (0.0%) | 0 (0.0%) | – | 0 (0.0%) | 0 (0.0%) | – | 0 (0.0%) | 0 (0.0%) | – |
| Atezolizumab + bevacizumab, n (%) | 11 (6.4%) | 8 (4.7%) | 0.64 | 4 (10.8%) | 2 (5.4%) | 0.67 | 7 (5.2%) | 6 (4.4%) | >0.99 | 7 (7.1%) | 7 (7.1%) | >0.99 | 4 (5.5%) | 1 (1.4%) | 0.37 |
| Atezolizumab, n (%) | 7 (4.1%) | 4 (2.3%) | 0.54 | 2 (5.4%) | 0 (0.0%) | 0.49 | 5 (3.7%) | 4 (3.0%) | >0.99 | 5 (5.0%) | 4 (4.0%) | >0.99 | 2 (2.7%) | 0 (0.0%) | 0.5 |
| Bevacizumab, n (%) | 4 (2.3%) | 5 (2.9%) | >0.99 | 0 (0.0%) | 0 (0.0%) | – | 4 (3.0%) | 5 (3.7%) | >0.99 | 2 (2.0%) | 0 (0.0%) | 0.5 | 2 (2.7%) | 5 (6.8%) | 0.44 |
| Immunotherapy, n (%) | 3 (1.7%) | 6 (3.5%) | 0.5 | 0 (0.0%) | 0 (0.0%) | – | 3 (2.2%) | 6 (4.4%) | 0.5 | 1 (1.0%) | 2 (2.0%) | >0.99 | 2 (2.7%) | 4 (5.5%) | 0.68 |
| Anti-HER2, n (%) | 0 (0.0%) | 2 (1.2%) | 0.5 | 0 (0.0%) | 1 (2.7%) | >0.99 | 0 (0.0%) | 1 (0.7%) | >0.99 | 0 (0.0%) | 1 (1.0%) | >0.99 | 0 (0.0%) | 1 (1.4%) | >0.99 |
Systemic therapy types were identified as follows:
Chemotherapy: capecitabine; irinotecan; leucovorin, fluorouracil and irinotecan (observed on the same day); or leucovorin, fluorouracil and oxaliplatin (observed on the same day). TKI: cabozantinib, lenvatinib, regorafenib or sorafenib. Anti-VEGF: ramucirumab; Immunotherapy: pembrolizumab; durvalumab and tremelimumab (observed on the same day); or nivolumab and ipilimumab (observed on the same day). Anti-HER2: trastuzumab.
Anti-HER2: Antihuman epidermal growth factor receptor 2; Anti-VEGF: Antivascular endothelial growth factor; ER: Emergency room; HCC: Hepatocellular carcinoma; IP: Inpatient; LFT: Liver function test; PEDD: Pressure-enabled drug delivery; TACE: Trans-arterial chemoembolization; TARE: Trans-arterial radioembolization; TKI: Tyrosine kinase inhibitor.
Estimates of cost avoidance
Individual complications were assessed at any time post-index for the PEDD and non-PEDD cohorts. On average, we identified lower HRU rates and lower frequency of clinical complications for the PEDD cohort, including fewer IP visits within 30 days post-index (0.11 vs 0.13 in non-PEDD patients), and a lower frequency of ascites (3.44 vs 3.96), fatigue (0.55 vs 0.82), and gastritis (0.15 vs 0.17) (Table 5). Frequency of paracentesis post-index (1.30 vs 1.47) was also lower among the PEDD cohort. These fewer events translated to reduced charges. For each PEDD patient, the reduced number of IP visits within 30 days post-index indicated $3135 in avoided charges and the reduction in all clinical complications at any time post-index indicated another $4599 in avoided charges.
| Outcome | PEDD unit charge of event, mean [median] | Average events per-patient (n) | Charges avoided with PEDD | |
|---|---|---|---|---|
| [A] | PEDD (n = 603) [D] | Non-PEDD (n = 603) [E] | ([E]-[D])*[A] | |
| Healthcare resource utilization | ||||
| IP visit within 30 days post-index | $156,774 [$43,253] | 0.11 | 0.13 | $3135 |
| ER visit within 7 days post-index | $30,305 [$10,115] | 0.04 | 0.03 | ($303) |
| Individual complications anytime post-index | ||||
| Ascites | $11,400 [$969] | 3.44 | 3.96 | $5928 |
| Cholecystitis | $9561 [$326] | 0.16 | 0.14 | ($191) |
| Fatigue | $11,788 [$592] | 0.55 | 0.82 | $3183 |
| Gastric ulcer | $6237 [$646] | 0.15 | 0.11 | ($249) |
| Gastritis | $13,004 [$983] | 0.15 | 0.17 | $260 |
| Jaundice | $3178 [$381] | 0.31 | 0.19 | ($381) |
| LFT increase | $7574 [$462] | 1.08 | 0.88 | ($1515) |
| Lymphopenia | $1185 [$405] | 0.02 | 0.02 | $0 |
| Portal hypertension | $27,067 [$1510] | 1.44 | 1.35 | ($2436) |
| Post embolization syndrome | – | 0.00 | 0.00 | – |
| Paracentesis anytime post-index | $2858 [$2144] | 1.30 | 1.47 | $486 |
The unit charge of an IP visit within 30 days post-index is calculated by the average per visit total charge across all 30-day IP visits of PEDD patients in the pre-matching sample.
The unit charge of an ER visit within 7 days post-index is calculated by the average per visit total charge across all 7-day ER visits of PEDD patients in the pre-matching sample.
The unit charge per individual complication anytime post-index is calculated by the average total charge per claim containing specific ICD code(s) for complications (e.g., ascites) across all complication-specific claims post-index for PEDD patients in the pre-matching sample.
The unit charge per paracentesis procedure anytime post-index is calculated by the average total charge per paracentesis-specific CPT code(s) across all paracentesis procedures post-index for PEDD patients in the pre-matching sample.
The average number of events for each outcome is defined as:
IP visit: average number of visits; ER: average number of visits; Individual complications: average number of unique complication-specific claims; and Paracentesis: average number of unique records with paracentesis.
Costs were adjusted to 2023 US dollars using the medical care component of the Consumer Price Index. Individual complications and paracentesis (number of events and consequently associated charges avoided) were assessed anytime post-index for the PEDD and non-PEDD cohorts, representing an average follow-up duration of 11.96 months for PEDD patients and 12.97 months for non-PEDD patients.
ER: Emergency room; IP: Inpatient; LFT: Liver function test; PEDD: Pressure-enabled drug delivery.
Discussion
This study builds on prior research by using an expanded dataset to examine the real-world impact of PEDD procedures for patients with HCC and secondary liver metastases undergoing TACE or TARE procedures. Previous analyses suggested that PEDD-based embolization was utilized in patients with more advanced disease but yielded comparable outcomes to non-PEDD approaches [10]. However, sample size limitations restricted the ability to assess clinical outcomes and evaluate potential cost implications. By leveraging a larger and up-to-date dataset, this study provides a more comprehensive evaluation of PEDD's role in clinical practice, including its impact on post-procedure complications, HRU and cost avoidance. Specifically, we analyzed data on 603 PEDD patients and 16,210 non-PEDD patients, compared with a prior study that assessed 258 PEDD patients and 8,940 non-PEDD patients [10].
This study identified higher disease burden at baseline among patients treated with PEDD compared with non-PEDD patients, as reflected by higher CCI scores, more frequent healthcare utilization in the 3 months prior to index, higher rates of clinical complications in the 3 months prior to index, and higher rates of systemic therapy use any time pre-index. These findings reinforce that PEDD continues to be used in patients with more advanced disease and greater clinical complexity. This may potentially reflect physician preference to reserve PEDD for more severely ill patients or a tendency for physicians who perform PEDD procedures to treat a more clinically complex population. It may also reflect clinical decision-making intended to reduce the risk of non-target and non-tumor embolization, particularly in patients with worse underlying liver health. In these cases, the ability to deliver therapy with greater anatomic precision may help avoid unintended damage to non-tumorous liver tissue [6]. The elevated baseline comorbidity and complication rates observed among PEDD patients are consistent with this rationale, suggesting that PEDD may be selected for patients where minimizing procedure-related complications is a clinical priority.
After matching, PEDD patients had lower rates of post-procedure clinical complications and HRU compared with non-PEDD patients, despite greater baseline complexity. These benefits included reduced rates of fatigue (overall and in the TARE subgroup), 30-day inpatient hospitalizations among TACE patients, any post-procedure complication among TARE patients, and gastric ulcer and jaundice in HCC patients. The improved outcomes observed with PEDD may be attributed to its ability to more precisely target tumor tissue while minimizing damage to surrounding normal liver tissue [12,13]. This more selective targeting could contribute to reduced side effects, better preservation of liver function and improved overall quality of life. For example, studies have highlighted that fatigue is an important side effect of embolization and can significantly impact patient quality of life [14,15] and the lower rates of fatigue observed with PEDD reinforce its potential quality-of-life benefits. Our findings align with prior research reporting that PEDD is associated with higher and more durable tumor response rates which can lead to fewer treatment sessions and improved post-treatment liver function [6].
Further supporting this interpretation, we also found that PEDD-TACE patients received a significantly higher number of procedure units of doxorubicin on average compared with non-PEDD patients. Given that chemotherapy-related side effects, such as fatigue, may be more pronounced in patients with underlying liver dysfunction, it is notable that PEDD patients in the TACE cohort experienced fewer post-procedural complications despite receiving a greater number of procedural doses. This pattern suggests that PEDD may improve drug delivery to the tumor while limiting systemic and off-target toxicity. Overall, these findings support the hypothesis that PEDD allows for more effective treatment without compromising tolerability.
The impact of PEDD was similar in high-adopter facilities, those with greater experience performing PEDD procedures. Specifically, lymphopenia rates were lower in PEDD patients overall, fatigue was substantially lower, and lymphopenia was nearly eliminated among patients with secondary liver metastases. These findings suggest that PEDD procedures performed in facilities with advanced institutional or procedural experience may contribute to an improvement in patient outcomes. The observation that PEDD experience may enhance patient outcomes is aligned with substantial evidence linking procedural volume to better quality of care, supported by practice, effective teams and clinical support systems [16–18]. Furthermore, the lower rates of lymphopenia associated with PEDD use in high-adopter facilities suggest that patients receiving PEDD treatment maintain a better functioning immune system and therefore may be better able to receive follow-up lines of treatment (e.g., immunomodulatory treatments) than non-PEDD patients and allow for improved disease management. Future studies may further assess the impact of facility-level expertise on procedural efficiency, patient selection, or treatment delivery.
Last, PEDD use was associated with lower estimated resource use and costs during follow-up, driven by fewer instances of 30-day inpatient hospitalizations and post-procedure complications. Specifically, PEDD use can translate to pp costs avoided on average through reduced HRU ($3135 pp in charges) and reduced clinical complications ($4599 pp in charges). In addition, higher and more durable response rates associated with PEDD may further decrease the number of procedures required for disease control and reduce costs. Future studies should further assess the financial impact of PEDD across different hospital systems and payer structures.
Limitations
This study has limitations related to using claims data. The Clarivate Real World Data Repository only included claims billed by providers within Clarivate's network. Therefore, unbilled or out-of-network services would not have been captured in the data, leading to a potential underestimation of resource use. In addition, PEDD device use was identified in the claims data using the HCPCS code C1982, which in real-world practice may not always be reported on submitted claims. Furthermore, claims data do not offer clinical measures of disease severity, which may impact the assessment of differences in post-procedure outcomes. Finally, comparative observational studies are limited by potential bias from unmeasured or residual confounding, so caution should be exercised when interpreting the results of these studies. For example, matching included calendar quarter only for Q1 and Q2 of 2020 to account for potential disruptions related to the COVID-19 pandemic. Although this approach was intended to improve temporal comparability during that period, residual temporal variation in treatment patterns over the broader study period may remain. The two-step matching approach was used in this study to develop well-balanced patient cohorts across a range of characteristics and thereby produce a less biased comparative assessment of outcomes.
Conclusion
This study provides the most comprehensive real-world evidence to date of PEDD’s impact on clinical outcomes, HRU and costs among patients with HCC and secondary liver metastases undergoing TACE or TARE procedures. By leveraging a significantly larger and more current dataset than prior research, this analysis confirms that PEDD is frequently used in patients with greater baseline disease burden and demonstrates statistically significant improvements in key post-procedure outcomes. The benefits of PEDD were similar in high-adopter facilities, suggesting that greater institutional experience may enhance patient outcomes. Reduced post-procedure complications and hospitalizations can translate into cost avoidance, reinforcing the value of PEDD technology in clinical practice. These findings support further investigation into PEDD's role across broader patient populations and treatment settings.
Summary points
•
Pressure-enabled drug delivery (PEDD) enhances intra-arterial drug penetration during trans-arterial chemoembolization (TACE) and trans-arterial radioembolization (TARE), but real-world evidence remains limited.
•
This retrospective study used Clarivate Real World Data (January 2020 to March 2024) to evaluate clinical outcomes and costs of PEDD versus non-PEDD procedures.
•
A total of 603 PEDD and 16,210 non-PEDD patients with hepatocellular carcinoma or secondary liver metastases were identified.
•
PEDD patients had greater baseline disease burden, including higher comorbidity scores.
•
In matched analyses, PEDD was associated with significantly lower rates of fatigue (20.9% vs 26.4%) and reduced 30-day inpatient visits after TACE (8.0% vs 20.5%).
•
At high-adopter facilities, PEDD patients had fewer post-index complications, including lower lymphopenia rates overall (0.6% vs 5.2%) and substantially reduced fatigue and lymphopenia among patients with secondary liver metastases.
•
PEDD-TACE patients received higher procedural units of doxorubicin but experienced fewer complications, suggesting improved tumor targeting with reduced off-target toxicity.
•
Reduced hospitalizations and complications translated into mean per-patient avoided charges of $3135 for inpatient visits and $4599 for complications.
•
Findings indicate that greater institutional experience with PEDD may enhance patient outcomes and reinforce its clinical and economic value in clinical practice.
Author contributions
All authors were responsible for the study conception and design. D Gupta, Y Liu, CM-Rosales, F Wei and E Tuttle were responsible for study data analysis. All authors were involved in the interpretation of study results, drafting and reviewing of the manuscript.
Acknowledgments
The authors thankful to Yixin Yang of Analysis Group, Inc for her research assistance.
Financial disclosure
This study was supported by TriSalus Life Sciences (CO, USA). The sponsor was involved in the study design, interpretation of results, manuscript preparation and publication decisions.
Competing interests disclosure
The authors have no competing interests or relevant affiliations with any organization or entity with the subject matter or materials discussed in the manuscript. This includes employment, consultancies, honoraria, stock ownership or options, expert testimony, grants or patents received or pending, or royalties.
Writing disclosure
No funded writing assistance was utilized in the production of this manuscript.
Data availability statement
This manuscript reports the results of a real-world evidence study. The protocol was not publicly registered, and the data are not available due to contractual restrictions. The analytic code is available upon reasonable request.
Open access
This work is licensed under the Attribution-NonCommercial-NoDerivatives 4.0 Unported License. To view a copy of this license, visit https://creativecommons.org/licenses/by-nc-nd/4.0/
Supplementary Material
File (supplementary data.docx)
- Download
- 81.65 KB
References
Papers of special note have been highlighted as: • of interest; •• of considerable interest
1.
Zhong BY, Fan W, Guan JJ et al. Combination locoregional and systemic therapies in hepatocellular carcinoma. Lancet Gastroenterol. Hepatol. 10(4), 369–386 (2025).
•• Establishes the central role of trans-arterial chemoembolization (TACE) and trans-arterial radioembolization (TARE) in hepatocellular carcinoma management, supporting the clinical relevance of optimizing embolization approaches.
2.
d'Abadie P, Walrand S, Hesse M et al. Accurate non-tumoral 99mtc-maa absorbed dose prediction to plan optimized activities in liver radioembolization using resin microspheres. Phys. Med. 89, 250–257 (2021).
• Supports the importance of delivery precision and dose optimization in radioembolization.
3.
Sheth RA, Hesketh R, Kong DS, Wicky S, Oklu R. Barriers to drug delivery in interventional oncology. J. Vasc. Interv. Radiol. 24(8), 1201–1207 (2013).
•• Identifies physiologic barriers to intra-tumoral drug delivery, providing the mechanistic rationale for pressure-enabled drug delivery (PEDD).
4.
Heldin CH, Rubin K, Pietras K, Ostman A. High interstitial fluid pressure - an obstacle in cancer therapy. Nat. Rev. Cancer 4(10), 806–813 (2004).
• Describes tumor pressure as a barrier to therapeutic penetration, supporting the need for enhanced delivery techniques.
5.
Stylianopoulos T, Martin JD, Chauhan VP et al. Causes, consequences, and remedies for growth-induced solid stress in murine and human tumors. Proc. Natl Acad. Sci. USA 109(38), 15101–15108 (2012).
6.
Titano JJ, Fischman AM, Cherian A et al. End-hole versus microvalve infusion catheters in patients undergoing drug-eluting microspheres-tace for solitary hepatocellular carcinoma tumors: a retrospective analysis. Cardiovasc. Intervent. Radiol. 42(4), 560–568 (2019).
•• Demonstrates improved tumor response with pressure-modulating catheter technology, supporting PEDD-based approaches.
7.
Kim AY, Frantz S, Krishnan P et al. Short-term imaging response after drug-eluting embolic trans-arterial chemoembolization delivered with the surefire infusion system® for the treatment of hepatocellular carcinoma. PLoS ONE 12(9), e0183861 (2017).
•• Provides clinical evidence of improved embolization delivery with pressure-modulating catheter systems.
8.
Cancer stat facts: liver and intrahepatic bile duct cancer. https://seer.cancer.gov/statfacts/html/livibd.html
9.
Adult primary liver cancer treatment (pdq®)–health professional version. https://www.cancer.gov/types/liver/hp/adult-liver-treatment-pdq
10.
Cook K, Gupta D, Liu Y et al. Real-world evidence of pressure-enabled drug delivery for trans-arterial chemoembolization and radioembolization among patients with hepatocellular carcinoma and liver metastases. Curr. Med. Res. Opin. 40(4), 591–598 (2024).
11.
Consumer price index factsheets. https://www.bls.gov/cpi/factsheets/medical-care.htm
12.
Jaroch DB, Liu Y, Kim AY, Katz SC, Cox BF, Hullinger TG. Intra-arterial pressure-enabled drug delivery significantly increases penetration of glass microspheres in a porcine liver tumor model. J. Vasc. Interv. Radiol. 35(10), 1525–1533; e4 (2024).
13.
Jaroch DB, Liu Y, Kim AY, Katz SC, Cox BF, Hullinger TG. Pressure-enabled drug delivery significantly increases intra-arterial delivery of embolic microspheres to liver tumors in a porcine model. J. Vasc. Interv. Radiol. 36(3), 499–504; e1 (2025).
14.
Hao K, Paik AJ, Han LH, Makary MS. Yttrium-90 radioembolization treatment strategies for management of hepatocellular carcinoma. World J. Radiol. 16(10), 512–527 (2024).
15.
Li C, Hickey R, Lewandowski RJ, Salem R. Transarterial radioembolization. In: IR Playbook: a Comprehensive Introduction to Interventional Radiology. Keefe NA, Haskal ZJJ, Park AW, Angle JF (Eds). Springer Nature, Switzerland, 475–484 (2024).
16.
Jha AK. Back to the future: volume as a quality metric. JAMA 314(3), 214–215 (2015).
17.
Birkmeyer JD, Siewers AE, Finlayson EV et al. Hospital volume and surgical mortality in the united states. N. Engl. J. Med. 346(15), 1128–1137 (2002).
18.
Birkmeyer JD, Stukel TA, Siewers AE, Goodney PP, Wennberg DE, Lucas FL. Surgeon volume and operative mortality in the united states. N. Engl. J. Med. 349(22), 2117–2127 (2003).
Information & Authors
Information
Published In
Copyright
© 2026 The authors. This work is licensed under the Attribution-NonCommercial-NoDerivatives 4.0 Unported License
History
Received: 13 September 2025
Accepted: 27 March 2026
Published online: 9 April 2026
Keywords:
Authors
Metrics & Citations
Metrics
Article Usage
Article usage data only available from February 2023. Historical article usage data, showing the number of article downloads, is available upon request.
Citations
How to Cite
Clinical outcomes of pressure-enabled drug delivery for trans-arterial chemoembolization and radioembolization. (2026) Journal of Comparative Effectiveness Research. DOI: 10.57264/cer-2025-0144
Export citation
Select the citation format you wish to export for this article or chapter.