Budget impact analyses of hemoglobin A1c and lipid panel point-of-care testing with Afinion™ 2 in Canada and Italy
Publication: Journal of Comparative Effectiveness Research
Abstract
Aim: Screening and monitoring of diabetes or dyslipidemia frequently involves a multi-step process requiring patients to obtain test requisitions from their primary care physician (PCP), followed by a laboratory visit and re-consultation. Point-of-care testing (POCT) for hemoglobin A1c (HbA1c) and lipid panel can streamline the patient care pathway. This study assessed the budget impact of introducing Afinion™ 2 POCT (Abbott Rapid Diagnostics) from the Canadian and Italian societal perspectives. Methods: Budget impact models were developed for Canada and Italy over a 5-year time horizon (2025 to 2029). The analyses considered the screening and monitoring of diabetes or dyslipidemia for patients utilizing the public healthcare system and attending primary care, and included direct costs (testing, consultations) and indirect costs (productivity loss, transportation) based on published sources. The budget impact (BI) was calculated by comparing scenarios with and without POCT. All costs were adjusted to Canadian dollars ($) or 2024 Euros (€). Scenario analyses were conducted to explore the impact of alternative assumptions. Results: The 5-year cumulative BI was -$758,006,692 (-$50,709,964 direct, -$707,296,728 indirect) for HbA1c POCT and -$726,452,755 ($2,684,011 direct, -$729,136,766 indirect) for lipid panel POCT in Canada and -€1,380,658,764 (-€6,391,954 direct, -€1,374,266,809 indirect) for HbA1c POCT and -€851,792,115 (€55,962,879 direct, -€907,754,993 indirect) for lipid panel POCT in Italy. In both countries, cost savings for both the healthcare payer and patients were observed for HbA1c POCT, while costs savings were derived from patient indirect costs for lipid panel POCT. The analyses estimated that 1,558,062 and 1,501,260 PCP consultations in Canada, 4,962,338 and 1,951,026 PCP consultations in Italy were avoided with implementation of POCT for HbA1c and lipid panel, respectively. Scenario analyses demonstrated potential further cost savings with implementation of POCT in pharmacies. Conclusion: This study demonstrates that the adoption of Afinion 2 POCT for HbA1c and lipid panel can provide efficiencies to different types of healthcare systems through reducing PCP consultations, saving time and money for patients and providing cost savings for payers.
Plain language summary: cost of Afinion™ 2 versus traditional laboratory testing for diabetes & lipids in Canada and Italy
What was the aim of this research?
To compare the costs and change in number of primary care visits associated with the use of Afinion™ 2 point-of-care testing (POCT) for screening and monitoring of diabetes and dyslipidemia versus traditional laboratory testing for Canadian and Italian healthcare systems.
How was the research carried out?
A budget impact model was developed to compare costs between traditional laboratory testing pathways and Afinion 2 POCT over 5 years for Canada and Italy. Screening and monitoring of diabetes or dyslipidemia for patients utilizing the public healthcare system and attending primary care visits were analyzed. Direct (testing, physician visits) and indirect costs (productivity loss, transportation) were also included.
What were the results?
Utilization of Afinion 2 POCT can reduce the number of primary care and laboratory visits for patients with diabetes or dyslipidemia, resulting in decreased healthcare resource utilization and increased efficiency for both healthcare providers and patients. The overall budget impact was cost-saving for both HbA1c and lipid panel testing in Canada and Italy, with the main cost drivers being attributed to indirect cost savings and a reduction in primary care visits.
What do the results of the study mean?
Implementing Afinion 2 POCT for diabetes and lipid panel testing can make the Canadian and Italian healthcare systems more streamlined by reducing the number of primary care visits for disease management, saving money and time for patients and providing cost savings for payers.
Diabetes and dyslipidemia are two prevalent chronic conditions requiring continuous monitoring of blood glucose and metabolic lipoproteins, respectively. Diabetes is a serious chronic condition, affecting the production and utilization of insulin, resulting in elevated blood glucose levels (hyperglycemia). When diabetes is left uncontrolled, either by inadequate disease management or missed diagnosis, hyperglycemia can contribute to elevated risk of cardiovascular disease or microvascular complications, which can result in diabetic retinopathy or end-stage renal disease [1,2,3]. Dyslipidemia refers to abnormal lipid levels affecting the metabolic balance of lipoproteins, including elevated total cholesterol (TC), triglycerides (TG), low-density lipoprotein cholesterol (LDL-C) and decreased high-density lipoprotein cholesterol (HDL-C) [4]. Dyslipidemia can lead to various pathological metabolic conditions and increase risk of cardiovascular disease (CVD) [5,6], which can result in myocardial infarction or coronary artery disease [5]. The substantial burden diabetes and dyslipidemia elicits has been recognized internationally, resulting in numerous efforts to mitigate the growing burden on healthcare systems and patients. In 2021 the National Framework for Diabetes Act was passed in Canada to establish a multi-dimensional plan to focus on applying a patient-centered approach while supporting innovation to prevent, manage and effectively treat diabetes [7]. The emergence of new evidence regarding the burden of dyslipidemia in Europe has resulted in the European Society of Cardiology and European Atherosclerosis Society forming a taskforce to revise the guidelines for management of dyslipidemia in 2019 [8]. This update includes a focus to increase surveillance in pre-dyslipidemia patients providing additional risk stratification tools, and updated surveillance and management of patients diagnosed with dyslipidemia utilizing statin management therapies [8].
The current standard of care for screening or monitoring of diabetes or dyslipidemia requires patients to undergo regular blood biomarker testing for diagnosis or to track disease progression. HbA1c testing is the gold standard method to detect and monitor prediabetic and diabetic patients, respectively [9]. Furthermore, HbA1c is considered to have equivalent or superior test accuracy when compared with other diabetes identification and monitoring processes such as fasting and 2-hour post oral glucose tolerance test [10]. Lipid panel testing analyzes all lipoproteins (TC, TG, LDL-C, HDL-C) within a blood or serum sample to allow the physician to understand how a patient's lipid metabolism pathway is functioning, which is utilized to guide lifestyle and pharmacological treatment decisions. A full lipid panel test is the gold standard method to detect and monitor dyslipidemia [11]. To monitor HbA1c and lipid panel, patients often require a multi-step process associated with central laboratories. In Canada and Italy, the current testing process for patients usually involves going to their primary care physician (PCP) to obtain a blood test requisition, then visiting a central laboratory testing facility to have the test conducted. Dependent on the test results, patients may need to reconsult with their PCP to initiate or modify treatment, if necessary [12]. This process is associated with high administrative burden for PCPs, resulting in longer wait times, as well as high indirect costs for patients (e.g., for time off from work, travel, etc.), resulting in low adherence to testing guidelines [13]. Therefore, there is a need to streamline the diagnostic and monitoring pathway for HbA1c and lipids to improve identification of diabetic and dyslipidemia patients and to ensure those who are diagnosed adhere to testing guidelines in order to reduce the risk of disease-related complications.
Implementation of Afinion™ 2 (Abbott Rapid Diagnostics) point-of-care testing (POCT) can address many of the unmet testing needs among patients with diabetes or dyslipidemia, as this technology can facilitate on-site testing. First, POCT can strengthen the PCP-patient relationship by providing rapid test results, allowing medical decision-making to be expedited in one physician visit [14]. This streamlined process can also reduce the number of healthcare visits (both to the PCP office and to the central laboratory) to provide a more convenient patient care pathway [14]. Furthermore, improved access to rapid HbA1c and lipid panel testing may increase testing adherence and allow for early identification of suboptimal glycemic or lipoprotein control, allowing proper therapeutic intervention to occur to reduce disease-related complications. Last, POCT can improve access to testing for patients in rural or remote communities that would otherwise have limited testing options, hindering adherence to routine testing [15].
Previously published budget impact analyses (BIA) of HbA1c and lipid panel POCT are limited due to its recent innovation. However, a recent BIA conducted in Canada detailed the impact of HbA1c POCT compared with traditional laboratory testing in diabetic patients attending primary care (PC) from the payer perspective [12]. This analysis included the cost of POC or laboratory HbA1c testing and PCP consultations, resulting in approximately $4.7 million in savings in 1 year with the implementation of HbA1c POCT due to a substantial reduction in PCP consultations [12]. Moreover, there are no previously published BIAs reviewing lipid panel POCT, however Laurence et al. completed a cost–effective analysis, comparing POCT to traditional laboratory testing in Australia over 18 months for both HbA1c and lipid panel testing [16]. This analysis included costs to establish the program, pathology testing, quality management, consumables, maintenance and downstream clinical and patient costs [16]. This cost–effectiveness analysis (CEA) revealed non-statistically significant higher direct costs per patient to the healthcare sector for POCT compared with traditional laboratory testing; however, POCT allowed for significant savings to patients and their families [16].
This study assessed the budget impact of introducing Afinion 2 POCT to screen and monitor patients with diabetes or dyslipidemia from the Canadian and Italian societal perspectives (i.e., considering both direct and indirect costs). By considering both Canada and Italy, this analysis provides a holistic analysis of the potential budgetary and patient care pathway efficiencies that Afinion 2 POCT can offer across different types of healthcare systems (i.e., fee-for-service billing vs per-capita) [17,18].
Methods
Model overview
The presented study is a non-interventional economic evaluation using pre-existing published literature to inform the Budget Impact Model (BIM); therefore, ethical permission or considerations were not applicable for this study. The BIM was developed to estimate both direct costs (HbA1c and lipid panel testing, healthcare provider consultations) and indirect costs (productivity loss, transportation) in scenarios with and without Afinion 2 POCT in Canada and Italy. The BIM was developed using Microsoft® Excel with Visual Basic for Applications to facilitate navigation and selection of data. The BIA was conducted based on epidemiological data to estimate the number of patients eligible for testing and projected market shares for POCT, with a time horizon encompassing a 1-year baseline period (2024) and a 5-year forecast period (2025 to 2029).
Model inputs & assumptions
Comparators & market shares
To determine the budget impact of implementing Afinion 2 POCT for screening or monitoring patients with diabetes (HbA1c) or dyslipidemia (lipid panel) attending PC, traditional laboratory testing was selected as the comparator in the model. Laboratory testing represents the standard diagnostic and monitoring pathway in current clinical practice for the target Canadian and Italian populations. The anticipated market share for Afinion 2 POCT in the future scenario (i.e., world with Afinion 2 POCT) was assumed to increase from 0% in the baseline year to 5% in the first year, and then increase 10% each year from years two to five, while 100% of the market share was attributed to traditional laboratory testing in the current scenario (i.e., world without Afinion 2 POCT) (Supplementary Table 1).
Patient flow
An epidemiological approach was undertaken to determine the number of patients eligible for HbA1c or lipid panel testing. The eligible population was separated into two categories, a diagnosed diabetic or dyslipidemia population being monitored in PC, and patients eligible for diabetes or dyslipidemia screening. The calculation steps used to estimate the Canadian population eligible to receive Afinion 2 POCT either for monitoring or screening of diabetes or dyslipidemia in PC are explained in Tables 1 & 2, respectively. Patients with known diabetes or dyslipidemia that are utilizing HbA1c or lipid testing to monitor disease progression was further sub-categorized.
| # | Input | Canada | Italy | Ref. | ||
|---|---|---|---|---|---|---|
| Calculation | Value | Calculation | Value | |||
| Inputs for the diagnosed population followed by PC | ||||||
| 1 | Population | – | 39,953,100 | – | 58,820,000 | [25] |
| 2 | Annual rate of PC visits per person (general population) | (1) × 1.24† | 49,541,844 | (1) × 1.50 | 88,230,000 | [26,27] |
| 3 | Visits per patient/year (n) | (2)/2.65‡ | 18,695,035 | (2)/2.65‡ | 33,294,340 | [28] |
| 4 | Proportion of patients attending public providers | – | – | (3) × 77% | 25,636,642 | [29] |
| 5 | Patients with diabetes monitored at PC (%) | (3) × 6.2%§ | 1,159,092 | (4) × 15% | 3,845,496 | [28] |
| Inputs for the eligible for screening population | ||||||
| 6 | Primary care patients ≥40 years old (%)¶ | – | 56.4%# | – | 56.4%# | [30] |
| 7 | Patients eligible for screening (%) | (6) – (5)†† | 50.2% | (6) – (5)†† | 41.4% | |
| 8 | Annual adjusted proportion of patients with diabetes screening | (7)/3¶ | 16.73% | (7)/3¶ | 13.8% | [31] |
| 9 | Population eligible for screening | (3) × (8)†† | 3,128,303 | (3) × (8)†† | 3,537,857 | |
†
National Physician Database Historical Utilization – Data Tables (Table 1: number of services per 100K for family medicine [includes total consultations, major office assessment and other office assessment]) [26].
‡
Estimated number of visits per patient (2.65) for March to December 2019 (pre-COVID) (Figure 1) [28].
§
Percentage of physician visits due to diabetes from March to December 2019 (pre-COVID) (Table 2) [28].
¶
Diabetes Canada recommends screening once every three years in individuals ≥40 years old [31].
#
Canadian Primary Care Sentinel Surveillance Network data was used to calculate the proportion of patients over 40 years of age attending primary care (Table 2, rows: middle-aged adults 40–64 years and older adults 65 years and older) [30].
††
Assumption.
Bold values represent the main take-away outcomes reported in this table.
HbA1c: Hemoglobin A1c; PC: Primary care; POC: Point-of-care.
| # | Input | Canada | Italy | Ref. | ||
|---|---|---|---|---|---|---|
| Calculation | Value | Calculation | Value | |||
| Inputs for the diagnosed population followed by PC | ||||||
| 1 | Population | – | 39,953,100 | – | 58,820,000 | [25] |
| 2 | Annual rate of PC visits per person (general population) | (1) × 1.24† | 49,541,844 | (1) × 1.5 | 88,230,000 | [26,27] |
| 3 | Visits per patient/year (n) | (2)/2.65‡ | 18,695,035 | (2)/2.65‡ | 33,294,340 | [28] |
| 4 | Proportion of patients attending public providers | – | – | (3) × 77% | 25,636,642 | [29] |
| 5 | Patients with dyslipidemia monitored at PC (%) | (3) × 14%§ | 2,617,305 | (3) × 14%§ | 3,589,130 | [24] |
| Inputs for the eligible for screening population | ||||||
| 6 | Patients receiving a lipid panel test for dyslipidemia (%)¶ | (3) × 30%# | 5,608,511 | (3) × 30%# | 7,690,992 | [6] |
| 7 | Patients eligible for screening (%) | (5) – (4)†† | 2,991,206 | (5) – (4)†† | 4,101,863 | |
†
National Physician Database Historical Utilization – Data Tables (Table 1: number of services per 100K for family medicine [includes total consultations, major office assessment and other office assessment]) [26].
‡
Estimated number of visits per patient (2.65) for March to December 2019 (pre-COVID) (Figure 1) [28].
§
Retrospective cohort analysis with >150,000 adult patients in rural and urban primary care practices in Southwestern Ontario detailed that dyslipidemia was identified in 14% of patients from April 2000 to December 2003 [24].
¶
Includes patients being monitoring and screened.
#
Cross-sectional study utilizing the Canadian Primary Care Sentinel Surveillance Network identified that 30% of individuals had completed a blood test for at least one lipid component from January 2010 to December 2012 [6].
††
Assumption.
Bold values represent the main take-away outcomes reported in this table.
PC: Primary care; POC: Point-of-care.
Patients with diagnosed diabetes attending primary care for HbA1c monitoring
Among the diagnosed diabetic patients attending PC for HbA1c monitoring, patients were funnelled into one of two groups:
•
Patients adhering to testing guidelines – these patients were separated based into optimal or suboptimal glycemic control populations with different numbers of HbA1c tests per year,
•
Patients who are not adhering to testing guidelines – these patients were assumed to undergo one annual HbA1c test.
The specific inputs and sources are summarized in Supplementary Table 1. Based on a study on trends in laboratory testing for diabetes in Ontario, Canada, it was assumed that 64% of diabetic patients adhere to testing guidelines [19]. Of those patients adhering to testing guidelines, patients were separated based on glycemic control. The Diabetes in Canada Evaluation study reported that 51% of diagnosed diabetic patients had optimal glycemic control (HbA1c ≤7.0%) [20]. In Italy, it was assumed that 50% of patients were adhering the testing guidelines. Furthermore, it was reported that there was an even distribution of Italian patients with optimal and suboptimal glycemic control [21]. In both the Canadian and Italian scenario, it was assumed that the prevalence of patients adhering to testing guidelines and achieving optimal glycemic control was equivalent among traditional laboratory or Afinion 2 users.
Patients with diagnosed dyslipidemia attending primary care for lipid panel monitoring
Among the patients diagnosed with dyslipidemia attending PC for lipid panel monitoring, patients were funneled into one of three groups:
•
Patients diagnosed with dyslipidemia who are stably managed, these patients will continue to be monitored annually,
•
Patients requiring a medication change due to uncontrolled lipid levels,
•
Patients who are newly diagnosed with dyslipidemia and initiating pharmacological treatment.
The specific inputs and sources are summarized in Supplementary Table 1. It was assumed that 75% of patients with dyslipidemia adhere to testing guidelines. Of those patients adhering to testing guidelines, patients were separated based on condition status which informed lipid panel testing frequency. Cohort one is comprised of patients diagnosed with dyslipidemia who are stably managed. This subgroup was calculated by subtracting cohorts 2 and 3 from the total population adhering to testing guidelines. Cohort two includes patients requiring a medication change due to uncontrolled lipid levels. Joffres reported that 24% of patients diagnosed with dyslipidemia report medication use, with only 19% of medication-users achieving controlled lipid levels. It was assumed that the remaining 81% of patients would require a medication change to manage lipid levels [22]. Therefore, 19.44% of patients adhering to testing guidelines would be undergoing a medication change (24% × 81%). Lastly, cohort three represents patients who are newly diagnosed with dyslipidemia and initiating pharmacological treatment. To calculate the number of patients in this cohort, the annual incidence of dyslipidemia was estimated as 166.27 per 100,000 patients, based on the study published by Bilitou [23]. This incidence would correspond to 1.19% of patients with dyslipidemia monitored at PC, assuming a dyslipidemia prevalence of 14% [24]. Considering that Joffres [22] reported that 25.82% newly diagnosed patients would need medication, cohort three was estimated to be 0.31% (1.19% × 25.82%). In both the Canadian and Italian scenario, it was assumed that the prevalence of patients adhering to testing guidelines, as well as the distribution of patients across each cohort, were equivalent between traditional laboratory or Afinion 2 users.
Cost inputs
The base case BIM considered Afinion 2 POC device costs, direct healthcare costs (i.e., HbA1c or lipid panel testing and PCP consultations) and indirect costs (i.e., time off from work and transportation). The average per patient per year costs considering all the cost input and parameters is summarized in Table 3. This calculated cost was applied to the number of patients in each respective cohort based on the population flow outlined above. Additional information regarding calculation details can be found in the Supplementary Materials. All costs were adjusted to Canadian dollars ($) or 2024 Euros (€). Discounting was not applied.
| Cost input | HbA1c | Lipid panel | ||||||
|---|---|---|---|---|---|---|---|---|
| Canada | Italy | Canada | Italy | |||||
| Device-related costs for Afinion™ 2 POC | Traditional lab | Afinion 2 POC | Traditional lab | Afinion 2 POC | Traditional lab | Afinion 2 POC | Traditional lab | Afinion 2 POC |
| Cost per test | – | $18.14 | – | €6.97 | – | $24.51 | – | €9.54 |
| Healthcare resource use – screening population | ||||||||
| Cost per test | $7.25 | $18.14 | €7.41 | €6.97 | $8.27 | $24.51 | €4.31 | €9.54 |
| Healthcare resource use – monitoring population | ||||||||
| Average test cost | $16.44 | $41.14 | €14.82 | €13.94 | $9.67 | $28.65 | €5.04 | €11.15 |
| Average consultation cost | $284.27 | $198.04 | €0.00 | €0.00 | $138.90 | $102.11 | €0.00 | €0.00 |
| Indirect costs – screening population | ||||||||
| Costs associated with time off from work due to consultation time | $0.00 | – | €0.00 | – | $0.00 | – | €0.00 | – |
| Costs associated with transportation to PCP office | $0.00 | – | €0.00 | – | $0.00 | – | €0.00 | – |
| Costs associated with time off from work due to visit to central laboratory | $71.22 | – | €65.74 | – | $71.22 | – | €65.74 | – |
| Costs associated with transportation to central laboratory | $7.45 | – | €10.08 | – | $7.45 | – | €10.08 | – |
| Indirect costs – monitoring population | ||||||||
| Costs associated with time off from work due to consultation time | $231.78 | $181.65 | €197.22 | €147.92 | $113.25 | $93.66 | €104.54 | €86.45 |
| Costs associated with transportation to PCP office | $24.24 | $16.88 | €18.72 | €12.48 | $11.84 | $8.71 | €9.92 | €7.29 |
| Costs associated with time off from work due to visit to central laboratory | $161.47 | – | €131.48 | – | $83.25 | – | €76.85 | – |
| Costs associated with transportation to central laboratory | $16.88 | – | €20.16 | – | $8.71 | – | €11.78 | – |
HbA1c: Hemoglobin A1c; PCP: Primary care provider; POC: Point-of-care.
Device-related costs for Afinion™ 2 POC
The device-related costs for Afinion 2 POC were calculated based on several inputs, as outlined in Supplementary Table 3. Device-specific inputs included device cost, cartridge cost, quality control pack cost, device lifespan and annual utilization (lines 1–5). Next, the distribution between solo and group PCP practices was considered (lines 6–10), along with the estimated annual number of patients to be either monitored or screened per PCP per year (lines 11–13) to calculate the total cost per HbA1c test of $18.14 and €6.97, in addition to $24.51 and €9.54 per lipid panel test, for Canada and Italy, respectively (Table 3).
Healthcare resource use & cost inputs
Screening population
For the screening population, it was assumed that the request for a screening test is provided while the patient is consulting with the PCP for another reason and therefore the initial consultation was not costed separately in the model. In addition, it was assumed that there was no follow-up consultation for the screening test. Therefore, the only cost attributed to the screening population is testing cost. In Canada, the cost of a traditional laboratory HbA1c test is $7.25 and the cost of a lipid panel test is $8.27 [32]. In Italy, the cost of a traditional laboratory HbA1c test is €7.41, and the cost of a lipid panel test is €4.31 (Table 3). The cost of the respective POC test is detailed in Supplementary Table 3.
Monitoring population: HbA1c
According to Diabetes Canada guidelines, patients with diabetes should have their HbA1c levels tested twice per year if their glycemic index is optimal (HbA1c ≤7.0%), or four-times per year if their glycemic index is suboptimal (HbA1c >7.0%). It was assumed that patients not adhering to testing guidelines would have one HbA1c test annually. The number of tests for each subgroup and related testing costs is presented in Supplementary Table 4. The average testing cost per patient per year in the monitoring population was $16.44 and $41.14 for traditional laboratory testing and Afinion 2 HbA1c POC in Canada and €14.82 and €13.94 in Italy, respectively (Table 3).
The number of consultations attributed to each subgroup varied between comparators, as patients within the Afinion 2 POC cohort can receive both the monitoring test and follow-up consultation in one visit, whereas patients in the traditional laboratory testing cohort may need to book a separate secondary visit with their PCP to discuss their laboratory results, in addition to the primary visit to receive the central laboratory requisition. To be conservative, the traditional laboratory cohort with optimal glycemic control (requiring two central laboratory tests per year) was assumed to have a total of two consultations per year. It was assumed that patients in the traditional laboratory cohort with suboptimal glycemic control (requiring four central laboratory tests per year) would have six consultations per year (two additional consultations for follow-up to modify treatment plans as needed). Patients who are not adhering to testing guidelines were assumed to have one laboratory test and two consultations per year. Afinion 2 POC testing allows for patient evaluation, HbA1c testing, discussion of test results and any subsequent treatment modification to occur within one visit, removing the need for the patient to book a separate follow-up consultation to review results of testing completed at a central laboratory. Therefore, it was assumed the Afinion 2 POC cohort will have equivalent numbers of tests and consultations (i.e., optimal glycemic control cohort: two consultations; suboptimal glycemic control cohort: four consultations; patients not adhering to testing guidelines: one consultation). Number of consultations for each subgroup and related costs are presented in Supplementary Table 4. In Canada, the average consultation costs per patient per year in the monitoring population was $284.27 and $198.04 for traditional laboratory testing and Afinion 2 HbA1c POC, respectively. There is no consultation cost associated for the Italian healthcare system as they operate under a per-capita billing system and therefore do not charge the public system per patient visit (Table 3).
Monitoring population: lipid panel
According to Canadian Cardiovascular Society for the Management of Dyslipidemia guidelines patients with dyslipidemia should have their lipid panel levels tested annually [33]. However, patients who are previously diagnosed but require a pharmacological medication change (cohort two) should be assessed twice before starting new therapy, and then repeated 8–12 weeks after dose adjustment [34], totaling three lipid panel tests. In addition, patients who are newly diagnosed and initiating pharmacological treatment (cohort three) are recommended to follow the same testing guidelines, two assessments prior to beginning pharmacological therapy and an additional test 8–12 weeks after initiation [34]. For the model, one of the tests for the newly diagnosed patients were assumed to be the initial screening test, therefore, two lipid panel tests were included for this cohort. For patients not adhering to testing guidelines, it was assumed that half of this cohort will receive one lipid panel test per year. The number of tests for each subgroup and related testing costs is presented in Supplementary Table 5. The average testing cost per patient per year in the monitoring population was $9.67 and $28.65 for traditional laboratory testing and Afinion 2 lipid panel POC in Canada and €5.04 and €11.15 in Italy, respectively (Table 3).
The number of consultations attributed to each subgroup varied between comparators, as patients within the Afinion 2 lipid panel POC comparator can receive both the monitoring test and follow-up consultation in one visit, whereas patients in the traditional laboratory testing comparator may need to book a separate secondary visit with their PCP to discuss their laboratory results, in addition to the primary visit to receive the central laboratory requisition. To be conservative, the traditional laboratory cohort with stably managed patients with dyslipidemia (requiring one central laboratory test per year) was assumed to have a total of one consultation per year. It was assumed that patients in the traditional laboratory cohort with uncontrolled lipid levels (requiring three central laboratory tests per year) would have five consultations per year (two additional consultations for follow-up to assess if the pharmacological treatment is reducing lipid levels appropriately). Last, it was assumed that patients in the traditional laboratory cohort who are newly diagnosed and require pharmacological intervention (requiring two central laboratory tests per year) would have four consultations per year (two additional consultations for follow-up to assess if the pharmacological treatment is reducing lipid levels appropriately). When considering patients who are not adhering to testing guidelines, it was assumed these patients have an average of one consultation per year. This is aligned with previous BIMs analyzing POCT which outlines that a greater number of consultations is needed for patients with no optimal control and using the central lab compared with POCT users [12].
Afinion 2 lipid panel POC testing allows for patient evaluation, lipid panel testing, discussion of test results and any subsequent treatment modification to occur within one visit, removing the need for the patient to book a separate follow-up consultation to review results of lipid panel testing completed at a central laboratory. Therefore, it was assumed the Afinion 2 POC cohort will have equivalent numbers of tests and consultations (i.e., stably controlled cohort: one consultation; uncontrolled lipid levels cohort: three consultations; newly diagnosed patients requiring pharmacological intervention cohort: two consultations; patients not adhering to testing guidelines: one consultation per test). Number of consultations for each subgroup and related costs are presented in Supplementary Table 5. The average consultation costs per patient per year in the monitoring population was $138.90 and $102.11 for traditional laboratory testing and Afinion 2 lipid panel POC, respectively; additionally, alike to the HbA1c scenario, there is no consultation cost associated for the Italian perspective (Table 3).
Indirect cost inputs
Indirect cost inputs were included in the analysis to capture the societal impact of the current testing pathway. Currently, with traditional laboratory testing, patients who are required to schedule a visit with their PCP to obtain a central laboratory blood test requisition, travel to the central laboratory to complete blood work and then schedule a re-consultation with their PCP if results indicate the need for initiation of treatment or treatment modifications, incur significant costs related to time off work and transportation. A detailed list of indirect cost inputs considered in this BIM are outlined in Supplementary Tables 6 & 7 for the monitoring and screening population, respectively.
Model analyses & outputs
The BIM presented in this study calculated the total costs in a world without Afinion 2 POCT and compared with a world with Afinion 2 POCT to calculate the incremental budget impact (IBI) of introducing Afinion 2 POCT in PC for the screening and monitoring of HbA1c for diabetes, and lipid levels for patients with dyslipidemia, over a 5-year forecast period. Additionally, disaggregated results by cost category (testing costs, consultation costs, indirect-consultation costs and indirect central laboratory testing-related costs) were delineated to understand the benefits Afinion 2 POCT can provide in both direct and indirect cost categories. Furthermore, to fully elucidate the healthcare efficiencies that could be gained, a supplemental analysis estimating the total number of consultations in a world with or without Afinion 2 POCT was conducted to understand how many PC consultations could be avoided if Afinion 2 POC was implemented. A societal perspective (including both direct and indirect costs) was considered in the base case analysis, while a healthcare payer perspective (including direct costs only) was considered in a scenario analysis. The IBI and difference in PCP consultations in both Canada and Italy are presented, however no statistical testing was performed.
Scenario analyses
Assumptions in the base case analysis are associated with uncertainty that may impact the BIA results. To explore how changes in key assumptions affect the BIA results, several scenario analyses were conducted.
The first scenario considered a healthcare payer perspective in which only direct costs (i.e., testing and consultation costs that would be incurred by the Canadian or Italian healthcare system) were included.
A second scenario was included to understand how the BIA would be affected if a proportion of patients who would be attending PC are diverted to a community pharmacy for HbA1c or lipid panel testing, as community pharmacies within Canada have begun piloting POC testing [35]. This scenario analysis assumes that pharmacists can modify treatment as necessary and eliminate the need for patients to visit their PCP [35]. For this analysis, 25% of the Afinion 2 POCT users were assumed to be tested in a pharmacy setting, with the remaining 75% of patients tested in a PCP office. A third scenario analysis assumed 100% of the Afinion 2 POCT users were tested in a pharmacy setting (0% of patients tested in a PCP office).
The purpose of a fourth scenario analysis was to understand how the BIA would be affected if patients utilizing traditional laboratory testing re-consulted with their PCP more frequently (compared with the base case) to discuss HbA1c or lipid panel results to make the required treatment adjustments. This scenario assumed that all patients utilizing traditional laboratory testing had one follow-up consultation per monitoring test, and that 10% of screening patients had a follow-up consultation. The base case included conservative estimates regarding the number of consultations that patients utilizing the traditional laboratory route are subject to have, detailed in Supplementary Tables 4 & 5; additionally, the base case assumes that all patients being screened for diabetes or dyslipidemia were consulting for another reason and were not attributed a separate screening consultation cost.
Results
Incremental budget impact: HbA1c
Total costs in a world without Afinion 2 POC HbA1c testing and in a world with Afinion 2 POC HbA1c testing, as well as the IBI over the time horizon, is presented in Table 4. Utilization of Afinion 2 POC HbA1c testing for the screening and monitoring of diabetic patients attending PC in Canada resulted in an incremental budget impact of -$28,190,791 in year 1, -$85,617,177 in year 2, -$144,395,534 in year 3, -$204,473,121 in year 4 and -$295,330,069 in year 5, for a cumulative 5-year budget impact of -$758,006,692. In Italy, the incremental budget impact was -€53,414,285 in year 1 -€159,970,008 in year 2, -€266,070,986 in year 3, -€371,608,081 in year 4, and -€529,595,403 in year 5, for a cumulative 5-year budget impact of -€1,380,658,764.
| Canada | Baseline (2024) | Year 1 (2025) | Year 2 (2026) | Year 3 (2027) | Year 4 (2028) | Year 5 (2029) | 5-year total |
|---|---|---|---|---|---|---|---|
| World without Afinion 2 POC HbA1c testing | |||||||
| Traditional laboratory | $1,120,799,528 | $1,135,151,382 | $1,149,175,017 | $1,162,867,628 | $1,176,209,577 | $1,189,198,061 | $5,812,601,665 |
| Afinion 2 | $0 | $0 | $0 | $0 | $0 | $0 | $0 |
| Total | $1,120,799,528 | $1,135,151,382 | $1,149,175,017 | $1,162,867,628 | $1,176,209,577 | $1,189,198,061 | $5,812,601,665 |
| World with Afinion 2 POC HbA1c testing | |||||||
| Traditional laboratory | $1,120,799,528 | $1,078,393,813 | $976,798,764 | $872,150,721 | $764,536,225 | $594,599,030 | $4,286,478,554 |
| Afinion 2 | $0 | $28,566,778 | $86,759,075 | $146,321,373 | $207,200,231 | $299,268,961 | $768,116,419 |
| Total | $1,120,799,528 | $1,106,960,591 | $1,063,557,839 | $1,018,472,094 | $971,736,456 | $893,867,992 | $5,054,594,973 |
| Incremental budget impact | $0 | -$28,190,791 | -$85,617,177 | -$144,395,534 | -$204,473,121 | -$295,330,069 | -$758,006,692 |
| Italy | |||||||
| World without Afinion 2 POC HbA1c testing | |||||||
| Traditional laboratory | €1,764,973,556 | €1,762,272,984 | €1,759,272,349 | €1,755,671,587 | €1,751,470,698 | €1,747,269,809 | €8,775,957,427 |
| Afinion 2 | €0 | €0 | €0 | €0 | €0 | €0 | €0 |
| Total | €1,764,973,556 | €1,762,272,984 | €1,759,272,349 | €1,755,671,587 | €1,751,470,698 | €1,747,269,809 | €8,775,957,427 |
| World with Afinion 2 POC HbA1c testing | |||||||
| Traditional laboratory | €1,764,973,556 | €1,674,159,335 | €1,495,381,497 | €1,316,753,690 | €1,138,455,954 | €873,634,904 | €6,498,385,380 |
| Afinion 2 | €0 | €34,699,364 | €103,920,845 | €172,846,911 | €241,406,663 | €344,039,501 | €896,913,284 |
| Total | €1,764,973,556 | €1,708,858,699 | €1,599,302,341 | €1,489,600,601 | €1,379,862,616 | €1,217,674,405 | €7,395,298,664 |
| Incremental budget impact | €0 | -€53,414,285 | -€159,970,008 | -€266,070,986 | -€371,608,081 | -€529,595,403 | -€1,380,658,764 |
Bold values represent the main take-away outcomes reported in this table: the budget impact for each scenario (i.e., world with and without intervention) and the total incremental budget impact for each geographic location (i.e., world with intervention minus world without intervention).
HbA1c: Hemoglobin A1c; POC: Point-of-care.
Disaggregated results by cost category in a world without Afinion 2 POC HbA1c testing and in a world with Afinion 2 POC HbA1c testing are presented in Figure 1. Implementation of Afinion 2 POC HbA1c testing in Canada resulted in a cumulative 5-year incremental budget impact of $85,386,759 in testing costs, -$136,096,723 in consultation costs, -$90,713,351 in indirect consultation-related costs and -$616,583,377 in indirect central laboratory testing-related costs. In Italy, the cumulative 5-year incremental budget impact was -€6,391,954 in testing costs, €0 in consultation costs, -€275,633,044 in indirect consultation-related costs and -€1,098,633,765 in indirect central laboratory testing-related costs.
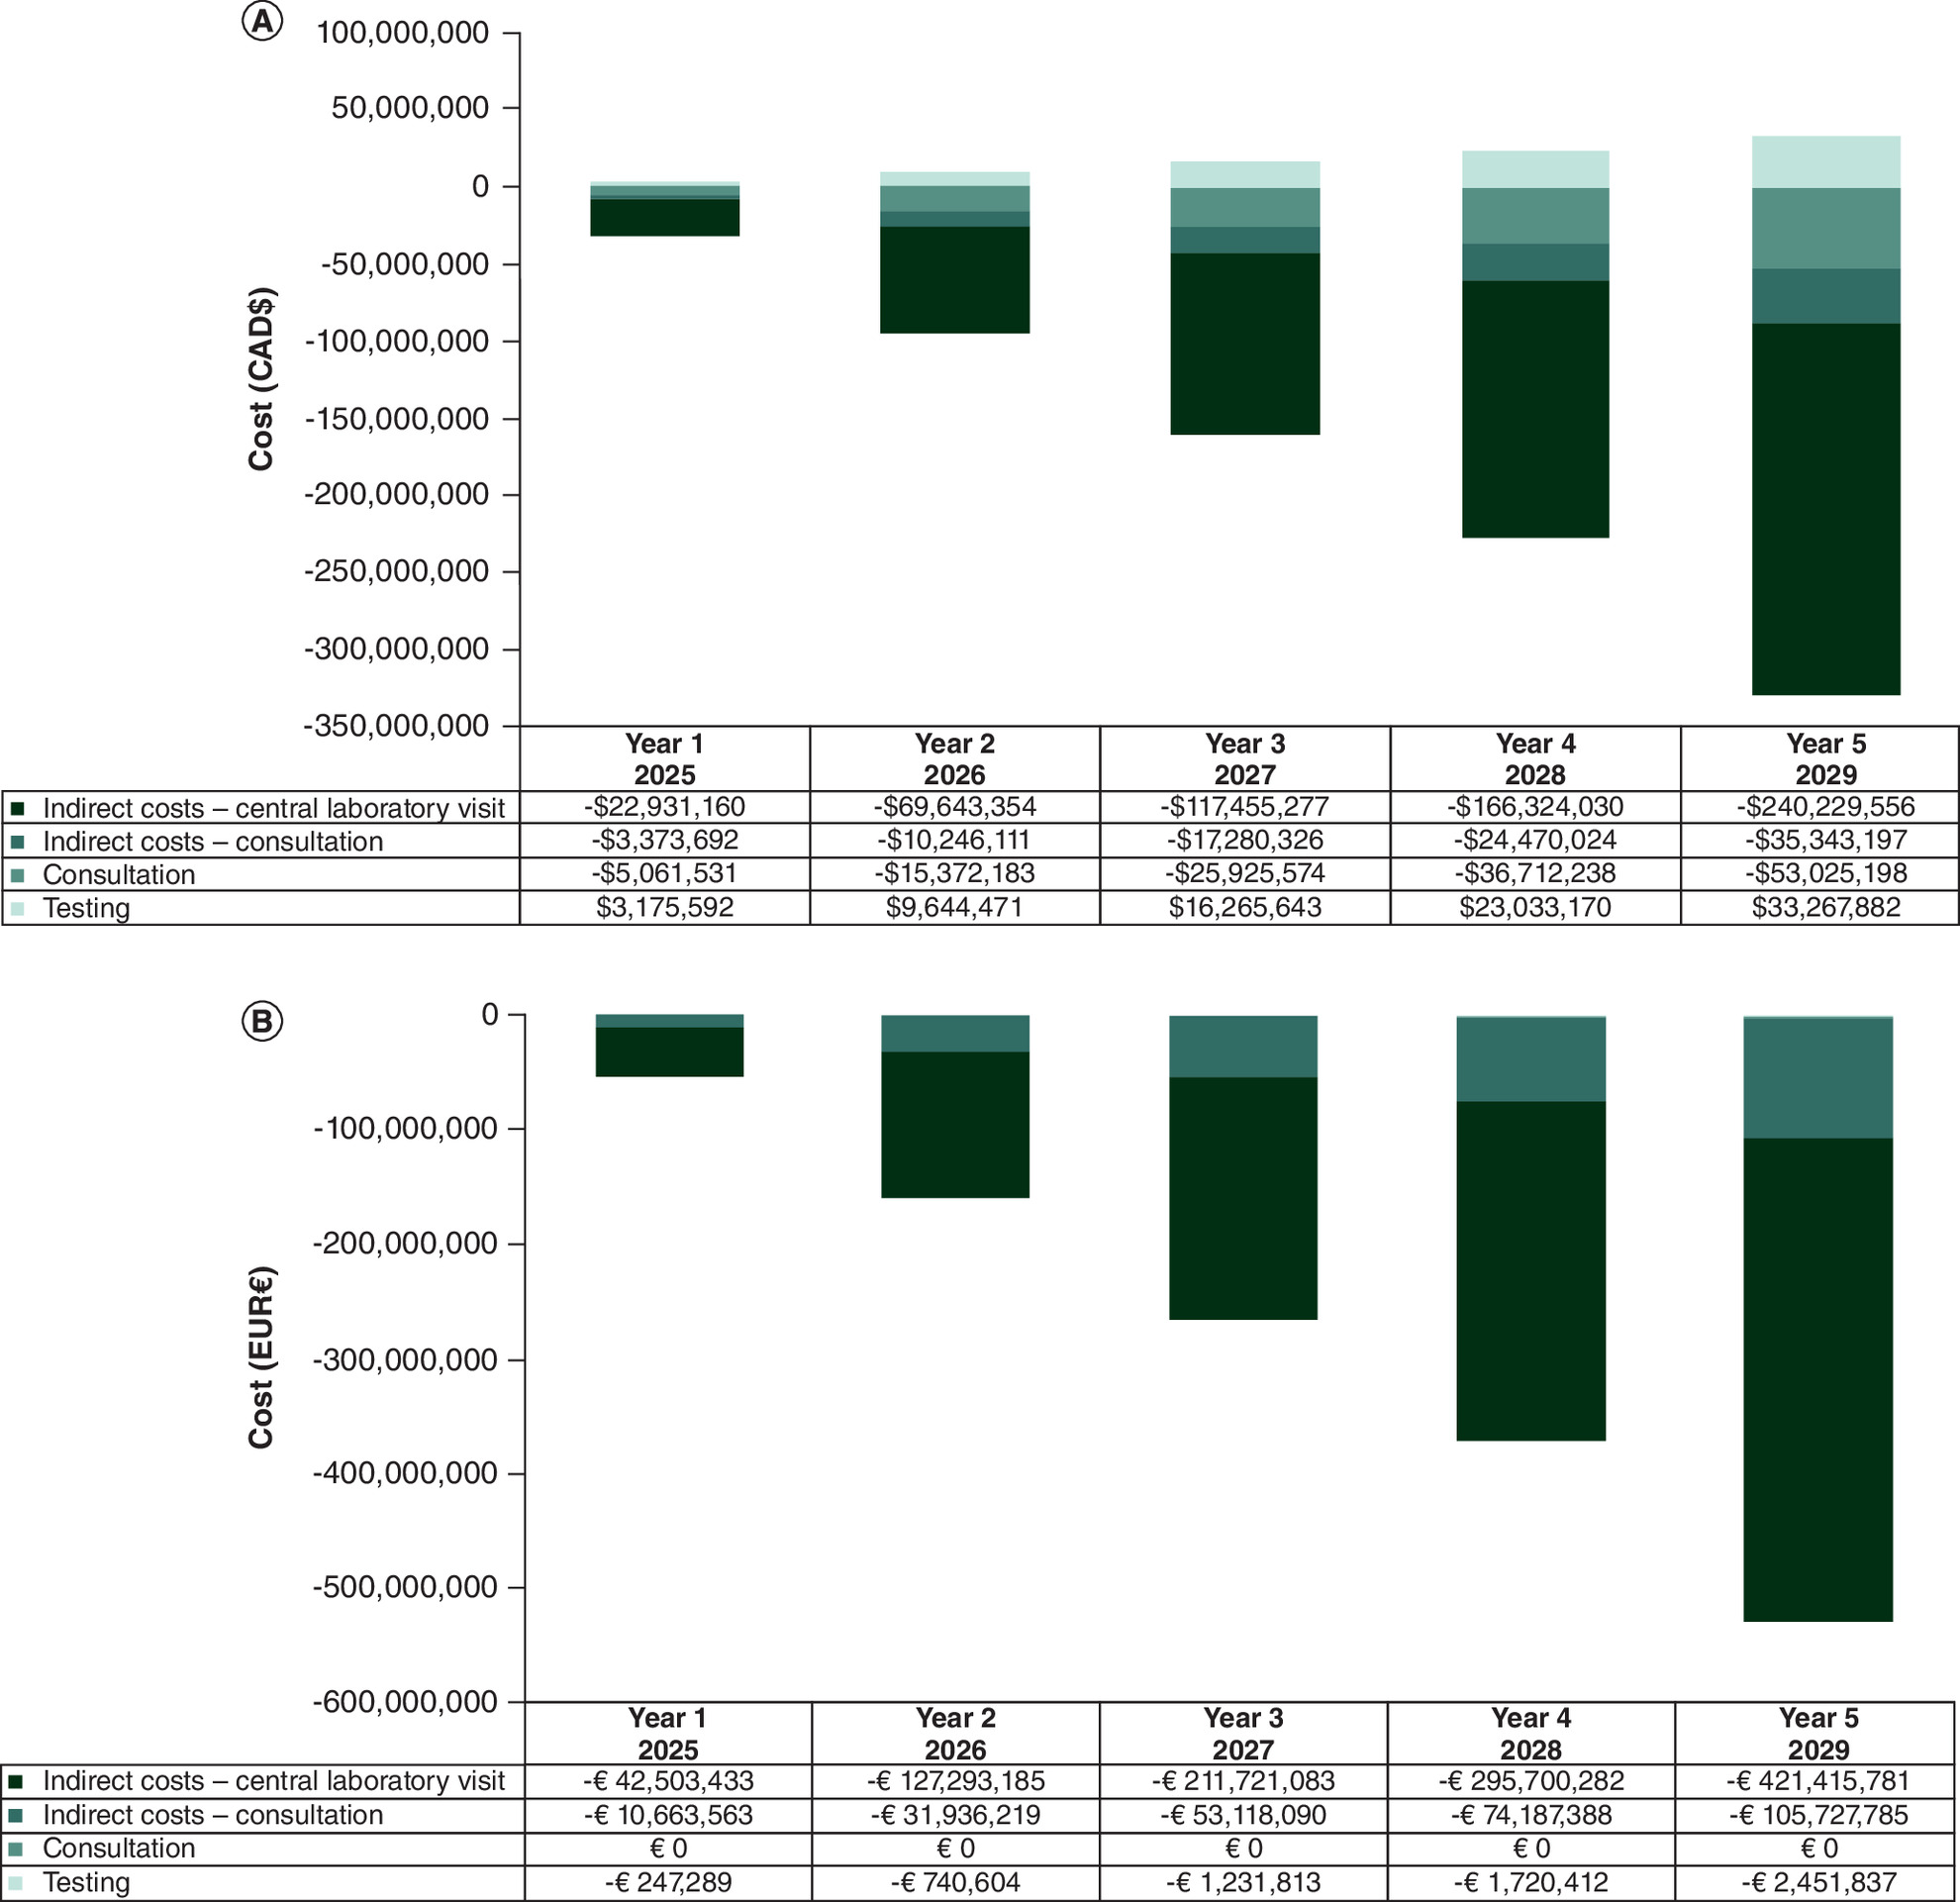
Figure 1. Disaggregated results by cost category for budget impact of Afinion™ 2 POC HbA1c testing for the screening and monitoring of patients with diabetes attending primary care.
(A) Canada and (B) Italy.
CAD: Canadian dollar; EUR: Euro; HbA1c: Hemoglobin A1c; POC: Point-of-care.
Incremental budget impact: lipids
Total costs in a world without Afinion 2 POC lipid panel testing and in a world with Afinion 2 POC lipid panel testing, as well as the IBI over the time horizon, are presented in Table 5. Utilization of Afinion 2 POC lipid panel testing for the screening and monitoring of patients with dyslipidemia attending PC in Canada resulted in an incremental budget impact of -$27,017,278 in year 1, -$82,053,147 in year 2, -$138,384,706 in year 3, -$195,961,413 in year 4 and -$283,036,212 in year 5, for a cumulative 5-year budget impact of -$726,452,755. In Italy, the incremental budget impact was -€32,953,738 in year 1, -€98,692,881 in year 2, -€164,151,472 in year 3, -€229,262,177 in year 4 and -€326,731,848 in year 5, for a cumulative 5-year budget impact of -€851,792,115.
| Canada | Baseline (2024) | Year 1 (2025) | Year 2 (2026) | Year 3 (2027) | Year 4 (2028) | Year 5 (2029) | 5-year total |
|---|---|---|---|---|---|---|---|
| World without Afinion 2 POC lipid panel testing | |||||||
| Traditional laboratory | $1,216,986,328 | $1,232,569,855 | $1,247,796,995 | $1,262,664,703 | $1,277,151,657 | $1,291,254,810 | $6,311,438,020 |
| Afinion 2 | $0 | $0 | $0 | $0 | $0 | $0 | $0 |
| Total | $1,216,986,328 | $1,232,569,855 | $1,247,796,995 | $1,262,664,703 | $1,277,151,657 | $1,291,254,810 | $6,311,438,020 |
| World with Afinion 2 POC lipid panel testing | |||||||
| Traditional laboratory | $1,216,986,328 | $1,170,941,362 | $1,060,627,446 | $946,998,528 | $830,148,577 | $645,627,405 | $4,654,343,317 |
| Afinion 2 | $0 | $34,611,215 | $105,116,403 | $177,281,470 | $251,041,667 | $362,591,193 | $930,641,947 |
| Total | $1,216,986,328 | $1,205,552,577 | $1,165,743,849 | $1,124,279,997 | $1,081,190,244 | $1,008,218,598 | $5,584,985,265 |
| Incremental budget impact | $0 | -$27,017,278 | -$82,053,147 | -$138,384,706 | -$195,961,413 | -$283,036,212 | -$726,452,755 |
| Italy | |||||||
| World without Afinion 2 POC lipid panel testing | |||||||
| Traditional laboratory | €1,075,676,201 | €1,074,030,317 | €1,072,201,558 | €1,070,007,047 | €1,067,446,784 | €1,064,886,521 | €5,348,572,227 |
| Afinion 2 | €0 | €0 | €0 | €0 | €0 | €0 | €0 |
| Total | €1,075,676,201 | €1,074,030,317 | €1,072,201,558 | €1,070,007,047 | €1,067,446,784 | €1,064,886,521 | €5,348,572,227 |
| World with Afinion 2 POC lipid panel testing | |||||||
| Traditional laboratory | €1,075,676,201 | €1,020,328,801 | €911,371,324 | €802,505,285 | €693,840,410 | €532,443,260 | €3,960,489,081 |
| Afinion 2 | €0 | €20,747,778 | €62,137,353 | €103,350,290 | €144,344,197 | €205,711,413 | €536,291,031 |
| Total | €1,075,676,201 | €1,041,076,580 | €973,508,677 | €905,855,575 | €838,184,607 | €738,154,673 | €4,496,780,112 |
| Incremental budget impact | €0 | -€32,953,738 | -€98,692,881 | -€164,151,472 | -€229,262,177 | -€326,731,848 | -€851,792,115 |
Bold values represent the main take-away outcomes reported in this table (i.e., the starting population for each subgroup).
POC: Point-of-care.
Disaggregated results by cost category in a world without Afinion 2 POC lipid panel testing and in a world with Afinion 2 POC lipid panel testing is presented in Figure 2. Implementation of Afinion 2 POC lipid panel testing in Canada resulted in a cumulative 5-year incremental budget impact of $133,819,060 in testing costs, -$131,135,049 in consultation costs, -$81,013,758 in indirect consultation-related costs and -$648,123,009 in indirect central laboratory testing-related costs. In Italy, the cumulative 5-year incremental budget impact was €55,962,879 in testing costs, €0 in consultation costs (due to the per-capita billing system), -€95,946,161 in indirect consultation-related costs and -€811,808,833 in indirect central laboratory testing-related costs.
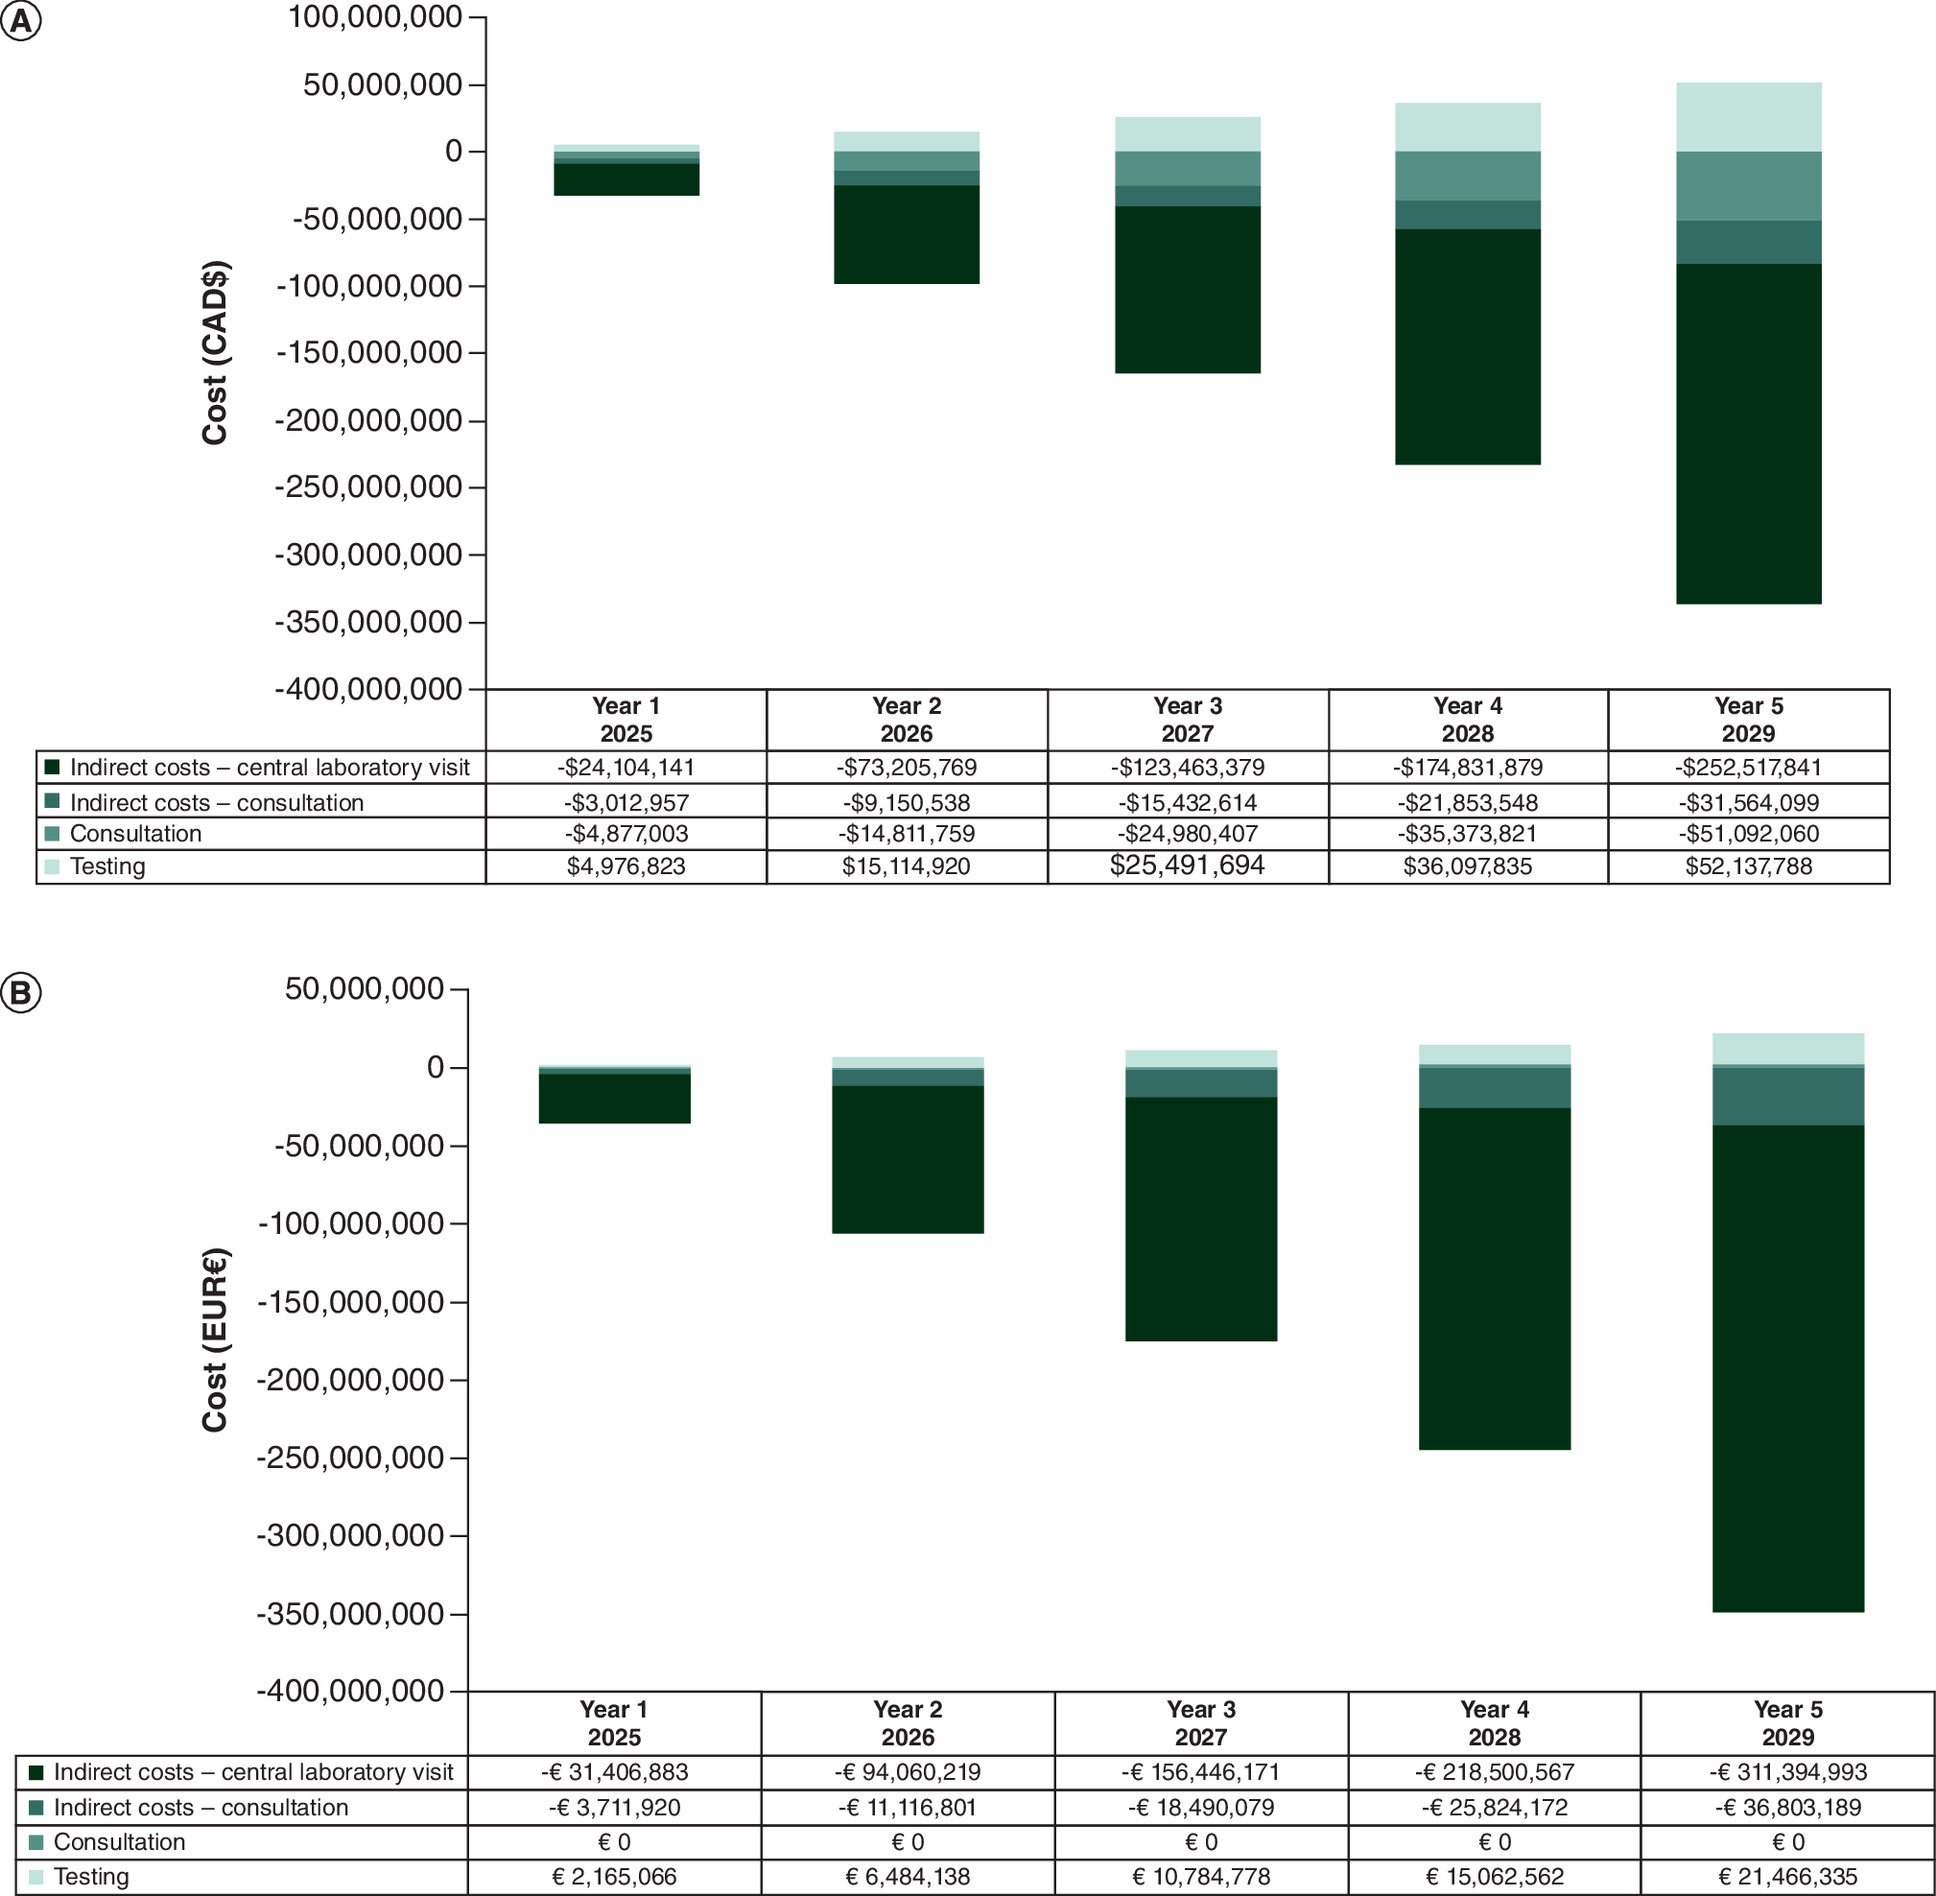
Figure 2. Disaggregated results by cost category for budget impact of Afinion™ 2 POC lipid panel testing for the screening and monitoring of patients with dyslipidemia attending primary care.
(A) Canada and (B) Italy.
CAD: Canadian dollar; EUR: Euro; POC: Point-of-care.
Number of consultations: HbA1c
A supplemental analysis of the total number of consultations in a world with or without Afinion 2 POC HbA1c testing was conducted to understand efficiencies that could be gained in the healthcare system. Results are presented in Figure 3. In Canada, it was estimated that 57,945 consultations were avoided in year 1, 175,984 consultations were avoided in year 2, 296,801 consultations were avoided in year 3, 420,289 consultations were avoided in year 4 and 607,043 consultations were avoided in year 5, for a cumulative 5-year total of 1,558,062 consultations avoided. In Italy, it was estimated that 191,981 consultations were avoided in year 1, 574,961 consultations were avoided in year 2, 956,307 consultations were avoided in year 3, 1,335,627 consultations were avoided in year 4 and 1,903,462 consultations were avoided in year 5, for a cumulative 5-year total of 4,962,338 consultations avoided.
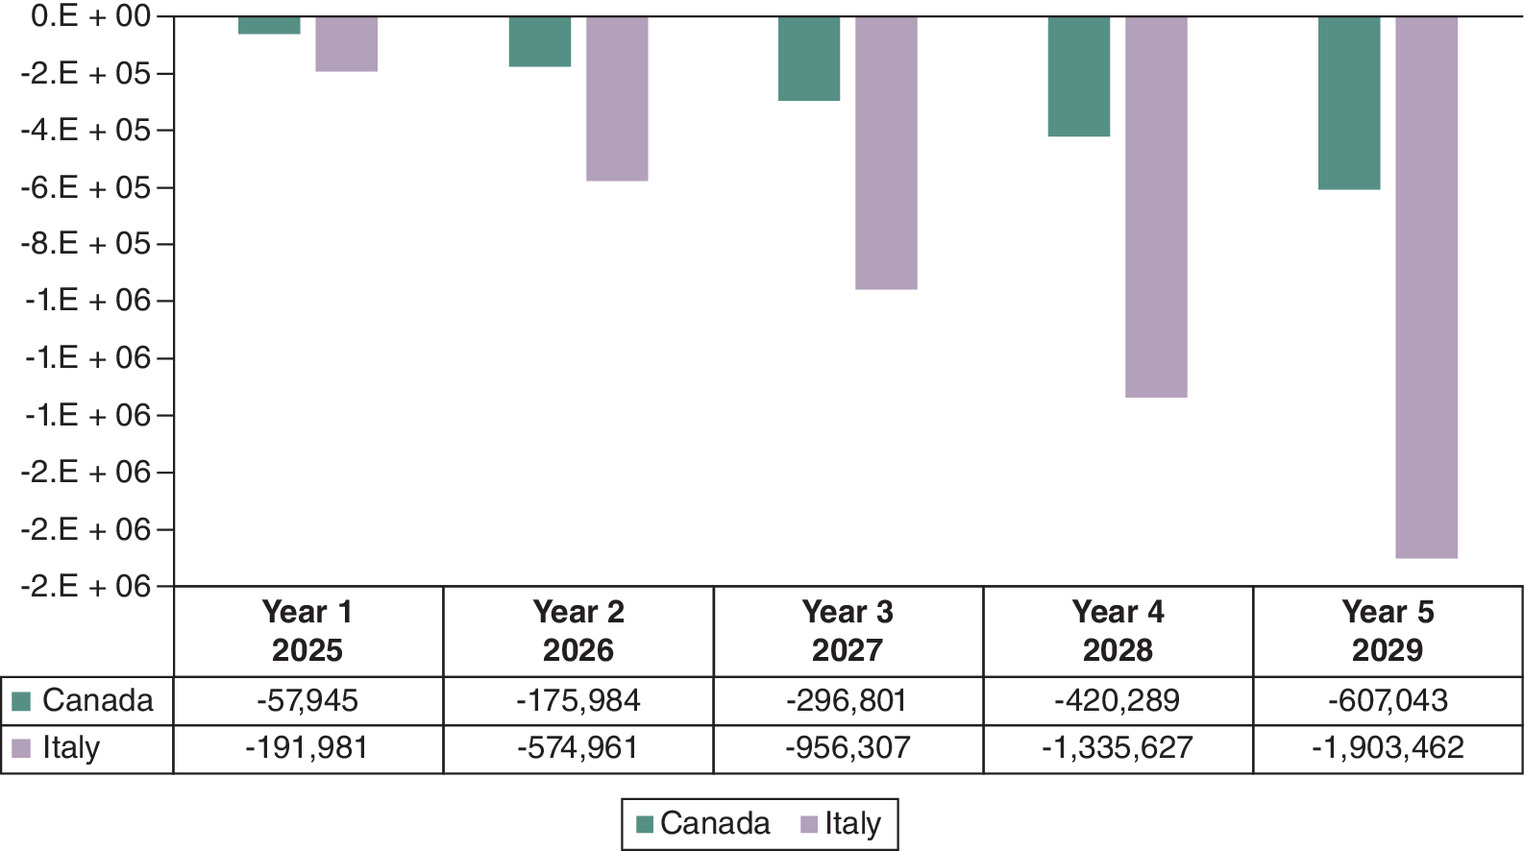
Figure 3. Difference in total number of HbA1c consultations for the screening and monitoring of patients with diabetes attending primary care for patients utilizing Afinion™ 2 POCT.
HbA1c: Hemoglobin A1c; POCT: Point-of-care testing.
Number of consultations: lipids
A supplemental analysis of the total number of consultations in a world with or without Afinion 2 POC lipid panel testing was conducted to understand efficiencies that could be gained in the healthcare system. Results are presented in Figure 4. In Canada, it was estimated that 55,833 consultations were avoided in year 1, 169,568 consultations were avoided in year 2, 285,981 consultations were avoided in year 3, 404,966 consultations were avoided in year 4 and 584,912 consultations were avoided in year 5, for a cumulative 5-year total of 1,501,260 consultations avoided. In Italy, it was estimated that 75,480 consultations were avoided in year 1, 226,056 consultations were avoided in year 2, 375,988 consultations were avoided in year 3, 525,124 consultations were avoided in year 4 and 748,378 consultations were avoided in year 5, for a cumulative 5-year total of 1,951,026 consultations avoided.
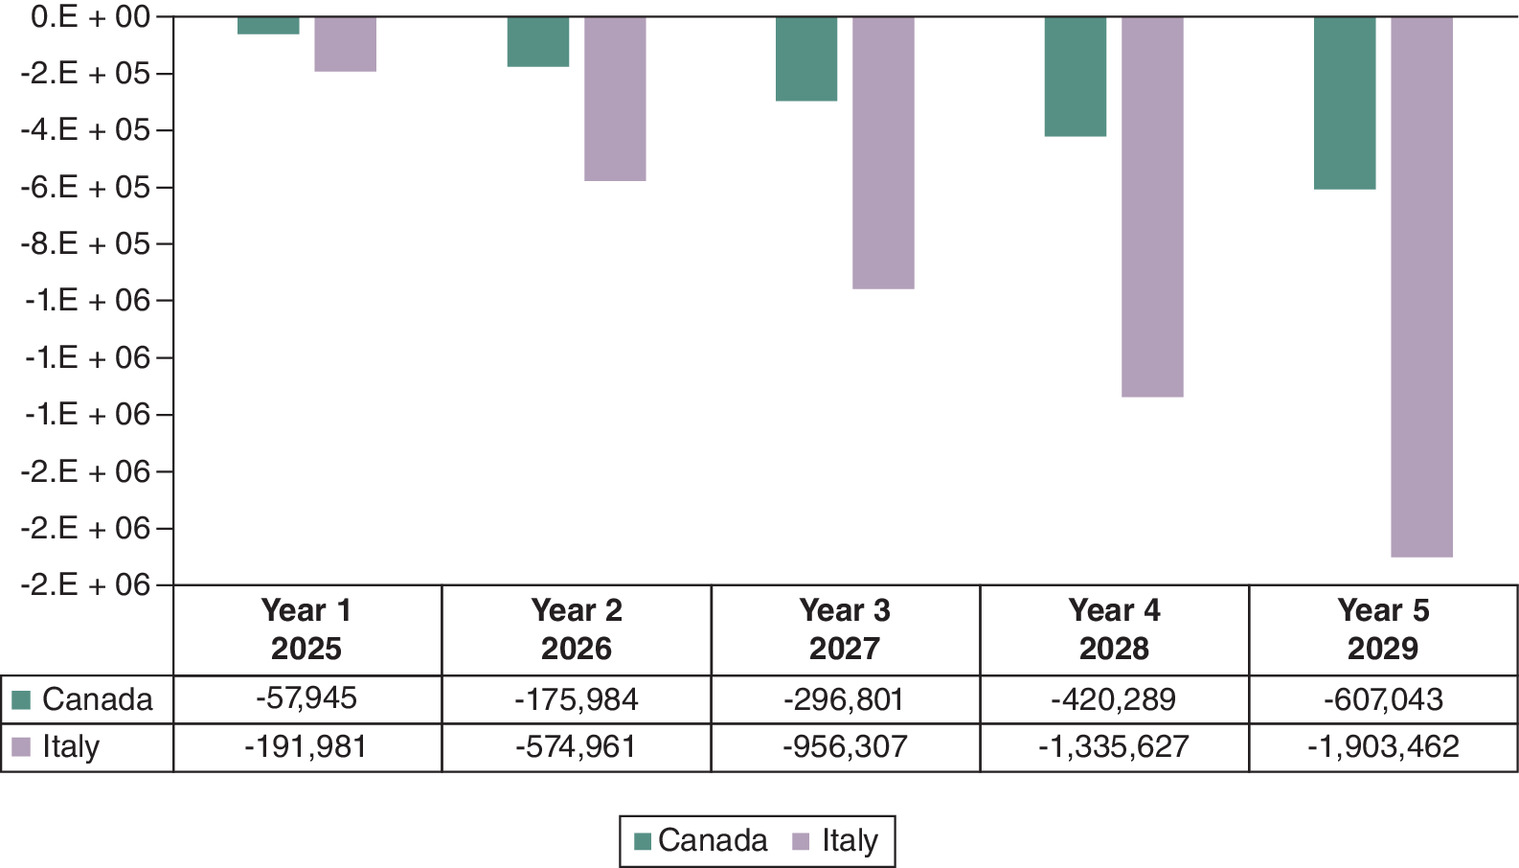
Figure 4. Difference in total number of lipid panel consultations for the screening and monitoring of patients with diabetes attending primary care for patients utilizing Afinion™ 2 POCT.
POCT: Point-of-care testing.
Scenario analyses
Table 6 summarizes the results of the four scenario analyses previously described: exclusion of indirect costs, inclusion of Afinion POC testing in pharmacies and increased number of consultations for patients using the central laboratory. When considering HbA1c testing, all four included scenario analyses yielded a reduction in budget impact in a world with Afinion 2 POCT, compared with a world without, in both Canada and Italy. When examining the scenario analysis results for lipid panel testing, the exclusion of indirect costs (scenario one) estimated a budget increase to the healthcare system in both Canada and Italy, however, all other scenario analyses conducted resulted in a reduction in budget impact in both countries. Detailed results can be found in the Supplementary Materials – HbA1c scenario analyses and lipid panel scenario analyses.
| Scenario | Canada | Italy |
|---|---|---|
| 5-year incremental budget impact | 5-year incremental budget impact | |
| HbA1c base case | -$758,006,692 | -€1,380,658,764 |
| Scenario #1: healthcare payer perspective | -$50,709,964 | -€6,391,954 |
| Scenario #2: pharmacy administration of Afinion™ 2 POC HbA1c test (25% of Afinion 2 cohort) | -$830,063,927 | -€1,424,151,456 |
| Scenario #3: pharmacy administration of Afinion 2 POC HbA1c test (100% of Afinion 2 cohort) | -$1,046,235,633 | -€1,554,629,533 |
| Scenario #4: increased number of consultations for patients using the central laboratory | -$1,164,108,278 | -€1,770,709,221 |
| Lipid panel base case | -$726,452,755 | -€851,792,115 |
| Scenario #1: healthcare payer perspective | $2,684,011 | €55,962,879 |
| Scenario #2: pharmacy administration of Afinion 2 POC HbA1c test (25% of Afinion 2 cohort) | -$791,000,584 | -€873,991,183 |
| Scenario #3: pharmacy administration of Afinion 2 POC HbA1c test (100% of Afinion 2 cohort) | -$984,644,070 | -€940,588,386 |
| Scenario #4: increased number of consultations for patients using the central laboratory | -$1,238,636,250 | -€1,140,383,969 |
HbA1c: Hemoglobin A1c; POC: Point-of-care.
Discussion
Currently, screening and monitoring of patients with diabetes and dyslipidemia usually require a multi-step process involving a central laboratory visit and multiple PCP visits for each HbA1c or lipid panel test. The adoption of Afinion 2 POCT can provide a streamlined patient care pathway by reducing the number of PCP and central laboratory visits, resulting in decreased healthcare resource utilization and increased efficiency for both healthcare providers and patients. The objective of this analysis was to determine the budget impact of introducing Afinion 2 POCT for screening and monitoring of HbA1c or lipids in patients with suspected and known diabetes or dyslipidemia, respectively, attending PC. Analyses were conducted for Canada and Italy to explore the budget impact in two countries with differing public healthcare systems.
The BIA estimated that utilization of Afinion 2 POC HbA1c testing resulted in a cumulative 5-year budget impact of -$758,006,692 (-$50,709,964 direct, -$707,296,728 indirect) and -€1,380,658,764 (-€6,391,954 direct, -€1,374,266,809 indirect), in Canada and Italy, respectively. Furthermore, the BIA estimated that utilization of Afinion 2 POC lipid panel testing resulted in a cumulative 5-year budget impact of and -$726,452,755 ($2,684,011 direct, -$729,136,766 indirect) and -€851,792,115 (€55,962,879 direct, -€907,754,993 indirect) in Canada and Italy, respectively. Both indirect cost categories (consultation and laboratory testing) were cost savings for both POC tests in Canada and Italy. The primary driver in direct healthcare cost savings in Canada was the reduction in PC consultations, resulting in an estimated cumulative savings of -$136,096,723 and -$131,135,049 over the 5-year time horizon for HbA1c and lipid panel testing, respectively. Since Italy's healthcare system is based on a per-capita billing system, there were no cost savings associated with avoided consultations. However, the substantial cost savings in other categories (HbA1c: indirect costs [-€1,374,266,809]; lipid panel: indirect costs [-€907,754,993] and HbA1c testing costs [-€6,391,954]) resulted in an overall net budget impact of cost savings. Additionally, the analyses estimated that 1,558,062 and 1,501,260 PCP consultations in Canada and 4,962,338 and 1,951,026 PCP consultations in Italy were avoided with implementation of POCT for HbA1c and lipid panel, respectively.
In the scenario analyses where indirect costs were excluded (scenario 1), there was an increase in budget impact compared with the base case in which both direct and indirect costs were included. When considering HbA1c testing, the exclusion of indirect costs still resulted in cost savings in the 5-year budget impact in both Canada and Italy (-$50,709,964, and -€6,391,954, respectively). However, when considering lipid panel testing, the exclusion of indirect costs resulted in an increased budget impact in both countries ($2,684,011, and €55,962,879, respectively). This result was expected given that patients are expected to significantly benefit from the increased efficiency offered by Afinion 2 POCT, including less time off from work and less transportation costs for PCP and central laboratory visits, which is reflected in only indirect costs. In the scenario analyses exploring the inclusion of pharmacy administration of Afinion 2 POCT in 25% or 100% of the Afinion 2 cohort (scenarios 2 and 3), there was an increase in cost savings compared with the base case, with a greater increase in cost savings with the assumption of 100% pharmacy administration. Lastly, the scenario assuming additional consultations for patients using the central laboratory care pathway (scenario 4), also demonstrated an increase in cost savings compared with the base case. Overall, all scenario analyses showed that the implementation of Afinion 2 POCT resulted in cost savings compared with the current patient pathway with central laboratory testing, with additional savings realized when assuming pharmacies are able to administer Afinion 2 POCT to diagnose and monitor diabetes and dyslipidemia as well as prescribe and dispense treatment as needed, and when assuming patients have a greater number of PCP consultations in the current scenario with central laboratory testing.
The results presented herein are aligned with previously published economic analyses comparing POCT to traditional laboratory testing. Alike to the Chadee et al. publication, the presented analysis observed a reduction in PCP consultations and overall budget impact, however, it should be noted that the analysis in Chadee is reflective of a healthcare perspective, whereas this analysis includes a societal base case and a healthcare perspective scenario analysis [12]. Furthermore, this analysis expanded the geographical region of interest to both Canada and Italy, whereas the Chadee publication is restricted to Canada only [12]. Therefore, the presented analysis strengthens and continues to build on the groundwork presented in the Chadee publication. Moreover, similar trends were observed in the CEA conducted by Laurence et al., which reported a non-significant increase in direct healthcare costs, but a significant reduction in indirect costs when analyzing HbA1c and lipid panel POCT compared with traditional laboratory testing [16]. The results of the presented analysis demonstrated a reduction in budget impact for both direct and indirect costs in HbA1c POCT in both Canada and Italy, whereas lipid panel POCT testing resulted in an increased budget impact when considering direct costs, and a reduction in budget impact when considering indirect costs. The differences observed in the results between the two studies is likely attributed to the difference in cost parameters and model type used between the two studies (Laurence presented a CEA, whereas this analysis detailed a BIM). Lastly, the Laurence study was completed in an Australian population, whereas this study focuses on the Canadian and Italian population. However, the general alignment in results further reinforces the benefits POCT can provide to various populations, regardless of geographical location.
A strength of this analysis was the model was informed with epidemiological data relevant to each country's specific clinical practices and is aligned with a previous Ontario-based BIA of other POC testing devices [12]. Furthermore, the analysis was comprehensive in the inclusion of both the screening and monitoring populations. In addition, a conservative approach to costing was taken whenever possible to avoid over-estimating the potential cost savings, such as assuming no difference in number of consultations for patients with controlled HbA1c or lipid levels, or patients undergoing screening.
The main limitations of this study are inherent to economic models that require large amounts of data inputs and include the need for analysis assumptions. Notably the potential additional cost offsets with Afinion 2 POCT resulting from differences in downstream healthcare resource utilization (HCRU) such as hospitalizations and emergency room visits were not considered, due to a lack of available literature to support the Afinion 2 POCT cohort. Furthermore, administrative duties such as billing and record maintenance were not included in the model as it was assumed that these costs would be equivalent between both cohorts of interest. Additionally, due to a lack of published Italian data, some Canadian inputs were adapted to inform the Italian BIM; however, when more geographically relevant data are available, the Italian BIM can be updated accordingly. Lastly, the future uptake of Afinion 2 POCT in Canada and Italy is unclear; therefore, the market share used in these analyses were based on best estimates.
Future research on POCT should continue to examine pilot studies utilizing the Afinion 2 analyzer, including long term follow-up periods as this will help to inform downstream HCRU such as hospitalizations and emergency room visits, and can strengthen subsequent economic models. Furthermore, focusing on patient reported outcomes such as testing adherence, patient satisfaction and quality of life metrics would help to further clarify the impact POCT can provide to patients. Moreover, further economic exploration including a cost–effectiveness model could provide additional information to help healthcare providers and patients make informed decisions regarding routine testing guidance while considering both economic and clinical outcomes. Lastly, the results of this economic analysis support a more efficient alternate patient care pathway, however, adoption and adherence within routine practice are currently unknown. Future economic analyses should be completed when adoption rates are available for POCT devices such as Afinion 2.
Given the current complex patient care pathway utilized within the Canadian and Italian healthcare systems for diagnosis and monitoring of patients with diabetes or dyslipidemia, the implementation of Afinion 2 POCT is expected to provide a more efficient alternate pathway with benefits for both the healthcare systems and patients. This study demonstrates that the adoption of Afinion 2 POCT for HbA1c and lipid panel can provide efficiencies to different types of healthcare systems through reducing PCP consultations, saving time and money for patients and providing cost savings for payers.
Summary points
•
The current testing process for screening or monitoring of patients with diabetes or dyslipidemia usually involves going to their primary care physician to obtain a blood test requisition, then visiting a central laboratory testing facility to conduct the test; furthermore, dependent on the test results, patients may need to reconsult with their primary care provider to initiate or modify treatment.
•
This process is associated with high administrative burden for primary care providers, resulting in longer wait times, as well as high indirect costs for patients; therefore, there is a need to streamline the diagnostic and monitoring pathway for patients with diabetes and dyslipidemia.
•
Implementation of Afinion™ 2 point-of-care testing can address many of the unmet testing needs among patients with diabetes or dyslipidemia, as this technology can facilitate on-site testing, providing rapid test results and allowing medical decision-making to be expedited in one physician visit. This streamlined process will provide a more convenient patient care pathway, reducing the number of healthcare visits needed (both to the primary care provider office and to the central laboratory).
•
This study assessed the budget impact of introducing Afinion 2 point-of-care testing to screen and monitor patients with diabetes or dyslipidemia from the Canadian and Italian societal perspectives over a 5-year time horizon (2025 to 2029) to provide a holistic analysis of the potential budgetary and patient care pathway efficiencies that Afinion 2 point-of-care testing can offer across different types of healthcare systems.
•
The 5-year cumulative budget impact was -$758,006,692 (-$50,709,964 direct, -$707,296,728 indirect) for HbA1c point-of-care testing and -$726,452,755 ($2,684,011 direct, -$729,136,766 indirect) for lipid panel point-of-care testing in Canada and -€1,380,658,764 (-€6,391,954 direct, -€1,374,266,809 indirect) for HbA1c point-of-care testing and -€851,792,115 (€55,962,879 direct, -€907,754,993 indirect) for lipid panel point-of-care testing in Italy.
•
Cost savings for both the healthcare payer and patients were observed for HbA1c in both countries, while costs savings were only derived from patient indirect costs for lipid panel point-of-care testing.
•
The analyses estimated that 1,558,062 and 1,501,260 primary care consultations in Canada and 4,962,338 and 1,951,026 primary care consultations in Italy were avoided with point-of-care testing for HbA1c and lipid panel, respectively.
•
This study demonstrates that the adoption of Afinion 2 point-of-care testing can provide efficiencies to different types of healthcare systems through reducing primary care consultations, saving time and money for patients and providing cost savings for payers.
Author contributions
D Garcia, A Ruffolo, A Zhou, E Lazaridis and B Laurelli were responsible for the study conception and design; D Garcia, A Walczyk Mooradally and A Zhou were responsible for acquisition and analysis of data; all authors were responsible for drafting and revision of the manuscript.
Financial disclosure
This work was funded by Abbott Rapid Diagnostics. Abbott Rapid Diagnostics contracted EVERSANA to complete this work. The authors have no other relevant affiliations or financial involvement with any organization or entity with a financial interest in or financial conflict with the subject matter or materials discussed in the manuscript apart from those disclosed.
Competing interests disclosure
D Garcia, A Walczyk Mooradally and A Zhou are employees of EVERSANA. A Ruffolo, E Lazaridis and B Laurelli are employees of Abbott Rapid Diagnostics. The authors have no other competing interests or relevant affiliations with any organization/entity with a financial interest in or financial conflict with the subject matter or materials discussed in the manuscript apart from those disclosed.
Writing disclosure
No writing assistance was utilized in the production of this manuscript.
Open access
This work is licensed under the Attribution-NonCommercial-NoDerivatives 4.0 Unported License. To view a copy of this license, visit https://creativecommons.org/licenses/by-nc-nd/4.0/
Supplementary Material
File (supplementary materials.pdf)
- Download
- 309.41 KB
References
Papers of special note have been highlighted as: • of interest; •• of considerable interest
1.
Forbes JM, Cooper ME. Mechanisms of diabetic complications. Physiol. Rev. 93(1), 137–188 (2013).
2.
WHO. Global Report on Diabetes. (2016). Available at: https://www.who.int/publications/i/item/9789241565257
3.
Sun B, Luo Z, Zhou J. Comprehensive elaboration of glycemic variability in diabetic macrovascular and microvascular complications. Cardiovasc. Diabetol. 20(1), 9 (2021).
4.
Arvanitis M, Lowenstein CJ. Dyslipidemia. Ann. Intern. Med. 176(6), ITC81–ITC96 (2023).
5.
Petrie JR, Guzik TJ, Touyz RM. Diabetes, hypertension, and cardiovascular disease: clinical insights and vascular mechanisms. Can. J. Cardiol. 34(5), 575–584 (2018).
6.
Asghari S, Aref-Eshghi E, Godwin M, Duke P, Williamson T, Mahdavian M. Single and mixed dyslipidaemia in Canadian primary care settings: findings from the Canadian primary care sentinel surveillance network database. BMJ Open 5(12), e007954 (2015).
7.
Public Health Agency of Canada. Framework for Diabetes in Canada. (2022). Available at: https://www.canada.ca/en/public-health/services/publications/diseases-conditions/framework-diabetes-canada.html
8.
Mach F, Baigent C, Catapano AL et al. 2019 ESC/EAS Guidelines for the management of dyslipidaemias: lipid modification to reduce cardiovascular risk: The Task Force for the Management of Dyslipidaemias of the European Society of Cardiology (ESC) and European Atherosclerosis Society (EAS). Eur. Heart J. 41(1), 111–188 (2020).
9.
Consensus Committee. Consensus Statement on the Worldwide Standardization of the Hemoglobin A1C Measurement: The American Diabetes Association, European Association for the Study of Diabetes, International Federation of Clinical Chemistry and Laboratory Medicine, and the International Diabetes Federation. Diabetes Care 30(9), 2399–2400 (2007).
10.
Chai JH, Ma S, Heng D et al. Impact of analytical and biological variations on classification of diabetes using fasting plasma glucose, oral glucose tolerance test and HbA1c. Sci. Rep. 7(1), 13721 (2017).
11.
White-Al Habeeb NMA, Higgins V, Wolska A, Delaney SR, Remaley AT, Beriault DR. The present and future of lipid testing in cardiovascular risk assessment. Clin. Chem. 69(5), 456–469 (2023).
12.
Chadee A, Blackhouse G, Goeree R. Point-of-care hemoglobin A1c testing: a budget impact analysis. Ont. Health Technol. Assess. Ser. 14(9), 1–23 (2014).
•• Canadian health technology assessment exploring the budget impact of introducing HbA1c point-of-care testing in Ontario.
13.
Schnell O, Crocker JB, Weng J. Impact of HbA1c testing at point of care on diabetes management. J. Diabetes Sci. Technol. 11(3), 611–617 (2017).
• A review article outlining the positive impact HbA1c point-of-care testing can provide to diabetic patients to aid in disease management.
14.
Trenti T. Synergy between point-of-care testing and laboratory consolidations. EJIFCC 32(3), 328–336 (2021).
• A review article comparing point-of-care and central laboratory testing, discussing the advantages in effective care management and improved patient outcomes and satisfaction.
15.
Handrinos L, Januszewski AS, Trimble E, Donelan N, Williams P, Jenkins AJ. Point-of-care testing of HbA1c, renal function and lipids in remote or disadvantaged regions. Intern. Med. J. 50(12), 1567–1571 (2020).
16.
Laurence CO, Moss JR, Briggs NE et al. The cost–effectiveness of point of care testing in a general practice setting: results from a randomised controlled trial. BMC Health Serv. Res. 10, 165 (2010).
17.
Canadian Institute for Health Information. An overview of physician payments and cost per service [updated 11/17/2022]. Available from: https://www.cihi.ca/en/health-workforce-in-canada-in-focus-including-nurses-and-physicians/an-overview-of-physician
18.
Giulio de Belvis A, Meregaglia M, Morsella A et al. Italy: Health System Review. Health Syst. Transit. 24(4), 1–236 (2022).
19.
Wilson SE, Lipscombe LL, Rosella LC, Manuel DG. Trends in laboratory testing for diabetes in Ontario, Canada 1995–2005: a population-based study. BMC Health Serv. Res. 9, 41 (2009).
20.
Harris SB, Ekoé JM, Zdanowicz Y, Webster-Bogaert S. Glycemic control and morbidity in the Canadian primary care setting (results of the diabetes in Canada evaluation study). Diabetes Res. Clin. Pract. 70(1), 90–97 (2005).
21.
Redazione Diabete. Adesione alla terapia per il diabete [updated 31/12/2017]. Available from: https://www.diabete.com/adesione-alla-terapia/
22.
Joffres M, Shields M, Tremblay MS, Connor Gorber S. Dyslipidemia prevalence, treatment, control, and awareness in the Canadian Health Measures Survey. Can. J. Public Health 104(3), e252–e257 (2013).
23.
Bilitou A, Were J, Farrer A, Rabe A, Ming SWY, Haq I et al. Prevalence and patient outcomes of adult primary hypercholesterolemia and dyslipidemia in the UK: longitudinal retrospective study using a primary care dataset from 2009 to 2019. Clinicoecon. Outcomes Res. 14, 189–203 (2022).
24.
Petrella RJ, Merikle E, Jones J. Prevalence and treatment of dyslipidemia in Canadian primary care: a retrospective cohort analysis. Clin. Ther. 29(4), 742–750 (2007).
25.
Statistics Canada. Annual Demographic Estimates: Canada, Provinces and Territories (Total Population only). (2023). Available from: https://www150.statcan.gc.ca/n1/pub/91-215-x/91-215-x2023001-eng.htm
26.
Canadian Institute for Health Information. National Physician Database Historical Utilization – Data Tables (Table D.2.1) [updated 10/26/2023]. Available from: https://www.cihi.ca/en
27.
Agenzia Nazionale per i Servizi Sanitari Regionali. Analisi comparata delle cure primarie in Europa [updated 06/07/2022]. Available from: https://www.agenas.gov.it/
28.
Stephenson E, Butt DA, Gronsbell J et al. Changes in the top 25 reasons for primary care visits during the COVID-19 pandemic in a high-COVID region of Canada. PLOS One 16(8), e0255992 (2021).
• A retrospective claims analysis from the University of Toronto Practice Based Research Network (UTOPIAN) to compare the most common reasons for primary care visits to inform the population inputs for the budget impact model presented.
29.
Toth F. The Italian NHS, the public/private sector mix and the disparities in access to healthcare. Global Social Welfare 3(3), 171–178 (2016).
30.
Queenan JA, Williamson T, Khan S et al. Representativeness of patients and providers in the Canadian Primary Care Sentinel Surveillance Network: a cross-sectional study. CMAJ Open 4(1), E28–E32 (2016).
31.
Ekoe JM, Goldenberg R, Katz P. Screening for diabetes in adults. Can. J. Diabetes 42(Suppl. 1), S16–S19 (2018).
32.
Ministry of Health. Schedule of Benefits for Laboratory Services. Ontario Ministry of Health (2023).
33.
Pearson GJ, Thanassoulis G, Anderson TJ, Barry AR, Couture P, Dayan N et al. Canadian Cardiovascular Society Guidelines for the Management of Dyslipidemia for the Prevention of Cardiovascular Disease in Adults. Can. J. Cardiol. 37(8), 1129–1150 (2021).
• Canadian clinical practice guidelines for the management of dyslipidemia in adults, this source was used to inform the number of consultations and testing visits each suspected or diagnosed dyslipidemia patient is allocated in the budget impact model presented.
34.
Berberich AJ, Hegele RA. A modern approach to dyslipidemia. Endocr. Rev. 43(4), 611–653 (2022).
35.
Papastergiou J. Point-of-care screening programs in community pharmacy practice: an innovative approach to improving patient care. Canadian Pharmacists Conference 2015.
• Conference presentation presented on behalf of the Canadian Pharmacists Association outlining the advantages point-of-care HbA1c testing within community pharmacies can provide to relieve the public health care system in Canada.
Information & Authors
Information
Published In
Copyright
© 2025 Abbott Rapid Dx International Ltd. This work is licensed under the Attribution-NonCommercial-NoDerivatives 4.0 Unported License
History
Received: 14 November 2024
Accepted: 20 December 2024
Published online: 29 January 2025
Keywords:
Topics
Authors
Metrics & Citations
Metrics
Article Usage
Article usage data only available from February 2023. Historical article usage data, showing the number of article downloads, is available upon request.
Citations
How to Cite
Budget impact analyses of hemoglobin A1c and lipid panel point-of-care testing with Afinion™ 2 in Canada and Italy. (2025) Journal of Comparative Effectiveness Research. DOI: 10.57264/cer-2024-0208
Export citation
Select the citation format you wish to export for this article or chapter.
Citing Literature
- Negar Mashayekh, Elahe Mahmoodi-Khaledi, Biosensors for detecting communicable and non-communicable diseases: A critical review, Sensing and Bio-Sensing Research, 10.1016/j.sbsr.2026.100986, 52, (100986), (2026).