Systematic literature review and meta-analysis of cardiovascular risk factor management in selected Asian countries
Publication: Journal of Comparative Effectiveness Research
Abstract
Aim: There is a need to understand the management status of hypertension, dyslipidemia/hypercholesterolemia, and diabetes mellitus in the Asia–Pacific region (APAC). Methods: We conducted a systematic literature review and meta-analysis to summarize the awareness, treatment, and/or control rates of these risk factors in adults across 11 APAC countries/regions. Results: We included 138 studies. Individuals with dyslipidemia had the lowest pooled rates compared with those with other risk factors. Levels of awareness with diabetes mellitus, hypertension, and hypercholesterolemia were comparable. Individuals with hypercholesterolemia had a statistically lower pooled treatment rate but a higher pooled control rate than those with hypertension. Conclusion: The management of hypertension, dyslipidemia, and diabetes mellitus was suboptimal in these 11 countries/regions.
Tweetable abstract
Cardiovascular risk factor management was suboptimal in several Asia–Pacific countries/regions. Compared with hypertension and diabetes mellitus, dyslipidemia was the most neglected risk factor. #cvd #prevention #lipids #asia
Cardiovascular disease (CVD) is the leading cause of death globally [1], and in 2019, 58% of the deaths occurred in Asia [2]. The WHO established a global action plan by the year 2025, aiming to reduce by 25% the number of premature deaths from non-communicable diseases, including CVD [3]. Recommended targets to reduce cardiovascular risk factors include a 10% reduction in physical inactivity, a 30% reduction in tobacco use, a 25% reduction in hypertension, and no increase in diabetes mellitus and obesity [4]. For most countries/regions, resources are generally limited, resulting in unequal access to healthcare and increased morbidity and mortality [4]. To prioritize efforts and reach WHO targets, the status of cardiovascular risk factor management must be understood. Data on cardiovascular risk factor management over time have been reported for Canada and the US [5], but little is known in the Asia-Pacific (APAC) region. Therefore, this systematic literature review (SLR) and meta-analysis (MA) aimed to summarize awareness, treatment, and control rates of hypertension, dyslipidemia, and diabetes mellitus as a proxy of cardiovascular risk factor management in 11 APAC countries/regions.
Methods
Search strategy & selection criteria
We searched MEDLINE, EMBASE and IMSEAR electronic databases for articles indexed from 1 January 2004, until 30 June 2020. The strategy search used terms is listed in Supplementary Table 1. Relevant articles from reference lists from the included articles, as well as from systematic review and meta-analysis, were also assessed for eligibility. The reviews were performed independently and in a blinded fashion by two authors (RBG and APB) using the Rayyan® platform [6]. Any discrepancies were resolved by consensus.
Study eligibility was based on the PICOS (population, intervention, comparator, outcomes, study type) criteria listed in Supplementary Table 2. Eligible studies included those: with the target population being the general adult population (≥18 years old) from Australia, China, Hong Kong Special Administrative Region, India, Japan, Malaysia, Philippines, Singapore, South Korea/Republic of Korea, Taiwan, or Thailand; reporting the outcomes of interest (awareness, treatment and control rates) for the target risk factors (hypertension, dyslipidemia and diabetes mellitus); These outcomes were selected as a proxy of cardiovascular risk factor management based on a similar SLR conducted by Alaboursi et al. where a classification system of performance ratings was proposed [5]. Using population- or community-based observational designs (including cohort, cross-sectional and surveys) or quasi-experimental designs (including community-based interventional studies); written in English, German, French, Spanish or Portuguese languages, which were chosen based on the language capacity of the research teams. However, a publication suggested exclusion of languages other than English in SLR would not significantly affect the results of the meta-analyses [7]; and, available in full-text. It is important to notice that the general adult population may consist of a proportion of individuals with a history of CVD. When two or more studies used the same sampling source during similar periods that may lead to potential duplicated or overlapped samples, the article with the largest sample size and most recent data was included. For studies presenting data by different periods of time (e.g., 2007 vs 2013), only the most recent data was reported and included in the analysis.
Studies or reports with any of the following conditions were excluded: book chapters, letters, conference abstracts, and government reports; studies that did not provide sufficient information to obtain or calculate the awareness, treatment and/or control rate(s); studies with the primary interest in specific populations with out-of-scope conditions, such as chronic kidney disease, mental illness, rheumatoid arthritis, cancer and CVD other than hypertension (e.g., acute coronary syndrome [ACS] including non-ST and ST elevation myocardial infarction non-ST segment elevation myocardial infarction [STEMI and NSTEMI, respectively], and unstable angina [UA]), transient ischemic attack (TIA), ischemic stroke or subarachnoid hemorrhage; studies that sampled only a particular segment of the population (e.g., individuals from certain race/ethnicities, veterans, indigenous groups, immigrant groups, monks, healthcare professionals or specific segments of the population such as only teachers, only large industry workers); studies with individuals aged ≥15 years old but data cannot be stratified to obtain information for individuals aged ≥18 years old. These exclusions were meant to focus our report on samples that represent the general adult population.
Data extraction
We extracted the following variables, defined a priori: metadata [authorship, year of publication, country/region, living areas (urban/rural/mixed), and type of study design]; demographics (sample size and age range); CVD risk factor(s); numbers and/or proportions of individuals related to awareness, treatment and/or control rates for each risk factor.
Table 1 shows examples of different definitions used by authors to characterize the risk factors of the included studies. Notice that various definitions or criteria (e.g., treatments considered, criteria or local guidelines to define how the risk factor was controlled) may be used across studies studies. This SLR used whatever definitions or criteria used by researchers of included studies. Table 2 lists definitions used to obtain information about awareness, treatment and control rates. Notice that awareness was self-reported by individuals, and the denominator of the awareness rate (i.e., the number of individuals with the risk factor of interest) was estimated or observed by researchers of each included study. With the purpose to demonstrate a comprehensive scenario, we presented the control rate separately based on the prevalence rate and the treatment rate.
| Risk Factors | Definitions used by the author of the included studies |
|---|---|
| Hypertension | • SBP ≥140 mmHg and DBP ≥90 mmHg • SBP 130 mmHg and DBP ≥80 mmHg • Self-reported pharmacological treatment for hypertension within the 2 weeks prior to the interview |
| Diabetes mellitus | • Fasting plasma glucose ≥126 mg/dl (7.0 mmol/l) • HbA1c ≥6.5%, 2-hour plasma glucose level ≥200 mg/dl • A self-report of a doctor diagnosis of diabetes mellitus |
| Dyslipidemia | • TC≥6.22 mmol/l (240 mg/dl), and/or • TG≥2.26 mmol/l (200 mg/dl), and/or LDL≥4.14 mmol/l (160 mg/dl), and/or • HDL <1.04 mmol/l (40 mg/dl), and/ or • Use of lipid lowering medications in the past two weeks |
| Hypercholesterolemia – LDL-c | • LDL-cholesterol greater than 190 mg/dl, greater than 160 mg/dl with one major risk factor, or greater than 130 mg/dl with two cardiovascular risk factors |
| Outcome | Definitions |
|---|---|
| Awareness rate | Numerator: the number of individuals who self-reported either having been diagnosed with the risk factor by a clinician/healthcare professional or who self-reported taking medication to treat the risk factor of interest.†,§ Denominator: the number of individuals with the risk factor of interest.‡ |
| Treatment rate | Numerator: the number of individuals receiving prescribed medication(s) for the risk factor (only pharmacological treatment, including allopathic or any alternative medicine medications).§ Denominator: the number of individuals with the risk factor of interest.‡ |
| Control rate | Control rate among individuals with the risk factor of interest: Numerator: the number of individuals with the risk factor whose BP or lipid panel or A1C measures were under control.§ Denominator: the number of individuals with or without medications for the risk factor of interest.‡ Control rate among individuals being treated for the risk of interest: Numerator: the number of individuals with the risk factor who are being or have been treated with medications and had their BP or lipid panel or A1C measures under control.§ Denominator: the number of individuals treated with medications for the risk factor of interest.‡ |
†
Awareness was self-reported by individuals or patients in the included studies.
‡
This number was estimated or observed by researchers rather than self-reported by individuals or patients in included studies.
§
various definitions or criteria may be used across included studies. This systematic literature review used whatever definitions or criteria used by researchers of included studies.
BP: Blood pressure; A1C: Glycosylated hemoglobin test.
Data analysis
We performed quantitative data syntheses and reported results per the PRISMA Statement [8]. All analyses were performed using the statistical packages for meta-analysis of R software 4.1.1 for macOS. The analysis was performed by each study outcome within each risk factor separately. We reported stratification analyses by country and urban/rural area in this paper but not by other variable (e.g., by age group, gender, study type, etc.). Our rationale to report the pooled estimates by country/region or urban/rural area because such information is relatively important to decisions, implementation or changes in clinical practice to improve CV risk factor management at the country/region level. Other analyses were either not feasible (e.g., inadequate subgroups for each study outcome and risk factor within each country) or limited space in this paper does not accommodate all results to be presented. For the modeling of binominal data, we adopted an approximate likelihood approach by using the Freeman-Tukey double arcsine raw data, instead of weighted or standardized estimates, from articles that were used to compute pooled estimates. Transformation for computation of the pooled estimates and performing the back-transformation for stabilizing variances [9]. Thus, all the studies are retained independently of extreme proportions (0 and 100%). Furthermore, admissible confidence intervals (CIs) for each study are provided, in addition to the pooled rates. We adopted the random-effects model using the method of DerSimonian and Laird, with the estimate of heterogeneity being taken from the inverse-variance fixed-effect model [10]. We chose this model because we expected high heterogeneity among the studies.
Heterogeneity was evaluated using the I2 and the χ2 test (p < 0.05 for heterogeneity), which assess the overlap between the CI of the proportion of each group. Subgroup analyses by market and were performed by comparing heterogeneity between groups, as defined by χ2 and p < 0.05.
Publication bias was assessed utilizing the Egger's test [11] and the funnel plot, which displays confidence interval boundaries to assist publication bias through the visualization of the distribution of the studies in the limits of the funnel (e.g., whether studies are distributed symmetrically and fall within the funnel margins).
The quality of the studies included in this SLR was assessed with the Newcastle Ottawa Scale (NOS) [12]. The NOS score for observational studies has a maximum of 10 points, and a study is considered of very good quality if scoring 9–10 points, good quality if 7–8 points, satisfactory quality if 5–6 points, and unsatisfactory quality if 0–4 points [12].
Results
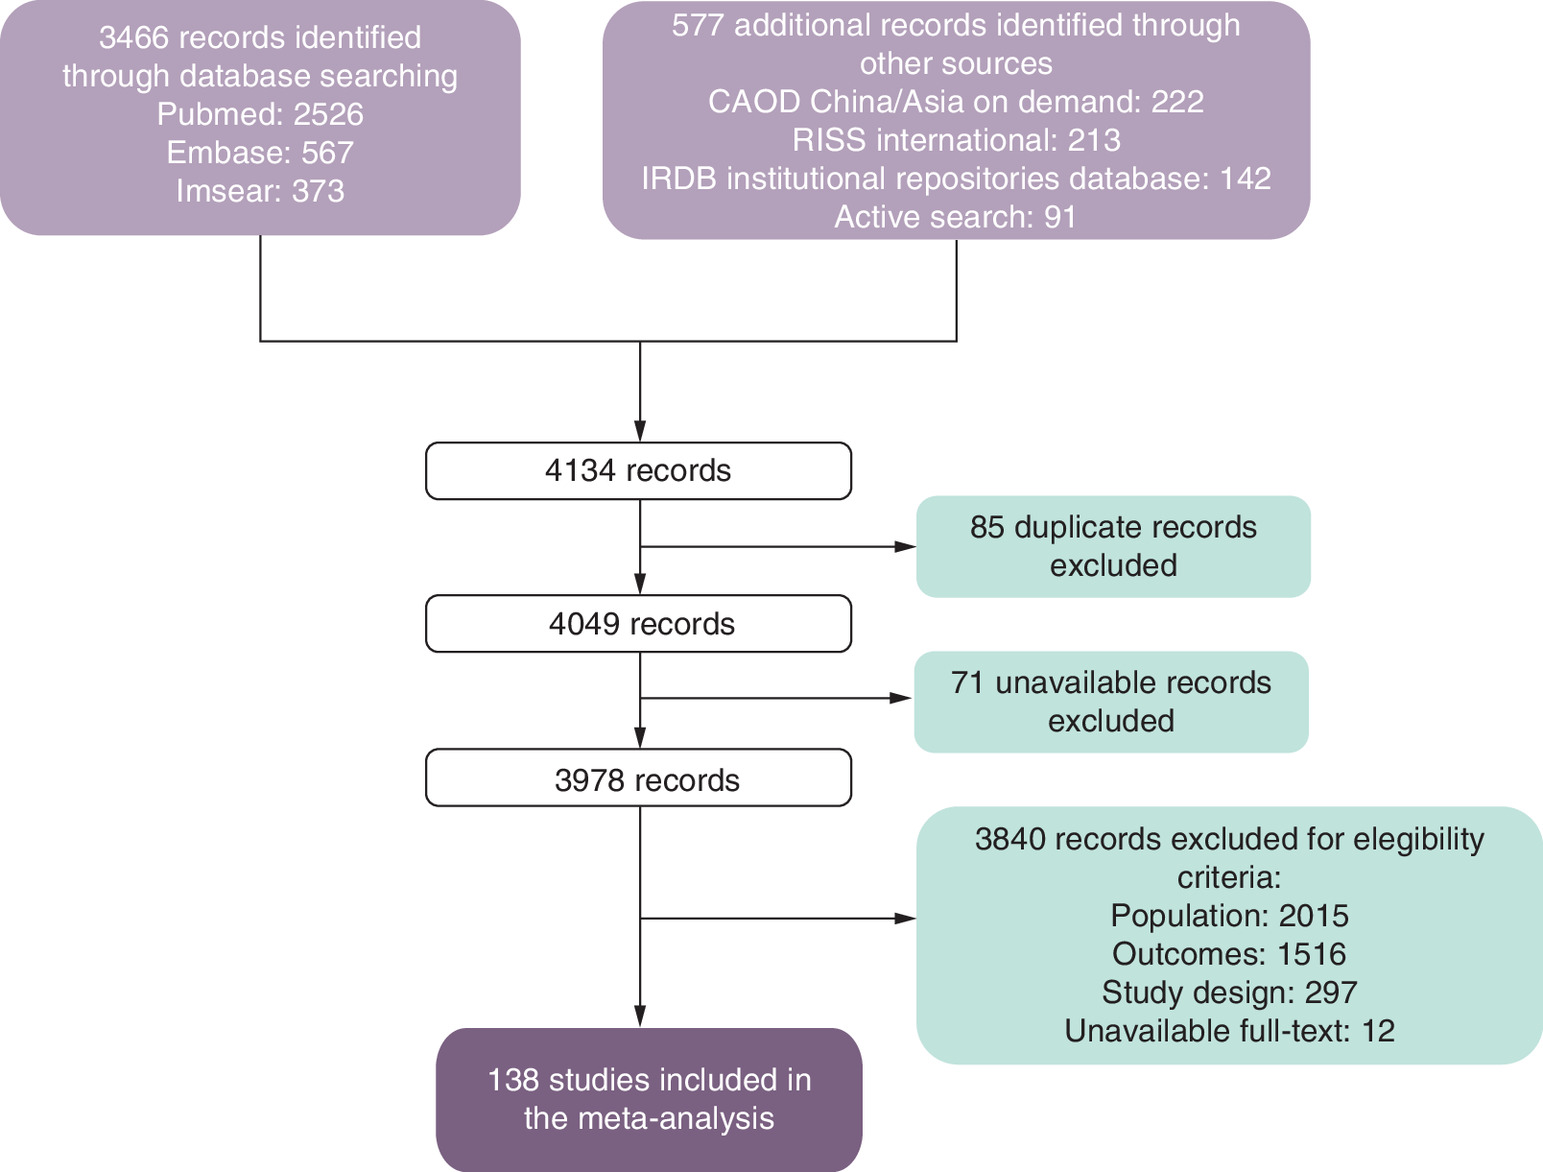
This SLR yielded 4134 studies and 85 duplicates were removed, resulting in 4,049 studies to be evaluated. In a preliminary eligibility evaluation, we excluded 71 unavailable records not presenting results in the abstract. In a more detailed subsequent evaluation, we excluded 3839 articles for the following reasons: ineligible population (n = 2015), inappropriate outcomes (n = 1515), inappropriate study design (n = 297) and unavailable full-text (n = 12). We included 138 studies in the final quantitative analysis. Five eligible studies included data related to two risk factors of interest [13–17]. In those cases, these studies were counted once for one risk factor and once for the other risk factor as showed with specific labels in the graphics and tables. Figure 1 shows the detailed flow of the study selection.
This SLR included a total of 6,312,710 study subjects across 138 studies, among which 116 studies included 6,132,901 subjects with hypertension, 19 studies included 58,789 subjects with diabetes mellitus, and 14 studies included 121,020 subjects with dyslipidemia (among which 6 studies specified 78,462 subjects with hypercholesterolemia). The numbers of included studies by country/region were: Australia (n = 6), China (n = 86), India (n = 23), Japan (n = 2), Malaysia (n = 7), Philippines (n = 1), Singapore (n = 2), South Korea (n = 4), Taiwan (n = 2), Thailand (n = 5) and Hong Kong (n = 0). Of 138 studies, 75 studies were conducted based on populations in mixed areas (urban and rural), 28 studies in rural areas, 21 studies in urban areas, and 24 studies did not report the type of area (Table 3).
| Study, year | Country | Area | Study design | Sample size, n | Age, years | Risk factor | Awareness rate | Treatment rate | Control rate† | Control rate‡ | Ref. |
|---|---|---|---|---|---|---|---|---|---|---|---|
| Abdul-Razak et al., 2016 | Malaysia | Mixed | Cohort | 5409 | ≥30 | Hypertension | 52.4 | 37.4 | 30.7 | 15.9 | [36] |
| Aekplakorn et al., 2012 | Thailand | Mixed | Cross-sectional | 6401 | ≥40 | Hypertension | 58.4 | 50.4 | 25.2 | [37] | |
| Appleton et al., 2013 | Australia | Did not report | Cross-sectional | 781 | ≥18 | Hypertension | 59.2 | 35.7 | [38] | ||
| Banerjee et al., 2016 | India | Urban | Cross-sectional | 4304 | ≥20 | Hypertension | 53.0 | 38.0 | 25.8 | 11.6 | [39] |
| Bhardwaj et al., 2010 | India | Rural | Cross-sectional | 392 | ≥18 | Hypertension | 22.0 | 20.2 | [40] | ||
| Bunnag et al., 2006 | Thailand | Did not report | Cross-sectional | 6965 | ≥18 | Hypertension | 84.4 | 13.9 | [41] | ||
| Busingye et al., 2017 | India | Rural | Cross-sectional | 277 | ≥50 | Hypertension | 42.6 | 55.1 | 27.7 | 26.7 | [42] |
| Cai et al., 2012b | China | Mixed | Cross-sectional | 2040 | 18–79 | Hypertension | 42.5 | 84.3 | 33.0 | [43] | |
| Campbell et al., 2018 | Australia | Did not report | Cross-sectional | 3847 | >60 | Hypertension | 99.0 | 60.2 | [44] | ||
| Castillo et al., 2019 | Philippines | Did not report | Cross-sectional | 91994 | >18 | Hypertension | 65.6 | 58.4 | [45] | ||
| Chaturvedi et al., 2007 (study 1) | India | Urban | Cross-sectional | 334 | 20–59 | Hypertension | 53.3 | 42.8 | 10.5 | [46] | |
| Chaturvedi et al., 2007 (study 2) | India | Urban | Cross-sectional | 705 | ≥60 | Hypertension | 54.0 | 43.4 | 8.5 | [46] | |
| Chen et al., 2016 | China | Rural | Cross-sectional | 5066 | ≥35 | Hypertension | 42.5 | 30.6 | 20.0 | [47] | |
| Chen et al., 2018 | China | Mixed | Cross-sectional | 2347 | 18–98 | Hypertension | 41.8 | 78.8 | 31.5 | [48] | |
| Chen et al., 2020 | China | Did not report | Cross-sectional | 85835 | ≥18 | Hypertension | 62.3 | 57.3 | 62.6 | 35.9 | [49] |
| Chua et al., 2005 (BMES I) | Australia | Urban | Cross-sectional | 1645 | >49 | Hypertension | 79.8 | 71.1 | 56.3 | [50] | |
| Chua et al., 2005 (BMES II) | Australia | Urban | Cross-sectional | 1825 | >49 | Hypertension | 73.0 | 67.3 | 46.5 | [50] | |
| Dong et al., 2007 | China | Rural | Cross-sectional | 10854 | 35–85 | Hypertension | 27.0 | 19.8 | 9.0 | [51] | |
| Dong et al., 2013 | China | Rural | Cross-sectional | 1100 | 18–85 | Hypertension | 37.0 | 31.2 | 18.1 | 5.6 | [52] |
| Fan et al., 2014 | China | Mixed | Cross-sectional | 4531 | ≥25 | Hypertension | 46.0 | 35.7 | 29.1 | 10.4 | [53] |
| Fan et al., 2020 (130/80 mm Hg hypertension threshold) | China | Did not report | Cross-sectional | 866 | 21–94 | Hypertension | 15.4 | 3.2 | [54] | ||
| Fan et al., 2020 (140/90 mm Hg hypertension threshold) | China | Did not report | Cross-sectional | 515 | 21–94 | Hypertension | 25.8 | 9.7 | [54] | ||
| Feng et al., 2014 | China | Mixed | Cross-sectional | 5295 | ≥45 | Hypertension | 57.4 | 49.0 | 20.2 | [55] | |
| Gao et al., 2013 | China | Mixed | Cross-sectional | 13196 | ≥20 | Hypertension | 45.0 | 36.2 | 11.0 | [56] | |
| Goswami et al., 2016 | India | Urban | Cross-sectional | 477 | ≥60 | Hypertension | 41.2 | 32.9 | [13] | ||
| Gu et al., 2014 | China | Urban | Cross-sectional | 3328 | ≥65 | Hypertension | 36.1 | [57] | |||
| Gupta et al., 2017 | India | Mixed | Cross-sectional | 9798 | ≥35 | Hypertension | 40.4 | 31.9 | 12.9 | [58] | |
| Gupta et al., 2020 | India | Rural | Cross-sectional | 194 | ≥60 | Hypertension | 58.8 | [14] | |||
| Hazarika et al., 2004 | India | Rural | Cross-sectional | 1058 | ≥35 | Hypertension | 21.6 | 21.4 | 18.1 | [59] | |
| Hird et al., 2019 | Australia | Mixed | Cohort | 4113199 | 20–69 | Hypertension | 5.6 | [60] | |||
| Howteerakul et al., 2006 | Thailand | Rural | Cross-sectional | 94 | ≥35 | Hypertension | 64.9 | [61] | |||
| Hu et al., 2016 | China | Mixed | Cross-sectional | 1754 | ≥18 | Hypertension | 63.7 | 47.3 | 37.6 | 17.8 | [62] |
| Hu et al., 2017a | China | Mixed | Cross-sectional | 4411 | 25–97 | Hypertension | 65.1 | 27.2 | 12.7 | [63] | |
| Huang et al., 2017 | China | Mixed | Cross-sectional | 371 | ≥20 | Hypertension | 44.2 | 38.0 | 27.7 | 10.5 | [64] |
| Huang et al., 2019 | China | Urban | Cross-sectional | 4418 | 35–79 | Hypertension | 47.9 | 40.1 | 25.6 | 10.3 | [65] |
| Jiang et al., 2014 | China | Mixed | Quasi-experimental community trial | 5029 | ≥50 | Hypertension | 70.0 | 62.1 | 44.4 | 29.6 | [66] |
| Karmakar et al., 2018 | India | Rural | Cross-sectional | 170 | ≥20 | Hypertension | 48.2 | 47.1 | 18.7 | 8.8 | [67] |
| Kaur et al., 2011 | India | Rural | Cross-sectional | 2247 | 25–64 | Hypertension | 25.1 | 20.3 | 32.6 | 6.6 | [68] |
| Kaur et al., 2016 | India | Rural | Cohort | 1284 | 25–64 | Hypertension | 19.9 | 36.3 | 45.3 | [69] | |
| Kawazoe et al., 2018 | China | Rural | Cross-sectional | 1009 | 50–69 | Hypertension | 22.5 | 8.4 | [70] | ||
| Ke et al., 2014 | China | Urban | Cross-sectional | 478 | ≥18 | Hypertension | 67.0 | 59.0 | 49.0 | 30.1 | [71] |
| Kiau et al., 2013 | Malaysia | Mixed | Cross-sectional | 3651 | ≥60 | Hypertension | 49.3 | 42.4 | 22.6 | [72] | |
| Kim et al., 2020b | South Korea | Did not report | Cross-sectional | 780 | 19–44 | Hypertension | 16.4 | 10.6 | [25] | ||
| Lee et al., 2010 | South Korea | Rural | Cohort | 3475 | ≥60 | Hypertension | 60.1 | 16.1 | [73] | ||
| Lewington et al., 2016 | China | Mixed | Cross-sectional | 152568 | ≥35 | Hypertension | 46.4 | 29.6 | 4.2 | [74] | |
| Li et al., 2010 | China | Rural | Cross-sectional | 7164 | ≥25 | Hypertension | 26.2 | 22.2 | 17.7 | 3.9 | [75] |
| Li et al., 2015 | China | Rural | Cross-sectional | 5917 | ≥35 | Hypertension | 43.5 | 31.6 | 6.0 | [76] | |
| Li et al., 2016 | China | Mixed | Cross-sectional | 18915 | ≥18 | Hypertension | 41.6 | 34.4 | 8.2 | [62] | |
| Li et al., 2017 | China | Did not report | Cross-sectional | 295 | 18–70 | Hypertension | 48.8 | 25.1 | 43.2 | 17.6 | [77] |
| Li et al., 2020 | China | Mixed | Cross-sectional | 4332 | ≥45 | Hypertension | 39.4 | [78] | |||
| Li et al., 2019a | China | Mixed | Cross-sectional | 6669 | ≥18 | Hypertension | 23.8 | 18.6 | 9.6 | 2.3 | [79] |
| Li et al., 2019c | China | Mixed | Longitudinal study | 4594 | ≥45 | Hypertension | 53.7 | 41.6 | [80] | ||
| Li et al., 2020 | China | Mixed | Retrospective pre-post self-controlled | 7332 | ≥35 | Hypertension | 41.4 | [81] | |||
| Liang et al., 2020 | China | Mixed | Cohort | 3656 | ≥35 | Hypertension | 70.7 | 64.1 | [82] | ||
| Liao et al., 2016 | China | Mixed | Cohort | 2619 | ≥35 | Hypertension | 32.2 | [83] | |||
| Lim et al., 2004 | Malaysia | Mixed | Cross-sectional | 7225 | ≥30 | Hypertension | 33.0 | 23.0 | 26.0 | 6.0 | [84] |
| Lim et al., 2018 | South Korea | Did not report | Longitudinal study | 117264 | ≥65 | Hypertension | 72.5 | [85] | |||
| Lin et al., 2013 | Taiwan | Urban | Cross-sectional | 2145 | 20–49 | Hypertension | 63.0 | [86] | |||
| Liu et al., 2017 | China | Mixed | Cross-sectional | 3518 | ≥18 | Hypertension | 44.1 | 36.6 | 23.3 | 8.4 | [87] |
| Liu et al., 2018 | China | Rural | Cross-sectional | 9872 | 18–74 | Hypertension | 67.4 | 54.6 | 26.1 | [88] | |
| Liu et al., 2019 | China | Rural | Cross-sectional | 5107 | ≥40 | Hypertension | 16.6 | 4.8 | 23.2 | [89] | |
| Lu et al., 2017 | China | Mixed | Cross-sectional | 777637 | 35–75 | Hypertension | 44.7 | 30.1 | 7.2 | [90] | |
| Lu et al., 2018 | China | Did not report | Longitudinal study | 4884 | 45–75 | Hypertension | 56.1 | 46.8 | 20.3 | [16] | |
| Lv et al., 2018 | China | Mixed | Cross-sectional | 4632 | 18–59 | Hypertension | 48.1 | 39.6 | 22.9 | [91] | |
| Ma et al., 2015 | China | Mixed | Longitudinal study | 1275 | ≥18 | Hypertension | 57.6 | 56.2 | 21.5 | [92] | |
| Majid et al., 2018 | Malaysia | Mixed | Cross-sectional | 7038 | ≥18 | Hypertension | 37.5 | 31.1 | 37.4 | [93] | |
| Malhotra et al., 2010 | Singapore | Did not report | Cross-sectional | 3419 | ≥60 | Hypertension | 69.2 | 68.0 | 35.5 | [23] | |
| Meng et al., 2011 | China | Urban | Cross-sectional | 7237 | 18–74 | Hypertension | 42.9 | 28.2 | 3.6 | [94] | |
| Mi et al., 2015 | China | Rural | Cross-sectional | 1035 | 18–77 | Hypertension | 53.5 | [95] | |||
| Mohan et al., 2007 | India | Urban | Cross-sectional | 469 | ≥20 | Hypertension | 32.8 | 10.7 | [96] | ||
| Muntner et al., 2004 | China | Mixed | Cross-sectional | 4066 | ≥35 | Hypertension | 47.0 | 61.5 | 29.1 | 8.6 | [97] |
| Naing et al., 2016 | Malaysia | Mixed | Cohort | 7038 | ≥30 | Hypertension | 66.0 | 12.0 | [98] | ||
| Oteh et al., 2011 | Malaysia | Urban | Cross-sectional | 950 | ≥30 | Hypertension | 48.5 | [99] | |||
| Pan et al., 2020 | Taiwan | Mixed | Cross-sectional | 26440 | ≥20 | Hypertension | 81.0 | 63.1 | [100] | ||
| Pang et al., 2010 | China | Rural | Cross-sectional | 6059 | ≥60 | Hypertension | 35.2 | 28.7 | 3.7 | 1.0 | [101] |
| Porapakkham et al., 2008 | Thailand | Mixed | Cross-sectional | 10365 | ≥60 | Hypertension | 43.9 | [17] | |||
| Prenissl et al., 2019 | India | Mixed | Cross-sectional | 125609 | ≥20 | Hypertension | 44.3 | 13.3 | 7.7 | [102] | |
| Qiao et al., 2013 | China | Did not report | Cohort | 1859 | ≥20 | Hypertension | 27.5 | 19.1 | 6.0 | [103] | |
| Roy et al., 2017 (Survey 1) | India | Mixed | Cross-sectional | 5510 | 35–64 | Hypertension | 37.5 | 32.0 | 14.4 | [104] | |
| Roy et al., 2017 (Survey 2) | India | Mixed | Cross-sectional | 3940 | 35–64 | Hypertension | 38.7 | 32.3 | 12.8 | [104] | |
| Ruixing et al., 2008 | China | Did not report | Cross-sectional | 446 | ≥35 | Hypertension | 10.1 | 6.7 | 43.4 | [105] | |
| Saju et al., 2020 | India | Urban | Cohort | 427 | ≥30 | Hypertension | 78.0 | [106] | |||
| Sathish et al., 2012 | India | Mixed | Cohort | 70 | 15–64 | Hypertension | 42.9 | 22.9 | 14.2 | [107] | |
| Satoh et al., 2017 | Japan | Mixed | Cross-sectional | 1282 | ≥20 | Hypertension | 66.9 | 56.2 | 38.9 | [108] | |
| Sheng et al., 2013 | China | Mixed | Cross-sectional | 2345 | ≥60 | Hypertension | 72.5 | 65.8 | 24.4 | [109] | |
| Singh et al., 2011 | India | Mixed | Cross-sectional | 3433 | ≥25 | Hypertension | 39.2 | 19.5 | 33.4 | [110] | |
| Singh et al., 2017 | India | Urban | Cross-sectional | 211 | 25–64 | Hypertension | 38.4 | [111] | |||
| Sui et al., 2013 | China | Did not report | Cross-sectional | 25336 | 35–85 | Hypertension | 97.7 | 40.2 | [112] | ||
| Sun et al., 2007 | China | Rural | Cross-sectional | 17360 | ≥35 | Hypertension | 29.5 | 23.6 | 4.8 | 1.1 | [113] |
| Sun et al., 2010 | China | Rural | Longitudinal study | 6458 | ≥35 | Hypertension | 29.9 | 19.5 | 1.6 | [114] | |
| Thankappan et al., 2006 | India | Rural | Cross-sectional | 1810 | ≥30 | Hypertension | 24.4 | 19.7 | 32.3 | 6.4 | [115] |
| Thankappan et al., 2013 | India | Rural | Community-based intervention | 4627 | 25–74 | Hypertension | 23.6 | 18.9 | 6.5 | [116] | |
| Tian et al., 2011 | China | Urban | Cross-sectional | 7237 | 18–74 | Hypertension | 42.9 | 28.2 | 12.9 | 3.6 | [117] |
| Tripathy et al., 2017b | India | Mixed | Cross-sectional | 2030 | ≥18 | Hypertension | 30.1 | 61.0 | [118] | ||
| Wang et al., 2004 | China | Mixed | Cross-sectional | 13504 | 35–59 | Hypertension | 24.5 | [119] | |||
| Wang et al., 2013 | China | Mixed | Cross-sectional | 5227 | ≥18 | Hypertension | 54.3 | 46.3 | 18.3 | [120] | |
| Wang et al., 2018 | China | Mixed | Cross-sectional | 126040 | ≥18 | Hypertension | 51.6 | 45.8 | 36.7 | 16.8 | [121] |
| White et al., 2009 | Australia | Rural | Cross-sectional | 449 | 23–93 | Hypertension | 43.4 | 45.0 | [122] | ||
| Wu et al., 2015 | China | Urban | Cross-sectional | 1409 | ≥60 | Hypertension | 75.1 | 67.1 | 29.6 | [123] | |
| Wu et al., 2014 | China | Mixed | Cross-sectional | 5019 | ≥25 | Hypertension | 58.3 | 52.3 | 23.4 | [124] | |
| Xing et al., 2019a | China | Mixed | Cross-sectional | 6623 | ≥40 | Hypertension | 47.5 | 35.4 | 10.1 | 3.6 | [125] |
| Xing et al., 2019b | China | Mixed | Cross-sectional | 10676 | ≥40 | Hypertension | 48.5 | 38.0 | 14.9 | 5.7 | [126] |
| Yang et al., 2010 | China | Rural | Cross-sectional | 6171 | 35–74 | Hypertension | 52.4 | 38.3 | 7.2 | [127] | |
| Yang et al., 2014 | China | Mixed | Cross-sectional | 10644 | ≥60 | Hypertension | 46.3 | 50.3 | 34.5 | [128] | |
| Yang et al., 2016 | China | Mixed | Cross-sectional | 4410 | ≥40 | Hypertension | 70.9 | 59.2 | 32.6 | [129] | |
| Yin et al., 2016 | China | Mixed | Cross-sectional | 5514 | ≥45 | Hypertension | 59.0 | 46.4 | 24.7 | [130] | |
| Yongqing et al., 2016 | China | Mixed | Cross-sectional | 3146 | 18–69 | Hypertension | 31.4 | [131] | |||
| You et al., 2018a | China | Mixed | Longitudinal study | 8125 | ≥45 | Hypertension | 38.7 | 43.0 | 9.9 | [132] | |
| You et al., 2018b | China | Mixed | Cross-sectional | 3992 | ≥45 | Hypertension | 53.1 | 43.4 | 10.0 | [133] | |
| Yuvaraj et al., 2010 | India | Rural | Cross-sectional | 349 | ≥18 | Hypertension | 33.8 | 32.1 | 12.5 | [134] | |
| Zhang et al., 2009 | China | Urban | Cross-sectional | 2009 | ≥60 | Hypertension | 75.3 | 66.7 | 48.2 | 32.1 | [135] |
| Zhang et al., 2017 | China | Mixed | Cross-sectional | 2335 | ≥40 | Hypertension | 50.1 | 39.0 | 11.0 | [136] | |
| Zhao et al., 2019 | China | Mixed | Cross-sectional | 4874 | ≥45 | Hypertension | 68.0 | 61.1 | 27.2 | [137] | |
| Zhao et al., 2012 | China | Did not report | Cross-sectional | 11993 | ≥18 | Hypertension | 49.2 | 43.3 | 7.1 | [138] | |
| Zhou et al., 2019 (previous guideline: ≥140/90 mm Hg) | China | Did not report | Cross-sectional | 20454 | 18–98 | Hypertension | 44.3 | 32.5 | 13.0 | [139] | |
| Zhou et al., 2019 (new guideline: ≥130/80 mm Hg) | China | Did not report | Cross-sectional | 34459 | 18–98 | Hypertension | 26.3 | 19.3 | 2.7 | [139] | |
| Gao et al., 2016 | China | Mixed | Cross-sectional | 5126 | ≥40 | Diabetes mellitus | 36.3 | 27.9 | 34.7 | [140] | |
| Goswami et al., 2016 | India | Urban | Cross-sectional | 167 | ≥60 | Diabetes mellitus | 62.3 | 33.6 | [13] | ||
| Gupta et al., 2020 | India | Rural | Cross-sectional | 81 | ≥60 | Diabetes mellitus | 45.7 | [14] | |||
| Ho et al., 2014 | Malaysia | Mixed | Cross-sectional | 2708 | ≥60 | Diabetes mellitus | 35.0 | 22.8 | 76.5 | [141] | |
| Hu et al., 2008 | China | Mixed | Cross-sectional | 986 | 35–74 | Diabetes mellitus | 28.5 | 24.7 | 38.1 | [142] | |
| Hu et al., 2017b | China | Mixed | Cross-sectional | 655 | ≥18 | Diabetes mellitus | 52.5 | 41.8 | 19.1 | [143] | |
| Li et al., 2019c | China | Rural | Cross-sectional | 533 | ≥45 | Diabetes mellitus | 51.8 | 38.6 | 14.1 | [144] | |
| Li et al., 2019c | China | Mixed | Longitudinal study | 1703 | ≥45 | Diabetes mellitus | 33.4 | 23.6 | [80] | ||
| Liu et al., 2016 | China | Urban | Cross-sectional | 521 | ≥60 | Diabetes mellitus | 78.5 | 69.3 | 18.8 | 15.9 | [145] |
| Liu et al., 2020 | China | Mixed | Cross-sectional | 609 | ≥40 | Diabetes mellitus | 82.3 | [146] | |||
| Porapakkham et al., 2008 | Thailand | Mixed | Cross-sectional | 2999 | ≥60 | Diabetes mellitus | 58.8 | [17] | |||
| Qin et al., 2016 | China | Mixed | Cross-sectional | 499 | 18–80 | Diabetes mellitus | 28.1 | 25.9 | 48.1 | [147] | |
| Tripathy et al., 2017a | India | Mixed | Cross-sectional | 207 | ≥18 | Diabetes mellitus | 18.0 | 35.0 | [148] | ||
| Wang et al., 2014 | China | Mixed | Cross-sectional | 1854 | 18–79 | Diabetes mellitus | 67.2 | 57.0 | 44.1 | [149] | |
| Xi et al., 2020 | China | Mixed | Cross-sectional | 13644 | 35–75 | Diabetes mellitus | 30.8 | 4.7 | [150] | ||
| Xu et al., 2013 | China | Mixed | Cross-sectional | 11444 | ≥18 | Diabetes mellitus | 30.1 | 25.8 | 39.7 | [151] | |
| Yan et al., 2020 | Thailand | Mixed | Cross-sectional | 10497 | ≥20 | Diabetes mellitus | 34.0 | 33.3 | 26.0 | [152] | |
| Ye et al., 2016 | China | Mixed | Cohort | 3803 | ≥35 | Diabetes mellitus | 68.1 | 63.5 | 35.1 | [153] | |
| Zhang et al., 2012 | China | Mixed | Cross-sectional | 753 | ≥18 | Diabetes mellitus | 12.9 | [154] | |||
| Cai et al., 2012a | China | Mixed | Cross-sectional | 2043 | 18–79 | Dyslipidemia | 22.0 | [155] | |||
| He et al., 2014 | China | Mixed | Cross-sectional | 7319 | 18–79 | Dyslipidemia | 11.6 | 8.4 | 34.8 | [156] | |
| Ho et al., 2018 | Australia | Did not report | Cohort | 4257 | 65–84 | Dyslipidemia | 15.2 | [141] | |||
| Ni et al., 2015 | China | Urban | Cross-sectional | 691 | 20–96 | Dyslipidemia | 25.0 | [157] | |||
| Pan et al., 2016 | China | Mixed | Cross-sectional | 15801 | >18 | Dyslipidemia | 31.0 | 19.5 | 8.5 | [158] | |
| Song et al., 2019 | China | Mixed | Cross-sectional | 4081 | ≥45 | Dyslipidemia | 20.3 | 14.4 | 34.3 | [159] | |
| Wang et al., 2011 | China | Mixed | Cross-sectional | 1654 | 45–89 | Dyslipidemia | 50.9 | 23.8 | 39.9 | [160] | |
| Xing et al., 2020 | China | Mixed | Cross-sectional | 6712 | ≥40 | Dyslipidemia | 14.7 | 5.9 | 2.9 | [161] | |
| Khoo et al., 2013 | Singapore | Mixed | Cross-sectional | 2445 | 24–95 | Hypercholesterolemia (LDL-c) | 30.8 | [162] | |||
| Kim et al., 2020a | South Korea | Did not report | Cohort | 69942 | 40–79 | Hypercholesterolemia (LDL-c) | 47.6 | [163] | |||
| Lu et al., 2018 | China | Did not report | Longitudinal study | 2189 | 45–75 | Hypercholesterolemia (LDL-c) | 37.7 | 31.1 | 26.5 | [16] | |
| Momo et al., 2019 | Japan | Did not report | Cohort | 294 | ≥60 | Hypercholesterolemia (LDL-c) | 45.9 | [164] | |||
| Wu et al., 2017 (before 2013 ACC/AHA guideline) | China | Did not report | Cross-sectional | 1521 | 18–75 | Hypercholesterolemia (LDL-c) | 27.7 | [165] | |||
| Wu et al., 2017 (after 2013 ACC/AHA guideline) | China | Did not report | Cross-sectional | 2071 | 18–75 | Hypercholesterolemia (LDL-c) | 26.6 | [165] |
†
Control rate based on treatment rate.
‡
Control rate based on the sample diagnosed.
Overall pooled awareness, treatment & control rates for each risk factor
Table 4 summarizes pooled awareness, treatment and control rates and 95% CIs for each risk factor. Among individuals with the risk factor of interest, the pooled awareness rate was lower for dyslipidemia (24%, 95% CI: 16–33%) than for diabetes mellitus (46%, 95% CI: 38–55%) or for hypertension (47%, 95% CI: 45–49%). The pooled awareness rate for hypercholesterolemia was numerically high (51%, 95% CI: 26–76%), but comparisons with other risk factor was inconclusive due to a wide range of CI. The pooled treatment rate in individuals with the risk factor of interest was the lowest for dyslipidemia (14%, 95% CI: 9–20%), followed by those for hypercholesterolemia (31%, 95% CI: 29–33%), for diabetes mellitus (37%, 95% CI: 31–43%) or for hypertension (40%, 95% CI: 36–44%). Interestingly, the pooled control rate was the highest among individuals with hypercholesterolemia (35%, 95% CI: 29–33%) than those with dyslipidemia (5%, 95% CI: 1–12%), those with diabetes mellitus (12%, 95% CI: 3–26%), or those with hypertension (13%, 95% CI: 11–16%). Based on population-/community-based studies showing data for those being treated with medications for the risk factor of interest, the control rates remain suboptimal for dyslipidemia (5%, 95% CI: 3–9%), for hypertension (13%, 95% CI: 11–16%) and for diabetes mellitus (15%, 95% CI: 10–21%). No published population-/community-based study was identified for the control rate among those being treated with medications for hypercholesterolemia. However, interpretations of these pooled outcomes should be with cautious due to substantial heterogeneity.
| Risk factor† | Outcome‡ S | Studies (n) | Pooled rate (%) | 95% CI | I2 (%) |
|---|---|---|---|---|---|
| Diabetes mellitus | Awareness rate | 19 | 46 | [38; 55] | 99.6 |
| Treatment rate | 19 | 37 | [31; 43] | 99.5 | |
| Control rate among those treated for diabetes mellitus | 19 | 15 | [10; 21] | 99.5 | |
| Control rate among those with diabetes mellitus | 13 | 12 | [03; 26] | 99.0 | |
| Dyslipidemia | Awareness rate | 7 | 24 | [16; 33] | 99.7 |
| Treatment rate | 8 | 14 | [09; 20] | 99.6 | |
| Control rate among those treated for dyslipidemia | 7 | 5 | [03; 09] | 98.3 | |
| Control rate among those with dyslipidemia | 7 | 5 | [01; 12] | 99.7 | |
| Hypercholesterolemia | Awareness Rate | 4 | 51 | [26; 76] | 99.7 |
| Treatment Rate | 3 | 31 | [29; 33] | NA | |
| Control Rate among Those with Hypercholesterolemia | 5 | 35 | [23; 47] | 99.6 | |
| Hypertension | Awareness Rate | 113 | 47 | [45; 49] | 99.8 |
| Treatment Rate | 116 | 40 | [36; 44] | 100.0 | |
| Control Rate among Those Treated for hypertension | 116 | 13 | [10; 18] | 100.0 | |
| Control Rate among Those with Hypertension | 107 | 13 | [11; 16] | 99.9 |
Subgroup analysis
Table 5 and Table 6 show pooled awareness, treatment and control rates by country/region or by the living area, respectively. Subgroup analyses suggested statistically significant differences in pooled awareness rates across countries/regions (p = 0.0339 for diabetes mellitus, p < 0.001 for hypercholesterolemia and hypertension). Pooled awareness rates also significantly varied by the living areas for hypercholesterolemia (p < 0.001), diabetes mellitus (p < 0.001) and hypertension (p = 0.006). Statistically significant differences in pooled treatment rates were found for diabetes mellitus and hypertension across countries/regions and by living area (all p < 0.001). In individuals with the risk of interest, the control rates were statistically different across countries/regions for hypercholesterolemia and hypertension (both p < 0.001). Those treated with medications for diabetes mellitus and hypertension had significant different pooled control rates by country/region and by living areas (all p < 0.001).
| Risk factor | Outcome | Studies (n) | Pooled rate (%) | 95% CI | Test for subgroup differences (p-value) |
|---|---|---|---|---|---|
| Diabetes mellitus | Awareness rate | ||||
| China | 13 | 47 | [36; 59] | 0.0339 | |
| India | 3 | 46 | [35; 57] | ||
| Malaysia | 1 | 35 | [33; 37] | ||
| Thailand | 2 | 46 | [23; 70] | ||
| Treatment Rate | |||||
| China | 13 | 39 | [30; 47] | <0.0001 | |
| India | 3 | 39 | [04; 82] | ||
| Malaysia | 1 | 23 | [21; 24] | ||
| Thailand | 2 | 33 | [32; 34] | ||
| Control rate among those treated for diabetes mellitus | |||||
| China | 13 | 14 | [08; 22] | <0.0001 | |
| India | 3 | 13 | [02; 30] | ||
| Malaysia | 1 | 17 | [16; 19] | ||
| Thailand | 2 | 26 | [25; 27] | ||
| Control rate among those with diabetes mellitus | |||||
| China | 13 | 12 | [03; 26] | 1.000 | |
| Dyslipidemia | Awareness Rate | ||||
| China | 7 | 24 | [16; 33] | 1.000 | |
| Treatment Rate | |||||
| China | 7 | 14 | [08; 21] | 0.6531 | |
| Australia | 1 | 15 | [14; 16] | ||
| Control rate among those treated for dyslipidemia | |||||
| China | 7 | 5 | [03; 09] | 1.000 | |
| Control rate among those with dyslipidemia | |||||
| China | 7 | 5 | [01; 12] | 1.000 | |
| Hypercholesterolemia | Awareness Rate | ||||
| Singapore | 1 | 64 | [62; 66] | <0.0001 | |
| China | 3 | 38 | [36; 40] | ||
| Treatment Rate | |||||
| China | 3 | 31 | [29; 33] | 1.000 | |
| Control rate among those with hypercholesterolemia | |||||
| South Korea | 1 | 48 | [47; 48] | <0.0001 | |
| China | 3 | 27 | [26; 28] | ||
| Japan | 1 | 46 | [40; 52] | ||
| Hypertension | Awareness Rate | ||||
| Malaysia | 6 | 48 | [35;60] | <0.0001 | |
| Thailand | 4 | 55 | [43;67] | ||
| Australia | 6 | 66 | [50;81] | ||
| India | 24 | 40 | [36;44] | ||
| China | 68 | 47 | [44;50] | ||
| South Korea | 3 | 60 | [58;68] | ||
| Singapore | 1 | 70 | [68;71] | ||
| Japan | 1 | 67 | [64;69] | ||
| Treatment Rate | |||||
| Malaysia | 6 | 33 | [25;42] | <0.0001 | |
| Thailand | 4 | 69 | [33;95] | ||
| Australia | 6 | 66 | [53;78] | ||
| India | 24 | 28 | [23;34] | ||
| China | 68 | 39 | [35;44] | ||
| Philippines | 1 | 66 | [65;66] | ||
| South Korea | 3 | 16 | [14;19] | ||
| Taiwan | 2 | 81 | [81;81] | ||
| Singapore | 1 | 68 | [66;70] | ||
| Japan | 1 | 56 | [53;59] | ||
| Control rate among those treated for hypertension | |||||
| Malaysia | 6 | 9 | [07;12] | <0.0001 | |
| Thailand | 4 | 12 | [11;12] | ||
| Australia | 6 | 28 | [07;57] | ||
| India | 24 | 8 | [06;09] | ||
| China | 68 | 12 | [09;16] | ||
| Philippines | 1 | 38 | [38;39] | ||
| South Korea | 3 | 39 | [00;95] | ||
| Taiwan | 2 | 51 | [50;52] | ||
| Singapore | 1 | 23 | [21;24] | ||
| Japan | 1 | 20 | [20;24] | ||
| Control rate among those with hypertension | |||||
| Malaysia | 6 | 21 | [07;40] | <0.0001 | |
| Thailand | 4 | 24 | [24;26] | ||
| India | 24 | 9 | [09;16] | ||
| China | 68 | 9 | [09;15] | ||
| South Korea | 3 | 15 | [15;17] | ||
| Taiwan | 2 | 61 | [61;65] | ||
CI: Confidence interval.
| Risk factor | Outcome by area | Studies (n) | Pooled rate (%) | 95% CI | Test for subgroup differences (p-value) |
|---|---|---|---|---|---|
| Diabetes mellitus | Awareness rate | ||||
| Mixed | 15 | 43 | [35; 52] | <0.0001 | |
| Urban | 2 | 79 | [75; 82] | ||
| Rural | 2 | 51 | [47; 55] | ||
| Treatment Rate | |||||
| Mixed | 15 | 33 | [26; 39] | <0.0001 | |
| Urban | 2 | 66 | [60; 73] | ||
| Rural | 2 | 39 | [34; 43] | ||
| Control Rate among Those Treated for Diabetes Mellitus | |||||
| Mixed | 15 | 16 | [10; 23] | <0.0001 | |
| Urban | 2 | 16 | [09; 25] | ||
| Rural | 2 | 5 | [03; 07] | ||
| Control Rate among Those with Diabetes Mellitus | |||||
| Mixed | 15 | 11 | [01; 29] | 0.9377 | |
| Urban | 2 | 16 | [13; 19] | ||
| Dyslpidemia | Awareness Rate | ||||
| Mixed | 6 | 24 | [15; 34] | 0.9877 | |
| Urban | 1 | 25 | [22; 28] | ||
| Treatment Rate | |||||
| Mixed | 6 | 14 | [08; 21] | 0.9039 | |
| Not reported area | 1 | 15 | [14; 16] | ||
| Control Rate among Those Treated for Dyslipidemia | |||||
| Mixed | 6 | 5 | [03; 09] | 1.000 | |
| Control Rate among Those with Dyslipidemia | |||||
| Mixed | 6 | 5 | [01; 12] | 1.000 | |
| Hypercholesterolemia | Awareness Rate | ||||
| Mixed | 1 | 64 | [62; 66] | <0.0001 | |
| Not reported area | 5 | 38 | [36; 40] | ||
| Treatment Rate | |||||
| Not reported area | 5 | 31 | [29; 33] | 1.000 | |
| Control Rate among Those with Hypercholesterolemia | |||||
| Not reported area | 5 | 35 | [23; 47] | 1.000 | |
| Hypertension | Awareness Rate | ||||
| Mixed | 54 | 42 | [37;46] | 0.0006 | |
| Not reported area | 18 | 45 | [32;58] | ||
| Urban | 18 | 49 | [40;59] | ||
| Rural | 26 | 27 | [21;32] | ||
| Treatment Rate | |||||
| Mixed | 54 | 33 | [26; 39] | <0.0001 | |
| Urban | 18 | 66 | [60; 73] | ||
| Rural | 26 | 39 | [34; 43] | ||
| Control Rate among Those Treated for Hypertension | |||||
| Mixed | 54 | 13 | [10;16] | <0.0001 | |
| Not reported area | 18 | 23 | [12;36] | ||
| Urban | 18 | 23 | [13;35] | ||
| Rural | 26 | 4 | [03;06] | ||
| Control Rate among Those with Hypertension | |||||
| Mixed | 54 | 14 | [11;17] | 0.2343 | |
| Not reported area | 18 | 14 | [04;28] | ||
| Urban | 18 | 18 | [09;30] | ||
| Rural | 26 | 9 | [05;14] | ||
CI: Confidence interval.
Assessment of biases
The Egger's tests showed no statistical significance and thus suggest lack of evidence for significant publication bias for awareness rates (p = 0.257), treatment rates (p = 0.551), control rates among those being treated (p = 0.381), and control rates among those with the risk factor of interest (p = 0.273). Supplementary Figures 1–4 present associated funnel plots. Supplementary Table 3 presents the detailed results of the quality assessment per the NOS. Among 138 studies being assessed, 8% of the studies had very good quality, 79.8% had good quality, 10.8% had satisfactory quality, and 1.4% had unsatisfactory quality.
Discussion
This study systematically reviewed published real-world evidence from population- or community-based studies and generated pooled estimates of awareness, treatment, and control rates as proxies to indicate how dyslipidemia, hypertension and diabetes mellitus as cardiovascular risk factors were managed in general adult populations in 11 APAC countries/regions. The total sample sizes and the number of countries/regions covered in this SLR represent a strength. Overall, study results suggested management of hypertension, dyslipidemia and diabetes mellitus was suboptimal in these 11 countries/regions, evidenced by relatively low pooled rates shown in Table 4.
In comparisons of the same measure among risk factors in Table 4, the low number of studies and the lowest pooled rates for dyslipidemia suggested that dyslipidemia received the least attention. In comparisons between diabetes mellitus and hypertension, most pooled rates were numerically similar and indicated no statistical difference (evidenced by overlapped CIs of pooled estimates), which suggested a similar level of disease management for diabetes mellitus and hypertension. Hypercholesterolemia had a similar level of awareness rate compared with diabetes mellitus and hypertension. Interestingly, individuals with hypercholesterolemia had a statistically lower pooled treatment rate but a higher pooled control rate (i.e., non-overlapped CIs) than those with hypertension. A similar pattern was observed between hypercholesterolemia and diabetes mellitus, but CIs were overlapped, and no statistical difference could be claimed. Nevertheless, all pooled rates were still relatively low, which suggested there was still room to improve management of these risk factors for the general adult populations in these 11 countries/regions.
Awareness of the presence of diabetes mellitus, hypertension, dyslipidemia and hypercholesterolemia plays an important role its prevention [18–20], as it would lead individuals with these risk factor(s) to seek medical attention and, in turn, trigger necessary disease self-management and proper treatments [21,22]. However, relatively low awareness rates found in this study are alerting to indicate that the general adult populations in these countries/regions may miss opportunities to medical attention and proper disease management to treat and control for these cardiovascular risk factors [18,23]. Unawareness of a cardiovascular risk factor may be due to multiple reasons, such as levels of education. For example, a study indicated that people with lower levels of education were more likely to exhibit lower sensitivity to self-report hypercholesterolemia [24].
Treatment and control rates are important indicators of cardiovascular risk factor management. Low pooled treatment and control rates reported in this study also raise a concern about under treated and under control of diabetes mellitus, hypertension, dyslipidemia and hypercholesterolemia in the general adult populations in these 11 countries/regions. A study also reported low treatment and control rates for hypertension even for those with very high risk of future cardiovascular events [25]. The suboptimal management of these cardiovascular risk factors could substantially impact the cost of illness, years of life lost and productivity-adjusted life years (PALYs) lost across the working lifetime [26].
Based on results of subgroup analysis, we found significant differences in some pooled rates by country/region (Table 5) or by living area (Table 6), which suggested that, overall, these risk factors were managed differently and perhaps received different levels of attention across countries/regions and/or living areas. For example, concerning dyslipidemia, we found a greater number (in absolute terms, not significant) of studies conducted in China reporting awareness, treatment and control rates for dyslipidemia and hypercholesterolemia. Despite the limited data, the prevalence of hypercholesterolemia in China was reported to be relatively high and the percentage of adults aware of the disease and with controlled blood cholesterol was low [27]. Results from this study showed pooled control rate among individuals with hypercholesterolemia was lower in China than in Japan or South Korea. This suggests unmet need for hypercholesterolemia and dyslipidemia care in China. Improved management of dyslipidemia and hypercholesterolemia should be considered as an important component of a national public health strategy to reduce the substantial and increasing burden of cardiovascular disease in China. A SLR by Alabousi and colleagues [5] showed twofold or higher rates (awareness rates: 81%–84% for hypertension; 43%–63% for dyslipidemia; and 84%–88% for diabetes mellitus; treatment rates: 72%–82% for hypertension; 20%–44% for dyslipidemia; 80%–87% for diabetes mellitus; control rates: 48%–68% for hypertension; 42%–65% for dyslipidemia; 35%–59% for diabetes mellitus) in the US and Canada in comparison with the findings in our study. This suggests more efforts should be added to improve management of hypertension, dyslipidemia and diabetes mellitus in our target Asian countries.
Concerning the diversity by living area, we observed that, in general, pooled rates were either statistically or numerically higher in urban area than other types of living areas for diabetes mellitus or hypertension. Another study reported inconclusive results about the prevalence of CVD risk factors in rural areas; however caution should be taken when interpreted this information due to the limited data [28]. It seems inconclusive whether urbanization impacts the environmental and lifestyle factors, and the individual health and well-being. The influence of urbanization on health can be mixed. On the one hand, there are the benefits of ready access to healthcare, sanitation, and secure nutrition, while on the other, there are the evils of overcrowding, pollution, social deprivation, crime, and stress-related illness [29]. In our study, the treatment rate of hypertensive individuals was greater in urban areas which may be attributed to a perspective of ‘urban health advantage’, that considers the special resources, protective effect of cities and emphasizes the positive aspects of cities in the management of the CVD risks factors [29].
It was estimated that 50% reduction from 14% to 7% in prevalence of hypertension from 2015 to 2030 would lead to 5% reduction in mortality in adults aged 30–69 years globally [30,31]. A modelling study estimated that public health interventions aiming to reduce cardiovascular risk factors would be cost-effective with return on investment (ROI) ranging from 15.0 to 27.5 in an at risk population [32]. Costs related to lost productivity attributable to CV risk factors were estimated in a range from $3.2 to 23.1 billion annually (2005 US Dollars) in the US [33]. However, publications that specifically demonstrate the impact of reaching WHO cardiovascular risk factor targets in real-world settings remain scarce. Nevertheless, more efforts to optimize management of hypertension, dyslipidemia, and diabetes mellitus are still required to achieve WHO-recommended targets of risk factors reduction [3,31]. To prioritize efforts to reach the WHO target, we recommend that decision-makers such as health professionals, health policymakers, and national taxpayers consider reallocating resources to make lipid control a national priority, in addition to existing priorities of hypertension and diabetes mellitus management.
Our study identified large gaps in important evidence needed to inform efforts at cardiovascular risk factor reduction in the APAC region. The numbers of studies from China allow proper interpretations of the pooled rates, but very few studies or no studies were identified in some countries/regions (e.g., Hong Kong, Malaysia, Singapore, and Taiwan). Wide ranges of awareness, treatment, and control rates as well as high heterogeneity for pooled estimates were observed in overall analysis of the risk factors. Several factors may have contributed to the high heterogeneity found in this SLR: considerable inherent diversity (e.g., socioeconomic status, population characteristics, cultural and behavioural differences) within the same country/region and across countries/regions, subgroups of populations investigated (e.g., treated vs non-treated, patients without CVD vs with history of CVD, different age groups), different definitions of the conditions (e.g., high blood pressure considered to be 130/80 mmHg or 140/90 mmHg), other factors not controlled or unobserved in most studies (e.g., behavioural factors, socioeconomic disparities), and/or diverse clinical practice of cardiovascular risk factor management in the various countries/regions. During our reviews of included studies, we found various definitions of hypertension, diabetes mellitus, and dyslipidemia (Table 1), which may partially explain the wide ranges of awareness rates. Unfortunately, the evidence across many countries/regions suggests discrepancies between clinical guidelines to control the CVD risk factors and actual clinical practice patterns in real-world settings [34].
Our study should be interpreted in light of some limitations. First of all, this meta-analysis included 11 countries/regions, but the majority of articles are from China, while scarce studies or virtually no study were found for some countries/regions; therefore, the results may not be generalizable to the entire APAC region. The second limitation is the considerable heterogeneity that is not fully explained. The heterogeneity could be attributed to different definitions, local guidelines or criteria used by researchers of included studies to define hypertension, dyslipidemia, and diabetes mellitus, to use different biomarkers, to decide which patients were treated, to include different types and durations of treatments and to determine how well conditions were controlled. The third limitation is that included articles have their specific methodological limitations, and the result of our meta-analysis comprehends these limitations. Funnel plots are traditionally constructed to facilitate assessment of publication bias, but could be potentially misleading in meta-analyses of proportions/rates [35]. Thus, despite the Egger's test leads to the failure to reject asymmetry in the funnel plot, subjectively the graphics demonstrate the opposite: in the top part of the plot the studies do not lie within the limits due to the greater number of studies with a large sample size.
Strengths of our study should also be highlighted. The data shown are from the general population or community-based, in addition to present features of a representative number of individuals, which enhance the findings. Additionally, this is the first SLR and meta-analysis that reviews and summarizes the awareness, treatment and control rates in these 11 Asian countries/regions.
Future public health policies and interventions must be designed in each country/region and take into consideration all those factors to promote health and achieve a considerable reduction in CVD cases. Yet, further comparative effectiveness research or prediction models would also be warranted to provide more insights and suggestions to guide resource allocation and prioritization among management of cardiovascular risk factors. Finally, these findings demonstrate the importance of health measures to prevent CVDs in APAC countries.
Future perspective
Effective and innovative strategies that would lead to better controls of hypertension, dyslipidemia, and diabetes mellitus are warranted in APAC countries/regions to achieve WHO-recommended targets for risk factor reduction. In addition to better hypertension and diabetes mellitus management, resources for the management of dyslipidemia including hypercholesterolemia should be given a greater priority. Evidence gaps were identified, particularly the need for data on awareness, treatment, and control rates of alcohol consumption, smoking, obesity, and physical inactivity.
•
The World Health Organization (WHO) recommended several targets to reduce risk factors to reduce 25% of premature deaths, including deaths from cardiovascular disease, by the year 2025. To prioritize efforts to reach WHO targets, the status of cardiovascular risk factor management must be understood; however, little is known in Asia–Pacific (APAC) countries/regions.
•
Systematic literature reviews of 138 studies showed management of hypertension, dyslipidemia (including hypercholesterolemia) and diabetes mellitus in adults was generally suboptimal in 11 APAC countries/regions.
•
Individuals with dyslipidemia received the least attention based on the lowest pooled awareness, treatment and control rates compared with other risk factors. Levels of awareness with diabetes mellitus, hypertension and hypercholesterolemia were comparable, but individuals with hypercholesterolemia had a statistically lower pooled treatment rate but a higher pooled control rate than those with hypertension. Variations and high heterogeneity were observed across risk factors, countries/regions, and living areas.
Author contributions
EJ Yeh initiated the study concept and prepared the study protocol. All authors were involved in the design of the study and interpretations of results. RB Grigolon, APA Bueno and SR Rodrigues performed the identification and selection of articles. RB Grigolon and SR Rodrigues worked on data extraction. RB Grigolon performed the statistical analysis. APA Bueno prepared the first draft of the manuscript. EJ Yeh made substantial changes and finalize the manuscript.
Acknowledgments
The authors thank E de Sá Moreira for reviews on this manuscript with comments.
Portions of this work were presented previously at the International Society for Pharmacoeconomics and Outcomes Research Asia Pacific Conference, virtual conference, 14–15 September 2020.
Financial & competing interests disclosure
This study was sponsored by Amgen Inc. The sponsor contributed to the study design, interpretation of data, and decision to submit the article for publication. EJ Yeh is an employee of Amgen and holds Amgen stock. RB Grigolon, SR Rodrigues and APA Bueno were employee of Cerner Enviza, which all received consulting fees from Amgen to conduct this work. The authors have no other relevant affiliations or financial involvement with any organization or entity with a financial interest in or financial conflict with the subject matter or materials discussed in the manuscript apart from those disclosed.
No writing assistance was utilized in the production of this manuscript.
Open access
This work is licensed under the Attribution-NonCommercial-NoDerivatives 4.0 Unported License. To view a copy of this license, visit http://creativecommons.org/licenses/by-nc-nd/4.0/
Supplementary Material
File (supplementary material.docx)
- Download
- 227.83 KB
References
Papers of special note have been highlighted as: • of interest; •• of considerable interest
1.
World Health Organization. Cardiovascular diseases (CVDs) [Internet] (2017). Available from: www.who.int/news-room/fact-sheets/detail/cardiovascular-diseases-(cvds)
2.
Global Burden of Disease Collaborative Network. Global Burden of Disease 2019, Latest GBD results: 2019 [Internet]. Seattle, WA Inst. Heal. Metrics Eval. (2020). Available from: www.healthdata.org/gbd/gbd-2019-resources
3.
World Health Organization. Global Action Plan for the Prevention and Control of NCDs 2013–2020 [Internet]. (2020). Available from: www.who.int/publications/i/item/9789241506236
•• Refers to the core interest of performing this study.
4.
Zaman J, Brunner E. Social inequalities and cardiovascular disease in South Asians. Heart 94(4), 406–407 (2008).
5.
Alabousi M, Abdullah P, Alter DA et al. Cardiovascular risk factor management performance in Canada and the United States: a Systematic Review. Can. J. Cardiol. 33(3), 393–404 (2017).
• Refers to a similar study design but in another region of the world.
6.
Ouzzani M, Hammady H, Fedorowicz Z, Elmagarmid A. Rayyan – a web and mobile app for systematic reviews. Syst. Rev. 5(1), 210 (2016).
7.
Moher D, Pham B, Lawson ML, Klassen TP. The inclusion of reports of randomised trials published in languages other than English in systematic reviews. Health Technol. Assess. 7(41), 1–90 (2003).
8.
Page MJ, Moher D, Bossuyt PM et al. PRISMA 2020 explanation and elaboration: updated guidance and exemplars for reporting systematic reviews. BMJ. 372, n160 (2021).
9.
Nyaga VN, Arbyn M, Aerts M. Metaprop: a Stata command to perform meta-analysis of binomial data. Arch. Public Health. 72(1), 39 (2014).
10.
DerSimonian R, Laird N. Meta-analysis in clinical trials. Control. Clin. Trials 7(3), 177–188 (1986).
11.
Egger M, Smith GD, Schneider M, Minder C. Bias in meta-analysis detected by a simple, graphical test. BMJ 315(7109), 629–634 (1997).
12.
Stang A. Critical evaluation of the Newcastle-Ottawa scale for the assessment of the quality of nonrandomized studies in meta-analyses. Eur. J. Epidemiol. 25(9), 603–605 (2010).
13.
Goswami AK, Gupta SK, Kalaivani M, Nongkynrih B, Pandav CS. Burden of hypertension and diabetes among urban population aged ≥60 years in South Delhi: a community based study. J. Clin. Diagnostic Res. 10(3), LC01–LC05 (2016).
14.
Gupta S, Kumar R, Kalaivani M, Nongkynrih B, Kant S, Gupta SK. Prevalence, awareness, treatment, and control of diabetes and hypertension among elderly persons in a Rural area of Ballabgarh, Haryana. J. Fam. Med. Prim. care. 9(2), 777–782 (2020).
15.
Li C, Lumey LH. Impact of disease screening on awareness and management of hypertension and diabetes between 2011 and 2015: results from the China health and retirement longitudinal study. BMC Public Health. 19(1), 4–11 (2019).
16.
Lu Y, Wang P, Zhou T et al. Comparison of prevalence, awareness, treatment, and control of cardiovascular risk factors in China and the United States. J. Am. Heart Assoc. 7(3), 1–17 (2018).
17.
Porapakkham Y. Prevalence, awareness, treatment and control of hypertension and diabetes mellitus among the elderly: the 2004 National Health Examination Survey Ill, Thailand. Singapore Med. J. 49(11), 868–873 (2004).
18.
Yip W, Wong TY, Jonas JB et al. Prevalence, awareness, and control of hypertension among Asian Indians living in urban Singapore and rural India. J. Hypertens. 31(8), 1539–1546 (2013).
19.
Huang OS, Tay WT, Tai ES et al. Lack of awareness amongst community patients with diabetes and diabetic retinopathy: the Singapore Malay eye study. Ann Acad Med Singapore. 38(12), 1048–1055 (2009).
20.
Joffres M, Shields M, Tremblay MS, Gorber SC. Dyslipidemia prevalence, treatment, control, and awareness in the Canadian Health Measures Survey. Can. J. Public Heal. 104(3), e252–e257 (2013).
21.
Awad A, Al-Nafisi H. Public knowledge of cardiovascular disease and its risk factors in Kuwait: a cross-sectional survey. BMC Public Health. 14(1), 1–11 (2014).
22.
Heydari A, Ziaee ES, Gazrani A. Relationship between awareness of disease and adherence to therapeutic regimen among cardiac patients. Int. J. community based Nurs. midwifery. 3(1), 23 (2015).
23.
Malhotra R, Chan A, Malhotra C, Østbye T. Prevalence, awareness, treatment and control of hypertension in the elderly population of Singapore. Hypertens. Res. 33(12), 1223–1231 (2010).
24.
Man REK, Gan AHW, Fenwick EK et al. Prevalence, determinants and association of unawareness of diabetes, hypertension and hypercholesterolemia with poor disease control in a multi-ethnic Asian population without cardiovascular disease. Popul. Health Metr. 17(1), 1–10 (2019).
25.
Kim JS, Kim CG. Gender differences in hypertension treatment and control in young adults. J. Nurs. Res. 28(3), 1–14 (2020).
26.
Jung C-H, Son JW, Kang S et al. Diabetes fact sheets in Korea, 2020: an appraisal of current status. Diabetes Metab. J. 45(1), 1–10 (2021).
27.
He J, Gu D, Reynolds K et al. Serum total and lipoprotein cholesterol levels and awareness, treatment, and control of hypercholesterolemia in China. Circulation 110(4), 405–411 (2004).
28.
Oh S-H, Ku H, Park KS. Prevalence and socioeconomic burden of diabetes mellitus in South Korean adults: a population-based study using administrative data. BMC Public Health. 21(1), 1–13 (2021).
29.
Chow C, Cardona M, Raju PK et al. Cardiovascular disease and risk factors among 345 adults in rural India – the Andhra Pradesh Rural Health Initiative. Int. J. Cardiol. 116(2), 180–185 (2007).
30.
Perel P, Avezum A, Huffman M et al. Reducing premature cardiovascular morbidity and mortality in people with atherosclerotic vascular disease. WHF roadmap Second. Prev. Cardiovasc. Dis. Glob Hear. 10, 99–110 (2015).
•• Refers to the core interest of performing this study.
31.
Frieden TR, Cobb LK, Leidig RC, Mehta S, Kass D. Reducing premature mortality from cardiovascular and other non-communicable diseases by one third: Achieving Sustainable Development Goal Indicator 3.4.1. Glob. Heart. 15(1), 50 (2020).
•• Refers to the core interest of performing this study.
32.
Smith L, Atherly A, Campbell J, Flattery N, Coronel S, Krantz M. Cost-effectiveness of a statewide public health intervention to reduce cardiovascular disease risk. BMC Public Health 19(1), 1234 (2019).
33.
Sullivan PW, Ghushchyan V, Wyatt HR, Wu EQ, Hill JO. Productivity costs associated with cardiometabolic risk factor clusters in the United States. Value Heal. 10(6), 443–450 (2007).
34.
Afsargharehbagh R, Rezaie-Keikhaie K, Rafiemanesh H, Balouchi A, Bouya S, Dehghan B. Hypertension and pre-hypertension among iranian adults population: a Meta-Analysis of prevalence, awareness, treatment, and control. Curr. Hypertens. Rep. 21(4), 27 (2019).
• Refers to a similar study design but in another region of the world.
35.
Hunter JP, Saratzis A, Sutton AJ, Boucher RH, Sayers RD, Bown MJ. In meta-analyses of proportion studies, funnel plots were found to be an inaccurate method of assessing publication bias. J. Clin. Epidemiol. 67(8), 897–903 (2014).
36.
Abdul-Razak S, Daher AM, Ramli AS et al. Prevalence, awareness, treatment, control and socio demographic determinants of hypertension in Malaysian adults. BMC Public Health 16(1), 1–10 (2016).
37.
Aekplakorn W, Sangthong R, Kessomboon P et al. Changes in prevalence, awareness, treatment and control of hypertension in Thai population, 2004–2009: Thai National Health Examination Survey III-IV. J. Hypertens. 30(9), 1734–1742 (2012).
38.
Appleton SL, Neo C, Hill CL, Douglas KA, Adams RJ. Untreated hypertension: prevalence and patient factors and beliefs associated with under-treatment in a population sample. J. Hum. Hypertens. 27(7), 453–462 (2013).
39.
Banerjee S. ScienceDirect Prevalence, awareness, and control of hypertension in the slums of Kolkata. Indian Heart J. 1–9 (2015). Available from:.
40.
Bhardwaj R, Kandoria A, Marwah R et al. Prevalence, awareness and control of hypertension in rural communities of Himachal Pradesh. J. Assoc. Physicians India 58(7), 423–425 (2010).
41.
Bunnag P, Plengvidhya N, Deerochanawong C et al. Thailand diabetes registry project: prevalence of hypertension, treatment and control of blood pressure in hypertensive adults with type 2 diabetes. J. Med. Assoc. Thai. 89(Suppl. 1), S72–S77 (2006).
42.
Busingye D, Arabshahi S, Evans RG et al. Factors associated with awareness, treatment and control of hypertension in a disadvantaged rural Indian population. J. Hum. Hypertens. 31(5), 347–353 (2017).
43.
Cai L, Liu A, Zhang L, Li S, Wang P. Prevalence, awareness, treatment, and control of hypertension among adults in Beijing, China. Clin. Exp. Hypertens. 34(1), 45–52 (2012).
44.
Campbell DJ, Coller M, Gong FF et al. Risk factor management in a contemporary Australian population at increased cardiovascular disease risk. Intern Med J. 48(6), 688–698 (2018).
45.
Castillo RR, Atilano AA, David-Ona DI et al. May Measurement Month 2017: an analysis of blood pressure screening in the Philippines – South-East Asia and Australasia. Eur. Hear. Journal, Suppl. 21, D92–D96 (2019).
46.
Chaturvedi S, Pant M, Neelam, Yadav G. Hypertension in Delhi: prevalence, awareness, treatment and control. Trop. Doct. 37(3), 142–145 (2007).
47.
Chen Y, Yu S, Chen S et al. The current situation of hypertension among rural minimal assurance family participants in Liaoning (China): a cross-sectional study. Int. J. Environ. Res. Public Health. 13(12), 1199 (2016).
48.
Chen C, Yuan Z. Prevalence and risk factors for prehypertension and hypertension among adults in Central China from 2000–2011. Clin. Exp. Hypertens 40(8), 1–10 (2018). Available from:.
49.
Chen X, Li Y, Hu Z et al. May measurement month 2018: an analysis of blood pressure screening results from China. Eur. Hear. Journal, Suppl. 22, H40–H42 (2020).
50.
Chua B, Rochtchina E, Mitchell P. Temporal changes in the control of blood pressure in an older Australian population. J. Hum. Hypertens. 19(9), 691–696 (2005).
51.
Dong G-H, Sun Z-Q, Zhang X-Z et al. Prevalence, awareness, treatment & control of hypertension in rural Liaoning province, China. Indian J. Med. Res. 128(2), 122–127 (2008).
52.
Dong C, Ge P, Ren X, Fan H, Yan X. Prevalence, awareness, treatment and control of hypertension among adults in rural north-western China: a cross-sectional population survey. J. Int. Med. Res. 41(4), 1291–1300 (2013).
53.
Fan L, Feng S xian, Han B et al. Prevalence, awareness, treatment and control of hypertension in Henan province, China. Aust. J. Rural Health. 22(5), 264–269 (2014).
54.
Fan W guo, Xie F, Wan Y rong, Campbell NRC, Su H. The impact of changes in population blood pressure on hypertension prevalence and control in China. J. Clin. Hypertens. 22(2), 150–156 (2020).
55.
Feng XL, Beard J. Health system strengthening and hypertension awareness, treatment and control: data from the China Health and Retirement Longitudinal Study. 92(1), 29–41 (2014).
56.
Gao Y, Chen G, Tian H et al. Prevalence of Hypertension in China: A Cross-Sectional Study. PLOS One. 8(6), e65938 (2013).
57.
Gu J, Zhang XJ, Wang TH, Zhang Y, Chen Q. Hypertension knowledge, awareness, and self-management behaviors affect hypertension control: a community-based study in Xuhui district, Shanghai, China. Cardiol. 127(2), 96–104 (2014).
58.
Gupta R, Kaur M, Islam S et al. Association of household wealth index, educational status, and social capital with hypertension awareness, treatment, and control in South Asia. Am. J. Hypertens. 30(4), 373–381 (2017).
59.
Hazarika NC, Biswas D, Mahanta J. Hypertension in the elderly population of Assam. J. Assoc. Physicians India 51(JUN), 567–573 (2003).
60.
Hird TR, Zomer E, Owen AJ, Magliano DJ, Liew D, Ademi Z. Productivity burden of hypertension in Australia: a life table modeling study. Hypertension 73(4), 777–784 (2019).
61.
Howteerakul N, Suwannapong N, Sittilerd R, Rawdaree P. Health risk behaviours, awareness, treatment and control of hypertension among rural community people in Thailand. Asia-Pacific J. Public Heal. 18(1), 3–9 (2006).
62.
Li W, Gu H, Teo KK et al. Hypertension prevalence, awareness, treatment, and control in 115 rural and urban communities involving 47 000 people from China. J. Hypertens. 34(1), 39–46 (2016).
63.
Hu L, Huang X, You C et al. Prevalence and Risk Factors of Prehypertension and Hypertension in Southern China. PLOS One. 12(1), 1–15 (2017).
64.
Huang X bo, Chen F, Dai W et al. Prevalence and risk factors associated with hypertension in the Chinese Qiang population. Clin. Exp. Hypertens. 40(5), 427–433 (2018).
65.
Huang XB, Zhang Y, Wang TD et al. Prevalence, awareness, treatment, and control of hypertension in southwestern China. Sci. Rep. 9(1), 1–7 (2019).
66.
Jiang B, Liu H, Ru X, Zhang H, Wu S, Wang W. Hypertension detection, management, control and associated factors among residents accessing community health services in Beijing. Sci. Rep. 4 (2014).
67.
Karmakar N, Nag K, Saha I, Parthasarathi R, Patra M, Sinha R. Awareness, treatment, and control of hypertension among adult population in a rural community of Singur block, Hooghly District, West Bengal Nabarun. J. Educ. Health Promot. 7(134), 1–6 (2018).
68.
Kaur P, Rao SR, Radhakrishnan E, Rajasekar D, Gupte MD. Prevalence, awareness, treatment, control and risk factors for hypertension in a rural population in South India. Int. J. Public Health. 57(1), 87–94 (2012).
69.
Kaur P, Rao SR, Venkatachalam R, Kaliaperumal K. Hypertension treatment and control in a rural cohort in Thiruvallur, Tamil Nadu, India. Indian J. Public Health 60(4), 298–301 (2016).
70.
Kawazoe N, Zhang X, Chiang C et al. Prevalence of hypertension and hypertension control rates among elderly adults during the cold season in rural Northeast China: a cross-sectional study. J. Rural Med. 13(1), 64–71 (2018).
71.
Ke L, Ho J, Feng J et al. Prevalence, awareness, treatment and control of hypertension in Macau: results from a cross-sectional epidemiological study in Macau, China. Am. J. Hypertens. 28(2), 159–165 (2015).
72.
Kiau BB, Kau J, Nainu BM et al. Prevalence, awareness, treatment and control of hypertension among the elderly: the 2006 National Health and Morbidity Survey III in Malaysia. Med. J. Malaysia. 68(4), 332–337 (2013).
73.
Lee HS, Park YM, Kwon HS et al. Prevalence, awareness, treatment, and control of hypertension among people over 40 years old in a rural area of South Korea: The Chungju Metabolic Disease Cohort (CMC) study. Clin. Exp. Hypertens. 32(3), 166–178 (2010).
74.
Lewington S, Lacey B, Clarke R et al. The burden of hypertension and associated risk for cardiovascular mortality in China. JAMA Intern. Med. 176(4), 524–532 (2016).
75.
Li H, Meng Q, Sun X, Salter A, Briggs NE, Hiller JE. Prevalence, awareness, treatment, and control of hypertension in rural China: Results from Shandong Province. J. Hypertens. 28(3), 432–438 (2010).
76.
Li Z, Guo X, Zheng L, Yang H, Sun Y. Grim status of hypertension in rural China: results from Northeast China rural cardiovascular health study 2013. J. Am. Soc. Hypertens. 9(5), 358–364 (2015).
77.
Li H, Yan X, Deng X et al. A cross-sectional study of the prevalence, awareness, treatment and control of hypertension in Shenzhen, China. BMJ Open. 7(6), 1–7 (2017).
78.
Li T, Song X, Wu J et al. Awareness of hypertension and related factors in northeastern China: a cross-sectional study. J. Hum. Hypertens. 34(1), 43–50 (2020).
79.
Li D, Zeng X, Huang Y et al. Increased risk of hypertension in young adults in Southwest China: Impact of the 2017 ACC/AHA High Blood Pressure Guideline. Curr. Hypertens. Rep. 21(3), 21 (2019).
80.
Li C, Lumey LH. Impact of disease screening on awareness and management of hypertension and diabetes between 2011 and 2015: results from the China health and retirement longitudinal study. 19, 421 (2019).
81.
Li D, Wei X, Wu H, Liu X, Ge C, Gao W. Effect of an intelligent family physician-optimised coordination model program on hypertension management in a Beijing community. Aust. J. Prim. Health. 26(5), 402–409 (2020).
82.
Liang X, Zhong H, Xiao L. The effect of community hypertension management on blood pressure control and its determinants in southwest China. Int. Health. 12(3), 203–212 (2020).
83.
Liao Y, Gilmour S, Shibuya K. Health insurance coverage and hypertension control in China: results from the China health and nutrition survey. PLOS One. 11(3), 1–14 (2016).
84.
Lim TO, Morad Z, Hussein RH et al. Prevalence, Awareness, Treatment and Control of Hypertension in the Malaysian adult population: results from the National Health and Morbidity Survey 1996. Singapore Med. J. 45(1), 20–27 (2004).
85.
Lim SM, Park YH, Jhang WG et al. Evaluation of community-based hypertension control programme in South Korea. Ann. Acad. Med. Singapore. 47(4), 143–148 (2018).
86.
Lin CS, Chu YH, Hung YJ, Lee DY, Chen GY. Outpatient hypertension control and prescribing habits for hypertension in Taiwan. Acta Cardiol. Sin. 29(6), 539–549 (2013).
87.
Liu X, Gu W, Li Z, Lei H, Li G, Huang W. Hypertension prevalence, awareness, treatment, control, and associated factors in Southwest China: an update. J. Hypertens. 35(3), 637–644 (2017).
88.
Liu X, Li Y, Guo Y et al. The burden, management rates and influencing factors of high blood pressure in a Chinese rural population: The Rural Diabetes, Obesity and Lifestyle (RuralDiab) study. J. Hum. Hypertens. 32(3), 236–246 (2018).
89.
Liu B, Liu H, Na R et al. A comparison on prevalence of hypertension and related risk factors between island and rural residents of Dalian City, China. Int. J. Hypertens. 2019, 1–8 (2019).
90.
Lu J, Lu Y, Wang X et al. Prevalence, awareness, treatment, and control of hypertension in China: data from 1.7 million adults in a population-based screening study (China PEACE Million Persons Project). Lancet 390(10112), 2549–2558 (2017).
91.
Lv X, Niu H, Qu Y et al. Awareness, treatment and control of hypertension among hypertensive patients aged 18 to 59 years old in the northeast of China. Sci. Rep. 8(1), 1–10 (2018).
92.
Ma L, Zhao X, Tang Z et al. Epidemiological characteristics of hypertension in the elderly in Beijing, China. PLOS One. 10(8), 1–8 (2015).
93.
Ab Majid NL, Omar MA, Khoo YY et al. Prevalence, Awareness, Treatment and Control of hypertension in the Malaysian population: findings from the National Health and Morbidity Survey 2006–2015. J. Hum. Hypertens. 32(8–9), 617–624 (2018).
94.
Meng XJ, Dong GH, Wang D et al. Prevalence, awareness, treatment, control, and risk factors associated with hypertension in urban adults from 33 communities of China: The CHPSNE study. J. Hypertens. 29(7), 1303–1310 (2011).
95.
Mi B, Dang S, Li Q et al. Association between awareness of hypertension and health-related quality of life in a cross-sectional population-based study in rural area of northwest China. Med. (United States). 94(29), 1–8 (2015).
96.
Mohan V, Deepa M, Farooq S, Datta M, Deepa R. Prevalence, awareness and control of hypertension in Chennai – The Chennai Urban Rural Epidemiology Study (CURES - 52). J. Assoc. Physicians India 55(MAY), 326–332 (2007).
97.
Muntner P, Gu D, Wu X et al. Factors associated with hypertension awareness, treatment, and control in a representative sample of the Chinesepopulation. Hypertension 43(3), 578–585 (2004).
98.
Naing C, Yeoh PN, Wai VN, Win NN, Kuan LP, Aung K. Hypertension in Malaysia: an analysis of trends from the national surveys 1996 to 2011. Med. (United States). 95(2), 1–7 (2016).
99.
Oteh M, Azarisman SMS, Azreen SA et al. Institutional hypertension control in Malaysia: a multicenter study focusing on gender and cardiovascular risk factor profile difference. Hypertens. Res. 34(3), 319–324 (2011).
100.
Pan HY, Lin HJ, Chen WJ, Wang TD. Prevalence, treatment, control and monitoring of hypertension: a nationwide community-based survey in Taiwan, 2017. Acta Cardiol. Sin. 36(4), 375–381 (2020).
101.
Pang W, Li Z, Sun Z et al. Prevalence of hypertension and associated factors among older rural adults: results from Liaoning Province, China. Med. Princ. Pract. 19(1), 22–27 (2010).
102.
Prenissl J, Manne-Goehler J, Jaacks LM et al. Hypertension screening, awareness, treatment, and control in india: a nationally representative cross-sectional study among individuals aged 15 to 49 years. PLOS Med. 16(5), 1–18 (2019).
103.
Qiao S, Ye Q, Dou Y et al. Analysis for hypertension and related risk factors of physical examination population. Int. J. Clin. Exp. Med. 6(9), 785–793 (2013).
104.
Roy A, Praveen PA, Amarchand R et al. Changes in hypertension prevalence, awareness, treatment and control rates over 20 years in National Capital Region of India: results from a repeat cross-sectional study. BMJ Open. 7(7), e015639 (2017).
105.
Ruixing Y, Jinzhen W, Shangling P, Weixiong L, Dezhai Y, Yuming C. Sex differences in environmental and genetic factors for hypertension. Am. J. Med. 121(9), 811–819 (2008).
106.
Saju MD, Allagh KP, Scaria L, Joseph S, Thiyagarajan JA. Prevalence, awareness, treatment, and control of hypertension and its associated risk factors: results from Baseline Survey of SWADES Family Cohort Study. Int. J. Hypertens. 2020, 4964835 (2020).
107.
Sathish T, Kannan S, Sarma PS, Razum O, Thankappan KR. Incidence of hypertension and its risk factors in rural Kerala, India: a community-based cohort study. Public Health 126(1), 25–32 (2012).
108.
Satoh A, Arima H, Ohkubo T et al. Associations of socioeconomic status with prevalence, awareness, treatment, and control of hypertension in a general Japanese population: NIPPON DATA2010. J. Hypertens. 35(2), 401–408 (2017).
109.
Sheng CS, Liu M, Kang YY et al. Prevalence, awareness, treatment and control of hypertension in elderly Chinese. Hypertens. Res. 36(9), 824–828 (2013).
110.
Singh RB, Fedacko J, Pella D et al. Prevalence and risk factors for prehypertension and hypertension in five Indian cities. Acta Cardiol. 66(1), 29–37 (2011).
111.
Singh S, Shankar R, Singh GP. Prevalence and associated risk factors of hypertension: a cross-sectional study in urban Varanasi. Int. J. Hypertens 2017, 5491838 (2017).
112.
Sui H, Wang W, Cheng HY, Cheng YF, Liu LS, Zhange W. Characterization, risk stratification and the hypertension control rate at hospital-based clinics: a survey of 25,336 hypertensives in Beijing, Shanghai and Guangzhou. Intern. Med. 52(17), 1863–1867 (2013).
113.
Sun Z, Zheng L, Wei Y et al. The prevalence of prehypertension and hypertension among rural adults in Liaoning province of China. Clin. Cardiol. 30(4), 183–187 (2007).
114.
Sun Z, Zheng L, Detrano R et al. Incidence and predictors of hypertension among rural Chinese adults: results from Liaoning province. Ann. Fam. Med. 8(1), 19–24 (2010).
115.
Thankappan KR, Sivasankaran S, Abdul Khader S et al. Prevalence, correlates, awareness, treatment, and control of hypertension in Kumarakom, Kerala: baseline results of a community-based intervention program. Indian Heart J. 58(1), 28–33 (2006).
116.
Thankappan KR, Sivasankaran S, Mini GK, Daivadanam M, Sarma PS, Khader A. Impact of a community based intervention program on awareness, treatment and control of hypertension in a rural Panchayat, Kerala, India. Indian Heart J. 65(5), 504–509 (2013).
117.
Tian S, Dong GH, Wang D et al. Factors associated with prevalence, awareness, treatment and control of hypertension in urban adults from 33 communities in China: The CHPSNE Study. Hypertens. Res. 34(10), 1087–1092 (2011).
118.
Tripathy JP, Thakur JS, Jeet G, Chawla S, Jain S. Alarmingly high prevalence of hypertension and pre-hypertension in North India-results from a large cross-sectional STEPS survey. PLOS One. 12(12), 1–16 (2017).
119.
Wang Z wu, Wu Y feng, Zhao L cheng, Li Y, Yang J, Zhou B fan. Trends in prevalence, awareness, treatment and control of hypertension in middle-aged Chinese population. Zhonghua Liu Xing Bing Xue Za Zhi. 25(5), 407–411 (2004).
120.
Wang H, Zhang X, Zhang J et al. Factors associated with prevalence, awareness, treatment and control of hypertension among adults in Southern China: a community-based, cross-sectional survey. PLOS One. 8(5), e62469 (2013).
121.
Wang Z, Chen Z, Zhang L et al. Status of hypertension in China: results from the China hypertension survey, 2012–2015. Circulation 137(22), 2344–2356 (2018).
122.
White F, Wang L, Jelinek H. Awareness and pharmacotherapy of hypertension in a rural community. Med. Princ. Pract. 18(4), 261–265 (2009).
123.
Wu L, He Y, Jiang B et al. Trends in prevalence, awareness, treatment and control of hypertension during 2001–2010 in an Urban elderly population of China. PLOS One. 10(8), 1–13 (2015).
124.
Wu X, Pan B, Chen X et al. Useful information for hypertension management reform in community health care: prevalence, awareness, treatment and control among Guangzhou adults. Clin. Exp. Hypertens. 36(4), 227–235 (2014).
125.
Xing L, Liu S, Tian Y et al. Trends in status of hypertension in rural northeast China: results from two representative cross-sectional surveys, 2013–2018. J. Hypertens. 37(8), 1596–1605 (2019).
126.
Xing L, Jing L, Tian Y et al. Urban–Rural disparities in status of hypertension in northeast China: a population-based study, 2017–2019. Clin. Epidemiol. 11, 801–820 (2019).
127.
Yang J, Lu F, Zhang C et al. Prevalence of prehypertension and hypertension in a Chinese rural area from 1991 to 2007. Hypertens. Res. 33(4), 331–337 (2010).
128.
Yang L, Xu X, Yan J et al. Analysis on associated factors of uncontrolled hypertension among elderly hypertensive patients in Southern China: a community-based, cross-sectional survey. BMC Public Health. 14(1), 1–8 (2014).
129.
Yang L, Yan J, Tang X, Xu X, Yu W, Wu H. Prevalence, awareness, treatment, control and risk factors associated with hypertension among adults in Southern China, 2013. PLOS One. 11(1), 1–14 (2016).
130.
Yin M, Augustin B, Fu Z, Yan M, Fu A, Yin P. Geographic distributions in hypertension diagnosis, measurement, prevalence, awareness, treatment and control rates among middle-aged and older adults in China. Sci. Rep. 6(November), 1–11 (2016).
131.
Yongqing Z, Ming W, Jian S et al. Prevalence, awareness, treatment and control of hypertension and sodium intake in Jiangsu Province, China: a baseline study in 2014. BMC Public Health 16(1), 1–8 (2016).
132.
You Y, Wang J, Teng W, Ma G, Liu P. Blood pressure and noncommunicable diseases in middle-aged and older adults in China. PLOS One. 13(11), 1–10 (2018).
133.
You Y, Teng W, Wang J et al. Hypertension and physical activity in middle-aged and older adults in China. Sci. Rep. 8(1), 1–8 (2018).
134.
Yuvaraj BY, Nagendra Gowda MR, Umakantha AG. Prevalence, awareness, treatment, and control of hypertension in rural areas of Davanagere. Indian J. Community Med. 35(1), 138–141 (2010).
135.
Zhang X, Zhu M, Dib HH, Hu J. Knowledge, awareness, behavior (KAB) and control of hypertension among urban elderly in Western China. Int. J. Cardiol. 137(1), 9–15 (2009).
136.
Guo FZZ, Wu YXY, Yi HL. Hypertension prevalence, awareness, treatment, and control in northeast China: a population-based cross-sectional survey. J. Hum. Hypertens [Internet] (2017). Available from:.
137.
Zhao Y, Mahal AS, Haregu TN, Katar A, Oldenburg B, Zhang L. Trends and inequalities in the health care and hypertension outcomes in China, 2011 to 2015. Int. J. Environ. Res. Public Health. 16(22), 4578 (2019).
138.
Zhao Y, Lu F, Sun H et al. Trends in hypertension prevalence, awareness, treatment, and control rates in shandong province of China. J. Clin. Hypertens. 14(9), 637–643 (2012).
139.
Zhou Y, Jia L, Lu B et al. Updated hypertension prevalence, awareness, and control rates based on the 2017ACC/AHA high blood pressure guideline. J. Clin. Hypertens. 21(6), 758–765 (2019).
140.
Gao N, Yuan Z, Tang X et al. Prevalence of CHD-related metabolic comorbidity of diabetes mellitus in Northern Chinese adults: The REACTION study. J. Diabetes Complications 30(2), 199–205 (2016).
141.
Ho BK, Jasvindar K, Gurpreet K et al. Prevalence, awareness, treatment and control of diabetes mellitus among the elderly: The 2011 National Health and Morbidity Survey, Malaysia. Malaysian Fam. Physician. 9(3), 12–19 (2014).
142.
Hu D, Fu P, Xie J et al. Increasing prevalence and low awareness, treatment and control of diabetes mellitus among Chinese adults: The InterASIA study. Diabetes Res. Clin. Pract. 81(2), 250–257 (2008).
143.
Hu M, Wan Y, Yu L et al. Prevalence, Awareness and Associated Risk Factors of Diabetes among Adults in Xi’ an, China. Sci. Rep. 7, 10472 (2017).
144.
Li J, Ni J, Wu Y et al. Sex differences in the prevalence, awareness, treatment, and control of diabetes mellitus among adults aged 45 years and older in rural areas of northern China: a cross-sectional, population-based study. Front. Endocrinol. (Lausanne). 10(MAR), 1–8 (2019).
145.
Liu M, Wang J, He Y et al. Awareness, treatment and control of type 2 diabetes among Chinese elderly and its changing trend for past decade. BMC Public Health 16(1), 4–11 (2016).
146.
Liu C, Li X, Lin M, Zheng L, Chen X. A cross-sectional study on diabetes epidemiology among people aged 40 years and above in Shenyang, China. Sci. Rep. 10(1), 1–10 (2020).
147.
Qin Y, Wang R, Ma X et al. Prevalence, awareness, treatment and control of diabetes mellitus – A population based study in Shanghai, China. Int. J. Environ. Res. Public Health. 13(5), 512 (2016).
148.
Tripathy JP, Thakur JS, Jeet G et al. Prevalence and risk factors of diabetes in a large community – based study in North India: results from a STEPS survey in Punjab. Diabetol. Metab. Syndr. 9, 8 (2017).
149.
Wang C, Yu Y, Zhang X et al. Awareness, treatment, control of diabetes mellitus and the risk factors: Survey results from Northeast China. PLOS One. 9(7), e103594 (2014).
150.
Xi Y, Bao H, Han K et al. Evaluating the treatment and control of modifiable cardiovascular disease risk factors among patients with diabetes in the Inner Mongolia, China: a cross-sectional study. Prev. Med. (Baltim). 139, 106174 (2020).
151.
Xu B, Xu Z, Xu X, Cai Q, Xu Y. Prevalence, awareness, treatment, and control of hypertension among residents in Guangdong Province, China, 2004 to 2007. Circ. Cardiovasc. Qual. Outcomes. 6(2), 217–222 (2013).
152.
Yan LD, Hanvoravongchai P, Aekplakorn W et al. Universal coverage but unmet need: national and regional estimates of attrition across the diabetes care continuum in Thailand. PLOS One. 15(1), 1–14 (2020).
153.
Ruan Y, Yan QH, Xu JY et al. Epidemiology of Diabetes in Adults Aged 35 and Older from Shanghai, China. Biomed. Environ. Sci. 29(6), 408–416 (2016).
154.
Zhang YH, Ma WJ, Thomas GN et al. Diabetes and pre-diabetes as determined by glycated haemoglobin A1c and glucose levels in a developing southern Chinese population. PLOS One. 7(5), 1–8 (2012).
155.
Cai L, Zhang L, Liu A, Li S, Wang P. Prevalence, awareness, treatment, and control of dyslipidemia among adults in Beijing, China. J. Atheroscler. Thromb. 19(2), 159–168 (2012).
156.
He H, Yu YQ, Li Y et al. Dyslipidemia awareness, treatment, control and influence factors among adults in the Jilin province in China: a cross-sectional study. Lipids Health Dis. 13(1), 1–9 (2014).
157.
Ni W, Liu X, Zhuo Z et al. Serum lipids and associated factors of dyslipidemia in the adult population in Shenzhen. Lipids Health Dis. 1–11 (2015). Available from:
158.
Pan L, Yang Z, Wu Y et al. The prevalence, awareness, treatment and control of dyslipidemia among adults in China. Atherosclerosis 248, 2–9 (2016).
159.
Song P, Zha M, Yang X et al. Socioeconomic and geographic variations in the prevalence, awareness, treatment and control of dyslipidemia in middle-aged and older Chinese. Atherosclerosis 282(December 2018), 57–66 (2019).
160.
Wang S, Xu L, Jonas JB, You QS, Wang YX, Yang H. Prevalence and associated factors of dyslipidemia in the adult Chinese population. PLOS One. 6(3), e17326 (2011).
161.
Xing L, Jing L, Tian Y et al. Epidemiology of dyslipidemia and associated cardiovascular risk factors in northeast China: a cross-sectional study. Nutr. Metab. Cardiovasc. Dis. 30(12), 2262–2270 (2020).
162.
Khoo CM, Tan MLS, Wu Y et al. Prevalence and control of hypercholesterolaemia as defined by NCEP-ATPIII guidelines and predictors of LDL-C goal attainment in a multi-ethnic asian population. Ann. Acad. Med. Singapore. 42(8), 379–387 (2013).
163.
Kim S, Han S, Rane PP, Qian Y, Zhao Z, Suh HS. Achievement of the low-density lipoprotein cholesterol goal among patients with dyslipidemia in South Korea. PLOS One. 15(1), 1–14 (2020).
164.
Momo K, Yasu T, Yasui H, Kuroda S ichiro. Risk factors affecting the failed low-density lipoprotein level achievement rate in working-age male population at high cardiovascular risk. J. Clin. Pharm. Ther. 44(5), 715–719 (2019).
165.
Wu NQ, Guo YL, Ye P et al. Statins usage and target achievement of LDL-C level in Chinese patients with coronary artery disease impacted by 2013 ACC/AHA cholesterol guideline. IJC Metab. Endocr. 14, 33–37 (2017).
Information & Authors
Information
Published In
Copyright
© 2023 Amgen Inc. This work is licensed under the Attribution-NonCommercial-NoDerivatives 4.0 Unported License
History
Received: 6 May 2022
Accepted: 20 January 2023
Published online: 2 March 2023
Keywords:
Topics
Authors
Funding Information
Metrics & Citations
Metrics
Article Usage
Article usage data only available from February 2023. Historical article usage data, showing the number of article downloads, is available upon request.
Citations
How to Cite
Systematic literature review and meta-analysis of cardiovascular risk factor management in selected Asian countries. (2023) Journal of Comparative Effectiveness Research. DOI: 10.57264/cer-2022-0085
Export citation
Select the citation format you wish to export for this article or chapter.
Citing Literature
- Yizhan Wu, Han Shi, Li Zhang, Wenhui Shi, Laiyang Song, Jiangwei Liu, Extreme Temperature and Incident Diabetes Risk Among Middle-Aged and Older Adults in China: A National Longitudinal Cohort Study, Metabolic Syndrome and Related Disorders, 10.1177/15578518261470093, (2026).
- Yan Wang, Chun-Yu Li, Li-Hua Jin, Hai-Lian Zhang, Xiang-Dan Shen, Minimizing and/or Avoiding Disease Progression Risk in Patients With the Three Highs: A Grounded Theory Study, Qualitative Health Research, 10.1177/10497323251342468, (2025).
- Valentinus Besin, Farizky Martriano Humardani, Trilis Yulianti, Sulistyo Emantoko Dwi Putra, Rina Triana, Matthew Justyn, The Apo gene's genetic variants: hidden role in Asian vascular risk, Neurogenetics, 10.1007/s10048-024-00757-9, 25, 3, (157-164), (2024).