Trends in pharmaceutical expenditure in the Taiwan National Health Insurance database at different hospital levels
Publication: Journal of Comparative Effectiveness Research
Abstract
Aim: This study aimed to understand the medication usage among different hospitals in Taiwan. Materials & methods: The NHI claims database consisting of claims prescription drugs in Taiwan was used to determine drug prescriptions in different hospitals. Results: In the medical center, L01X showed the highest drug expenditure and the drug prescription pattern in regional hospitals was similar to that in the medical center. The highest drug expenditure in the district hospital and clinics was A10B. Conclusion: Our analysis suggests that the annual pharmaceutical expenditures from 2016 to 2018 were increasing over time in all hospitals. The generic drug usage in medical centers/regional hospitals was lower than district hospitals/clinics.
Tweetable abstract
New study finds that in Taiwan medical centers/regional hospitals, L01X showed the highest drug expenditure. The highest drug expenditure in district hospitals/clinics was A10B. Generic drug usage in medical centers/regional hospitals was lower than district hospitals/clinics.
The population of Taiwan is approximately 23 million, rising from 21,400,826 in 2000 to 23,539,816 in 2016, 23,571,227 in 2017 and 23,588,932 in 2018. The Taiwanese government adopted the national health insurance (NHI) system in March 1995. NHI in Taiwan is a single-payer system and provides comprehensive healthcare, including inpatient, outpatient, dental clinic and Chinese Medicine services [1]. NIH has covered more than 95% of the Taiwan census since 2000, which increased to over 99% by 2018. Most healthcare facilities (hospitals) have contracted with NHI, and these facilities must upload the claims data of each visit to NHI [2]. Patient visits, drug prescriptions, surgeries and examinations are the four major components in the claims data. In 2016, 490 hospitals (medical centers, regional hospitals and district hospitals) and 21,894 clinics functioned in Taiwan [3]. These hospitals/clinics are classified into four levels according to their healthcare quality, medical teaching ability, clinical capabilities and hospital bed capacity. The four classification levels are medical centers, regional hospitals, district hospitals and clinics. In general, the standard of medical care in the medical center is the most stringent, followed by regional and district hospitals, with general practice clinics being the least strict. Therefore, medical centers should care for patients requiring intensive care and those with emerging diseases or severe diseases. However, since there are no restrictions (referral not required) for citizens to visit specialists and hospitals under Taiwan's NHI system, Taiwanese patients can choose almost any hospital or physician they wish [4]. In this scenario, it would be interesting to investigate what kinds of medications are used at the different levels of hospitals for patient treatment.
Like other countries, the Taiwanese government is also trying to control the drug expenditure to enhance the availability and affordability of drugs [5,6]. The Taiwanese government gives these health providers a fixed amount of money for a pre-determined set of services (Global budgeting system) [7]. Generic drug prescriptions are a way of controlling the pharmaceutical expenditures [8]. In Western countries, generic medications are beneficial for individual patients because of reduced co-payments due to lower prices [9,10]. Although outpatients are required to pay the medication co-payment in the Taiwan NHI system, the upper limiter is only $7 (USD) [11]. As the efficacy of generics compared with their brand-name counterparts for acute and severe illness is controversial, generic medicine policies are supported by some academic associations, such as the American Diabetes Association [12]. However, the reimbursement price difference between generic and brand drugs was approximately 20% in Taiwan, and the financial benefit was not as high as that in Western countries [13]. Hence, it would be interesting to understand the generic medications used in the different levels of hospitals for patient treatment.
To assess the real-world situation and bridge the current knowledge gap, we used the NHI claims database consisting of all claim prescription drugs in Taiwan to determine the drug prescription in different hospitals, the top ten prescription anatomical therapeutic chemical (ATC) categories in different hospitals and the top 1 brand/generic prescription drug among these ATC categories.
Materials & methods
Data source
This retrospective cohort study used the claims records in the entire NHI database for 2016–2018. This claims database contains all the original claims drug prescription data for all beneficiaries in Taiwan. The ATC classifications were used to calculate select drug prescription classifications [14]. The hospital level was determined using the registry for contracted medical facilities. All hospitals in Taiwan were enrolled in this study; which included 22, 24 and 25 medical centers; 77, 77 and 77 regional hospitals; 3017, 3017 and 313 district hospitals and 21,894, 22,129 and 22,333 clinics in 2016, 2017 and 2018, respectively [15–17]. All drug prescriptions in Taiwan NHI were included without applying any selection criteria (except self-pay medication).
Assessment
The primary observation variable was the amount declared of select prescription drugs in different hospitals. The hospital level was classified into four types, namely, medical centers, regional hospitals, district hospitals and clinics. There were 14 prescription drug types; gastrointestinal (A01–A07, A09), diabetes (A10), nutritional supplement (A11–12, A16), blood disorders (B01–B03, B05-B06, cardiac and hypertension (C01–C05, C07–C10), urinary tract and sex hormones (G01–G04), systemic hormones (H01–H03, H05), anti-systemic infection (J01-J02, J05-J06), anti-tumor and immunologic (L01–L04), anti-inflammatory and anti-rheumatic (M01–M05), nervous system (N01–N07), respiratory system (R01, R03, R05-06), ophthalmological and ontological (S01–S03) and others (V03, V06). The top ten prescription ATC categories in different levels of hospitals were selected by ATC 4th level. The exchange of NTD to USD in the end of index year were 32.279 in 2016, 29.848 in 2017 and 30.733 in year 2018. The exchange of NTD to USD used in this study was 1:30. The unit of cost shown in figures was reported as millions of USD.
Data analyses
SAS 9.4 (SAS Institute Inc., NC, USA) was used for the data analyses. The variable measures were identified based on the criteria described above. The selected prescription drugs were used to describe the categorical variables.
Results
In all the original claims drug prescription data for all beneficiaries, the annual pharmaceutical expenditures from 2016 to 2018 in these 14 types increased from 2031.6 million to 2311.6 million USD in medical centers, from 1519.2 million to 1729.8 million USD in regional hospitals, from 473.1 million to 589.8 million in district hospitals and from 440.1 million to 452.7 million USD in clinics (Table 1). The average expenditure per hospital from 2016 to 2018 increased from 19.7 million to 22.5 million USD in regional hospitals and from 1.5 million to 1.9 million in district hospitals, but remained the same in medical centers and clinics over the period. We further divided the annual pharmaceutical expenditures among the different hospital levels into 14 categories (gastrointestinal, diabetes, nutritional supplement, blood disorders, cardiac and hypertension, urinary tract and sex hormones, systemic Hormones, anti-systemic infection, anti-tumor and immunologic, anti-inflammatory and anti-rheumatic, nervous system, respiratory system, ophthalmological and ontological and others) (Table 1). In medical centers, the anti-tumor and immunologic (679.6–813.5 million/year) showed the highest drug expenditure, followed by anti-systemic infections (317.2–396.6 million/year), blood disorders (236.9–243.7 million/year) and cardiac and hypertension (181.7–190.5 million/year). The drug prescription pattern in regional hospitals was similar to that in medical centers; the anti-tumor and immunologic (353.4–423.7 million/year) showed the highest drug expenditure, followed by Anti-systemic infection (233.4–372.7 million/year), cardiac and hypertension (205.7–207.7 million/year) and nervous system (182.6–187.1 million/year). The majority of the drug expenditure in district hospitals was cardiac and hypertension (96.3–101.9 million/year), followed by nervous system (78.4–86.4 million/year), anti-systemic infection (59.6–90.1 million/year) and diabetes (54.3–64.9 million/year). In clinics, cardiac and hypertension (149.1–156.2 million/year) showed the highest drug expenditure, followed by diabetes (61.4–67.9 million/year), nervous system (57.4–60.2 million/year) and respiratory system (46.8–48.3 million/year).
| Medical center | Regional hospital | District hospital | Clinics | |||||||||
|---|---|---|---|---|---|---|---|---|---|---|---|---|
| 2016 | 2017 | 2018 | 2016 | 2017 | 2018 | 2016 | 2017 | 2018 | 2016 | 2017 | 2018 | |
| Gastrointestinal | 49.3 | 49.2 | 48.6 | 60.2 | 60.8 | 58.6 | 25.2 | 25.6 | 26.4 | 26.0 | 26.8 | 27.0 |
| Diabetes | 81.6 | 86.3 | 90.5 | 107.3 | 114.1 | 117.9 | 54.3 | 58.4 | 64.9 | 61.4 | 65.4 | 67.9 |
| Nutritional supplement | 118.0 | 132.4 | 140.2 | 16.8 | 20.9 | 22.5 | 3.8 | 4.6 | 5.8 | 0.9 | 1.0 | 1.0 |
| Blood disorders | 236.9 | 236.5 | 243.7 | 163.0 | 169.6 | 175.5 | 38.1 | 44.8 | 60.6 | 12.7 | 12.9 | 12.4 |
| Cardiac and hypertension | 181.7 | 186.4 | 190.5 | 205.7 | 207.7 | 205.6 | 96.3 | 97.8 | 101.9 | 156.2 | 153.7 | 149.1 |
| Urinary tract and sex hormones | 27.5 | 28.8 | 31.1 | 30.0 | 31.9 | 33.2 | 13.8 | 14.9 | 17.3 | 11.6 | 11.8 | 12.0 |
| Systemic Hormones | 34.5 | 36.3 | 37.3 | 22.3 | 23.8 | 24.2 | 6.5 | 7.6 | 8.8 | 2.3 | 2.5 | 2.7 |
| Anti-systemic infection | 317.2 | 335.4 | 396.6 | 233.4 | 245.1 | 327.7 | 59.6 | 62.8 | 90.1 | 19.3 | 19.7 | 26.7 |
| Anti-tumor and immunologic | 679.6 | 749.5 | 813.5 | 353.4 | 388.5 | 423.7 | 35.7 | 40.2 | 54.2 | 3.6 | 2.9 | 1.4 |
| Anti-inflammatory and anti-rheumatic | 48.6 | 48.8 | 49.2 | 54.5 | 56.1 | 56.4 | 28.1 | 29.3 | 31.7 | 22.1 | 22.9 | 23.1 |
| Nervous system | 158.2 | 160.0 | 161.3 | 182.6 | 186.5 | 187.1 | 78.4 | 81.2 | 86.4 | 57.4 | 60.2 | 60.2 |
| Respiratory system | 47.3 | 48.7 | 50.3 | 56.6 | 58.6 | 60.0 | 25.9 | 27.7 | 31.2 | 47.3 | 46.8 | 48.3 |
| Ophthalmological and otological | 33.9 | 39.1 | 39.9 | 24.4 | 28.3 | 27.3 | 6.3 | 6.8 | 8.6 | 19.2 | 19.3 | 19.8 |
| Others | 17.3 | 17.4 | 18.8 | 9.0 | 8.3 | 10.1 | 0.9 | 1.0 | 1.8 | 0.1 | 0.1 | 1.0 |
| Total | 2031.6 | 2154.8 | 2311.6 | 1519.2 | 1600.0 | 1729.8 | 473.1 | 502.5 | 589.8 | 440.1 | 445.8 | 452.7 |
| Hospital (n) | 22 | 24 | 25 | 77 | 77 | 77 | 307 | 307 | 313 | 21,894 | 22,129 | 22,333 |
| Average expenditure per hospital | 92.4 | 89.95 | 92.5 | 19.7 | 20.8 | 22.5 | 1.5 | 1.6 | 1.9 | 0.02 | 0.02 | 0.02 |
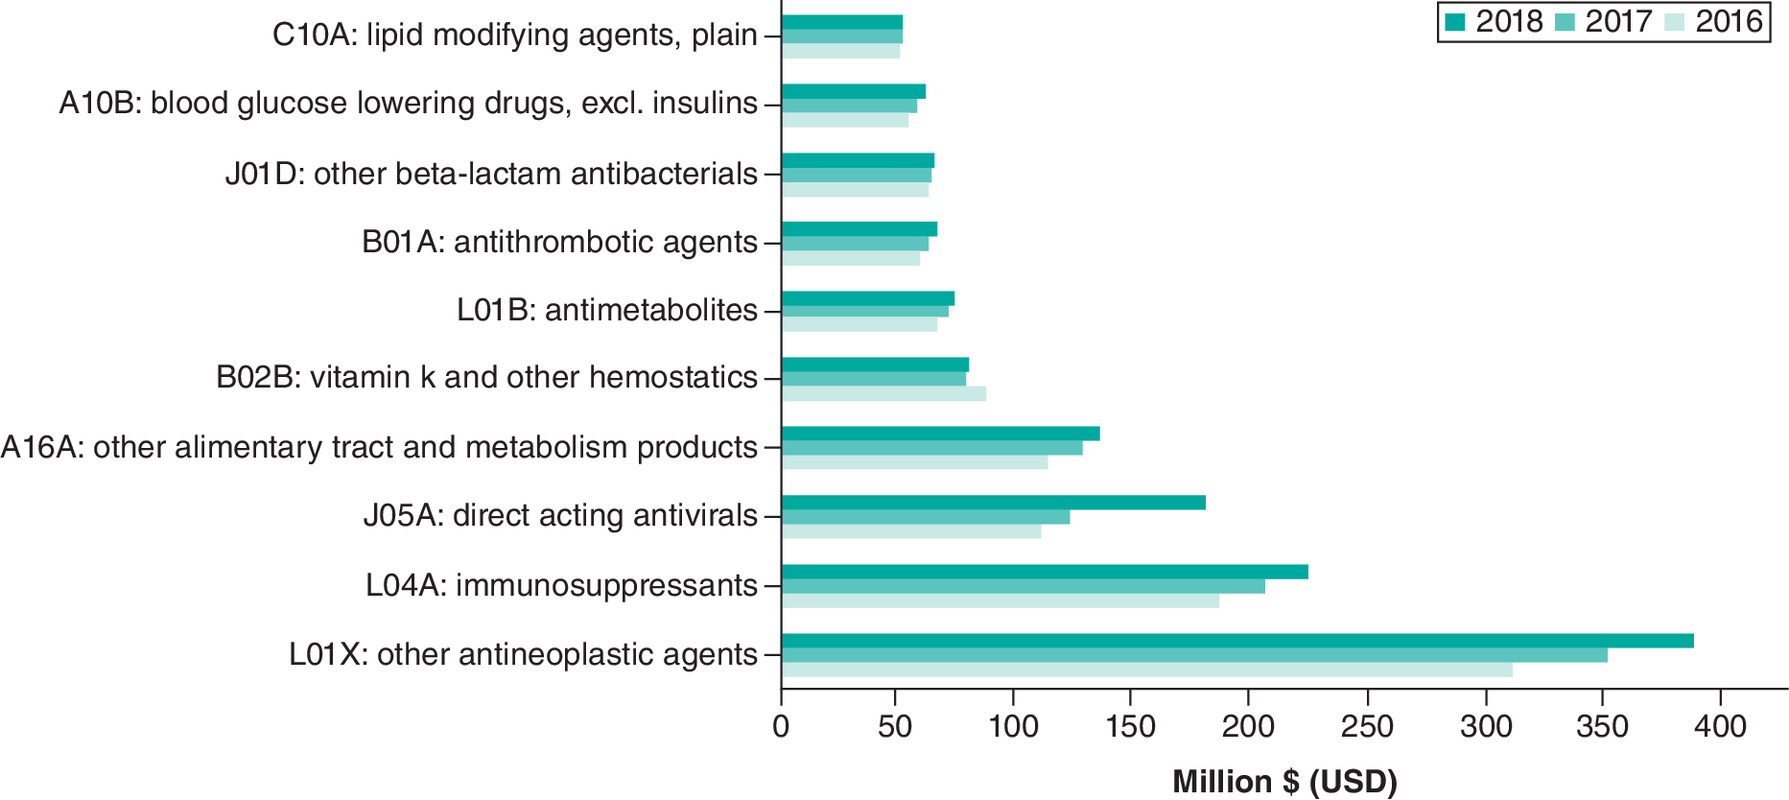
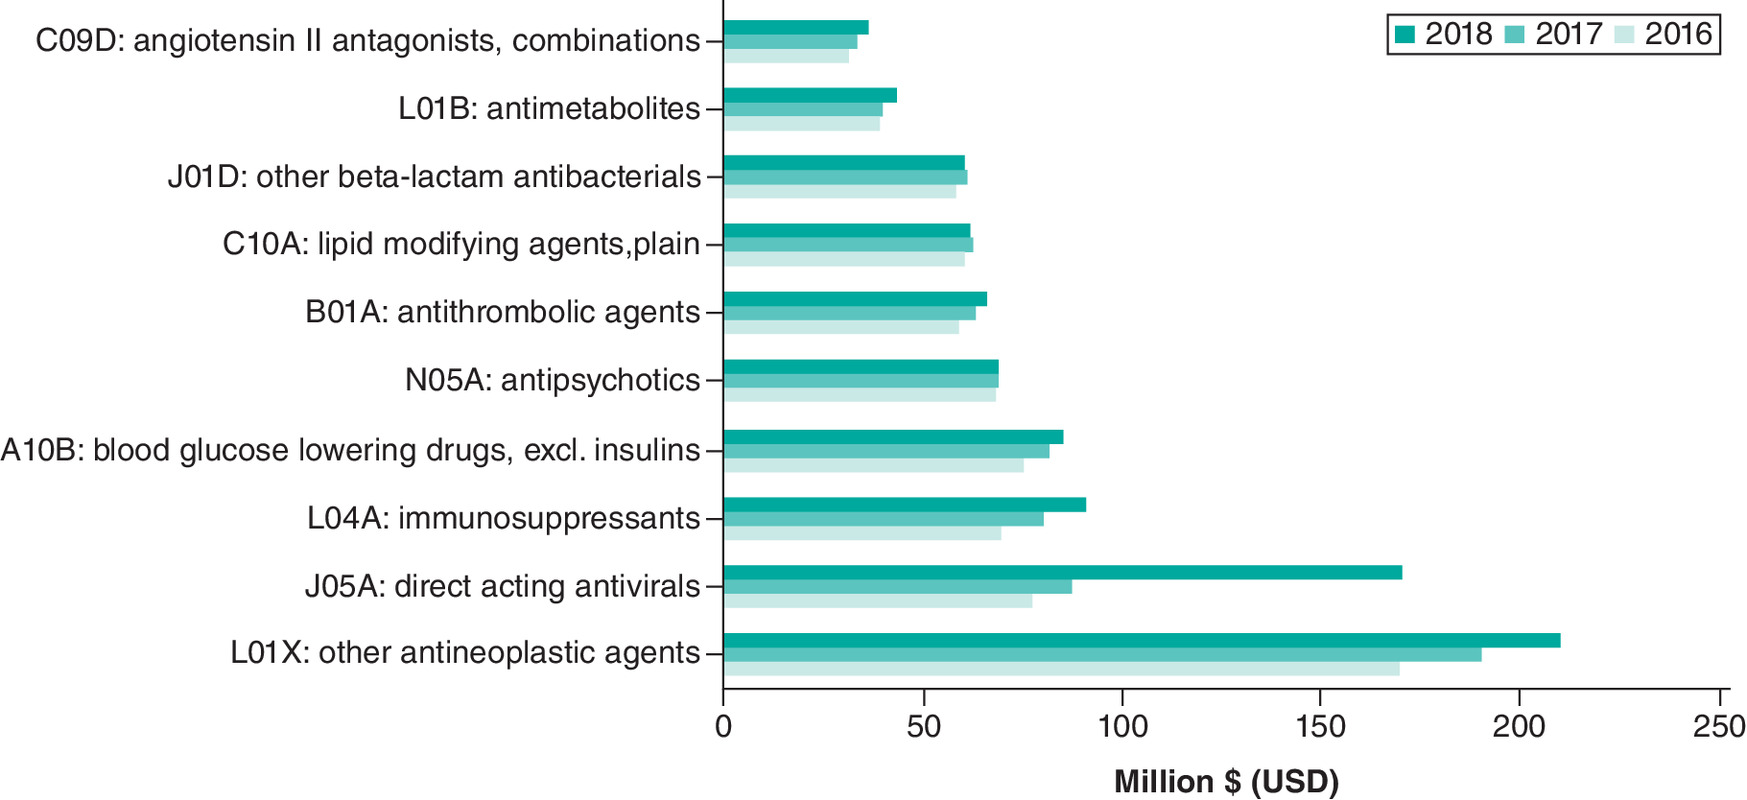
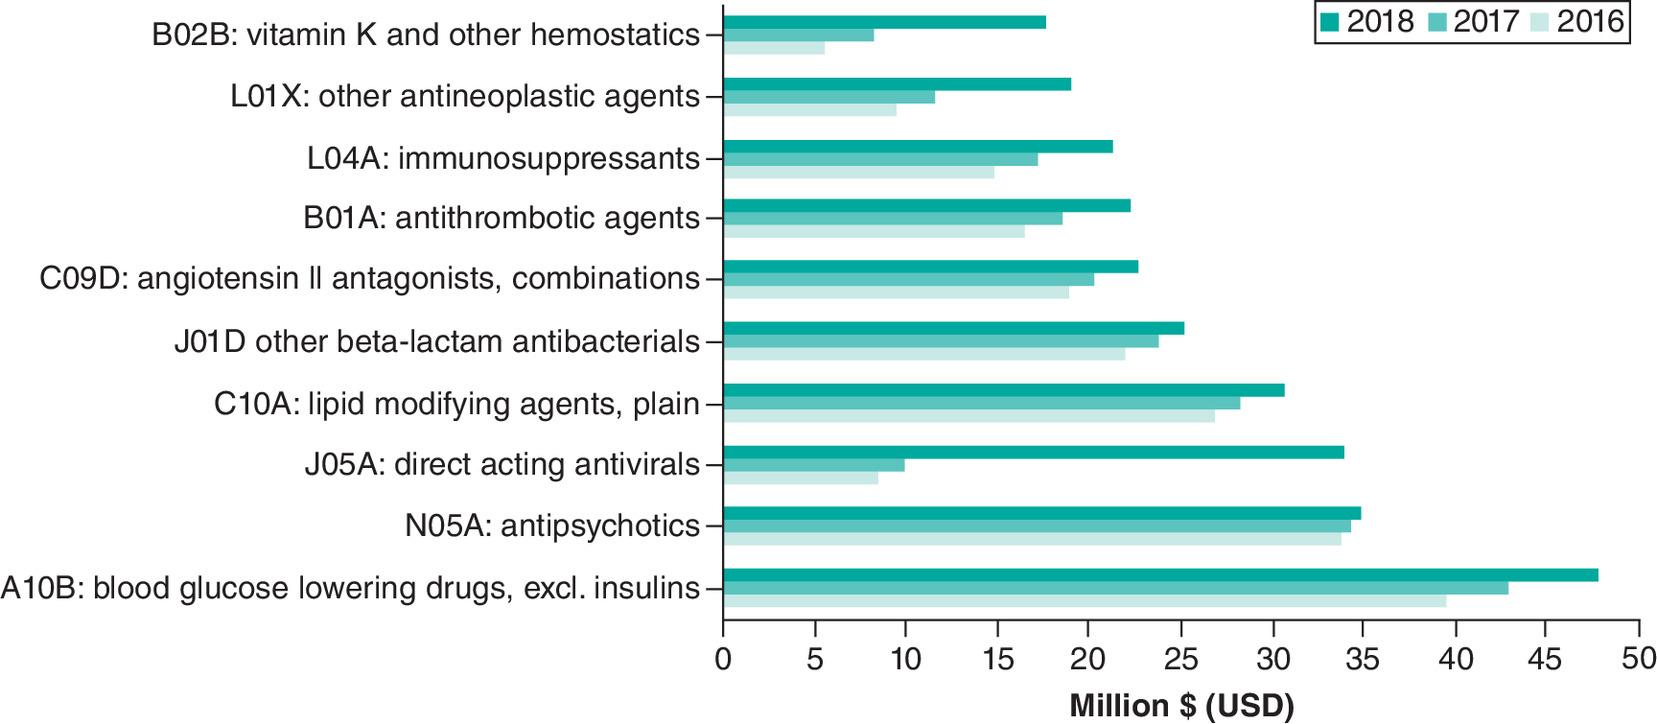
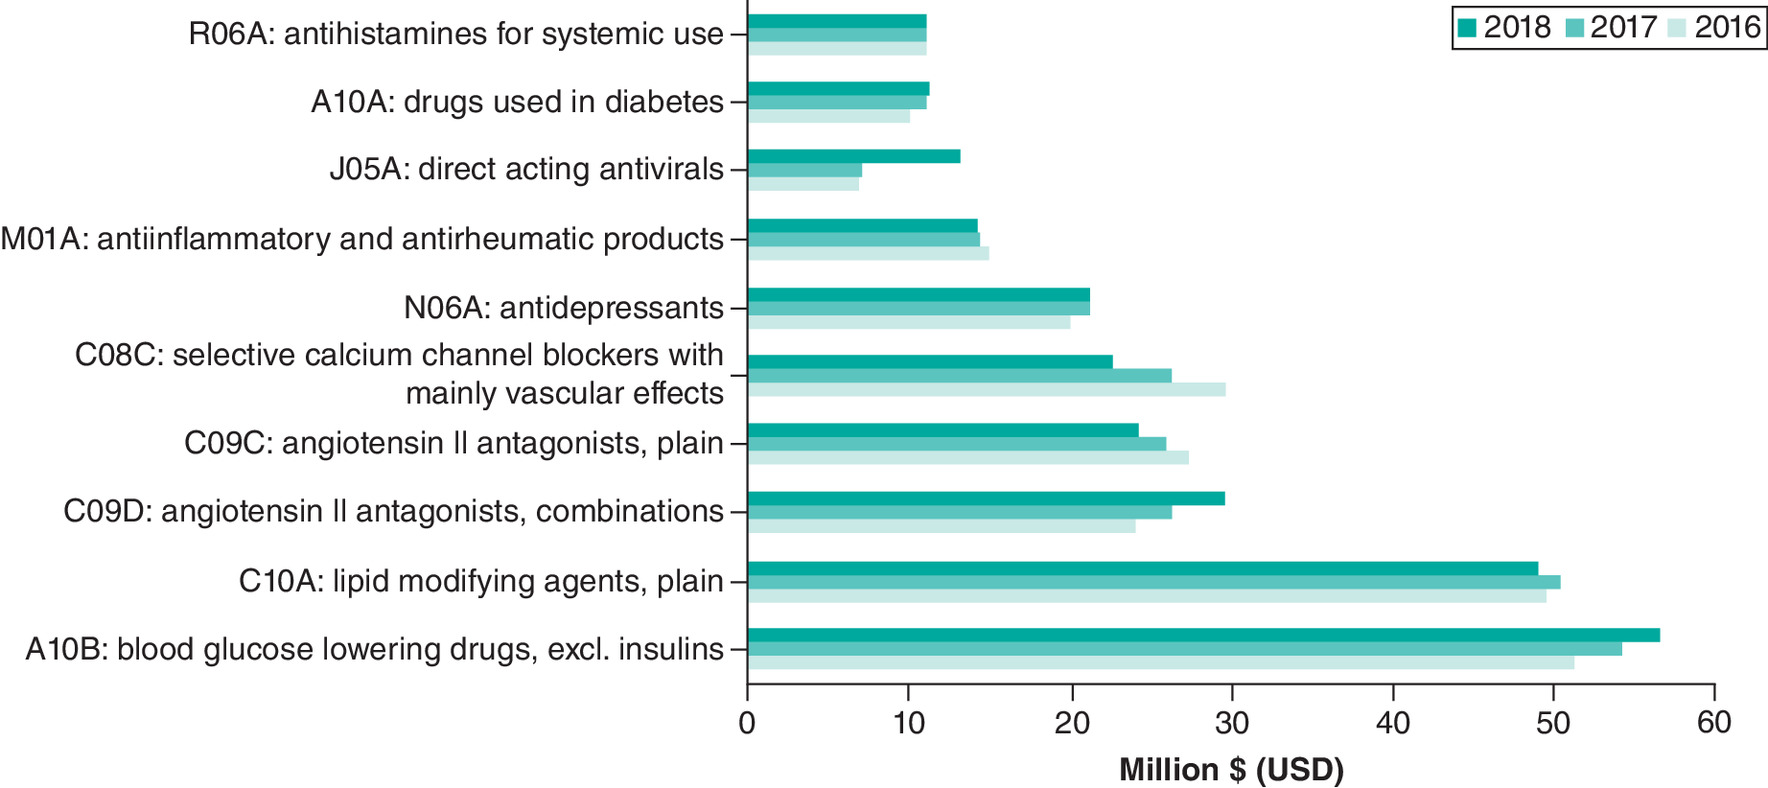
To understand the detailed patterns of drug prescription among different drug categories, we further divided the drug group into pharmacological subgroup (3rd level) according to the ATC code. The top 10 drug subgroups are shown in Figures 1–4. In medical centers, L01X (other antineoplastic agents) (311.6–389.3 million/year) showed the highest drug expenditure, followed by L04A (immunosuppressants) (186.6–224.6 million/year), J05A (direct acting antivirals) (111.7–181.4 million/year) and A16A (other alimentary tract and metabolism products) (113.8–135.3 million/year) (Figure 1). The drug prescription pattern in the regional hospitals was the same as that in the medical centers. L01X (other antineoplastic agents) (169.4–210.2 million/year) showed the highest drug expenditure, followed by J05A (direct acting antivirals) (77.6–170.5 million/year), L04A (immunosuppressants) (69.7–90.9 million/year) and A10B (blood glucose-lowering drugs, excl. insulin) (75.6–85.3 million/year) (Figure 2). The majority of the drug expenditure in district hospital was A10B (blood glucose-lowering drugs, excl. insulin) (35.6–47.9 million/year), followed by N05A (Antipsychotics) (33.8–35.0 million/year), J05A (direct acting antivirals) (8.5–33.9 million/year) and C10A (lipid-modifying agents, plain) (26.9–30.6 million/year) (Figure 3). In clinics, A10B (blood glucose-lowering drugs, excl. insulin) (51.4–56.6 million/year) showed the highest drug expenditure, followed by C10A (lipid-modifying agents, plain) (49.5–49.11 million/year), C09D (angiotensin II antagonists, combinations) (23.9–29.6 million/year) and C09C (angiotensin II antagonists, plain) (24.2–27.2 million/year) (Figure 4). Table 2 shown the ascending order and cost difference of drug expenditures for each medical facility type.
| (A) Medical center | Delta | (B) Regional hospitals | Delta |
|---|---|---|---|
| B02B: vitamin K and other hemostatics | (7.7) | N05A: antipsychotics | 0.4 |
| C10A: lipid modifying agents, plain | 1.3 | C10A: lipid modifying agents, plain | 1.1 |
| J01D: other beta-lactam antibacterials | 2.1 | J01D: other beta-lactam antibacterials | 2.7 |
| B01A: antithrombotic agents | 7.5 | L01B: antimetabolites | 3.9 |
| A10B: blood glucose lowering drugs, excl. insulins | 7.5 | C09D: angiotensin II antagonists, combinations | 5.2 |
| L01B: antimetabolites | 7.8 | B01A: antithrombotic agents | 7.6 |
| A16A: other alimentary tract and metabolism products | 21.5 | A10B: blood glucose lowering drugs, excl. insulins | 9.7 |
| L04A: immunosuppressants | 37.9 | L04A: immunosuppressants | 21.3 |
| J05A: direct acting antivirals | 69.7 | L01X: other antineoplastic agents | 40.8 |
| L01X: other antineoplastic agents | 77.8 | J05A: direct acting antivirals | 92.9 |
| (C) District hospitals | Delta | (D) Clinics | Delta |
|---|---|---|---|
| N05A: antipsychotics | 1.2 | C08C: selective calcium channel blockers with mainly vascular effects | (7.2) |
| J01D: other beta-lactam antibacterials | 3.2 | C09C: angiotensin II antagonists, plain | (3.1) |
| C10A: lipid modifying agents, plain | 3.7 | M01A: anti-inflammatory and antirheumatic products | (0.8) |
| C09D: angiotensin II antagonists, combinations | 3.8 | C10A: lipid modifying agents, plain | (0.4) |
| B01A: antithrombotic agents | 5.8 | R06A: antihistamines for systemic use | (0.1) |
| L04A: Immunosuppressants | 6.4 | N06A: antidepressants | 1.1 |
| A10B: blood glucose lowering drugs, excl. insulins | 8.3 | A10A: drugs used in diabetes | 1.3 |
| L01X: other antineoplastic agents | 9.6 | A10B: blood glucose lowering drugs, excl. insulins | 5.3 |
| B02B: vitamin K and other hemostatics | 12.1 | C09D: angiotensin II antagonists, combinations | 5.7 |
| J05A: direct acting antivirals | 25.4 | J05A: direct acting antivirals | 6.3 |
Unit: million (USD); delta: the difference between 2016 to 2018.
We checked the brand and generic drug prescription in the highest drug expenditure item among the top ten drug subgroups. In the medical centers, brand coagulation factor VIII (B02BD02) (44.5–49.6 million/year) showed the highest drug expenditure, followed by brand trastuzumab (L01XC03) (36.2–42.2 million/year), brand sofosbuvir/ledipasvir (J05AP51) (39.8 million/year) and brand agalsidase alfa (A16AB03) (36.9–39.5 million/year). The generic drug usage in these high-expenditure items among the top 10 drug subgroups was 3.89% in 2018 (3.18% in 2017 and 3.19% in 2016) (Table 3). The highest drug expenditure in the regional hospitals was brand sofosbuvir/ledipasvir (J05AP51) (54.8 million/year), followed by brand trastuzumab (L01XC03) (36.6–37.4 million/year), brand clopidogrel (B01AC04) (19.1–19.7 million/year) and brand pemetrexed (L01BA04) (15.8–16.6 million/year). The generic drug usage in these high drug expenditure items among the top 10 drug subgroups was 11.04% in 2018 (13.94% in 2017 and 12.88% in 2016). In the district hospitals, brand sofosbuvir/ledipasvir (J05AP51) (16.1 million/year) showed the highest drug expenditure, followed by brand valsartan and amlodipine (C09DB01) (9.2–10.4 million/year), brand coagulation factor VIII (B02BD02) (10.0 million/year) and generic rosuvastatin (C10AA07) (9.7–9.9 million/year). The generic drug usage in these highest drug expenditure items among the top 10 drug subgroups was 32.35% in 2018 (45.50% in 2017; 47.51% in 2016), which was significantly higher than that in medical centers and regional hospitals. In clinics, generic valsartan and amlodipine (C09DB01) (5.5–40.2 million/year) showed the highest drug expenditure, followed by generic atorvastatin (C10AA05) (20.9–23.5 million/year), generic amlodipine (C08CA01) (13.2–17.9 million/year) and brand valsartan/amlodipine (C09DB01) (7.3-9.4 million/year). More than half of these highest drug expenditure items among the top 10 drug subgroups in clinics were generics (78.14% in 2018, 75.67% in 2017 and 77.21% in 2016).
| (A) Medical center | (B) Regional hospital | ||||||||||||
|---|---|---|---|---|---|---|---|---|---|---|---|---|---|
| Brand product | Drug name | Year (million USD) | Delta | Brand product | Drug name | Year (million USD) | Delta | ||||||
| ATC code (4) | ATC code (7) | 2016 | 2017 | 2018 | ATC code (4) | ATC code (7) | 2016 | 2017 | 2018 | ||||
| L01X | L01XC03 | Trastuzumab | 36.2 | 39.1 | 42.2 | 6.1 | L01X | L01XC03 | Trastuzumab | 37.1 | 37.4 | 36.6 | (0.5) |
| L04A | L04AD02 | Tacrolimus | 29.0 | 31.1 | 32.3 | 3.3 | J05A | J05AP51 | Sofosbuvir and ledipasvir | 0.00 | 0.0 | 54.8 | 54.8 |
| J05A | J05AP51 | Sofosbuvir and ledipasvir | 0.00 | 0.00 | 39.9 | 39.8 | L04A | L04AB04 | Adalimumab | 14.4 | 15.7 | 16.0 | 1.6 |
| A16A | A16AB03 | Agalsidase alfa | 36.9 | 39.5 | 39.0 | 2.1 | A10B | A10BH05 | Linagliptin | 8.6 | 9.7 | 10.1 | 1.5 |
| B02B | B02BD02 | Coagulation factor VIII | 49.6 | 47.8 | 44.5 | (5.1) | N05A | N05AH04 | Quetiapine | 11.3 | 9.9 | 9.9 | (1.4) |
| L01B | L01BA04 | Pemetrexed | 29.6 | 31.3 | 30.8 | 1.2 | B01A | B01AC04 | Clopidogrel | 19.1 | 19.6 | 19.7 | 0.6 |
| B01A | B01AC04 | Clopidogrel | 19.1 | 19.6 | 18.9 | (0.2) | C10A | C10AA05 | Atorvastatin | 13.4 | 13.4 | 13.3 | (0.1) |
| J01D | J01DH02 | Meropenem | 10.7 | 12.0 | 14.5 | 3.8 | J01D | J01DH02 | Meropenem | 6.1 | 6.7 | 7.4 | 1.3 |
| A10B | A10BH05 | Linagliptin | 7.5 | 8.2 | 8.2 | 0.6 | L01B | L01BA04 | Pemetrexed | 15.8 | 15.7 | 16.6 | 0.8 |
| C10A | C10AA05 | Atorvastatin | 16.5 | 16.7 | 16.8 | 0.3 | C09D | C09DB01 | Valsartan and amlodipine | 15.9 | 16.2 | 15.5 | (0.4) |
| TOTAL | 235.1 | 245.1 | 287.0 | 51.9 | TOTAL | 141.6 | 144.2 | 199.9 | 58.3 | ||||
| Generic | Drug name | Year (million USD) | Delta | Generic | Drug name | Year (million USD) | Delta | ||||||
|---|---|---|---|---|---|---|---|---|---|---|---|---|---|
| ATC code (4) | ATC code (7) | 2016 | 2017 | 2018 | ATC code (4) | ATC code (7) | 2016 | 2017 | 2018 | ||||
| L01X | L01XC03 | Trastuzumab | 0.0 | 0.0 | 0.0 | 0.0 | L01X | L01XC03 | Trastuzumab | 0.0 | 0.0 | 0.0 | 0.0 |
| L04A | L04AD02 | Tacrolimus | 0.0 | 0.0 | 0.0 | 0.0 | J05A | J05AP51 | Sofosbuvir and ledipasvir | 0.0 | 0.0 | 0.0 | 0.0 |
| J05A | L04AD02 | Sofosbuvir and ledipasvir | 0.0 | 0.0 | 0.0 | 0.0 | L04A | L04AB04 | Adalimumab | 0.0 | 0.0 | 0.0 | 0.0 |
| A16A | A16AB03 | Agalsidase alfa | 0.0 | 0.00 | 0.0 | 0.0 | A10B | A10BH05 | Linagliptin | 0.0 | 0.0 | 0.0 | 0.0 |
| B02B | B02BD02 | Coagulation factor VIII | 0.0 | 0.0 | 0.0 | 0.0 | N05A | N05AH04 | Quetiapine | 5.4 | 6.4 | 6.7 | 1.2 |
| L01B | L01BA04 | Pemetrexed | 0.0 | 0.0 | 2.1 | 2.1 | B01A | B01AC04 | Clopidogrel | 5.3 | 5.6 | 5.6 | 0.3 |
| B01A | B01AC04 | Clopidogrel | 3.’ | 2.9 | 3.8 | 0.8 | C10A | C10AA05 | Atorvastatin | 6.9 | 7.3 | 7.3 | 0.4 |
| J01D | J01DH02 | Meropenem | 1.9 | 2.3 | 2.8 | 0.9 | J01D | J01DH02 | Meropenem | 3.01 | 3.3 | 3.1 | 0.1 |
| A10B | A10BH05 | Linagliptin | 0.0 | 0.0 | 0.0 | 0.0 | L01B | L01BA04 | Pemetrexed | 0.1 | 0.34 | 1.2 | 1.1 |
| C10A | C10AA05 | Atorvastatin | 2.8 | 2.8 | 2.9 | 0.1 | C09D | C09DB01 | Valsartan and amlodipine | 0.3 | 0.42 | 0.9 | 0.7 |
| TOTAL | 7.8 | 8.1 | 11.6 | 3.9 | TOTAL | 29.4 | 23.4 | 24.8 | 3.9 | ||||
| (C) District hospital | (D) Clinics | ||||||||||||
|---|---|---|---|---|---|---|---|---|---|---|---|---|---|
| Brand product | Drug name | Year (million USD) | Delta | Brand product | Drug name | Year (million USD) | Delta | ||||||
| ATC code (4) | ATC code (7) | 2016 | 2017 | 2018 | ATC code (4) | ATC code (7) | 2016 | 2017 | 2018 | ||||
| A10B | A10BD08 | Metformin and vildagliptin | 4.2 | 4.7 | 5.5 | 1.3 | A10B | A10BA02, | Metformin | 0.5 | 0.5 | 0.4 | (0.1) |
| N05A | N05AH03 | Olanzapine | 0.0 | 0.0 | 0.0 | 0.0 | C10A | C10AA05 | Atorvastatin | 2.3 | 2.0 | 1.8 | (0.5) |
| J05A | J05AP51 | Sofosbuvir and ledipasvir | 0.0 | 0.0 | 16.1 | 16.1 | C09D | C09DB01 | Valsartan and amlodipine | 7.3 | 8.2 | 9.4 | 2.1 |
| C10A | C10AA07 | Rosuvastatin | 0.0 | 0.0 | 0.0 | 0.0 | C09C | C09CA01 | Losartan | 0.9 | 0.9 | 0.8 | (0.2) |
| J01D | J01DH02 | meropenem | 0.4 | 0.7 | 0.7 | 0.3 | C08C | C08CA01 | Amlodipine | 6.2 | 5.6 | 5.1 | (1.2) |
| C09D | C09DB01 | Valsartan and amlodipine | 9.2 | 9.7 | 10.4 | 1.2 | N06A | N06AB10 | Escitalopram | 0.4 | 0.3 | 0.3 | (0.1) |
| B01A | B01AC04 | Clopidogrel | 4.3 | 4.8 | 5.6 | 1.3 | M01A | M01AB05 | Diclofenac | 0.2 | 0.2 | 0.2 | 0.0 |
| L04A | L04AB04 | Adalimumab | 3.8 | 4.3 | 4.6 | 0.8 | J05A | J05AP51 | Sofosbuvir and ledipasvir | 0.0 | 0.0 | 3.6 | 3.6 |
| L01X | L01XC03 | Trastuzumab | 1.1 | 1.6 | 2.4 | 1.3 | A10A | A10AE04 | Insulin glargine | 5.4 | 6.4 | 6.8 | 1.4 |
| B02B | B02BD02 | Coagulation factor VIII | 3.4 | 4.3 | 10.0 | 6.5 | R06A | R06AX26 | Fexofenadine | 0.1 | 0.4 | 0.4 | 0.3 |
| TOTAL | 26.4 | 30.1 | 55.2 | 28.8 | TOTAL | 23.2 | 24.4 | 28.7 | 5.4 | ||||
| Generic | Drug name | Year (million USD) | Delta | Generic | Drug name | Year (million USD) | Delta | ||||||
|---|---|---|---|---|---|---|---|---|---|---|---|---|---|
| ATC code (4) | ATC code (7) | 2016 | 2017 | 2018 | ATC code (4) | ATC code (7) | 2016 | 2017 | 2018 | ||||
| A10B | A10BD08 | Metformin and vildagliptin | 0.0 | 0.0 | 0.0 | 0.0 | A10B | A10BA02, | metformin | 8.4 | 8.5 | 8.2 | (0.3) |
| N05A | N05AH03 | Olanzapine | 8.3 | 8.8 | 8.7 | 0.3 | C10A | C10AA05 | atorvastatin | 23.5 | 22.4 | 20.9 | (2.6) |
| J05A | J05AP51 | Sofosbuvir and ledipasvir | 0.0 | 0.0 | 0.0 | 0.0 | C09D | C09DB01 | Valsartan and amlodipine | 5.5 | 7.4 | 40.2 | 34.7 |
| C10A | C10AA07 | Rosuvastatin | 9.7 | 9.5 | 9.9 | 0.1 | C09C | C09CA01 | losartan | 11.6 | 9.5 | 7.5 | (4.1) |
| J01D | J01DH02 | Meropenem | 3.2 | 3.8 | 4.5 | 1.2 | C08C | C08CA01 | amlodipine | 17.9 | 15.7 | 13.2 | (4.8) |
| C09D | C09DB01 | Valsartan and amlodipine | 0.4 | 0.7 | 1.0 | 0.5 | N06A | N06AB10 | Escitalopram | 6.51 | 6.9 | 6.9 | 0.4 |
| B01A | B01AC04 | Clopidogrel | 2.2 | 2.3 | 2.5 | 0.2 | M01A | M01AB05 | diclofenac | 3.3 | 3.2 | 3.4 | 0.1 |
| L04A | L04AB04 | Adalimumab | 0.0 | 0.0 | 0.0 | 0.0 | J05A | J05AP51 | sofosbuvir and ledipasvir | 0.0 | 0.0 | 0.0 | 0.0 |
| L01X | L01XC03 | Trastuzumab | 0.0 | 0.0 | 0.0 | 0.0 | A10A | A10AE04 | insulin glargine | 0.0 | 0.0 | 0.0 | 0.0 |
| B02B | B02BD02 | Coagulation factor VIII | 0.0 | 0.0 | 0.0 | 0.0 | R06A | R06AX26 | Fexofenadine | 2.0 | 2.2 | 2.3 | 0.3 |
| TOTAL | 23.9 | 25.1 | 26.4 | 2.5 | TOTAL | 78.7 | 75.8 | 102.5 | 23.8 | ||||
Unit: million (USD); delta: the difference between 2016 to 2018.
Discussion
This study is one of the few retrospective studies examining the medical expenditure among different hospitals and drug categories using a national sample in a non-Western country. Using a large nationwide health insurance database, we discerned that medical expenditure in Taiwan increased over time in all hospitals and that it was higher in high-level hospitals (Table 1). Anti-tumor and immunologic agents showed the highest medical expenditure in medical centers and regional hospitals. Among these agents, brand trastuzumab was associated with top medical expenditures in the medical centers and regional hospitals. Cardiac and hypertension agents showed the highest medical expenditure in district hospitals and clinics. Among these agents, genetic valsartan/amlodipine was associated with top 1 medical expenditure in district hospitals and clinics.
The Ministry of Health and Welfare approved higher reimbursement service fees and incentives to encourage medical centers and regional hospitals to provide services for severe illness and emergency care [3]. This study revealed that medical centers as well as regional hospitals spend more on anti-tumor/immunologic and anti-systemic infection agents (Table 1), both of which belong to severe illness and emergency care. The main objectives of the district hospitals and clinics are chronic disease treatment and health consultations/referrals. We found that district hospitals use glucose-lowering drugs and treat psychosis with antipsychotics (Figure 3). In contrast, clinics mostly use bold glucose-lowering drugs and treat dyslipidemia with lipid-modifying agents (Figure 4). These drugs help in managing chronic diseases, and if patients need more aggressive treatment, they can be referred to higher-level hospitals.
Cost is a leading policy challenge in the healthcare system. The high proportion of NHI expenses on drugs was identified as a problem in Taiwan's healthcare system [18]. Product price control, reference pricing and profit control are frequently used to control the drug expenditure [5,6,19]. The average annual drug expenditure per capita in Taiwan has been increasing over time (189.6, 199.5 and 215.5 USD in 2016, 2017 and 2018, respectively), which is similar to that in China (187.6 USD in 2016) [20,21]. Although the average annual drug expenditure per capita is similar to that in the neighbouring countries, the proportion of drug expenditure in some categories is still higher than what the government expected. Considering anti-tumor and immunologic drug as an example; the total medical and drug expenditures in cancer treatment was 2298.0–2704.5 and 1072.4–1292.8 million/year, respectively, in 2016–2018. The drug expenditure among all cancer treatment medical expenditures was 46.67–47.80%. This result indicates that drug expenditure reduction may be beneficial to the entire NHI system. In Taiwan, the NHI authorities low-priced drug items in the market for cost reduction, and most of them are generic. The generic drugs used in the top 10 categories of prescription drugs in medical centers and regional hospitals were only 3.19-3.89% and 11.04-13.94% during 2016–2018 (Table 3). These results indicate that product price control for low-priced drugs is of limited help to curtail the drug expenditure. Paying attention to expensive drugs with the intention of cost control may be the way to reduce the drug expenditure in higher-level hospitals. In another way, the generic drugs used in the top 10 categories of prescription drugs in district hospitals and clinics were significantly higher than those used in medical centers/regional hospitals during 2016–2018 (32.35–47.51% in district hospitals and 75.67–78.14% in clinics). As these generics offer cost control benefits, BNHI should provide incentives to encourage pharmaceuticals to sustain generic drug development.
Although the analyses of the national health insurance research database (NHIRD) have provided several benefits, such data are still fraught with limitations owing to the nature of the NHIRD design. First, being based on a claim data sets, the present study lacked self-pay medication information in detailed patient medical records. Another limitation is the time lag in obtaining the NHIRD since NHI needs nearly 1 year to update the claims database; hence, the most updated information was not available. Taiwan national claim data sets are available through formal application to Applied Health Research Data Integration Service provided by the BNHI of Taiwan by provide detail research proposal. We try to find the prescription pattern in Taiwan for both inpatient and outpatient and not distinguish them in the beginning of our study design. It will be difficult to separate inpatient and outpatient prescription in this study. According to previous Taiwan national health insurance statistic, outpatient prescription was much higher than inpatient prescription (6.07-fold in 2018, 5.94-fold in 2017 and 6.67-fold in 2016) (https://www.mohw.gov.tw/dl-72320-5da2775d-2c64-418d-b293-1f1ee56dea6c.html). Results in this study were mainly outpatient prescription. Due to outpatient prescription and inpatient prescription visit may dramatic decreased during COVID-19 pandemic, we will try to analysis the inpatient and outpatient prescription separately between year 2019 to 2021 (before and after COVID-19 pandemic).
Conclusion
In this study, we found that the annual pharmaceutical expenditures from 2016 to 2018 were increasing over time in all hospitals. The average expenditure per hospital depicted an increasing trend in regional and district hospitals but remained similar in medical centers and clinics from 2016 to 2018. Among the categories of drug prescription, anti-tumor and immunologic showed the highest drug expenditures in medical centers/regional hospitals. In contrast, the top 1 category of drug prescription was cardiac and hypertension in district hospitals and clinics. The dominant drug expenditure used for top 10 prescribed generic drugs used were higher in district hospitals/clinics than in medical centers/regional hospitals from 2016 to 2018.
•
The differences in drug expenditures across medical facility type were still unclear.
•
Annual pharmaceutical expenditures from 2016 to 2018 were increasing over time in all hospitals.
•
The average expenditure per hospital depicted an increasing trend in regional and district hospitals but remained similar in medical centers and clinics from 2016 to 2018.
•
Anti-tumor and immunologic agents showed the highest medical expenditure in medical centers and regional hospitals.
•
Cardiac and hypertension agents showed the highest medical expenditure in district hospitals and clinics.
Acknowledgments
This study is based on data from the Applied Health Research Data Integration Service provided by the BNHI. The interpretation and conclusions contained herein do not represent those of the BNHI or Ministry of Health and Welfare.
Financial & competing interests disclosure
This work was supported by the Mackay Medical College (Sanzhi, Taiwan; grant numbers MMC-RD-109-CF-G1-01, MMC-RD-110-1B-P014, MMC-RD-110-CF-G001-01, MMC-RD-111-1B-P014 and MMC-RD-111-CF-G001-01). The author has no other relevant affiliations or financial involvement with any organization or entity with a financial interest in or financial conflict with the subject matter or materials discussed in the manuscript apart from those disclosed.
No writing assistance was utilized in the production of this manuscript.
Ethical conduct of research
The Mackay Medical College entrusted the MacKay Memorial Hospital Institutional Review Board, Taiwan, to review this clinical study. The MacKay Memorial Hospital Institutional Review Board Taiwan, R.O.C., approved the study protocol (protocol no. 19MMHIS188e)
Data sharing statement
The data underlying this study belong to the Applied Health Research Data Integration Service provided by the BNHI of Taiwan and cannot be made publicly available due to legal restrictions. However, the data are available through formal application to the Applied Health Research Data Integration Service provided by the BNHI of Taiwan and require a signed affirmation regarding data confidentiality. The authors have no special privilege of access to the database.
Open access
This work is licensed under the Attribution-NonCommercial-NoDerivatives 4.0 Unported License. To view a copy of this license, visit http://creativecommons.org/licenses/by-nc-nd/4.0/
References
Papers of special note have been highlighted as: • of interest; •• of considerable interest
1.
Cheng TM. Reflections on the 20th anniversary of Taiwan's single-payer National Health Insurance System. Health Aff. (Millwood) 34(3), 502–510 (2015).
•• Introduction of the Taiwan National Health Insurance System and related update.
2.
Lin LY, Warren-Gash C, Smeeth L, Chen PC. Data resource profile: the National Health Insurance Research Database (NHIRD). Epidemiol. Health 40, e2018062 (2018).
3.
Welfare MOHA. Taiwan Health and Welfare Report 2017. https://www.mohw.gov.tw/dl-44682-2644622d-3e42-495a-bbdc-ebb6e6d55092.html (2017).
4.
Wu TY, Majeed A, Kuo KN. An overview of the healthcare system in Taiwan. London J. Prim. Care (Abingdon) 3(2), 115–119 (2010).
5.
Menon D. Pharmaceutical cost control in Canada: does it work? Health Aff. (Millwood) 20(3), 92–103 (2001).
6.
Cameron A, Ewen M, Ross-Degnan D, Ball D, Laing R. Medicine prices, availability, and affordability in 36 developing and middle-income countries: a secondary analysis. Lancet 373(9659), 240–249 (2009).
7.
Chou SY, Deily ME, Lien HM, Zhang JH. Global budgets and provider incentives: hospitals' drug expenditures in Taiwan. Adv. Health Econ. Health Serv. Res. 22, 103–122 (2010).
• Discussion of the pricing strategy in Taiwan National Health Insurance System.
8.
Garrison L, Towse A. The drug budget silo mentality in Europe: an overview. Value Health 6(Suppl. 1), S1–S9 (2003).
9.
Shrank WH, Choudhry NK, Liberman JN, Brennan TA. The use of generic drugs in prevention of chronic disease is far more cost-effective than thought, and may save money. Health Aff. (Millwood) 30(7), 1351–1357 (2011).
10.
Gagne JJ, Choudhry NK, Kesselheim AS et al. Comparative effectiveness of generic and brand-name statins on patient outcomes: a cohort study. Ann. Intern. Med. 161(6), 400–407 (2014).
11.
The Taiwan National Health Insurance Administration: copayments. https://eng.nhi.gov.tw/en/cp-29-34b85-17-2.html
12.
Spence MM, Nguyen LM, Hui RL, Chan J. Evaluation of clinical and safety outcomes associated with conversion from brand-name to generic tacrolimus in transplant recipients enrolled in an integrated health care system. Pharmacotherapy 32(11), 981–987 (2012).
13.
Hsu JC, Lu CY. The evolution of Taiwan's National Health Insurance drug reimbursement scheme. Daru 23(1), 15 (2015).
14.
Skrbo A, Begovic B, Skrbo S. Classification of drugs using the ATC system (Anatomic, Therapeutic, Chemical Classification) and the latest changes. Med. Arch 58(2 Suppl. 1), 138–141 (2004).
15.
Welfare MOHA. Government Statistics. (2016).
16.
Welfare MOHA. Government Statistics. (2017).
17.
Welfare MOHA. Government Statistics. (2018).
18.
Chen CL, Chen L, Yang WC. The influences of Taiwan's generic grouping price policy on drug prices and expenditures: evidence from analysing the consumption of the three most-used classes of cardiovascular drugs. BMC Public Health 8, 118 (2008).
•• Discussion of the pricing strategy in Taiwan National Health Insurance System.
19.
Kasonde L, Tordrup D, Naheed A, Zeng W, Ahmed S, Babar ZU. Evaluating medicine prices, availability and affordability in Bangladesh using World Health Organisation and Health Action International methodology. BMC Health Serv. Res. 19(1), 383 (2019).
20.
Yip W, Fu H, Chen AT et al. 10 years of health-care reform in China: progress and gaps in Universal Health Coverage. Lancet 394(10204), 1192–1204 (2019).
21.
Yan K, Yang C, Zhang H et al. Impact of the zero-mark-up drug policy on drug-related expenditures and use in public hospitals, 2016–2018: an interrupted time series study in Shaanxi. BMJ Open 10(11), e037034 (2020).
Information & Authors
Information
Published In
Copyright
© 2022 Ching-Hu Chung. This work is licensed under the Attribution-NonCommercial-NoDerivatives 4.0 Unported License
History
Received: 7 September 2022
Accepted: 29 November 2022
Published online: 13 December 2022
Keywords:
Topics
Authors
Funding Information
Mackay Medical College: grant nos. MMC-RD-109-CF-G1-01, MMC-RD-110-1B-P014
Metrics & Citations
Metrics
Article Usage
Article usage data only available from February 2023. Historical article usage data, showing the number of article downloads, is available upon request.
Citations
How to Cite
Trends in pharmaceutical expenditure in the Taiwan National Health Insurance database at different hospital levels. (2022) Journal of Comparative Effectiveness Research. DOI: 10.2217/cer-2022-0162
Export citation
Select the citation format you wish to export for this article or chapter.
Citing Literature
- Pei-Ching Lin, Yun-Yue Cheng, Cheng-Hsiung Chen, Ying-Ming Shih, Kuo-Yang Huang, Chin-Tun Hung, Ching-Hsiung Lin, Integrated Care for COPD in the Elderly: Impact on Healthcare Utilization Across Healthcare Settings, International Journal of Chronic Obstructive Pulmonary Disease, 10.2147/COPD.S578345, Volume 21, (1-12), (2026).
- Simon Fifer, Brittany Keen, Keira Joann Herr, Chih-Lin Chiang, Thomas Webb, Major Depressive Disorder with Suicidal Ideation or Intent in Taiwan: A Discrete Choice Experiment of Psychiatrists’ Treatment Preferences, Taiwanese Journal of Psychiatry, 10.4103/TPSY.TPSY_20_25, 39, 2, (102-110), (2025).
- Georgios Mavridoglou, Nikolaos Polyzos, Demographic and Geographic Characteristics Associated with the Type of Prescription and Drug Expenditure: Real World Evidence for Greece During 2015–2021, Healthcare, 10.3390/healthcare12222312, 12, 22, (2312), (2024).
- Shu-I Wu, An-Sheng Lee, Ching-Hu Chung, Trends of drug expenditure in Taiwan National Health Insurance before and during COVID-19 pandemic, Frontiers in Medicine, 10.3389/fmed.2024.1388569, 11, (2024).
- Guilherme Silva Julian, Wen-Yi Shau, Hsu-Wen Chou, Sajita Setia, Bridging Real-World Data Gaps: Connecting Dots Across 10 Asian Countries, JMIR Medical Informatics, 10.2196/58548, 12, (e58548), (2024).
- Fu-Shun Yen, Chii-Min Hwu, Jia-Sin Liu, Yi-Ling Wu, Keong Chong, Chih-Cheng Hsu, Sodium–Glucose Cotransporter-2 Inhibitors and the Risk for Dialysis and Cardiovascular Disease in Patients With Stage 5 Chronic Kidney Disease, Annals of Internal Medicine, 10.7326/M23-1874, 177, 6, (693-700), (2024).