Postoperative outcomes and anesthesia type in total knee arthroplasty in patients with obstructive sleep apnea
Publication: Journal of Comparative Effectiveness Research
Abstract
Aim: We investigated the relationship between obstructive sleep apnea (OSA), 30/90-day readmission rates and perioperative complications (postoperative cardiovascular, gastrointestinal, infectious or intraoperative complications) in patients undergoing total knee arthroplasty. Materials & methods: We analyzed records of patients who underwent total knee arthroplasty using State Inpatient Databases. Demographics, comorbidities, 30/90-day readmission rates and complications were compared by OSA status. For NY, USA we analyzed outcomes by anesthetic type (regional vs general). Results: OSA patients were mostly male, had more comorbidities and had increased 30/90-day readmission rates. There were no differences in complications. In NY, there were no differences in outcomes by anesthetic type. Conclusion: OSA was associated with increased 30/90-day readmission rates. Within NY, anesthetic type was not associated with any outcomes.
Plain language summary
By analyzing records of patients who underwent total knee replacement, we investigated the relationship between obstructive sleep apnea (OSA), rates of readmission to the hospital at 30 and 90 days after surgery and perioperative complications (postoperative cardiovascular, gastrointestinal, infectious or intraoperative complication). In the NY, USA population, we analyzed outcomes based on anesthetic type (regional vs general anesthesia). We found that OSA patients were mostly male, had more medical conditions and had increased rates of 30 and 90-day readmission. There were no differences in complications. In NY, there were no differences in outcomes by anesthetic type. In conclusion, OSA was associated with increased rates of readmission to the hospital at 30 and 90 days after surgery. Within NYS, anesthetic type was not associated with any outcomes.
Obstructive sleep apnea (OSA) is characterized by episodic upper airway obstruction during sleep resulting in intermittent hypoxemia [1–3]. The prevalence of OSA in the US is suspected to be between 9 and 38% and is more common in men, older individuals and those with a high BMI [4–6]. Untreated OSA can cause additional chronic medical conditions, leading to increased total lifetime healthcare costs and can have a substantial economic impact on society [7]. In the perioperative setting, patients with OSA pose management challenges including increased risk of postoperative hypoxemia and cardiopulmonary complications that can lead to greater resource utilization, longer hospital and intensive care stays and higher readmission rates [8–10]. The American Society of Anesthesiologists (ASA) has established clinical guidelines for management of patients with OSA, first in 2006 and updated in 2014. These recommendations include the perioperative use of positive airway pressure therapy, continuous oxygen saturation monitoring, oxygen therapy and regional anesthesia (RA) whenever possible [11].
Total knee arthroplasty (TKA), one of the most common orthopedic surgical procedures performed in the US, may be performed under regional or general anesthesia (GA), with RA associated with decreased length of stay (LOS) and postoperative complications [9]. OSA prevalence is higher in patients undergoing orthopedic compared with general surgery procedures, and several studies show an adverse impact of OSA on morbidity and mortality in the orthopedic populations [9,12–15]. Additionally, patients with OSA undergoing TKA report lower satisfaction and patient-rated success scores compared with those without OSA [16]. Furthermore, many patients who present for joint replacement surgery have undiagnosed OSA, which could lead to unexpected complications and patient dissatisfaction [17].
In this study, we sought to investigate the relationship between OSA and postoperative outcomes in patients undergoing elective TKA. We retrospectively analyzed data from the State Inpatient Databases (SID) for NY, FL, MD and KY, USA, for the years 2007–2018. Our main hypothesis was that OSA would increase the rate and the adjusted odds of adverse perioperative outcomes after correction for potential confounders. The primary outcome was 30- and 90-day readmission, quality metrics which represent transitions of care from inpatient to outpatient settings. The secondary outcomes were in-hospital mortality, perioperative complications and LOS.
A further aim was to explore shifts in practice and outcomes that might represent a response to the initial publication of the ASA OSA guidelines in 2006. Here, we hypothesized that adverse postoperative outcomes associated with OSA would decrease over the study period, the use of RA would increase over the study period and adverse postoperative outcomes would be lower in patients who received RA as compared with GA.
Materials & methods
Study database & population
In this retrospective observational study, we analyzed administrative records of patients who underwent elective inpatient TKA from 2007 to 2018 using multi state data from the State Inpatient Databases (SID) (Healthcare Cost and Utilization Project, Agency for Healthcare Research and Quality). States included were FL, MD, KY and WA (all years), NY (2007–2016) and CA (2007–2011). The SID is a discharge level database which contains information on diagnoses, procedures and patient demographics for nearly all inpatient hospitalizations within a particular state. The database contains present-on-admission (POA) indicators which distinguish pre-existing comorbidities from complications developed in the inpatient stay. In certain states and years, a variable linking records to an individual patient enables longitudinal analyses of patient readmissions.
Inclusion criteria for the full sample were adults aged 18+ years with a TKA on the inpatient record. TKA surgeries were identified using International Classification of Diseases Clinical Modification, 9th Revision (ICD-9-CM) code 81.54 and International Classification of Diseases Procedure Codes, 10th Revision (ICD-10-PCS) codes 0SRD0J9, 0SRC0J9, 0SRC0JA and 0SRD0JA [18]. Records were excluded if they had missing data for primary payer or sex, or if the TKA was identified as non elective. Readmission data were feasible except for in the state of KY (all years), MD before 2012 and WA before 2009.
NY, USA data contains a variable for anesthesia type, which can take on only one value per inpatient record [18,19]. Because a patient could receive multiple types of anesthesia during a hospital admission, records that had more than one procedure (i.e., any procedure other than the TKA) listed were excluded, to ensure the anesthesia type recorded was for the TKA procedure only. The variable is coded hierarchically (in descending order): general, regional, local, other and no anesthesia. For the secondary analysis of NY data, only records reporting the use of GA or RA for the TKA procedure were compared.
All study activities were approved by the Institutional Review Board at Weill Cornell Medical College. STROBE guidelines for the reporting of observational studies were followed [20].
Primary variable of interest
Patients were categorized based on the presence or absence of a POA diagnosis of OSA. OSA was identified by ICD-9-CM 327.23 and ICD-10-CM G4733.
Primary outcome
The primary outcomes were binary indicators of 30- and 90-day readmission, separately. If a readmission analysis was not possible for a record, the binary indicator was set to missing. Secondary outcomes included in-hospital mortality, LOS (in days) and the presence of a cardiovascular, infectious, gastrointestinal or intraoperative complication (separately and as a composite binary measure). A list of all ICD-9 codes comprising the complication measures can be found in Supplementary Table 1, and a corresponding list of ICD-10 codes can be found in Supplementary Table 2.
Statistical analysis
We compared patient demographics and comorbidities by OSA status in the full population and in the population of NY only. In the NY population, we additionally compared patients with OSA by anesthesia type (RA or GA).
For all binary outcomes, generalized linear mixed models were fitted on the full sample, clustering on the individual hospital. For the outcome of LOS, a Cox proportional hazards model was fitted. In the NY data, we repeated the main analyses in a population of OSA patients only. We also conducted a multivariable logistic regression model with the outcome of receiving GA (compared with RA).
A sensitivity analysis was conducted of the full sample in which the primary outcomes of 30- and 90-day readmission were repeated with an additional interaction term of OSA status and continuous positive airway pressure (CPAP) use. These models were compared with the corresponding models without the interaction term using likelihood ratio tests. If the likelihood ratio tests showed that the interaction models had a better fit, linear combination of coefficients were calculated with significant categories of the interaction term(s) and the respective categories.
Variables
In all multivariable models, the following covariates were included: a binary indicator of OSA status, primary insurance payer (unordered categories: Medicare, Medicaid, private insurance, other insurance, self-pay/no charge/uninsured), race/ethnicity (unordered categories: White, Black, Hispanic, other, missing), state-based quartile of median income for the patient’s ZIP code, sex, age, 29 binary Elixhauser comorbidities, year of procedure, quartile of hospital TKA procedure volume (based upon the entire sample), year of procedure and state of hospital [21]. Additional measures of logged total hospital charges from the index admission and logged LOS stay were included in models of 30- and 90-day readmission. In all models a binary indicator for invasive or non invasive in-hospital CPAP use was included.
Results
Demographics
After applying exclusion criteria, the study population consisted of 1,141,882 patients, with 93,765 (8.2%) of patients with a POA diagnosis of OSA (Figure 1). While the TKA population at-large was two-thirds female, those with a POA diagnosis of OSA were only 50% female (Table 1). Within the study population, the prevalence of OSA increased from 2% in 2007 to 8% in 2018, with the highest prevalence in 2016 (13.1%) (Table 1). Patients with OSA were more likely to be male and had higher rates of multiple comorbidities including congestive heart failure, valvular disease, pulmonary circulation disorders, vascular disorders, hypertension, neurological disorders, pulmonary disease, diabetes, hypothyroidism, renal disease, liver disease, peptic ulcer disease, rheumatoid arthritis, coagulopathies, obesity, electrolyte disorders, anemia, alcohol and drug abuse and depression than patients without OSA (Table 1). Of note, 138 patients were diagnosed with OSA during their hospital admission. This is considered not POA (nPOA) diagnosis and these patients were excluded from all analysis.
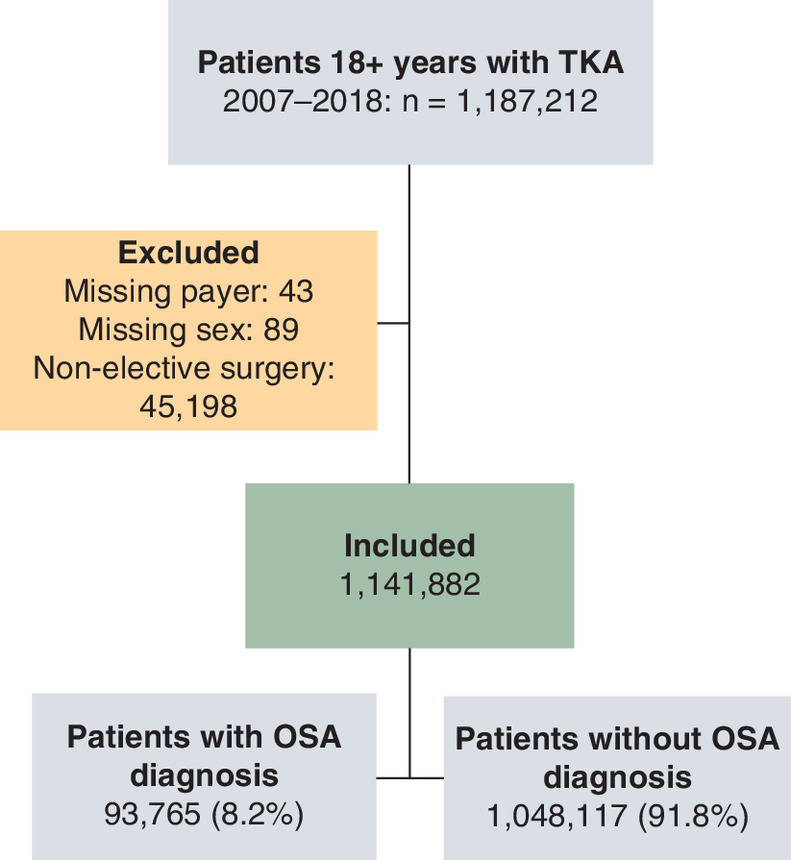
Figure 1. Sample attrition for all included states.
OSA: Obstructive sleep apnea; TKA: Total knee arthroplasty.
| Characteristic | No OSA (%) | OSA (%) | Overall (%) | p-value |
|---|---|---|---|---|
| Total | 1,048,117 (91.8) | 93,765 (8.2) | 1,141,882 (100) | |
| Age (years) | <0.0001 | |||
| Mean (standard deviation) | 66.88 (9.99) | 64.83 (8.89) | 66.71 (9.92) | |
| Gender | <0.0001 | |||
| Male | 380,537 (36.3) | 47,071 (50.2) | 427,608 (37.4) | |
| Female | 667,580 (63.7) | 466,94 (49.8) | 714,274 (62.6) | |
| Year | <0.0001 | |||
| 2007 | 82,565 (7.9) | 1874 (2) | 84,439 (7.4) | |
| 2008 | 85,201 (8.1) | 3692 (3.9) | 88,893 (7.8) | |
| 2009 | 86,892 (8.3) | 5399 (5.8) | 92,291 (8.1) | |
| 2010 | 91,512 (8.7) | 6898 (7.4) | 98,410 (8.6) | |
| 2011 | 89,878 (8.6) | 7637 (8.1) | 97,515 (8.5) | |
| 2012 | 90,230 (8.6) | 8456 (9) | 98,686 (8.6) | |
| 2013 | 93,811 (9) | 9291 (9.9) | 103,102 (9) | |
| 2014 | 96,463 (9.2) | 10,178 (10.9) | 106,641 (9.3) | |
| 2015 | 99,705 (9.5) | 11,380 (12.1) | 111,085 (9.7) | |
| 2016 | 103,470 (9.9) | 12,329 (13.1) | 115,799 (10.1) | |
| 2017 | 72,787 (6.9) | 9104 (9.7) | 81,891 (7.2) | |
| 2018 | 55,603 (5.3) | 7527 (8) | 63,130 (5.5) | |
| State | <0.0001 | |||
| FL | 392,924 (37.5) | 30,911 (33) | 423,835 (37.1) | |
| KY | 100,959 (9.6) | 12,004 (12.8) | 112,963 (9.9) | |
| MD | 120,542 (11.5) | 12,715 (13.6) | 133,257 (11.7) | |
| NY | 278,760 (26.6) | 22,033 (23.5) | 300,793 (26.3) | |
| WA | 154,932 (14.8) | 16,102 (17.2) | 171,034 (15) | |
| Median household income state quartile for patient zip code (by quartile) | <0.0001 | |||
| First quartile | 222,172 (21.2) | 19,324 (20.6) | 241,496 (21.1) | |
| Second quartile | 268,409 (25.6) | 23,964 (25.6) | 292,373 (25.6) | |
| Third quartile | 278,619 (26.6) | 25,073 (26.7) | 303,692 (26.6) | |
| Fourth quartile | 260,344 (24.8) | 23,902 (25.5) | 284,246 (24.9) | |
| Missing | 18,573 (1.8) | 1502 (1.6) | 20,075 (1.8) | |
| Race | <0.0001 | |||
| White | 819,886 (78.2) | 76,980 (82.1) | 896,866 (78.5) | |
| Black | 86,473 (8.3) | 8800 (9.4) | 95,273 (8.3) | |
| Hispanic | 55,489 (5.3) | 3715 (4) | 59,204 (5.2) | |
| Other | 43,752 (4.2) | 2840 (3) | 46,592 (4.1) | |
| Missing | 42,517 (4.1) | 1430 (1.5) | 43,947 (3.8) | |
| Hospital volume | <0.0001 | |||
| First quartile | 16,770 (1.6) | 696 (0.7) | 17,466 (1.5) | |
| Second quartile | 94,490 (9) | 5737 (6.1) | 100,227 (8.8) | |
| Third quartile | 243,162 (23.2) | 18,650 (19.9) | 261,812 (22.9) | |
| Fourth quartile | 693,695 (66.2) | 68,682 (73.2) | 762,377 (66.8) | |
| Primary payer | <0.0001 | |||
| Medicare | 612,412 (58.4) | 49,817 (53.1) | 662,229 (58) | |
| Medicaid | 37,062 (3.5) | 3064 (3.3) | 40,126 (3.5) | |
| Private insurance | 352,569 (33.6) | 36,145 (38.5) | 388,714 (34) | |
| Other | 40,213 (3.8) | 4316 (4.6) | 44,529 (3.9) | |
| Self-pay/no charge | 5,861 (0.6) | 423 (0.5) | 6284 (0.6) | |
| Elixhauser comorbidities | ||||
|---|---|---|---|---|
| Congestive heart failure | 24,202 (2.3) | 5644 (6) | 29,846 (2.6) | <0.0001 |
| Valvular disease | 36,799 (3.5) | 4213 (4.5) | 41,012 (3.6) | <0.0001 |
| Pulmonary circulation disorders | 6479 (0.6) | 1838 (2) | 8317 (0.7) | <0.0001 |
| Peripheral vascular disorders | 20,950 (2) | 2832 (3) | 23,782 (2.1) | <0.0001 |
| Hypertension, uncomplicated | 626,264 (59.8) | 64,844 (69.2) | 691,108 (60.5) | <0.0001 |
| Hypertension, complicated | 49,559 (4.7) | 8820 (9.4) | 58,379 (5.1) | <0.0001 |
| Paralysis | 863 (0.1) | 80 (0.1) | 943 (0.1) | 0.7607 |
| Other neurological disorders | 18,365 (1.8) | 2218 (2.4) | 20,583 (1.8) | <0.0001 |
| Chronic pulmonary disease | 147,519 (14.1) | 24,939 (26.6) | 172,458 (15.1) | <0.0001 |
| Diabetes, uncomplicated | 180,649 (17.2) | 26,061 (27.8) | 206,710 (18.1) | <0.0001 |
| Diabetes, complicated | 22,269 (2.1) | 5577 (5.9) | 27,846 (2.4) | <0.0001 |
| Hypothyroidism | 162,900 (15.5) | 17,094 (18.2) | 179,994 (15.8) | <0.0001 |
| Renal failure | 45,994 (4.4) | 7939 (8.5) | 53,933 (4.7) | <0.0001 |
| Liver disease | 10,562 (1) | 1733 (1.8) | 12,295 (1.1) | <0.0001 |
| Peptic ulcer disease excluding bleeding | 4429 (0.4) | 451 (0.5) | 4,880 (0.4) | 0.0086 |
| AIDS/HIV | 419 (0) | 32 (0) | 451 (0) | 0.3879 |
| Lymphoma | 2,176 (0.2) | 219 (0.2) | 2,395 (0.2) | 0.0961 |
| Metastatic cancer | 718 (0.1) | 55 (0.1) | 773 (0.1) | 0.2667 |
| Solid tumor without metastasis | 4754 (0.5) | 431 (0.5) | 5.185 (0.5) | 0.7906 |
| Rheumatoid arthritis/collagen vascular diseases | 46,581 (4.4) | 4600 (4.9) | 51,181 (4.5) | <0.0001 |
| Coagulopathy | 12,955 (1.2) | 1742 (1.9) | 14,697 (1.3) | <0.0001 |
| Obesity | 232,534 (22.2) | 50,046 (53.4) | 282,580 (24.7) | <0.0001 |
| Weight loss | 1234 (0.1) | 115 (0.1) | 1,349 (0.1) | 0.6748 |
| Fluid and electrolyte disorders | 27,728 (2.6) | 3101 (3.3) | 30,829 (2.7) | <0.0001 |
| Blood loss anemia | 3169 (0.3) | 267 (0.3) | 3436 (0.3) | 0.3459 |
| Deficiency anemia | 11,328 (1.1) | 1452 (1.5) | 12,780 (1.1) | <0.0001 |
| Alcohol abuse | 9706 (0.9) | 1175 (1.3) | 10,881 (1) | <0.0001 |
| Drug abuse | 6932 (0.7) | 1002 (1.1) | 7934 (0.7) | <0.0001 |
| Psychoses | 2332 (0.2) | 308 (0.3) | 2640 (0.2) | <0.0001 |
| Depression | 128,923 (12.3) | 20,231 (21.6) | 149,154 (13.1) | <0.0001 |
p-value refer to comparisons between OSA statuses. Percent may not sum to 100 due to rounding.
OSA: Obstructive sleep apnea; TKA: Total knee arthroplasty.
Primary & secondary outcomes
Regarding the primary outcomes, patients with OSA had increased 30-day (0.5 vs 0.4%, adjusted odds ratio [aOR]: 1.13 [1.00, 1.26]) and 90-day (2.3 vs 1.8%, aOR: 1.11 [1.05, 1.17]) readmission rates, with similar LOS (median interquartile range [IQR]: 2, 3 days for both, adjusted relative risk [aRR]: 0.96 [0.96, 0.97]) (Table 2). In terms of secondary outcomes, in-hospital mortality was the same between the two groups (0.1% for both groups, aOR: 0.23 [0.18, 0.31]). In adjusted analyses, patients with OSA were not more likely than patients without OSA to experience cardiovascular, infectious, gastrointestinal or intraoperative complications (Table 2).
| Outcome | n (%) | aOR (95% CI) |
|---|---|---|
| 30-day readmission | ||
| No OSA | 3,307 (0.4) | 1.00 (reference) |
| OSA | 361 (0.5) | 1.13 (1.00,1.26)† |
| 90-day readmission | ||
| No OSA | 14,900 (1.8) | 1.00 (reference) |
| OSA | 1,676 (2.3) | 1.11(1.05,1.17)‡ |
| In-hospital mortality | ||
| No OSA | 569 (0.1) | 1.00 (reference) |
| OSA | 74 (0.1) | 0.23 (0.18,0.31)‡ |
| Cardiovascular complication | ||
| No OSA | 13,761 (1.3) | 1.00 (reference) |
| OSA | 1707 (1.8) | 1.02 (0.97,1.09) |
| Infectious complication | ||
| No OSA | 9431 (0.9) | 1.00 (reference) |
| OSA | 1074 (1.1) | 0.95 (0.89,1.03) |
| Intraoperative complication | ||
| No OSA | 2940 (0.3) | 1.00 (reference) |
| OSA | 279 (0.3) | 0.99 (0.86,1.13) |
| Gastrointestinal complication | ||
| No OSA | 2578 (0.2) | 1.00 (reference) |
| OSA | 340 (0.4) | 1.11 (0.97,1.26) |
| LOS (days) | ||
| No OSA | 3 (2; 3) § | 1.00 (reference) |
| OSA | 3 (2; 3) § | 0.96 (0.96,0.97)‡, ¶ |
Percent may not sum to 100 due to rounding and missing values.
†
p < 0.05.
‡
p < 0.001.
§
Median (IQR).
¶
Adjusted risk ratio.
aOR: Adjusted odds ratio; IQR: Interquartile range; OSA: Obstructive sleep apnea; TKA: Total knee arthroplasty.
Analysis by anesthetic type in NY OSA population
After applying exclusion criteria, the subgroup population of patients from the New York SID contained 95,869 patients (Figure 2). In this group, 6854 patients (7.1%) carried the diagnosis of OSA, 46.5% of whom received RA as the primary anesthetic compared with 48.5% in the non-OSA population (Figure 2).

Figure 2. Sample attrition for NY, USA.
GA: General anesthesia; NY: New York; OSA: Obstructive sleep apnea; RA: Regional anesthesia; TKA: Total knee arthroplasty.
We found no differences in the rates of any complication (cardiovascular, infectious, gastrointestinal or intraoperative), LOS, 30-day or 90-day readmission in patients who received GA compared with those who received RA as the primary anesthetic (Table 3). Over the study period, the odds of patients with OSA receiving GA initially trended downwards in the first 2 years, with 2009 being the only statistically significant decrease (reference year: 2007). Since 2009, the overall trend has been toward increased use of GA with a peak in the final year (2016) of the study (Table 4).
| Outcome | Overall | Male | Female | |||
|---|---|---|---|---|---|---|
| n (%) | aOR (95% CI) | n (%) | aOR (95% CI) | n (%) | aOR (95% CI) | |
| 30-day readmission | ||||||
| RA | <30 (<0.4) | 1.00 (reference) | 19 (0.4) | 1.00 (reference) | <11 (<0.3) | 1.00 (reference) |
| GA | <22 (<0.3) | 0.86 (0.32–2.31) | 11 (0.3) | 0.67 (0.20–2.20) | <11 (<0.3) | 0.50 (0.04–5.88) |
| 90-day readmission | ||||||
| RA | 151 (1.9) | 1.00 (reference) | 92 (2.2) | 1.00 (reference) | 59 (1.5) | 1.00 (reference) |
| GA | 111 (1.7) | 0.80 (0.52–1.24) | 55 (1.7) | 0.52 (0.28–0.95) † | 56 (1.6) | 1.41 (0.75–2.65) |
| Cardiovascular complication | ||||||
| RA | 183 (2.2) | 1.00 (reference) | 94 (2.1) | 1.00 (reference) | 89 (2.3) | 1.00 (reference) |
| GA | 162 (2.3) | 1.16 (0.71–1.88) | 74 (2.2) | 1.18 (0.60–2.32) | 88 (2.4) | 1.14 (0.55–2.36) |
| Infectious complication | ||||||
| RA | 82 (1.0) | 1.00 (reference) | 32 (0.7) | 1.00 (reference) | 50 (1.3) | 1.00 (reference) |
| GA | 73 (1.0) | 1.07 (0.50–2.28) | 20 (0.6) | 0.51 (0.11–2.31) | 53 (1.4) | 1.18 (0.40–3.46) |
| Intraoperative complication | ||||||
| RA | <11 (<0.2) | 1.00 (reference) | <11 (<0.2) | 1.00 (reference) | 0 (0.0) | 1.00 (reference) |
| GA | <11 (<0.2) | ¶ | 0 (0.0) | ¶ | <11 (<0.3) | ¶ |
| Gastrointestinal complication | ||||||
| RA | <22 (0.3) | 1.00 (reference) | <11 (<0.2) | 1.00 (reference) | <11 (<0.3) | 1.00 (reference) |
| GA | <27 (0.3) | 2.64 (0.82–8.49) | 16 (0.5) | ¶ | <11 (<0.3) | ¶ |
| LOS (days) | ||||||
| RA | 3 (3–4)‡ | 1.00 (reference) | 3 (3–4)‡ | 1.00 (reference) | 3 (3–4)‡ | 1.00 (reference) |
| GA | 3 (3–4)‡ | 1.04 (0.99–1.10)§ | 3 (3–4)‡ | 1.06 (0.99–1.14)§ | 3 (3–4)‡ | 1.03 (0.96–1.11)§ |
Percent may not sum to 100 due to rounding and missing values.
†
p < 0.05.
‡
Median (IQR).
§
Adjusted risk ratio.
¶
Model unable to be fit due to non convergence.
aOR: Adjusted odds ratio; GA: General anesthesia; IQR: Interquartile range; OSA: Obstructive sleep apnea; RA: Regional anesthesia; TKA: Total knee arthroplasty.
| Year | n (%) | aOR (95% CI) |
|---|---|---|
| 2007 | 93 (55.4) | 1.00 (reference) |
| 2008 | 109 (47.4) | 0.69 (0.46,1.06) |
| 2009 | 161 (46.9) | 0.65 (0.44,0.97)† |
| 2010 | 286 (49.4) | 0.71 (0.50,1.03) |
| 2011 | 332 (53.0) | 0.82 (0.57,1.17) |
| 2012 | 414 (55.7) | 0.90 (0.63,1.29) |
| 2013 | 375 (49.3) | 0.78 (0.55,1.12) |
| 2014 | 493 (51.1) | 0.75 (0.53,1.07) |
| 2015 | 668 (56.6) | 0.90 (0.63,1.27) |
| 2016 | 734 (58.4) | 1.03 (0.73,1.46) |
†
p < 0.05.
aOR: Adjusted odds ratio; OSA: Obstructive sleep apnea.
Discussion
We retrospectively analyzed the effect of OSA diagnosis on postoperative outcomes in a multistate cohort of patients undergoing TKA over a 12-year period (2007–2018). After adjustment for comorbid conditions, we observed an increased rate of 30- and 90-day readmissions in patients diagnosed with OSA (our primary outcome). OSA has consistently been identified as a risk factor for hospital readmission and is not limited to the orthopedic surgery population [22,23]. In TKA patients, readmissions pose a problem as this disrupts recovery, leads to decreased satisfaction, and is an indicator of inferior quality of care. Additionally, readmissions lead to higher costs for both patients and hospital systems and can result in penalties and decreased reimbursements [13,22,24]. By identifying OSA as a risk factor for readmission, providers can focus on optimizing these patients in the perioperative setting. Different strategies should be considered for this patient population to reduce readmissions including longer immediate post-operative admissions or closer postoperative follow-up [24,25]. Some beneficial measures may include promoting incentive spirometry use, ensuring CPAP use after surgery, early mobility and cautious use of opioids both while in the hospital and after discharge [26–28].
Cardiovascular complications have also been associated with both OSA diagnosis and readmissions post-total joint arthroplasty (TJA) [29–33]. However, this is not consistently seen in all the literature and we did not observe a significant association between OSA and cardiovascular complications in our population [14]. Also in our population, there was no association between OSA diagnosis and infectious, gastrointestinal or intraoperative complications, nor were there any associations between OSA diagnosis and risk of longer LOS.
Within the study population, we noted a yearly increase in the prevalence of OSA until 2016 (13.1%), with a subsequent decrease in 2017 (9.7%) and 2018 (8%). Increased prevalence in OSA is being seen globally, especially as the world population becomes older with higher rates of obesity [4,5]. It is not surprising that this trend persists in the surgical population as well, especially in patients undergoing TKA, a procedure more commonly performed in older and heavier patients [4,5].
Contrary to our stated hypothesis, in the subgroup of NY patients with OSA, we found no relationship between the primary anesthetic type and complications (cardiovascular, infectious, gastrointestinal or intraoperative), LOS or 30- and 90-day readmission rates. Similarly, our hypothesis that the use of GA would decrease over time was not supported, as we observed no change in the use of GA over the study period. We found this surprising given the ASA's recommendations for RA use in both the OSA and orthopedic population [34,35]. This is perhaps due to the lack of strong evidence suggesting that RA provides benefit on major perioperative outcomes, when compared with GA [36].
Our findings should not be viewed without acknowledging certain limitations inherent to the SID. First, we were unable to investigate the association of POA diagnosis of OSA with perioperative pulmonary complications due to the use of CPAP being coded as a complication in the SID database. This is unfortunate as pulmonary complications have been previously reported to be high in this population [14,29–33]. Second, patients who received both GA and RA for the TKA would be coded simply as GA, which could bias the differences seen between the anesthesia type cohorts. Additionally, all RA techniques are coded as RA and thus there was no way to stratify further by regional technique (neuraxial vs peripheral nerve block vs both) [18,19]. Finally, the use of the SID (as with any administrative database) requires accurate coding in the electronic medical records from which the data is obtained. As a result, it is possible that there are errors in the coding of OSA diagnoses or other comorbidities that could bias the results of the present study.
Conclusion
In conclusion, in a large population-based cohort, we found an increase in the prevalence of OSA in patients undergoing TKA and an association of OSA diagnosis with 30- and 90-day readmission rates. There were no differences with the use of general versus regional anesthetic on any of the postoperative outcomes studied and no observed changes in the percentage of GA used over the study time period. While there are known benefits of RA that may make it the preferable anesthetic choice for the OSA population, our study suggests that the use of GA may not provide significant disadvantage in terms of major postoperative complications.
•
Patients with obstructive sleep apnea (OSA) pose perioperative management challenges that can lead to greater resource utilization, longer hospital stays and higher readmission rates.
•
In this retrospective observational study, we analyzed administrative records of patients who underwent elective inpatient total knee arthroplasty from 2007 to 2018 using multistate data from the State Inpatient Databases.
•
The primary outcomes were 30- and 90-day readmission rates. Secondary outcomes included in-hospital mortality, length of stay and the presence of a cardiovascular, infectious, gastrointestinal or intraoperative complications.
•
In our cohort, patients with OSA had increased 30- and 90-day readmission rates, with similar length of stay.
•
In our cohort, patients with OSA were not more likely to experience cardiovascular, infectious, gastrointestinal or intraoperative complications, compared with patients without OSA.
•
In the NY, USA population, we found no differences with the use of general versus regional anesthetic on any of the outcomes studied.
•
While there are known benefits of regional anesthesia that may make it the preferable anesthetic choice for the OSA population, our study suggests that the use of general anesthesia may not provide significant disadvantage in terms of major postoperative complications.
Author contributions
All authors participated sufficiently in the work to take responsibility for the content, based on the conditions listed on the author disclosure form.
Financial & competing interests disclosure
RS White is the recipient of FAER grant ID no. MRTG-08-15-2021-White. The authors have no other relevant affiliations or financial involvement with any organization or entity with a financial interest in or financial conflict with the subject matter or materials discussed in the manuscript apart from those disclosed.
No writing assistance was utilized in the production of this manuscript.
Ethical conduct of research
All study activities were approved by the Institutional Review Board at Weill Cornell Medical College. STROBE guidelines for the reporting of observational studies were followed.
Supplementary Material
References
Papers of special note have been highlighted as: • of interest; •• of considerable interest
1.
Loadsman JA, Hillman DR. Anaesthesia and sleep apnoea. Br. J. Anaesth. 86(2), 254–266 (2001).
2.
Dempsey JA, Veasey SC, Morgan BJ, O'Donnell CP. Pathophysiology of sleep apnea. Physiol. Rev. 90(1), 47–112 (2010).
3.
Tamisier R, Fabre F, O'Donoghue F, Lévy P, Payen J-F, Pépin J-L. Anesthesia and sleep apnea. Sleep Med. Rev. 40, 79–92 (2018).
4.
Senaratna CV, Perret JL, Lodge CJ et al. Prevalence of obstructive sleep apnea in the general population: a systematic review. Sleep Med. Rev. 34, 70–81 (2017).
5.
Lyons MM, Bhatt NY, Pack AI, Magalang UJ. Global burden of sleep-disordered breathing and its implications. Respirology 25(7), 690–702 (2020).
6.
Berend KR, Ajluni AF, Núñez-García LA, Lombardi AV, Adams JB. Prevalence and management of obstructive sleep apnea in patients undergoing total joint arthroplasty. J. Arthroplasty 25(6), 54–57 (2010).
7.
Tarasiuk A, Reuveni H. The economic impact of obstructive sleep apnea. Curr. Opin. Pulm. Med. 19(6), 639–644 (2013).
• Article highlights the health care costs of obstructive sleep apnea (OSA).
8.
Chan MTV, Wang CY, Seet E et al. Association of unrecognized obstructive sleep apnea with postoperative cardiovascular events in patients undergoing major noncardiac surgery. JAMA 321(18), 1788 (2019).
9.
Memtsoudis SG, Stundner O, Rasul R et al. Sleep apnea and total joint arthroplasty under various types of anesthesia: a population-based study of perioperative outcomes. Reg. Anesth. Pain Med. 38(4), 274–281 (2013).
10.
Memtsoudis S, Liu SS, Ma Y et al. Perioperative pulmonary outcomes in patients with sleep apnea after noncardiac surgery. Anesth. Analg. 112(1), 113–121 (2011).
11.
Gross J, Bachenberg K, Benumof J, Caplan R. Practice guidelines for the perioperative management of patients with obstructive sleep apnea: an updated report by the American Society of Anesthesiologists Task Force on perioperative management of patients with obstructive sleep apnea. Anesthesiology 120(2), 268–286 (2014).
12.
Naqvi SY, Rabiei AH, Maltenfort MG et al. Perioperative complications in patients with sleep apnea undergoing total joint arthroplasty. J. Arthroplasty 32(9), 2680–2683 (2017).
13.
D'Apuzzo MR, Browne JA. Obstructive sleep apnea as a risk factor for postoperative complications after revision joint arthroplasty. J. Arthroplasty 27(8), 95–98 (2012).
14.
Pichler L, Weinstein SM, Cozowicz C et al. Perioperative impact of sleep apnea in a high-volume specialty practice with a strong focus on regional anesthesia: a database analysis. Reg. Anesth. Pain Med. 44(3), 303–308 (2019).
• Large study analyzing the impact of OSA on multiple perioperative complications.
15.
Cozowicz C, Poeran J, Zubizarreta N et al. Non-opioid analgesic modes of pain management are associated with reduced postoperative complications and resource utilisation: a retrospective study of obstructive sleep apnoea patients undergoing elective joint arthroplasty. Br. J. Anaesth. 122(1), 131–140 (2019).
16.
Khatib Y, Badge H, Xuan W, Naylor JM, Harris IA. Patient satisfaction and perception of success after total knee arthroplasty are more strongly associated with patient factors and complications than surgical or anaesthetic factors. Knee Surg. Sports Traumatol. Arthrosc. 28(10), 3156–3163 (2020).
17.
Harrison MM, Childs A, Carson PE. Incidence of undiagnosed sleep apnea in patients scheduled for elective total joint arthroplasty. J. Arthroplasty 18(8), 1044–1047 (2003).
18.
Kelleher DC, Lippell R, Lui B et al. Hospital safety-net burden is associated with increased inpatient mortality after elective total knee arthroplasty: a retrospective multistate review, 2007–2018. Reg. Anesth. Pain Med. 46(8), 663–670 (2021).
19.
Tangel VE, Matthews KC, Abramovitz SE, White RS. Racial and ethnic disparities in severe maternal morbidity and anesthetic techniques for obstetric deliveries: a multi-state analysis, 2007–2014. J. Clin. Anesth. 65, 109821 (2020).
20.
Vandenbroucke JP, Poole C, Schlesselman JJ, Egger M. Strengthening the Reporting of Observational Studies in Epidemiology (STROBE): explanation and elaboration. PLOS Med. 4(10), 27 (2007).
21.
Elixhauser A, Steiner C, Harris DR, Coffey RM. Comorbidity measures for use with administrative data. Med. Care 36(1), 8–27 (1998).
22.
Feng TR, White RS, Ma X, Askin G, Pryor KO. The effect of obstructive sleep apnea on readmissions and atrial fibrillation after cardiac surgery. J. Clin. Anesth. 56, 17–23 (2019).
23.
Scalzitti NJ, O'Connor PD, Nielsen SW et al. Obstructive sleep apnea is an independent risk factor for hospital readmission. J. Clin. Sleep Med. 14(05), 753–758 (2018).
24.
Gould D, Dowsey MM, Spelman T et al. Patient-related risk factors for unplanned 30-day hospital readmission following primary and revision total knee arthroplasty: a systematic review and meta-analysis. J. Clin. Med. 10(1), 134 (2021).
25.
Bovonratwet P, Shen TS, Ast MP, Mayman DJ, Haas SB, Su EP. Reasons and risk factors for 30-day readmission after outpatient total knee arthroplasty: a review of 3015 cases. J. Arthroplasty 35(9), 2451–2457 (2020).
26.
Mörwald EE, Olson A, Cozowicz C, Poeran J, Mazumdar M, Memtsoudis SG. Association of opioid prescription and perioperative complications in obstructive sleep apnea patients undergoing total joint arthroplasties. Sleep Breath 22(1), 115–121 (2018).
27.
Vendittoli P-A, Pellei K, Desmeules F et al. Enhanced recovery short-stay hip and knee joint replacement program improves patients outcomes while reducing hospital costs. Orthop. Traumatol. Surg. Res. 105(7), 1237–1243 (2019).
28.
Sibia US, Waite KA, Callanan MA, Park AE, King PJ, MacDonald JH. Do shorter lengths of stay increase readmissions after total joint replacements? Arthroplasty Today 3(1), 51–55 (2017).
29.
Golaz R, Tangel VE, Lui B, Albrecht E, Pryor KO, White RS. Post-operative outcomes and anesthesia type in total hip arthroplasty in patients with obstructive sleep apnea: a retrospective analysis of the State Inpatient Databases. J. Clin. Anesth. 69, 110159 (2021).
•• Similar study by the same authors analyzing perioperative outcomes in OSA patients undergoing total hip arthroplasty.
30.
Kelly MP, Prentice HA, Wang W, Fasig BH, Sheth DS, Paxton EW. Reasons for ninety-day emergency visits and readmissions after elective total joint arthroplasty: results from a US integrated healthcare system. J. Arthroplasty 33(7), 2075–2081 (2018).
31.
Huerfano E, Gonzalez Della Valle A, Shanaghan K, Girardi F, Memtsoudis S, Liu J. Characterization of re-admission and emergency department visits within 90 days following lower-extremity arthroplasty. HSS J. 14(3), 271–281 (2018).
32.
Otero JE, Gholson JJ, Pugely AJ, Gao Y, Bedard NA, Callaghan JJ. Length of hospitalization after joint arthroplasty: does early discharge affect complications and readmission rates? J. Arthroplasty 31(12), 2714–2725 (2016).
33.
Hai F, Porhomayon J, Vermont L, Frydrych L, Jaoude P, El-Solh AA. Postoperative complications in patients with obstructive sleep apnea: a meta-analysis. J. Clin. Anesth. 26(8), 591–600 (2014).
34.
Memtsoudis SG, Cozowicz C, Nagappa M et al. Society of anesthesia and sleep medicine guideline on intraoperative management of adult patients with obstructive sleep apnea. Anesth. Analg. 127(4), 967–987 (2018).
• Guidelines for intraoperative management of patients with OSA.
35.
Chung F, Memtsoudis SG, Ramachandran SK et al. Society of anesthesia and sleep medicine guidelines on preoperative screening and assessment of adult patients with obstructive sleep apnea. Anesth. Analg. 123(2), 452–473 (2016).
36.
Neuman MD, Feng R, Carson JL et al. Spinal anesthesia or general anesthesia for hip surgery in older adults. N. Engl. J. Med. 385(22), 2025–2035 (2021).
Information & Authors
Information
Published In
Pages: 1241 - 1251
PubMed: 36200444
Copyright
© 2022 Future Medicine Ltd.
History
Received: 2 August 2022
Accepted: 26 September 2022
Published online: 6 October 2022
Keywords:
Topics
Authors
Funding Information
Foundation for Anesthesia Education and Research: MRTG-08-15-2021-White (Robert)
Metrics & Citations
Metrics
Article Usage
Article usage data only available from February 2023. Historical article usage data, showing the number of article downloads, is available upon request.
Citations
How to Cite
Postoperative outcomes and anesthesia type in total knee arthroplasty in patients with obstructive sleep apnea. (2022) Journal of Comparative Effectiveness Research. DOI: 10.2217/cer-2022-0139
Export citation
Select the citation format you wish to export for this article or chapter.
Citing Literature
- Hahn Kang, Muhammad Hamza Ilyas, Isaiah A. Freeman, William T. Sampson, Carlo M. Mannina, Young-Min Kwon, Does Obstructive Sleep Apnea Affect Complications or Patient-Reported Outcomes Following Primary Total Knee Arthroplasty? A Propensity-Matched Analysis, The Journal of Arthroplasty, 10.1016/j.arth.2026.05.056, (2026).
- Erin Tracy, Cole Crandall, Ana Grajales, Anthony Plunkett, The perioperative implications of the patient with Obstructive Sleep Apnea (OSA) – a narrative review, Future Science OA, 10.1080/20565623.2025.2540744, 11, 1, (2025).
- Catherine Hand, Camden Bohn, Morgan Angotti, Henry Eilen, Matthew Varano, Brian Forsythe, Effects of obstructive sleep apnea on postoperative outcomes following total shoulder arthroplasty: A matched cohort analysis, Journal of Orthopaedics, 10.1016/j.jor.2025.04.009, 64, (163-168), (2025).
- Carol Xiaoshu Zhao, Kelvin Guoping Tan, Safety and efficacy of ambulatory total knee arthroplasty with enhanced recovery after surgery protocols in well-selected patients aged 80 years and older, Singapore Medical Journal, 10.4103/singaporemedj.SMJ-2024-157, (2025).
- Joseph E. Nassar, Manjot Singh, Ashley Knebel, Mohammad Daher, Daniel Alsoof, Bassel G. Diebo, Alan H. Daniels, The correlation of sleep disorders with postoperative outcomes in spine surgery: A narrative review, North American Spine Society Journal (NASSJ), 10.1016/j.xnsj.2025.100586, 21, (100586), (2025).
- Babar Junaidi, Andrew Hawrylak, Roop Kaw, Evaluation and Management of Perioperative Pulmonary Complications, Medical Clinics of North America, 10.1016/j.mcna.2024.04.003, 108, 6, (1087-1100), (2024).
- Zoran Stamenković, Lidija Ristić, Anesthesiological risk in obstructive sleep apnea patients, AFMN Biomedicine, 10.5937/afmnai40-42892, 40, 4, (389-401), (2022).