Impact of clinical pathways on treatment patterns and outcomes for patients with non-small-cell lung cancer: real-world evidence from a community oncology practice
Publication: Journal of Comparative Effectiveness Research
Abstract
Introduction: The evolving treatment landscape for non-small-cell lung cancer (NSCLC) and complexities of regulations and reimbursement present challenges to community oncologists. Clinical pathways are tools to optimize care, but information on their value in the real world is limited. This retrospective study assessed treatment patterns and clinical outcomes in patients with stage I–III NSCLC pre- and post-pathways implementation at Tennessee Oncology, a large, community-based oncology practice in the USA. Methods & Materials: Chart data were abstracted for adults diagnosed with stage I–III NSCLC who received systemic treatment. Patients were divided into pre-pathways (treatment initiation 2014–2015) and post-pathways (treatment initiation 2016–2018) cohorts. Patient characteristics, treatment patterns and outcomes were summarized descriptively. Kaplan–Meier curves were used to assess time-dependent outcomes, and log-rank test was used to compare the cohorts. Results: 291 patients were included (stage I–II: 38 pre-pathways, 55 post-pathways; stage III: 105 pre-pathways, 93 post-pathways). Duration on first-line (1L) therapy was similar for stage I–II patients pre- and post-pathways (median 1.9 months vs 2.1 months; p = 0.75), but increased for stage III patients post-pathways (2.1 months vs 1.4 months pre-pathways; p < 0.01). Achievement of a complete or partial response with 1L therapy was similar post-pathways among stage I–stage –IIII patients (60.0% vs 55.2% pre-pathways), but increased for stage III patients (56.0% vs 35.2% pre-pathways). Conclusion: Given that improvements in rates of treatment response post-pathways occurred only for patients diagnosed with stage III NSCLC, among whom immunotherapy uptake increased post-pathways, such improvements may be attributable to evolving practices in cancer care, including advances in treatment and care delivery, rather than clinical pathways implementation. Further research is warranted to assess the impact of clinical pathways in the current treatment era, given that immunotherapy has now become the standard of care in NSCLC.
Lung cancer is among the most prominent cancers in the USA, representing an estimated 12% of new cancer cases and 22% of cancer-related deaths in 2021 [1], and it is the leading cause of cancer death among both men and women [2]. The vast majority of patients are diagnosed with non-small-cell lung cancer (NSCLC), which accounts for 84% of all lung cancers [2]. Five-year survival rates for NSCLC vary from approximately 63% for localized disease to 7% in cases with distant metastases [3].
The heterogeneous presentation of NSCLC, evolving treatment landscape, escalating costs and regulation and reimbursement complexities in the USA present a challenge to community oncologists striving to provide optimal patient care [4–6]. Clinical guidelines have evolved to reflect the variety and complexity of NSCLC and its therapeutic options [7–9]. In addition, clinical pathways tools represent a potentially valuable resource to guide evidence-based decisions across the spectrum of disease (e.g. cancer type, stage, and molecular subtype) [10,11].
The Oncology Care Model (OCM) – an episode-based delivery and payment system developed by the Center for Medicare & Medicaid Innovation (CMMI) – was launched on 1 July 2016 to redefine cancer care delivery by tying reimbursements to high-quality, cost-effective, and personalized care through a performance-based payment system [12,13]. As part of this patient-centered care model, oncology practices participating in the OCM are obligated to document a comprehensive, coordinated care plan (e.g. via clinical pathways) based on the Institute of Medicine guidance [13,14].
Evidence on the value of clinical pathways in NSCLC is currently limited [15], but some studies point to increased early-stage diagnosis and to reduced variation in clinical practice with the use of pathways [16–18]. Furthermore, clinical pathways appear to support reductions in the costs of cancer care while maintaining or improving outcomes [10,19–23]. The use of clinical pathways brings challenges, however, including an increased administrative burden for physicians [19] and patient concerns about the diagnostic ability of physicians who use decision support tools and interference with patient–physician communication [24].
To add to the limited information characterizing the use of clinical pathways for NSCLC in a real-world clinical setting, the aim of the current study was to measure treatment patterns and sequences and clinical outcomes in patients diagnosed with stage I–III NSCLC before and after the implementation of a clinical pathways tool as part of the OCM within Tennessee (TN) Oncology, one of the largest community-based cancer practices in the USA. TN Oncology provides cancer care and clinical trials at over 30 locations throughout Tennessee.
Methods & materials
Data source
This was a retrospective study using chart data abstracted from TN Oncology clinics for patients with NSCLC who initiated treatment before and after the implementation of the Via Pathways clinical pathways tool in 2016. A case report form was used to collect detailed information from eligible patients' medical charts from treatment initiation to death or last contact with TN Oncology. The overall study period was from 1 July 2014 to 30 September 2018. Data collection occurred between 15 April and 11 October 2019.
Study population & design
Patients (≥18 years) with a documented diagnosis of stage I–III NSCLC who had received first-line (1L) systemic treatment for NSCLC at one of eight TN Oncology clinics were included in this study (stage IV patients were also evaluated but these data are not presented here). Eligible patients were required to have information available on NSCLC stage at diagnosis, date of treatment initiation, treatment received and progression or response on treatment. Patients diagnosed with small-cell lung cancer, who had primary tumors aside from NSCLC, or who had received 1L systemic treatment for NSCLC at any other location were excluded.
Implementation of the clinical pathway tool occurred between 6 June 2016 and 20 July 2016 across the clinic sites. Patients were enrolled into either a pre-pathways cohort or post-pathways cohort based on when systemic therapy for NSCLC was initiated. Treatment in the pre-pathways cohort was initiated between 1 July 2014 and 31 December 2015, and the post-pathways cohort between 1 October 2016 and 31 March 2018.
The index date was the date of 1L systemic treatment received for NSCLC. Patients were required to have had continuous data collected during a minimum 6-month follow-up period after the index date; those who died within 6 months of index were also included in the analysis, and their follow-up period was truncated at the date of death. Overall follow-up occurred until death, the date of last contact with TN Oncology, a censor date of 31 May 2016 (before clinical pathways implementation) for the pre-pathways cohort, or the date of data collection for the post-pathways cohort.
Outcomes & measures
Baseline demographic and clinical characteristics were measured at index, except for NSCLC stage, which was established at diagnosis, and type of healthcare coverage, which was measured during data collection.
Treatment patterns and sequences were analyzed over the follow-up period and included the duration of 1L and second-line (2L) systemic therapy regimens, time from the end of the 1L regimen to the start of 2L therapy, and the most common treatment sequences from 1L to 2L.
Progression-free survival (PFS), overall survival (OS), best response, and the incidence of adverse events (AEs) were measured over the follow-up period. Severe AEs were defined as involving at least one hospitalization or emergency room visit.
All outcomes were evaluated and compared between the pre-pathways and post-pathways cohorts. Analyses based on NSCLC disease stage at diagnosis (stage I–II and stage III) are presented.
Statistical analyses
Descriptive analyses were conducted for patient characteristics, treatment patterns and sequences, clinical outcomes and AEs. Continuous variables were described with mean, standard deviation, and median values, and compared across cohorts using Wilcoxon rank-sum tests. Categorical variables were described by frequency and proportion and were compared across cohorts using chi-squared tests or, when expected counts were <10, Fisher's exact tests. Kaplan–Meier analyses were used to assess PFS, OS, duration of 1L/2L therapy, and time from the end of 1L therapy to 2L therapy initiation, and a log-rank test was used to compare the two cohorts. Landmark analysis was conducted for all time-to-event outcomes.
Results
A total of 291 patients diagnosed with stage I–II or stage III NSCLC were included in the study. Among stage I–II patients (n = 93), 38 were in the pre-pathways cohort and 55 in the post-pathways cohort; among stage III patients (n = 198), 105 were in the pre-pathways cohort and 93 in the post-pathways cohort.
Patient characteristics
Baseline characteristics were similar in the two cohorts for both stage I–II and stage III patients (Table 1). More than 90% of patients with either stage I–II and stage III NSCLC had adenocarcinoma or squamous cell histological types. The majority of patients with stage I–III disease had a diagnosis of locally advanced NSCLC (stage III: 68.0%). Mortality status among stage I–II patients was unknown for 5.3% of patients in the pre-pathways cohort and 0% of patients post-pathways, and among stage III patients was unknown for 5.7% pre-pathways and 2.2% post-pathways.
| All stage I–II patients (n = 93) | Pre-pathways (n = 38) | Post-pathways (n = 55) | p-value† | All stage III patients (n = 198) | Pre-pathways (n = 105) | Post-pathways (n = 93) | p-value† | |
|---|---|---|---|---|---|---|---|---|
| Age (years) | ||||||||
| Mean ± SD | 68.1 ± 9.0 | 67.7 ± 9.6 | 68.4 ± 8.7 | 0.8912 | 67.0 ± 9.1 | 66.6 ± 9.5 | 67.5 ± 8.6 | 0.5778 |
| Female, n (%) | 38 (40.9%) | 12 (31.6%) | 26 (47.3%) | 0.1940 | 91 (46.0%) | 47 (44.8%) | 44 (47.3%) | 0.8286 |
| Race,‡ n (%) | ||||||||
| Caucasian | 78 (83.9%) | 32 (84.2%) | 46 (83.6%) | 1.0000 | 172 (86.9%) | 95 (90.5%) | 77 (82.8%) | 0.1657 |
| Black | 13 (14.0%) | 5 (13.2%) | 8 (14.5%) | 1.0000 | 25 (12.6%) | 9 (8.6%) | 16 (17.2%) | 0.0865 |
| Other/Unknown | 2 (2.2%) | 1 (2.6%) | 1 (1.8%) | – | 1 (0.5%) | 1 (1.0%) | 0 (0.0%) | 1.0000 |
| Type of healthcare coverage,§ n (%) | ||||||||
| Commercial/private | 25 (26.9%) | 7 (18.4%) | 18 (32.7%) | 0.1568 | 49 (24.7%) | 19 (18.1%) | 30 (32.3%) | <0.05 |
| Medicare | 64 (68.8%) | 28 (73.7%) | 36 (65.5%) | 0.5389 | 132 (66.7%) | 74 (70.5%) | 58 (62.4%) | 0.2904 |
| Medicaid | 12 (12.9%) | 7 (18.4%) | 5 (9.1%) | 0.2189 | 28 (14.1%) | 10 (9.5%) | 18 (19.4%) | 0.0756 |
| Other/Unknown | 4 (4.4%) | 3 (7.8%) | 1 (1.8%) | – | 13 (6.5%) | 9 (8.6%) | 4 (4.4%) | – |
| Tobacco use, n (%) | 0.9450 | 0.5589 | ||||||
| Current smoker | 23 (24.7%) | 10 (26.3%) | 13 (23.6%) | 59 (29.8%) | 31 (29.5%) | 28 (30.1%) | ||
| Former smoker | 67 (72.0%) | 27 (71.1%) | 40 (72.7%) | 128 (64.6%) | 70 (66.7%) | 58 (62.4%) | ||
| Never smoked | 1 (1.1%) | 0 (0.0%) | 1 (1.8%) | 11 (5.6%) | 4 (3.8%) | 7 (7.5%) | ||
| Unknown | 2 (2.2%) | 1 (2.6%) | 1 (1.8%) | – | – | – | ||
| NSCLC stage at diagnosis, n (%) | 0.5389 | – | ||||||
| stage I | 29 (31.2%) | 10 (26.3%) | 19 (34.5%) | – | – | – | ||
| stage II | 64 (68.8%) | 28 (73.7%) | 36 (65.5%) | – | – | – | ||
| stage III | – | – | – | 198 (100.0%) | 105 (100.0%) | 93 (100.0%) | ||
| Histological type, n (%) | 0.2987 | 0.1595 | ||||||
| Non-squamous cell: Adenocarcinoma | 38 (40.9%) | 12 (31.6%) | 26 (47.3%) | 87 (43.9%) | 41 (39.0%) | 46 (49.5%) | ||
| Non-squamous cell: Large-cell carcinoma | 3 (3.2%) | 2 (5.3%) | 1 (1.8%) | 1 (0.5%) | 1 (1.0%) | 0 (0.0%) | ||
| Non-squamous cell: Other¶ | 1 (1.1%) | 1 (2.6%) | 0 (0.0%) | 0 (0.0%) | 0 (0.0%) | 0 (0.0%) | ||
| Squamous cell | 46 (49.5%) | 22 (57.9%) | 24 (43.6%) | 102 (51.5%) | 61 (58.1%) | 41 (44.1%) | ||
| Adenosquamous | 4 (4.3%) | 1 (2.6%) | 3 (5.5%) | 1 (0.5%) | 0 (0.0%) | 1 (1.1%) | ||
| Other | 1 (1.1%) | 0 (0.0%) | 1 (1.8%) | 3 (1.5%) | 1 (1.0%) | 2 (2.2%) | ||
| Unknown | 0 (0.0%) | 0 (0.0%) | 0 (0.0%) | 4 (2.0%) | 1 (1.0%) | 3 (3.2%) | ||
†
Statistical comparisons between cohorts were performed using log-rank tests for continuous variables and chi-squared tests for categorical variables. For categorical variables with expected counts less than 10, Fisher's exact tests were used instead of chi-squared tests.
‡
Patients may have identified with more than race. The “other” category includes Asian, Native American, Pacific Islander, other, and unknown race.
§
Patients may have had more than one healthcare coverage type. The “other” category includes military insurance, other insurance, no insurance, or unknown.
¶
Other non-squamous cell histological types included epithelioid appearance, adenocarcinoma, and large cell neuroendocrine carcinoma Other histological types included carcinoid, large cell with squamous features, neuroendocrine, poorly differentiated, sarcomatoid, and spindle cell.
NSCLC: Non-small-cell lung cancer; SD: Standard deviation.
Treatment patterns & sequences
More treatment types were used among post-pathways patients than pre-pathways patients, although no statistical analyses were conducted to interrogate this difference. Chemotherapy, as monotherapy or as combinations of chemotherapy, comprised almost all 1L systemic therapy used for patients pre-pathways (stage I–II: 100.0%; stage III: 96.2%), and remained the most common treatment type across both disease-stage groups post-pathways (stage I–II: 89.1%; stage III: 72.0%) (Table 2). Use of 1L immunotherapy, either as monotherapy or in combination with another therapy, increased from 0.0% in the pre-pathways cohort for both disease-stage groups to 7.3% and 26.9% post-pathways for stage I–II and stage III patients, respectively.
| Treatment sequences†,‡ | |||||||
|---|---|---|---|---|---|---|---|
| stage I–II Pre-pathways | n = 38 | Post-pathways | n = 55 | ||||
| 1L systemic therapy, n (%) | 1L systemic therapy, n (%) | ||||||
| Chemotherapy only | 38 (100.0%) | Chemotherapy only | 49 (89.1%) | ||||
| Immune checkpoint inhibitor (combination) | 3 (5.5%) | ||||||
| Immune checkpoint inhibitor (monotherapy) | 1 (1.8%) | ||||||
| Investigational | 1 (1.8%) | ||||||
| Targeted therapy | 1 (1.8%) | ||||||
| 2L systemic therapy, n (%) | 2L systemic therapy, n (%) | ||||||
| None | 28 (73.7%) | None | 46 (83.6%) | ||||
| Immune checkpoint inhibitor (monotherapy) | 5 (13.2%) | Immune checkpoint inhibitor (monotherapy) | 4 (7.3%) | ||||
| Chemotherapy only | 4 (10.5%) | Immune checkpoint inhibitor (combination) | 3 (5.5%) | ||||
| Investigational | 1 (2.6%) | Chemotherapy only | 1 (1.8%) | ||||
| Investigational | 1 (1.8%) | ||||||
| stage III Pre-pathways | n = 105 | Post-pathways | n = 93 | ||||
| 1L systemic therapy, n (%) | 1L systemic therapy, n (%) | ||||||
| Chemotherapy only | 101 (96.2%) | Chemotherapy only | 67 (72.0%) | ||||
| Investigational | 2 (1.9%) | Immune checkpoint inhibitor (combination) | 19 (20.4%) | ||||
| Targeted therapy | 2 (1.9%) | Immune checkpoint inhibitor (monotherapy) | 6 (6.5%) | ||||
| Targeted therapy | 1 (1.1%) | ||||||
| 2L systemic therapy, n (%) | 2L systemic therapy, n (%) | ||||||
| None | 67 (63.8%) | None | 56 (60.2%) | ||||
| Investigational | 13 (12.4%) | Immune checkpoint inhibitor (monotherapy) | 21 (22.6%) | ||||
| Chemotherapy only | 12 (11.4%) | Chemotherapy only | 10 (10.8%) | ||||
| Immune checkpoint inhibitor (monotherapy) | 11 (10.5%) | Immune checkpoint inhibitor (combination) | 2 (2.2%) | ||||
| Targeted therapy | 2 (1.9%) | Investigational | 2 (2.2%) | ||||
| Targeted therapy | 2 (2.2%) | ||||||
| Duration of 1L systemic therapy§,¶ | |||||||
|---|---|---|---|---|---|---|---|
| Total patients, n | Patients with events, n | Median time to event, months (95% CI) | Rate at month 3 | Rate at month 6 | Rate at month 12 | p-value# | |
| stage I–II | 93 | 92 | 2.1 (1.6, 2.1) | 15.2% | 6.5% | 1.1% | 0.7514 |
| Pre-pathways | 38 | 38 | 1.9 (1.2, 2.1) | 21.1% | 7.9% | – | |
| Post-pathways | 55 | 54 | 2.1 (1.9, 2.1) | 11.1% | 5.6% | 1.9% | |
| stage III | 198 | 194 | 1.6 (1.4, 2.1) | 24.7% | 13.1% | 7.5% | <0.01 |
| Pre-pathways | 105 | 103 | 1.4 (1.4, 1.7) | 18.1% | 3.8% | 2.9% | |
| Post-pathways | 93 | 91 | 2.1 (1.5, 2.3) | 32.3% | 23.7% | 12.9% | |
| Time to treatment change after end of 1L systemic therapy††,‡‡ | |||||||
|---|---|---|---|---|---|---|---|
| Total patients, n | Patients with events, n | Median time to event, months (95% CI)§§ | Rate at month 3 | Rate at month 6 | Rate at month 12 | p-value# | |
| stage I–II | 92 | 19 | – | 11.6% | 15.6% | 22.3% | 0.0861 |
| Pre-pathways | 38 | 10 | – | 19.0% | 25.7% | 30.0% | |
| Post-pathways | 54 | 9 | – | 6.1% | 8.3% | 15.9% | |
| stage III | 194 | 75 | 16.7 (12.4, –) | 20.0% | 27.1% | 41.7% | 0.6036 |
| Pre-pathways | 103 | 38 | 17.5 (9.2, –) | 21.9% | 30.4% | 43.6% | |
| Post-pathways | 91 | 37 | 16.7 (11.0, –) | 17.8% | 23.4% | 39.8% | |
†
Treatment regimens for 1L and 2L systemic therapies were classified into the following mutually exclusive groups: chemotherapy only: monotherapy or combinations where only chemotherapy was used; immune checkpoint inhibitor (monotherapy); immune checkpoint inhibitor (combination): in combination with targeted therapy, chemotherapy, or both; targeted therapy (monotherapy or combination): in combination with chemotherapy; investigational: any regimens including investigational drugs; none: no treatment regimens.
‡
Sequences from 1L to 2L systemic therapy regimens were reported among all patients. In the pre-pathways cohort, 2L treatments initiated after May 31, 2016, the day before clinical pathway implementation, were not included. The ‘none’ category includes patients who were not observed to go onto 2L. This could include those who stayed on 1L for the whole study period, died while on 1L, were on hold for 1L, or who ended 1L but were not observed to start another treatment line.
§
Duration of 1L systemic therapy was reported among all patients.
¶
Duration of 1L systemic therapy was measured from 1L systemic therapy initiation (index date) to end of 1L systemic therapy (event). Patients were censored at the earliest of end of follow-up (i.e. date of death, last visit date) or, if in the pre-pathways cohort, censor date (May 31, 2016).
#
Statistical comparisons between cohorts were performed using log-rank tests. For categorical variables with expected counts less than 10, Fisher's exact tests were used instead of chi-squared tests.
††
Time to treatment change after the end of 1L systemic therapy was reported among all patients who completed 1L therapy, including patients who continued to 2L systemic therapy and those who did not start a 2L systemic treatment.
‡‡
Time to treatment change after the end of 1L systemic therapy was measured from the end of 1L systemic therapy to 2L systemic therapy initiation (event). Patients were censored at the earliest of end of follow-up (i.e., date of death, last visit date) or, if in the pre-pathways cohort, censor date (May 31, 2016).
§§
Median time to event was not reported for stage I–II patients because fewer than 50% of all patients who completed 1L systemic therapy experienced a treatment change.
1L: First-line; 2L: Second-line; CI: Confidence interval.
For 2L therapy among stage I–II patients, use of chemotherapy decreased post-pathways (1.8% vs 10.5% pre-pathways), while use of immunotherapy remained similar post-pathways (12.8% vs 13.2% pre-pathways); more post-pathways patients remained on 1L therapy, or ended 1L and were not observed to start 2L during the study period (83.6% vs. 73.7% pre-pathways). Among stage III patients, use of chemotherapy as 2L therapy remained similar post-pathways (10.8% vs. 11.4% pre-pathways), while use of immunotherapy increased post-pathways (24.8% vs. 10.5% pre-pathways); a similar proportion of patients across cohorts remained on 1L therapy (60.2% post-pathways vs. 63.8% pre-pathways).
Duration on 1L therapy was similar for stage I–II patients pre- and post-pathways (median 1.9 months vs 2.1 months; p = 0.75), but increased for stage III patients post-pathways (median 2.1 months vs 1.4 months pre-pathways; p < 0.01) (Table 2). Duration on 2L therapy was numerically reduced post-pathways for stage I–II patients (median 4.4 months vs 4.9 months pre-pathways; p = 0.70) and was similar for stage III patients (median 3.5 months vs 3.7 months pre-pathways; p = 0.74).
After completing 1L systemic therapy, the time to treatment change across both patients who continued to 2L systemic therapy and those who did not start a 2L systemic treatment was similar between pre-pathways and post-pathways cohorts for stage III patients (median 16.7 months vs 17.5 months pre-pathways; p = 0.60; median not reached for stage I–II patients) (Table 2).
Clinical outcomes
Overall, clinical outcomes were numerically improved or similar post-pathways and did not differ significantly from the pre-pathways cohorts for either stage I–II or stage III patients (Table 3). Among stage I–II patients, median PFS and OS were numerically longer in the post-pathways cohort (PFS: 25.6 months vs 13.6 months pre-pathways; p = 0.14; OS: 25.6 months vs 20.0 months pre-pathways; p = 0.80; Figure 1). For stage III patients, median PFS was similar in the post-pathways cohort (14.1 months vs 13.1 months pre-pathways; p = 0.82) and median OS was numerically longer (26.4 months vs 20.0 months pre-pathways; p = 0.07).
| Total patients, n | Patients with events, n | Median time to event (months), n (95% CI) | Rate at month 3 | Rate at month 6 | Rate at month 12 | p-value† | |
|---|---|---|---|---|---|---|---|
| Progression-free survival‡ | |||||||
| stage I–II | 93 | 46 | 17.4 (13.6, –) | 90.3% | 77.4% | 61.3% | 0.1414 |
| Pre-pathways | 38 | 19 | 13.6 (9.5, –) | 89.5% | 73.7% | 54.0% | |
| Post-pathways | 55 | 27 | 25.6 (16.9, –) | 90.9% | 80.0% | 65.5% | |
| stage III | 198 | 105 | 13.8 (12.0, 17.3) | 89.9% | 77.7% | 56.8% | 0.8209 |
| Pre-pathways | 105 | 49 | 13.1 (11.0, –) | 91.4% | 77.9% | 53.1% | |
| Post-pathways | 93 | 56 | 14.1 (12.7, 19.9) | 88.2% | 77.4% | 59.9% | |
| Overall survival§ | |||||||
| stage I–II | 93 | 34 | 25.6 (20.0, –) | 93.5% | 88.2% | 77.8% | 0.8007 |
| Pre-pathways | 38 | 10 | 20.0 (15.8, –) | 97.4% | 92.1% | 85.9% | |
| Post-pathways | 55 | 24 | 25.6 (19.8, –) | 90.9% | 85.5% | 72.7% | |
| stage III | 198 | 75 | 25.8 (20.9, –) | 92.4% | 85.3% | 75.3% | 0.0668 |
| Pre-pathways | 105 | 37 | 20.0 (16.5, –) | 94.3% | 86.6% | 69.2% | |
| Post-pathways | 93 | 38 | 26.4 (25.3, –) | 90.3% | 83.9% | 79.5% | |
†
Statistical comparisons between cohorts were performed using Wilcoxon rank-sum tests for continuous variables and chi-squared tests for categorical variables. For categorical variables with expected counts less than 10, Fisher's exact tests were used instead of chi-squared tests.
‡
Progression-free survival was reported among all patients, and it was measured from first-line systemic therapy initiation (index date) to the earliest of date of progression (event) or date of death (event). Patients who did not die were censored at the last visit date. Additionally, patients in the pre-pathways cohort were not followed beyond May 31, 2016 (censor date), before clinical pathway implementation.
§
Overall survival was reported among all patients, and was measured from first-line systemic therapy initiation (index date) to date of death (event). Patients who did not die were censored at the last visit date. Additionally, patients in the pre-pathways cohort were not followed beyond May 31, 2016 (censor date), before clinical pathway implementation.
CI: Confidence interval.
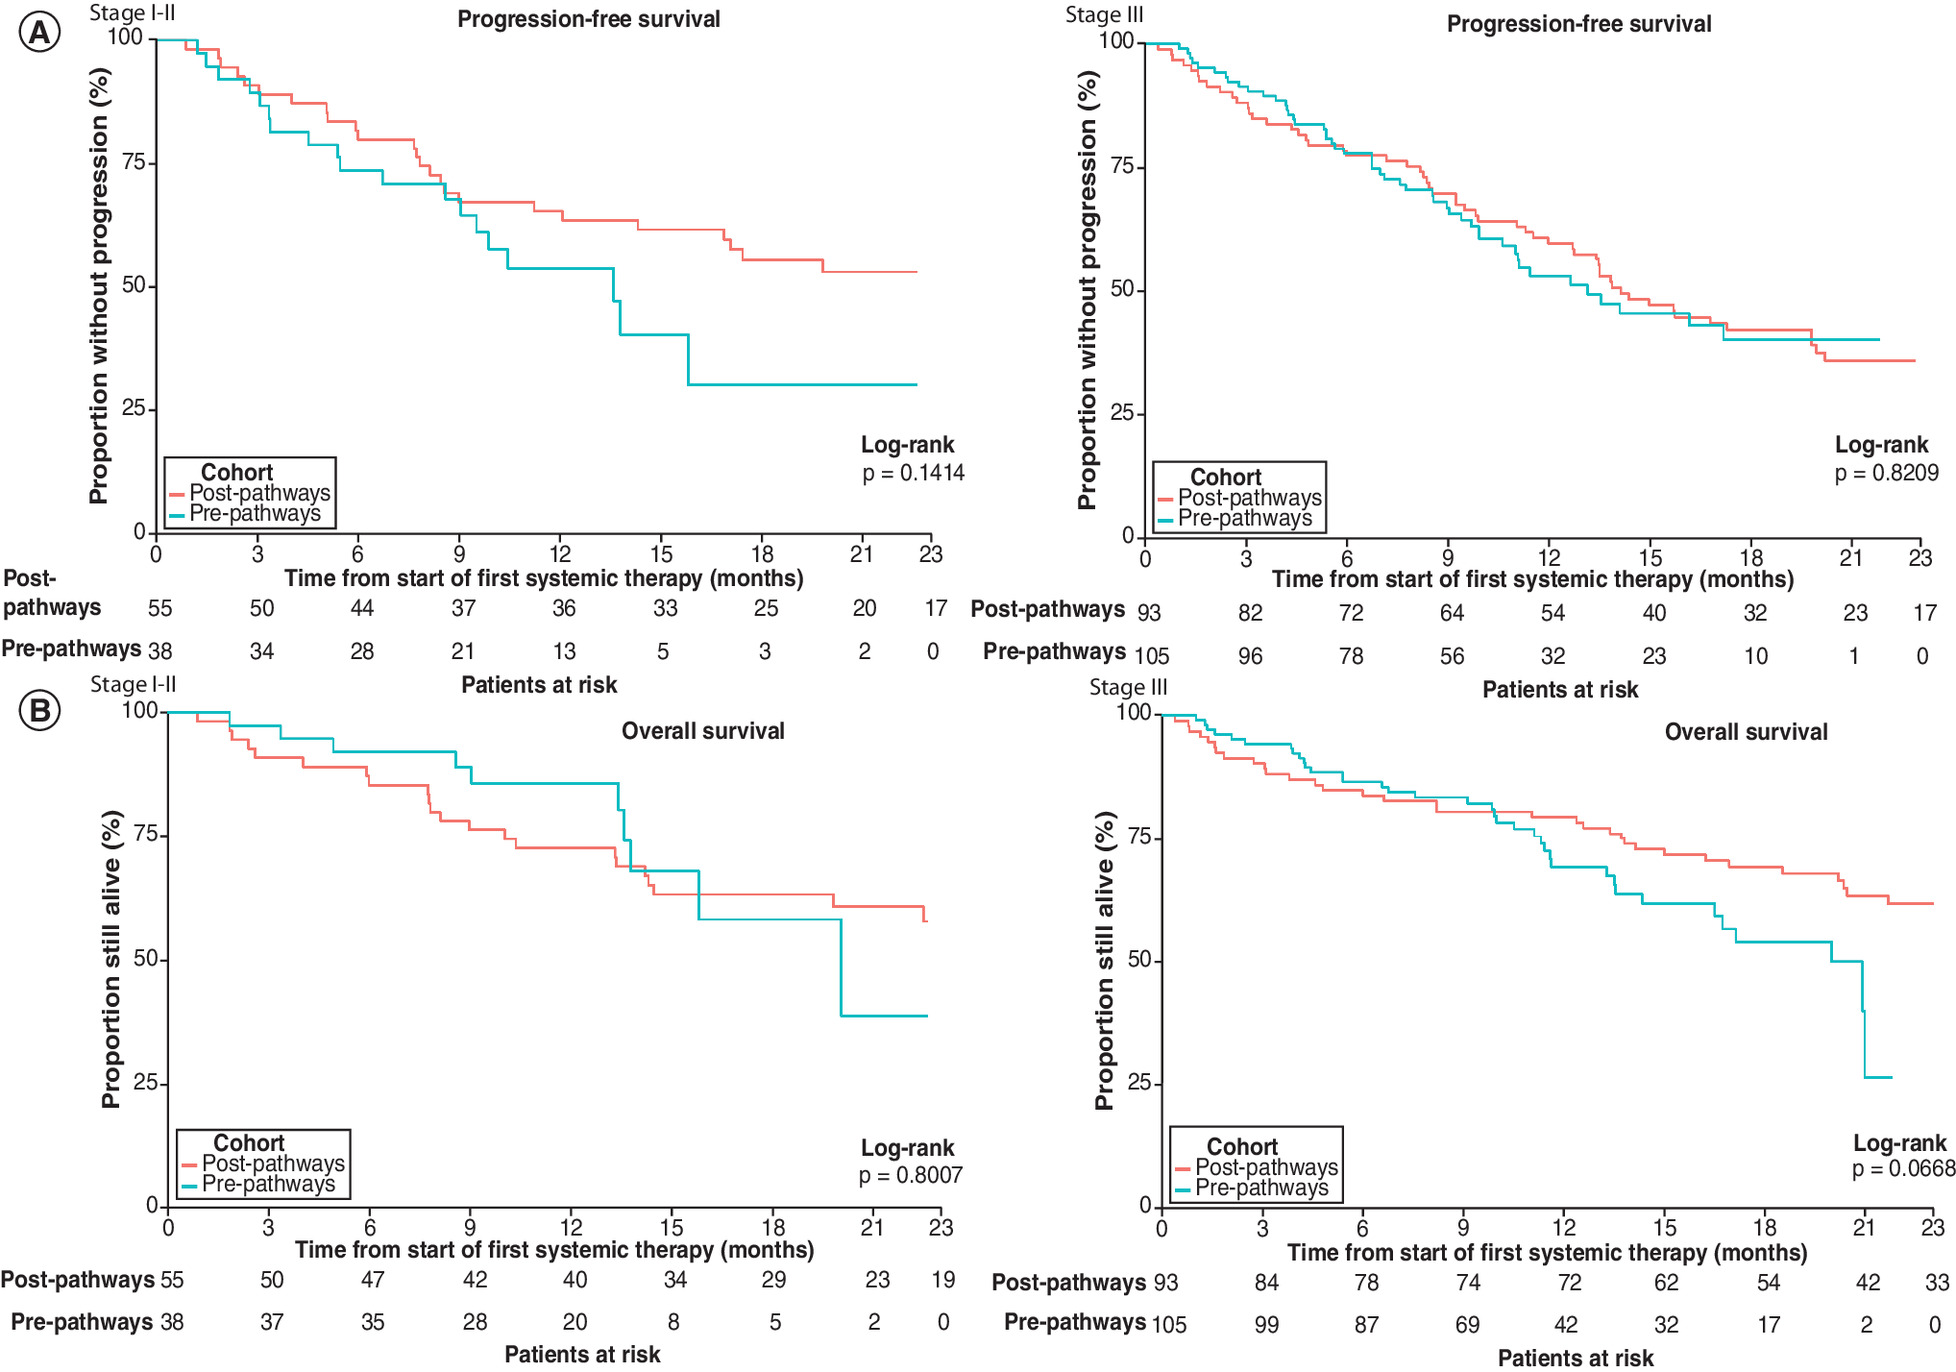
Figure 1. Kaplan–Meier curves of progression-free survival and overall survival.
Shaded areas around curves represent 95% confidence intervals. Kaplan–Meier curves were truncated at 23 months, the maximum observation period for patients in the pre-pathways cohort. (A) Progression-free survival was reported among all patients, and was measured from first-line systemic therapy initiation (index date) to the earliest of date of progression (event) or date of death (event). Patients who did not die were censored at the last visit date. Additionally, patients in the pre-pathways cohort were not followed beyond 31 May 2016 (censor date), before clinical pathway implementation. (B) Overall survival was reported among all patients, and was measured from first-line systemic therapy initiation (index date) to date of death (event). Patients who did not die were censored at the last visit date. Additionally, patients in the pre-pathways cohort were not followed beyond 31 May 2016 (censor date), before clinical pathway implementation.
Achievement of a complete or partial response among stage I–II patients was similar in the post-pathways cohort with 1L therapy (60.0% vs 55.2% pre-pathways) and increased with 2L therapy (22.2% vs 10.0% pre-pathways). For stage III patients, achievement of a complete or partial response was increased in the post-pathways cohort with both 1L therapy (56.0% vs 35.2% pre-pathways) and 2L therapy (18.9% vs 7.9% pre-pathways).
Severe AEs
Despite a greater variety of treatments received post-pathways, rates of severe AEs were similar overall between cohorts during 1L therapy (stage I–II: 12.7% vs 7.9% pre-pathways; p = 0.52; stage III: 12.9% vs 12.4%; p = 1.0), as well as during 2L (stage I–II: 22.2% vs 10.0%; p = 0.58; stage III: 10.8% vs 7.9%; p = 0.71).
AEs occurring at higher rates in the post-pathways cohort during 1L therapy included asthenia (stage I–II: 81.8% vs 47.4% pre-pathways; p < 0.01; stage III: 81.7% vs 56.2%; p < 0.001) and peripheral edema (stage I–II: 12.7% vs 0.0% pre-pathways; p < 0.05; stage III: 12.9% vs 2.9%; p < 0.05). However, no severe AEs occurred more frequently post-pathways for either disease-stage group.
Discussion
Between the pre-pathways and post-pathways periods, treatment regimens and sequences for patients diagnosed with stage I–II NSCLC remained similar but underwent some changes for patients with stage III disease. Chemotherapy was used almost exclusively as 1L systemic therapy for all patients pre-pathways and remained the most common 1L therapy post-pathways for both stage I–II and stage III patients. However, the use of 1L immunotherapy in stage III patients increased from 0.0% pre-pathways to 26.9% post-pathways, possibly reflecting the approval of these treatments for advanced NSCLC during the post-pathways period. Median duration of 1L therapy was also longer post-pathways in stage III patients (2.1 months vs 1.4 months pre-pathways; p < 0.01) but did not differ among stage I–II patients (p = 0.75).
Among stage I–II patients, for whom immunotherapy as 1L treatment was not part of standard practice during either cohort period, clinical outcomes did not change significantly following the implementation of clinical pathways. Median PFS and OS were also similar between cohort periods for stage III patients. However, more patients diagnosed with stage III disease achieved a complete or partial response during the post-pathways period with both 1L therapy (56.0% vs 35.2% pre-pathways) and 2L therapy (18.9% vs 7.9% pre-pathways).
Given the known greater effectiveness of newer, less toxic therapies such as immunotherapy [7,9,25], the ability of patients with stage III NSCLC, but not stage I–II disease, to continue on 1L therapy for a longer duration may reflect the increased uptake of immunotherapy among patients with advanced disease. The achievement of better responses to systemic therapy among stage III patients in the post-pathways cohort is also unsurprising, given the availability of these improved therapies.
Several studies are consistent with our findings for clinical outcomes. Jackman et al. compared pre- and post-pathways periods for patients diagnosed and treated for stage IV NSCLC at the Dana-Farber Cancer Institute before (2012) and after (2014) implementation of a proprietary pathways tool [22]. The recent dramatic shift in treatment options for NSCLC had not yet occurred at the time of this study, and therefore the influence of newer therapeutic modalities was unlikely to have affected the observed clinical outcomes. As in the current study, median OS in patients with NSCLC did not improve post-pathways [22]. A recent systematic review of cohort studies evaluating the introduction of computerized clinical decision support systems (including clinical pathways) from 2000–2019 across multiple cancer types, including lung cancer, also reported no significant differences in clinical outcomes after the introduction of such tools, although there were improvements in process outcomes and guideline adherence [26]. While clinical pathways may yield various benefits for clinical practice and associated cost savings [15,22,26], these studies are consistent with our finding that they do not necessarily confer improved clinical outcomes.
At the time of initiation of this study in 2014, immunotherapy regimens remained under clinical development for NSCLC, and the outcomes were not yet known. However, pathways implementation at TN Oncology in June–July 2016 coincided with the US Food and Drug Administration (FDA) approval of immunotherapy drugs for metastatic disease: 2L approval of nivolumab in March 2015, atezolizumab in October 2016, and durvalumab in February 2018; and 1L approval of pembrolizumab in October 2016. The influence of pathways on changes in treatment patterns and sequences and clinical outcomes could not be adequately ascertained in patients with stage IV disease, for whom immunotherapy became approved and rapidly adopted as a standard therapy during the post-pathways period. Thus, in this study we focused on patients with stage I–III disease. Previous evidence indicates that immunotherapy use likely corresponds to FDA drug approval: the use of approved immunotherapies in lung cancer episodes of care increased from <2% between 2014 and 2015 to ≥30% between 2016 and 2017, regardless of whether a practice participated in the OCM [14].
This study was conducted with Via Pathways (now ClinicalPath), a provider-facing, outsourced pathways tool that complies with the American Society for Clinical Oncology (ASCO) criteria for high-quality oncology pathway programs [10,19,20]. Treatment recommendations are prioritized based on efficacy, toxicity, and cost by a nationwide committee of practicing oncologists. The pathways tool is revised on an ongoing basis to reflect the latest evidence-based recommendations for value-based care and has continued to evolve since the time of this study. Given that the standard of care for NSCLC has shifted dramatically in recent years, with increased treatment choices, substantially higher costs for newer treatment modalities, and greater recognition of the value of companion diagnostics [27], further research would be beneficial to determine the value that pathways provide to clinical practice decision-making in this era of immunotherapy and targeted therapy and precision medicine, and to help guide how such pathways can continue to improve.
Although our results demonstrate changes in treatment patterns, sequences and outcomes between the two time periods, we do not believe that pathways substantially influenced treatment decision-making in this study of patients diagnosed with stage I–III NSCLC. Rather, changes in practice patterns were likely to be based on the influence of drug approvals for advanced disease and required companion diagnostics that coincided with the post-pathways period, as demonstrated by improvements in outcomes observed in patients with stage III NSCLC, but not stage I–II disease.
Study limitations
This was a retrospective study using real-world data; cohorts were not randomly assigned, which could introduce selection bias. As a result of the quasi-experimental design, this study was unable to separate the impact of clinical pathways implementation from other changes that occurred during the same time period, such as innovations in NSCLC treatment with the introduction of new therapies and practice care delivery initiatives. Given that clinical pathways were implemented across all TN Oncology practices within a short period (June–July 2016), it was not possible to compare the presence or absence of pathways during the same time period within the same practice network.
The timing of this study coincided with a major shift in treatment for NSCLC in the post-pathways period following the approval and uptake of immunotherapy regimens for late-stage disease. While this study was designed to compare pre- and post-pathways periods across all NSCLC disease stages, reported results have been limited to patients with stage I–III disease, for whom immunotherapy did not become a predominant treatment option in the post-pathways period and was less likely to influence the observed results.
At the time of this study, genomic profile data were not a requirement of the clinical pathways tool and were largely unknown for patients in both the pre- and post-pathways periods; the value of next-generation sequencing has become increasingly recognized since this study was conducted. OS was also difficult to fully assess, given that dates of death were not always available in the patient charts. In the OS and PFS analyses, the results of the log-rank tests used to compare the two cohorts should also be interpreted with caution. These unadjusted analyses were performed with relatively small sample sizes and the proportional hazards assumption was not consistently met.
Finally, results from TN Oncology clinics may not be generalizable to other patients diagnosed with NSCLC.
Conclusion
This study assessed treatment patterns and sequences and clinical outcomes in NSCLC before and after clinical pathways implementation in a real-world community setting. Patients diagnosed with stage I–II NSCLC who initiated systemic treatment after the implementation of clinical pathways did not have significant changes in treatment patterns and sequences or improvements in clinical outcomes compared with patients in the pre-pathways cohort. Patients diagnosed with stage III disease also had largely similar outcomes between cohort periods, but they achieved improved clinical response rates post-pathways. Moreover, only stage III patients remained on their 1L systemic therapy regimen for a longer duration in the post-pathways cohort.
However, the small number of patients with stage III NSCLC in our sample and limitations in assessing OS in the study population made evaluation of the impact of clinical pathways on progression and survival outcomes difficult to isolate. Given that improvements in rates of treatment response occurred only for patients with Stage III NSCLC, among whom immunotherapy uptake increased in the post-pathways period, such improvements likely reflected evolving practices in cancer care, including advances in treatment and care delivery, rather than clinical pathways implementation. Further research is warranted to assess the impact of clinical pathways in the current treatment era, given that immunotherapy has now become the standard of care in NSCLC.
•
Clinical pathways are tools to optimize patient care, but information on their value in the real-world oncology setting is limited.
•
Chart data were used to assess treatment patterns and clinical outcomes in patients with stage I–III NSCLC pre- and post-clinical pathways implementation at a community oncology practice.
•
In stage I–II patients, chemotherapy remained the most common 1L treatment type both pre- and post-pathways (used in 100% and 89% of patients, respectively); in stage III patients, use of chemotherapy decreased from 96% pre-pathways to 72% post-pathways, and use of immunotherapy increased from 0% pre-pathways to 27% post-pathways.
•
Duration on 1L therapy was similar for stage I–II patients pre- and post-pathways (median 1.9 months vs 2.1 months; p = 0.75), but increased for stage III patients post-pathways (2.1 months vs 1.4 months pre-pathways; p < 0.01).
•
Among stage I–II patients, median PFS and OS were numerically longer post-pathways (PFS: 26 months vs 14 months pre-pathways; p = 0.14; OS: 26 months vs 20 months pre-pathways; p = 0.80); for stage III patients, median PFS was similar post-pathways (14 months vs 13 months pre-pathways; p = 0.82) and median OS was numerically longer (26 months vs 20 months pre-pathways; p =0.07).
•
Achievement of a complete or partial response with 1L therapy was similar post-pathways among stage I–II patients (60% vs 55% pre-pathways), but increased for stage III patients (56% vs 35% pre-pathways).
•
Despite a greater variety of treatments received post-pathways, rates of severe AEs during both 1L and 2L therapy were statistically similar for pre- and post-pathways cohorts among both stage I–II and stage III patients.
•
Given that improvements in rates of treatment response post-pathways occurred only for patients diagnosed with stage III NSCLC, these changes may be attributable to evolving treatment practices (including increased immunotherapy use for advanced disease) rather than clinical pathways implementation; further research on the impact of pathways is warranted now that immunotherapy has become the standard of care in NSCLC.
Financial & competing interests disclosure
Sponsorship for this study was funded by Bristol Myers Squibb. The authors have no other relevant affiliations or financial involvement with any organization or entity with a financial interest in or financial conflict with the subject matter or materials discussed in the manuscript apart from those disclosed.
LATITUDE (AXON Communications) provided medical writing services on behalf of the authors and Bristol Myers Squibb Pharmaceuticals Ltd.
Ethical conduct of research
This study was approved by the New England Institutional Review Board (NEIRB). The study was performed in accordance with the Helsinki Declaration of 1964 and its later amendments.
References
Papers of special note have been highlighted as: • of interest
1.
American Cancer Society. Cancer facts and figures 2021. (Accessed 15 October 2021). www.cancer.org/content/dam/cancer-org/research/cancer-facts-and-statistics/annual-cancer-facts-and-figures/2021/cancer-facts-and-figures-2021.pdf
2.
American Cancer Society. Key statistics for lung cancer. (Accessed 15 October 2021). www.cancer.org/cancer/lung-cancer/about/key-statistics.html
3.
American Cancer Society. Lung cancer early detection, diagnosis, and staging. (Accessed 15 October 2021). www.cancer.org/content/dam/CRC/PDF/Public/8705.00.pdf
4.
Hanna NH, Schneider BJ, Temin S et al. Therapy for stage IV non–small-cell lung cancer without driver alterations: ASCO and OH (CCO) Joint Guideline Update. J. Clin. Oncol. 38(14), 1608–1632 (2020).
5.
Mariotto AB, Enewold L, Zhao J, Zeruto CA, Yabroff KR. Medical care costs associated with cancer survivorship in the United States. Cancer Epidemiol. Biomarkers Prev. 29(7), 1304–1312 (2020).
6.
Ettinger DS, Aisner DL, Wood DE et al. NCCN Guidelines® Insights non–small cell lung cancer, Version 5.2018. J. Natl. Compr. Canc. Netw. 16(7), 807–821 (2018).
7.
Ettinger DS, Wood DE, Aisner DL et al. Non-small cell lung cancer, Version 5.2017, NCCN Clinical Practice Guidelines in Oncology. J. Natl. Compr. Canc. Netw. 15(4), 504–535 (2017).
8.
Gubens MA, Davies M. NCCN Guidelines updates: new immunotherapy strategies for improving outcomes in non-small cell lung cancer. J. Natl. Compr. Canc. Netw. 17(5.5), 574–578 (2019).
9.
Ettinger DS, Wood DE, Aggarwal C et al. NCCN Guidelines Insights: non-small cell lung cancer, Version 1.2020. J. Natl. Compr. Canc. Netw. 17(12), 1464–1472 (2019).
10.
Zon RT, Frame JN, Neuss MN et al. American Society of Clinical Oncology policy statement on clinical pathways in oncology. J. Oncol. Pract. 12(3), 261–266 (2016).
• Most recent policy statement from ASCO on clinical pathways in oncology, including discussing of the value and concerns regarding pathways.
11.
Gesme DH, Wiseman M. Strategic use of clinical pathways. J. Oncol. Pract. 7(1), 54–56 (2011).
12.
Centers for Medicare & Medicaid Services Innovation Center. Oncology Care Model. (Accessed 15 October 2021). https://innovation.cms.gov/innovation-models/oncology-care
13.
Centers for Medicare & Medicaid Services Innovation Center. Oncology Care Model. Key drivers and change package. June 1, 2020. (Accessed 15 October 2021). https://innovation.cms.gov/files/x/ocm-keydrivers-changepkg.pdf
14.
Community Oncology Alliance. The Oncology Care Model 2.0. May 28, 2019. (Accessed 15 October 2021). https://communityoncology.org/wp-content/uploads/2019/06/COA-PTAC.pdf
15.
Finn L, Malhotra S. The development of pathways in palliative medicine: definition, models, cost and quality impact. Healthcare (Basel). 7(1), 22 (2019).
16.
Peckham J, Mott-Coles S. Interprofessional Lung Cancer Tumor Board: The role of the oncology nurse navigator in improving adherence to national guidelines and streamlining patient care. Clin. J. Oncol. Nurs. 22(6), 656–662 (2018).
17.
Karukonda P, Gebhardt BJ, Horne ZD, Heron DE, Beriwel S. Standardization of radiation therapy dose for locally advanced non-small cell lung cancer through changes to a lung cancer clinical pathway in a large, integrated comprehensive cancer center network. Pract. Radiat. Oncol. 7(6), e551–e557 (2017).
18.
Mason C, Ellis PG, Lokay K et al. Patterns of biomarker testing rates and appropriate use of targeted therapy in the first-line, metastatic non-small cell lung cancer treatment setting. J. Clin. Pathw. 4(1), 49–54 (2018).
19.
Zon RT, Edge SB, Page RD et al. American Society of Clinical Oncology criteria for high-quality clinical pathways in oncology. J. Oncol. Pract. 13(3), 207–210 (2017).
• Describes assessments of the ASCO Task Force on Clinical Pathways on challenges regarding clinical pathway programs in oncology practices.
20.
Daly B, Zon RT, Page RD et al. Oncology clinical pathways: charting the landscape of pathway providers. J. Oncol. Pract. 14(3), e194–e200 (2018).
• Study assessing several national pathway vendors in the oncology marketplace.
21.
Neubauer MA, Hoverman JR, Kolodziej M et al. Cost effectiveness of evidence-based treatment guidelines for the treatment of non-small-cell lung cancer in the community setting. J. Oncol. Pract. 6(1), 12–18 (2010).
22.
Jackman DM, Zhang Y, Dalby C et al. Cost and survival analysis before and after implementation of Dana-Farber clinical pathways for patients with stage IV non-small-cell lung cancer. J. Oncol. Pract. 13(4), e346–e352 (2017).
• Study describing the impact of clinical pathways on reduced costs of care for advanced NSCLC without compromising clinical outcomes; notably, this study was conducted before the widespread use of immunotherapies.
23.
Kreys ED, Koeller JM. Documenting the benefits and cost savings of a large multistate cancer pathway program from a payer's perspective. J. Oncol. Pract. 9(5), e241–e247 (2013).
24.
Hamilton JG, Genoff Garzon M, Westerman JS et al. “A tool, not a crutch”: patient perspectives about IBM Watson for oncology trained by Memorial Sloan Kettering. J. Oncol. Pract. 15(4), e277–e288 (2019).
25.
Magee DE, Hird AE, Klaassen Z et al. Adverse event profile for immunotherapy agents compared with chemotherapy in solid organ tumors: a systematic review and meta-analysis of randomized clinical trials. Ann. Oncol. 31(1), 50–60 (2020).
26.
Klarenbeek SE, Weekenstroo HHA, Sedelaar JPM, Fütterer JJ, Prokop M, Tummers M. The effect of higher level computerized clinical decision support systems on oncology care: a systematic review. Cancers (Basel) 12(4), 1032 (2020).
• Systematic review assessing the effect of computerized clinical decision support systems on oncology care; in the included studies, the use of these systems did not result in differences in clinical outcomes.
27.
Schleicher SM, Chaudhry B, Dickson NR et al. Time to rethink the role of clinical pathways in the era of precision medicine: a lung cancer case study. JCO Oncol. Pract. 17(7), 379–381 (2021).
• Highlights the value of clinical pathways on personalized patient care for NSCLC but that information is limited on the contribution of pathways to reduced treatment costs in the immunotherapy era.
Information & Authors
Information
Published In
Pages: 609 - 619
PubMed: 35546311
Copyright
© 2022 Future Medicine Ltd.
History
Received: 22 November 2021
Accepted: 12 April 2022
Published online: 12 May 2022
Keywords:
Topics
Authors
Funding Information
Metrics & Citations
Metrics
Article Usage
Article usage data only available from February 2023. Historical article usage data, showing the number of article downloads, is available upon request.
Citations
How to Cite
Impact of clinical pathways on treatment patterns and outcomes for patients with non-small-cell lung cancer: real-world evidence from a community oncology practice. (2022) Journal of Comparative Effectiveness Research. DOI: 10.2217/cer-2021-0290
Export citation
Select the citation format you wish to export for this article or chapter.
Citing Literature
- Ali Azadi, Francisco José García-Peñalvo, Aligning EMR Structure with Treatment Cycles: Enhancing Data Management and CDSS Functionality, Applied Sciences, 10.3390/app15105273, 15, 10, (5273), (2025).
- Giannis Mountzios, Sofia Lampaki, Helena Linardou, Vassilis Georgoulias, Dimitrios Mavroudis, Stavros Anevlavis, Andriani Charpidou, Maria Lykka, Dionysis Spyratos, Evangelos G Sarris, Alvertos Somarakis, Christina Papista, Alexandros Glentis, Aristeidis Nikolaou, Zoe Paparepa, Foteini Papageorgiou, Konstantinos N. Syrigos, Real-world treatment patterns in patients with non-metastatic non-small cell lung cancer in Greece: the ‘EVIDENCE’ study, Future Oncology, 10.1080/14796694.2024.2442295, 21, 4, (447-462), (2025).
- Gary Oderda, Diana Brixner, Joseph Biskupiak, James Harnett, Chieh-I Chen, Ruben G.W. Quek, Evolving oncology care management trends in the United States: A survey among health care decision makers, Journal of Managed Care & Specialty Pharmacy, 10.18553/jmcp.2024.30.8.825, 30, 8, (825-833), (2024).
- Mary Ichiuji, Laura Asakura, Carol Cain, Nancy Aye, Tatjana Kolevska, David Chen, Farah Mohebpour Brasfield, Dinesh Kotak, Improving routine use of clinical pathway decision support through integration of an EHR with a clinical library resource designed to provide evidence-based guidance within oncology workflows, BMC Health Services Research, 10.1186/s12913-024-11018-8, 24, 1, (2024).
- Cheng Zhou, Lihua Wang, Jingjuan Zhang, Huimin Huang, Lanping Yan, Yan Zhang, Application Value of Whole-course Nursing Management in Immunotherapy of Lung Cancer using Evidence-based Concepts: An Approach to Patient Health Behavior, American Journal of Health Behavior, 10.5993/AJHB.47.5.15, 47, 5, (1023-1034), (2023).
- Rohit P. Ojha, Yan Lu, Kalyani Narra, Rachel J. Meadows, Aaron W. Gehr, Emmanuel Mantilla, Bassam Ghabach, Survival After Implementation of a Decision Support Tool to Facilitate Evidence-Based Cancer Treatment, JCO Clinical Cancer Informatics, 10.1200/CCI.23.00001, 7, (2023).