Clinical and utilization outcomes associated with tumor mutational burden in a real-world pan-tumor population
Publication: Journal of Comparative Effectiveness Research
Abstract
Aim & methods: This real-world study examined the association of tumor mutational burden (TMB) with clinical and healthcare utilization in adults diagnosed with advanced solid tumor 1 January 2015– 31 January 2019. Results: There were 170 patients in low-TMB group (TMB<10 mut/Mb) and 32 in high-TMB group (TMB ≥10 mut/Mb). Median overall survival was 18.8 (95% CI: 17.3–28.8) and 15.9 months (95% CI: 11.3–18.0) whereas median progression-free survival was 9.9 (95% CI: 8.6–11.4) and 7.8 months (95% CI: 3.8–12.5) for the low- and high-TMB groups, respectively. Hospitalization (49.4 vs 37.5%), emergency visit (25.3 vs 21.9%), and median overall cost of care (US$135,403 vs 87,570) were all lower in low-TMB group. Conclusion: Despite the limited sample, these data provide a historical perspective for examining real-world outcomes associated with TMB.
Lay abstract
Tumor mutational burden (TMB) is the total number of mutations found in the DNA of cancer cells. Knowing the TMB may help plan the best treatment. The goal of this study was to examine whether higher TMB is directly associated with clinical outcomes or healthcare use and costs in patients who have not received immuno-oncology treatment. This study included 202 adult patients who were diagnosed with advanced solid tumors between January 2015 and January 2019. Patients were divided into two groups based on their TMB level. The study results indicate some relationship between TMB level and real-world outcomes. Future studies with a larger sample size are needed to confirm these results.
Tumor mutational burden (TMB), defined as the measurement of the number of mutations carried by tumor cells, is an emerging biomarker in cancer research. TMB is determined using complex algorithms that compare DNA sequences between a patient’s tumor and normal tissue to establish the number of acquired somatic mutations. High mutational burden is typical of cancers arising from exposure to carcinogens (e.g., lung and bladder cancers) and mutagens (e.g., melanoma) but has also been found in other tumor types [1–3]. The gold standard for determining TMB is whole-exome sequencing, which yields a number of mutations per megabase pair (mut/Mb); however, advancing technology has generated a range of next-generation sequencing panels [1,4–6].
The concept of TMB was introduced in 2015 in an investigation on genomic determinants of response to immune checkpoint inhibitors in patients with non-small-cell lung cancer (NSCLC) [7]. Immune checkpoints are proteins that can inhibit T cell activity, and are often upregulated in tumors to avoid immune system detection and attack. Checkpoint inhibitors such as pembrolizumab and ipilimumab can maximize immune activity against tumors by restoring T cell activity [8–13]. In the seminal study on TMB, whole-exome sequencing on NSCLCs treated with pembrolizumab revealed an association between higher mutation burden and clinical efficacy [7]. This may be explained, in part, by mutations in tumor cell surface proteins that can introduce novel antigens/epitopes that could be exploited as targets for endogenous immune activity or exogenous chemical or biologic agents [14].
Studies on TMB have revealed that patients with improved outcomes could be retrospectively identified by examining the relative density of immune checkpoint pathways [15], and higher TMB is associated with longer overall survival (OS) in patients treated with immune checkpoint inhibitors [6,16,17]. Notably, a study that examined over 1600 advanced cancer patients on immune checkpoint inhibitors showed that TMB was predictive of response to immunotherapies [6,16]. However, evidence around the prognostic value of TMB in the absence of immunotherapies is limited.
Immunotherapies have been associated with improved outcomes with a variety of tumor types, including cholangiocarcinoma, endometrial cancer, gastroesophageal, neuroendocrine, osteosarcoma, urothelial carcinoma, pancreas, prostate, small intestine, renal and colon cancers [5,13,15,16,18] and a significant correlation was identified between TMB and response to immune checkpoint inhibitors in 27 distinct tumor types [2,3]. This has broad implications for the future of clinical cancer treatment; yet, transitioning the use of TMB from clinical research to the clinical practice raises several practical concerns and questions. Examples include whether TMB is only relevant to patients who are candidates for immunotherapies, what aspects of TMB or criteria are optimal for treatment selection and outcomes, and whether TMB in itself has any prognostic value. This study was designed to explore the associations of TMB with clinical and healthcare resource utilization (HCRU) outcomes, including treatment patterns and effectiveness, in a sample of patients with solid tumors without prior exposure to immunotherapies.
Materials & methods
Study design & data source
This was a retrospective, observational study using the ConcertAI Oncology Dataset which consists of electronic medical record (EMR) data available to ConcertAI through data sharing agreements from a network of community oncology practices representing a geographically and demographically diverse patient population in USA, and includes unstructured clinical information such as provider progress notes containing relevant information not widely available in structured EMR data. These data were extracted by trained Clinical Research Nurses from provider notes, pathology reports and other relevant documents. All data were collected from the date of diagnosis of advanced or metastatic cancer through the end of third progression defined line treatment, end of record or death (whichever occurred first). The TMB values were pulled from lab data or physician notes. The results were based on different assays (e.g., Foundation One, Tempus). Hospitalizations and emergency department (ED) visits were based on documentation of such visits from the date of diagnosis of advanced or metastatic cancer through the end of the third-line therapy, the patient record or death. Outcomes were stratified by line of treatment and TMB results. The cutoff between low and high TMB was 10 mut/Mb based on The Friends of Cancer Research recommendation [19]. The protocol for this study received institutional review board approval from IntegReview (TX, USA).
Study patients
All analyzed patients were ≥18 years of age and had been diagnosed with advanced or metastatic solid tumor carcinoma between 1 January 2015 and 31 January 2019 and presented with ≥1 numeric TMB test result. Patients who received immuno-oncology therapies at any time were excluded from the study. The data cutoff date was 30 November 2019.
Outcomes
Baseline demographic and clinical characteristics were analyzed, including cancer type, location of metastasis and rates of comorbidities.
Treatment patterns are reported for the first three lines of therapy. Clinical outcomes included best overall response, progression-free survival (PFS) and OS assessed from advanced diagnosis date and from start of each line of treatment for the first three lines. Best overall response was defined based on tumor response information as noted by the treating physician in the medical records and reported as percentage of patients with ‘favorable’ response, in other words, complete response or partial response. PFS was defined as time from treatment start to the earlier of disease progression or death. Disease progressions were determined from radiological scan notes from radiologists and clinical documentation. The terminal event for OS was death. Dates of death were determined from the clinical record, structured EMR data, and third-party records (Social Security Death Index). Patients who did not have terminal events of interest were censored at last observed date.
HCRU end points included incidence of hospitalization, number of office visits in which the physician was seen, incidence of ED visits, and use of anticancer medications; each assessed weekly or monthly. Cost estimates were generated by linking unit costs to estimates of utilization. The details of methods used for cost computation are available elsewhere [20].
Statistical analyses
Descriptive statistics were produced for patient characteristics and all study variables, including means, standard deviations, medians and minimum and maximum values for continuous variables, and frequencies and percentages for categorical variables. Unadjusted comparisons across stratified groups were conducted using analysis of variance (ANOVA) for continuous variables and the Chi-square or Fisher’s exact test for categorical variables. Time to event outcomes (unadjusted PFS and OS results) were analyzed using Kaplan–Meier methods. Results were interpreted as significant based on two-tailed α = 0.05.
Results
Patient characteristics
A total of 202 patients with TMB test results were included in the analysis and were categorized as low TMB (n = 170) or high TMB (n = 32). Mean patient age was 62.1 ± 11.6 years (median: 62.5 years), and the proportion of patients >65 years was significantly higher in the high-TMB group than low-TMB group (53.1 vs 34.1%; p = 0.0411). The study population was predominantly White (71.3%) and resided in the US Southern region (55.4%; Table 1).
| Variable | Low TMB (n = 170) | High TMB (n = 32) | Overall (n = 202) | p-value |
|---|---|---|---|---|
| Age in years, mean (SD) | 61.8 (11.81) | 64.1 (10.33) | 62.1 (11.60) | 0.2882 |
| – Median (range) | 62.2 (19.7–86.0) | 65.9 (41.1–78.3) | 62.5 (19.7–86.0) | |
| Age category, n (%) | 0.0411 | |||
| – ≤65 | 112 (65.9%) | 15 (46.9%) | 127 (62.9%) | |
| – >65 | 58 (34.1%) | 17 (53.1%) | 75 (37.1%) | |
| Female, n (%) | 83 (48.8%) | 14 (43.8%) | 97 (48.0%) | 0.5982 |
| Male, n (%) | 87 (51.2%) | 18 (56.3%) | 105 (52.0%) | |
| Race, n (%) | 0.3627 | |||
| – Black or African American | 36 (21.2%) | 7 (21.9%) | 43 (21.3%) | |
| – Hispanic or Latino | 6 (3.5%) | 1 (3.1%) | 7 (3.5%) | |
| – White | 123 (72.4%) | 21 (65.6%) | 144 (71.3%) | |
| – Other | 4 (2.4%) | 3 (9.4%) | 7 (3.5%) | |
| – Unknown/undocumented | 1 (<1%) | 0 (0.0%) | 1 (<1%) | |
| Race category, n (%) | 0.4403 | |||
| – White | 123 (72.4%) | 21 (65.6%) | 144 (71.3%) | |
| – Minority/unknown | 47 (27.6%) | 11 (34.4%) | 58 (28.7%) | |
| Weight, pounds, mean (SD) | 181.6 (46.85) | 178.5 (52.07) | 181.1 (47.60) | 0.7364 |
| – Median (range) | 175.1 (87.8–312.0) | 166.9 (106.5–314.0) | 173.8 (87.8–314.0) | |
| Height, inches, mean (SD) | 67.0 (4.44) | 66.7 (3.72) | 67.0 (4.33) | 0.6699 |
| – Median | 67.0 (51.4–76.0) | 66.0 (58.0–74.0) | 67.0 (51.4–76.0) | |
| BMI, kg/m2, mean (SD) | 28.4 (7.07) | 28.1 (7.81) | 28.4 (7.17) | 0.8410 |
| – Median (range) | 27.1 (15.9–53.1) | 25.7 (17.8–50.7) | 26.6 (15.9–53.1) | |
| Insurance category, n (%) | 0.2356 | |||
| – Private only | 56 (32.9%) | 9 (28.1%) | 65 (32.2%) | |
| – Public only | 40 (23.5%) | 13 (40.6%) | 53 (26.2%) | |
| – Public and private | 26 (15.3%) | 3 (9.4%) | 29 (14.4%) | |
| – Unknown | 48 (28.2%) | 7 (21.9%) | 55 (27.2%) | |
| Region, n (%) | 0.3967 | |||
| – Midwest | 49 (28.8%) | 13 (40.6%) | 62 (30.7%) | |
| – South | 97 (57.1%) | 15 (46.9%) | 112 (55.4%) | |
| – West | 18 (10.6%) | 2 (6.3%) | 20 (9.9%) | |
| – Northeast | 6 (3.5%) | 2 (6.3%) | 8 (4.0%) |
SD: Standard deviation; TMB: Tumor mutational burden.
The most common tumor types in the full study population were colorectal cancer (31.7%) and biliary tract cancer (15.3%). The composition of tumor types differed significantly between patients in low- and high-TMB cohorts (p < 0.0001; Figure 1). Notably, lung cancer was the most frequent tumor type among high-TMB patients (37.5% of patients) and the lowest among low-TMB patients (2.4% of patients). Despite the high frequency of colorectal cancer, it was evenly distributed between low- and high-TMB patients (32.4 and 28.1%, respectively). Some locations of distant metastases showed significant differences by TMB burden. Specifically, the high-TMB group had a significantly higher rate of brain (21.9 vs 3.5%; p = 0.0001) and adrenal gland (12.5 vs 2.4%; p = 0.0069) metastasis than the low-TMB group (Table 2).
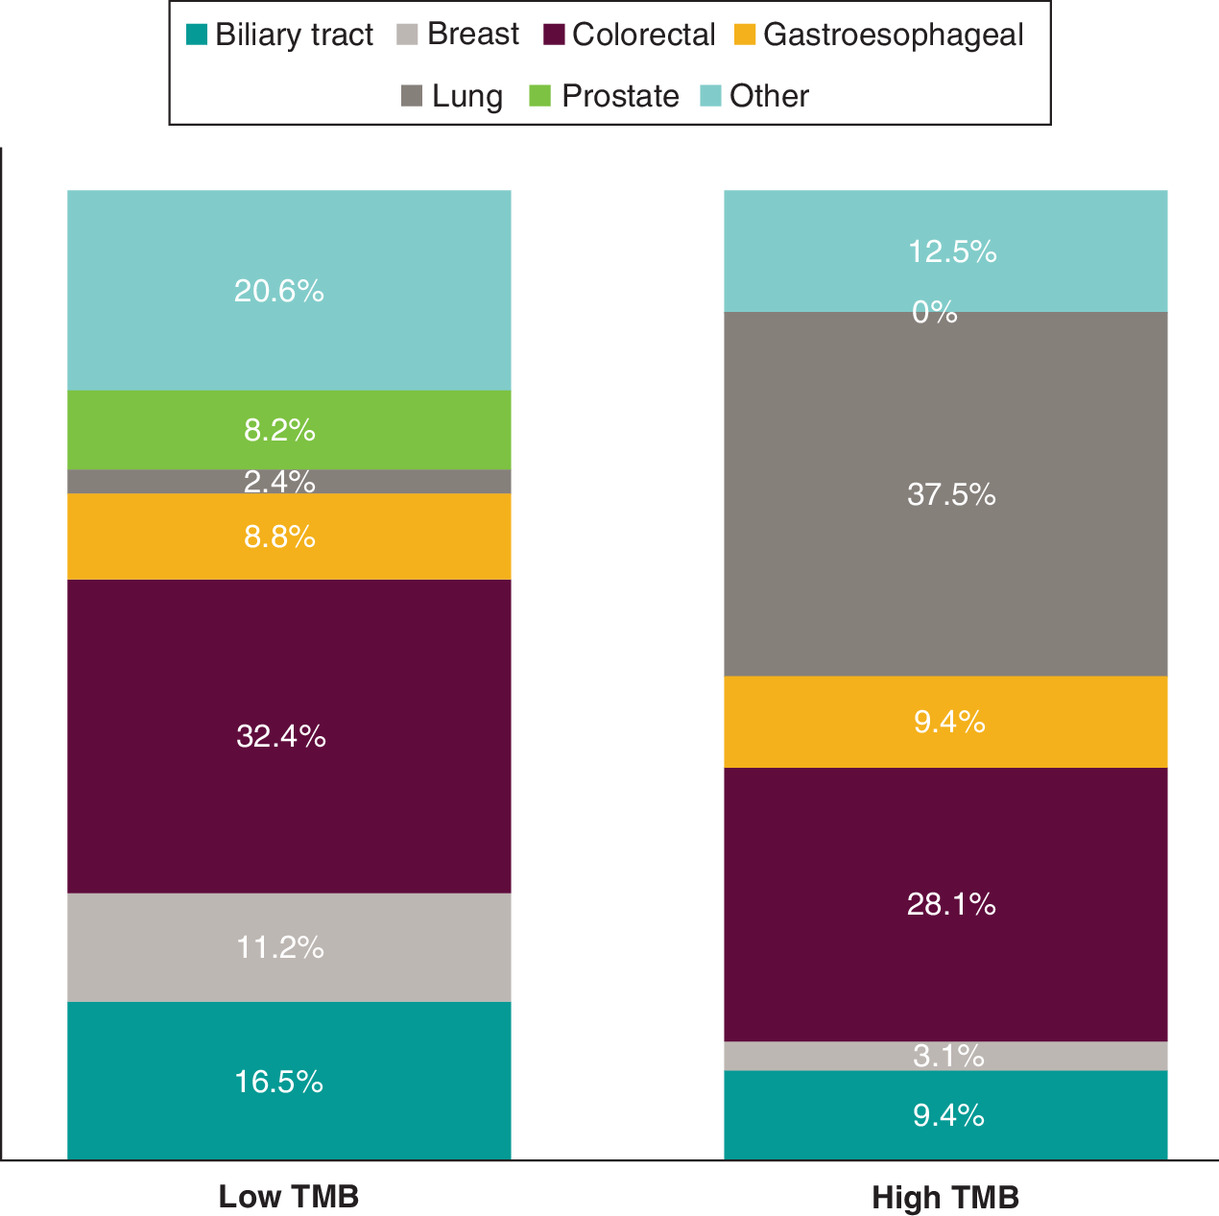
Figure 1. Primary tumor type by cohort.
TMB: Tumor mutational burden.
| Variable | Low TMB (n = 170) | High TMB (n = 32) | Overall (n = 202) | p-value |
|---|---|---|---|---|
| Tumor stage at initial diagnosis, n (%) | 0.4392 | |||
| – I | 9 (5.3%) | 3 (9.4%) | 12 (5.9%) | |
| – II | 18 (10.6%) | 4 (12.5%) | 22 (10.9%) | |
| – III | 16 (9.4%) | 5 (15.6%) | 21 (10.4%) | |
| – IV | 119 (70.0%) | 18 (56.3%) | 137 (67.8%) | |
| – Undocumented | 8 (4.7%) | 2 (6.3%) | 10 (5.0%) | |
| Tumor stage at advanced/metastatic diagnosis, n (%) | 0.6953 | |||
| – III | 11 (6.5%) | 1 (3.1%) | 12 (5.9%) | |
| – IV | 159 (93.5%) | 31 (96.9%) | 190 (94.1%) | |
| Tumor grade at initial diagnosis, n (%) | 0.8288 | |||
| – 1 | 8 (4.7%) | 1 (3.1%) | 9 (4.5%) | |
| – 2 | 61 (35.9%) | 14 (43.8%) | 75 (37.1%) | |
| – 3 | 46 (27.1%) | 7 (21.9%) | 53 (26.2%) | |
| – Undocumented | 55 (32.4%) | 10 (31.3%) | 65 (32.2%) | |
| TMB assay type, n (%) | 0.3468 | |||
| – Foundation One | 101 (59.4%) | 20 (62.5%) | 121 (59.9%) | |
| – MI Tumor Seek | 60 (35.3%) | 11 (34.4%) | 71 (35.1%) | |
| – Tempus xT | 8 (4.7%) | 0 (0.0%) | 8 (4.0%) | |
| – Other/undocumented | 1 (<1%) | 1 (3.1%) | 2 (1.0%) | |
| Sites of distant metastasis, n (%) | ||||
| – Adrenal gland | 4 (2.4%) | 4 (12.5%) | 8 (4.0%) | 0.0069 |
| – Bone | 46 (27.1%) | 4 (12.5%) | 50 (24.8%) | 0.0800 |
| – Brain | 6 (3.5%) | 7 (21.9%) | 13 (6.4%) | 0.0001 |
| – Breast | 1 (0.6%) | 0 (0.0%) | 1 (0.5%) | 0.6636 |
| – Chest wall | 0 (0.0%) | 1 (3.1%) | 1 (0.5%) | 0.0209 |
| – Distant lymph node | 43 (25.3%) | 10 (31.3%) | 53 (26.2%) | 0.4823 |
| – Liver | 68 (40.0%) | 9 (28.1%) | 77 (38.1%) | 0.2045 |
| – Lung | 49 (28.8%) | 8 (25.0%) | 57 (28.2%) | 0.6593 |
| – Malignant pleural effusion | 5 (2.9%) | 2 (6.3%) | 7 (3.5%) | 0.3478 |
| – Other | 29 (17.1%) | 6 (18.8%) | 35 (17.3%) | 0.8166 |
| – Pancreas | 1 (0.6%) | 0 (0.0%) | 1 (0.5%) | 0.6636 |
| – Peritoneum | 17 (10.0%) | 3 (9.4%) | 20 (9.9%) | 0.9135 |
| ECOG performance status at index date, n (%) | 0.0251 | |||
| – 0 | 62 (36.5%) | 5 (15.6%) | 67 (33.2%) | |
| – 1 | 44 (25.9%) | 14 (43.8%) | 58 (28.7%) | |
| – 2 | 13 (7.6%) | 6 (18.8%) | 19 (9.4%) | |
| – 3 | 3 (1.8%) | 1 (3.1%) | 4 (2.0%) | |
| – 4 | 1 (<1%) | 0 (0.0%) | 1 (<1%) | |
| – Undocumented | 47 (27.6%) | 6 (18.8%) | 53 (26.2%) | |
| Composite performance status at index date, n (%) | 0.1445 | |||
| – Impaired | 19 (11.2%) | 7 (21.9%) | 26 (12.9%) | |
| – Not impaired | 151 (88.8%) | 25 (78.1%) | 176 (87.1%) | |
| Weighted comorbidity index score at index date | 0.0550 | |||
| – Mean (SD) | 0.7 (1.42) | 1.2 (1.26) | 0.8 (1.40) | |
| – Median (range) | 0.0 (0.0–12.0) | 1.0 (0.0–4.0) | 0.0 (0.0–12.0) | |
| Comorbidities at index date, n (%) | ||||
| – Cerebrovascular accident | 6 (3.5%) | 4 (12.5%) | 10 (5.0%) | 0.0319 |
| – Chronic obstructive pulmonary disease | 7 (4.1%) | 11 (34.4%) | 18 (8.9%) | <0.0001 |
| – Cirrhosis or other serious liver disease | 6 (3.5%) | 2 (6.3%) | 8 (4.0%) | 0.4691 |
| – Congestive heart failure | 5 (2.9%) | 3 (9.4%) | 8 (4.0%) | 0.0869 |
| – Connective tissue disease | 7 (4.1%) | 1 (3.1%) | 8 (4.0%) | 0.7917 |
| – Diabetes | 34 (20.0%) | 5 (15.6%) | 39 (19.3%) | 0.5651 |
| – HIV+/AIDS | 1 (0.6%) | 0 (0.0%) | 1 (0.5%) | 0.6636 |
| – Leukemia | 1 (0.6%) | 0 (0.0%) | 1 (0.5%) | 0.6636 |
| – Metastatic solid tumor (other than primary tumor type) | 3 (1.8%) | 0 (0.0%) | 3 (1.5%) | 0.4490 |
| – Myocardial infarction | 5 (2.9%) | 6 (18.8%) | 11 (5.4%) | 0.0003 |
| – Renal disease | 10 (5.9%) | 2 (6.3%) | 12 (5.9%) | 0.9357 |
| – Surgical treatment for peripheral vascular disease | 2 (1.2%) | 2 (6.3%) | 4 (2.0%) | 0.0588 |
| – Ulcer disease | 1 (0.6%) | 1 (3.1%) | 2 (1.0%) | 0.1836 |
| – No comorbid disease present | 106 (62.4%) | 13 (40.6%) | 119 (58.9%) | 0.0219 |
ECOG: Eastern Cooperative Oncology Group; SD: Standard deviation; TMB: Tumor mutational burden.
The overall health status of patients in the high-TMB group was generally less favorable than that of low-TMB patients. Notably, 59.4% of patients in the high-TMB group had at least one comorbid condition versus 37.6% in the low-TMB group (p = 0.0219). Compared with patients in the low-TMB cohort, those with high TMB also had significantly higher rates of cerebrovascular accident (12.5 vs 3.5%; p = 0.0319), chronic obstructive pulmonary disease (34.4 vs 4.1%; p < 0.0001) and myocardial infarction (18.8 vs 2.9%; p = 0.0003) than those in the low-TMB cohort (Table 2).
Treatment patterns & effectiveness outcomes
Results of the analysis of treatment patterns are summarized in Figure 2. Of low-TMB patients, 161 (94.7%) received systemic anticancer treatment compared with 24 (75.0%) high TMB. The proportion of patients receiving systemic treatment in the second- and third-line was numerically higher for low-TMB group than high-TMB group.
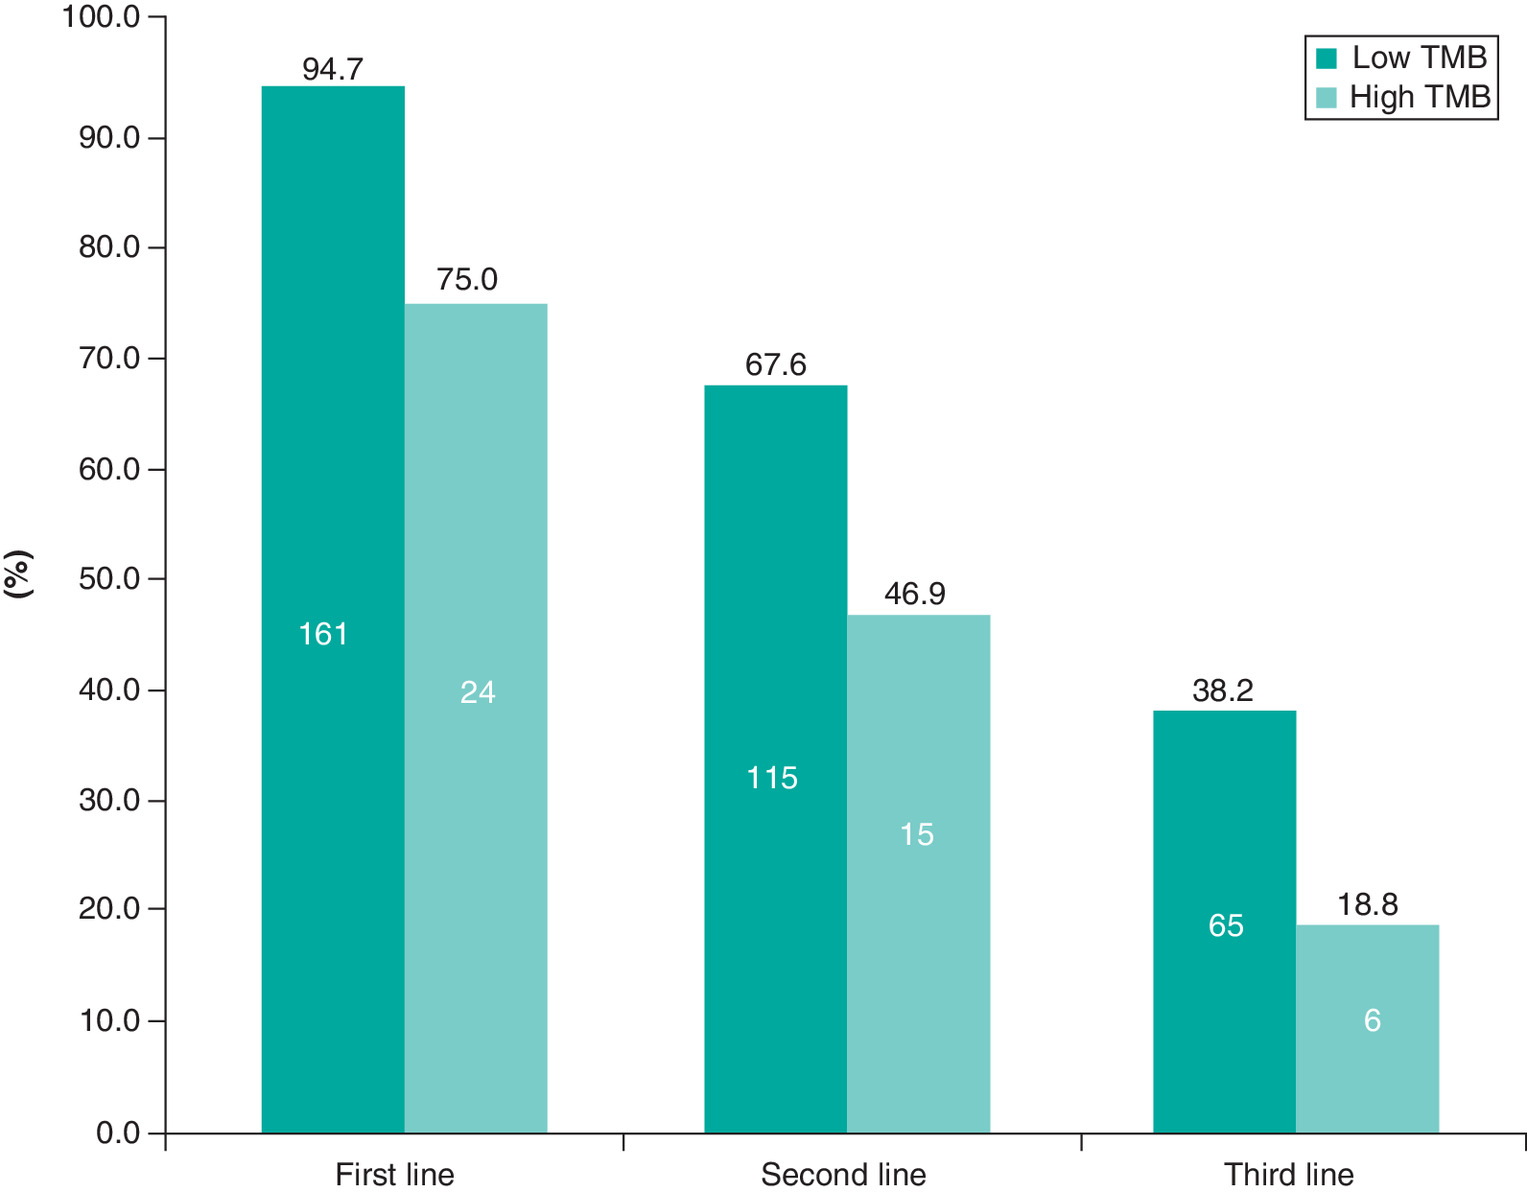
Figure 2. Treated patients by line of treatment and cohort.
TMB: Tumor mutational burden.
Overall, 49.7, 23.8 and 12.7% of patients experienced a favorable response (complete response or partial response) following their first, second and third line of treatment, respectively (Table 3). The Kaplan–Meier analysis (Table 4) revealed median PFS values of 9.86 months (95% CI: 8.6, 11.4) for low-TMB group and 7.75 months (95% CI: 3.8, 12.5) for high-TMB group after their diagnosis date. The median PFS was generally higher for patients in the low-TMB group versus the high-TMB group after first-, second- and third-line treatment as well. The analysis of OS revealed median values of 18.76 months (95% CI: 17.3, 28.8) and 15.87 months (95% CI: 11.3, 18.0) after their diagnosis date for the low- and the high-TMB groups, respectively (Table 5).
| n (%) | Low TMB (n = 170) | High TMB (n = 32) | Overall (n = 202) |
|---|---|---|---|
| First line | n = 161 | n = 24 | n = 185 |
| – Favorable response | 80 (49.7%) | 12 (50.0%) | 92 (49.7%) |
| Second line | n = 115 | n = 15 | n = 130 |
| – Favorable response | 29 (25.2%) | 2 (13.3%) | 31 (23.8%) |
| Third line | n = 65 | n = 6 | n = 71 |
| – Favorable response | 8 (12.3%) | 1 (16.7%) | 9 (12.7%) |
TMB: Tumor mutational burden.
| Variable | Low TMB (n = 170) | High TMB (n = 32) | Overall (n = 202) |
|---|---|---|---|
| From advanced/metastatic diagnosis date | |||
| – Events/patients (n) | 121/170 | 23/32 | 144/202 |
| – Months, median (95% CI) | 9.86 (8.6, 11.4) | 7.75 (3.8, 12.5) | 9.49 (8.3, 11.4) |
| From first-line treatment start date | |||
| – Events/patients (n) | 110/161 | 16/24 | 126/185 |
| – Months, median (95% CI) | 9.30 (7.7, 10.8) | 7.36 (5.0, 13.1) | 9.26 (7.7, 10.6) |
| From second-line treatment start date | |||
| – Events/patients (n) | 76/115 | 10/15 | 86/130 |
| – Months, median (95% CI) | 5.59 (3.5, 6.4) | 3.68 (1.6, 8.0) | 5.39 (3.6, 6.3) |
| From third-line treatment start date | |||
| – Events/patients (n) | 43/65 | 4/6 | 47/71 |
| – Months, median (95% CI) | 3.84 (2.7, 5.2) | 3.50 (2.0, 4.4) | 3.75 (3.0, 4.4) |
PFS: Progression-free survival; TMB: Tumor mutational burden.
| Variable | Low TMB (n = 170) | High TMB (n = 32) | Overall (n = 202) |
|---|---|---|---|
| From advanced/metastatic diagnosis date | |||
| – Events/patients (n) | 71/170 | 17/32 | 88/202 |
| – Months, median (95% CI) | 18.76 (17.3, 28.8) | 15.87 (11.3, 18.0) | 18.60 (16.6, 21.7) |
| From first-line treatment start date | |||
| – Events/patients (n) | 67/161 | 11/24 | 78/185 |
| – Months, median (95% CI) | 18.33 (15.5, 24.8) | 13.60 (10.2, 21.8) | 18.30 (15.4, 21.8) |
| From second-line treatment start date | |||
| – Events/patients (n) | 51/115 | 9/15 | 60/130 |
| – Months, median (95% CI) | 11.01 (8.3, 13.8) | 9.20 (3.2, 12.1) | 10.97 (8.3, 12.1) |
| From third-line treatment start date | |||
| – Events/patients (n) | 31/65 | 3/6 | 34/71 |
| – Months, median (95% CI) | 6.74 (5.6, 12.6) | 7.62 (2.9, 10.9) | 6.83 (5.6, 10.9) |
OS: Overall survival; TMB: Tumor mutational burden.
Healthcare resource utilization & costs
In the HCRU assessment, the low-TMB group had numerically more hospitalization (49.4 vs 37.5%), more ED visits (25.3 vs 21.9%), and more outpatient medical oncology visits per month (mean 1.6 vs 1.4; Table 6) than the high-TMB group.
| Variables | Low TMB (n = 170) | High TMB (n = 32) |
|---|---|---|
| Diagnosis through third-line treatment | n = 170 | n = 32 |
| – Any hospitalization, n (%) | 84 (49.4%) | 12 (37.5%) |
| – Any ED visit, n (%) | 43 (25.3%) | 7 (21.9%) |
| – Outpatients visit per month, mean (SD) | 1.6 (1.09) | 1.4 (0.91) |
| During first-line treatment | n = 161 | n = 24 |
| – Any hospitalization, n (%) | 33 (20.5%) | 4 (16.7%) |
| – Any ED visit, n (%) | 17 (10.6%) | 5 (20.8%) |
| – Outpatients visit per month, mean (SD) | 1.6 (1.34) | 2.2 (2.20) |
| During second-line treatment | n = 115 | n = 15 |
| – Any hospitalization, n (%) | 13 (11.3%) | 4 (26.7%) |
| – Any ED visit, n (%) | 10 (8.7%) | 0 (0.0%) |
| – Outpatients visit per month, mean (SD) | 1.7 (1.32) | 1.6 (0.71) |
| During third-line treatment | n = 65 | n = 6 |
| – Any hospitalization, n (%) | 9 (13.8%) | 1 (16.7%) |
| – Any ED visit, n (%) | 3 (4.6%) | 0 (0.0%) |
| – Outpatients visit per month, mean (SD) | 1.6 (1.22) | 1.9 (0.60) |
ED: Emergency department; HCRU: Healthcare resource utilization; SD: Standard deviation; TMB: Tumor mutational burden.
The cost analysis revealed a median overall cost of care of US$135,403 in the low-TMB group versus US$87,570 in the high-TMB group. Corresponding median monthly overall healthcare costs were US$14,159 and 11,628, respectively (Table 7).
| Variable | Low TMB (n = 170) | High TMB (n = 32) |
|---|---|---|
| Diagnosis through third-line treatment | n = 170 | n = 32 |
| – Monthly overall cost, median (min, max) | US$14,159 (US$0, US$292,209) | US$11,628 (US$897, US$154,190) |
| During first-line treatment | n = 161 | n = 24 |
| – Monthly overall cost, median (min, max) | US$11,801 (US$0, US$325,698) | US$17,199 (US$897, US$122,574) |
| During second-line treatment | n = 115 | n = 15 |
| – Monthly overall cost, median (min, max) | US$13,950 (US$0, US$286,423) | US$11,587 (US$969, US$137,538) |
| During third-line treatment | n = 65 | n = 6 |
| – Monthly overall cost, median (min, max) | US$12,668 (US$0, US$398,764) | US$19,465 (US$569, US$30,818) |
HCRU: Healthcare resource utilization; TMB: Tumor mutational burden.
Discussion
In this study, we examined clinical and HCRU outcomes in patients diagnosed with advanced solid tumors who had ≥1 numeric TMB test result. Results revealed some key underlying differences between patients with high TMB and low TMB.
With the effectiveness of immune checkpoint inhibitors for multiple tumor types [21], there has been growing interest in assays to identify patients who are more likely to benefit from these treatments. The recent discovery of TMB was a major advancement to this end and prompted subsequent research exploring the clinical utility of this measure. The seminal study on TMB found that patients with NSCLC who were treated with pembrolizumab and had TMB above the study cohort median had significantly improved outcomes compared with patients with TMB below the median [7]. Later studies confirmed TMB to be an independent predictor of immune checkpoint inhibitor response [15,22] and potentially applicable to many types of tumors [2–4,16]. Although the prognostic value of TMB is still under investigation [6,14,16], one recently published study found that high TMB was not associated with OS in the absence of immunotherapy [23].
Based on its recent discovery, the basic groundwork for using TMB in the clinic is still being formed. Only recently a standard for clinically meaningful TMB values was proposed as 10 mut/Mb differentiating high versus low TMB [19]. Additional efforts include development of practical and efficient ways to assess TMB in real-world settings, and better understanding of how high and low TMB affects clinical as well as economic outcomes. In addition to the current study, we also recently examined how TMB is being used in real-world settings to help address these unmet needs [24].
This study was the first real-world analysis of HCRU and treatment costs by TMB. Our key finding that the distribution of tumor type (in particular, lung cancer) was significantly different between high- and low-TMB groups aligns with a prior comprehensive investigation that showed lung cancers were second to only melanoma for having the highest rate of somatic mutations [25]. A separate study also supports our findings of high TMB in bladder and colorectal cancers [6].
We observed that patients in the high-TMB group were likely to have more comorbid conditions, brain metastasis and slightly worse composite performance status than those with low-TMB scores. Interestingly, we also observed that systemic anticancer treatment was more common among patients with low TMB over the first three lines of treatment. The meaning of this is still unclear, but perhaps the poorer overall health of high-TMB patients limits potential treatment options. Investigations are ongoing on the impact of comorbidities on treatment selection, which appears to vary by cancer type and recommended treatment options [26–28]. The effect of TMB on comorbidities and/or treatment selection will be an interesting area of future investigation.
Our observation that only about one of six study cases had high TMB also align with previous findings that high TMB is generally less frequent than low TMB. One large, pan-tumor, retrospective, real-world study that used a 10 mut/Mb threshold reported high TMB in 12.8% of patients [23]. Another large retrospective study that used a threshold of 17 mut/Mb found a high TMB in up to 14.6% of samples among 15 gastrointestinal tumor types [29]. We also noted that prevalence of high TMB was higher for lung cancer patients consistent with prior study findings [23].
Over time, other aspects of TMB have emerged that may affect future clinical applications. For instance, a review of over 12,000 tumors noted that 2% to 10% of cancer patients had high mismatch repair-deficient TMB, which was more common for late stage and metastatic tumors [18]. Our results suggest that TMB by itself is not a significant clinical prognostic factor for patients treated with nonimmunotherapeutic agents, as we did not observe a significant association between TMB and clinical effectiveness outcomes in our immunotherapy naive study population. These findings are supported by a recent analysis of more than 5000 patients with metastatic cancers who were treated with nonimmunotherapeutic agents that also failed to identify an association between high TMB and improved OS [16]. Additional findings in this burgeoning field of study will be required to fully understand the best use of TMB in the clinic.
This study had several limitations. First, this was a retrospective analysis that selected for immunotherapy naive patients with a numeric TMB test result treated in the community oncology setting, yielding a relatively narrow patient population not representative of other settings (e.g., academic medical centers) or the oncology patient population at large. This also affected the sample size, reducing our ability to make effective statistical comparisons. Second, the medical records serving as the data source vary in inclusion, quality, and consistency of source data. To address this limitation, Clinical Research Nurses specially trained to capture the data in a consistent fashion performed the data abstractions. Yet, overall, the results from this study should be interpreted and generalized with caution.
Conclusion
In this first real-world study investigating the prognostic value of TMB in patients with advanced solid tumors who were never exposed to immuno-oncology treatment, only about one of six cases had a high-TMB score. Patients with higher TMB had higher comorbidity rates, higher brain metastasis rate, and more severe illness overall. We observed some correlation between high TMB scores with unfavorable clinical outcomes and higher use of certain healthcare resources and higher overall healthcare costs than low TMB scores. Even though those results are unadjusted and are based on limited sample size, these data provide a benchmark and/or historical perspective for future research focusing on the real-world effectiveness outcomes associated with TMB. Future studies with larger sample size are required to confirm these results and further address confounding.
•
The goal of this study was to examine whether higher tumor mutational burden (TMB) itself is directly associated with clinical outcomes or healthcare resource utilization and treatment costs in the absence of immuno-oncology treatment.
•
To that end, we compared 170 patients with TMB <10 mut/Mb (low-TMB group) and 32 with TMB ≥10 mut/Mb (high-TMB group).
•
Some notable differences in demographic and clinical characteristics between low- and high-TMB groups were observed. Patients >65 years were more common in the high-TMB group (p = 0.0411).
•
The prevalence of various tumor types differed significantly between patients in low- versus high-TMB cohorts (p < 0.0001), particularly lung cancer (37.5 vs 2.4% in high- and low-TMB patients, respectively).
•
The high-TMB group also had a significantly higher rate of brain (21.9 vs 3.5%; p = 0.0001) and adrenal gland (12.5 vs 2.4%; p = 0.0069) metastasis.
•
Of low-TMB patients, 161 (94.7%) received systemic anticancer treatment compared with 24 (75.0%) in the high-TMB group.
•
Median overall survival was 18.8 months (95% CI: 17.3–28.8) for low-TMB patients compared with 15.9 (95% CI: 11.3–18.0) for the high-TMB group. Median progression-free survival was 9.9 months (95% CI: 8.6–11.4) for low-TMB patients and 7.8 months (95% CI: 3.8–12.5) for the high-TMB group.
•
The hospitalization (49.4 vs 37.5%), emergency visit (25.3 vs 21.9%), and median overall cost of care (US$135,403 vs 87,570) were all lower in the low-TMB group.
•
Despite the limited sample size, the results indicate some correlation between TMB level and clinical and healthcare resource utilization outcomes. Future studies with larger sample size are required to confirm these results and further address confounding.
Author contributions
S Gautam contributed in conception and design of the work, interpretation of data for the work, drafting the work, revising it critically for important intellectual content, final approval, agreement to be accountable. S Kachroo, RW DeClue and MD Fisher contributed in conception and design of the work, interpretation of data for the work, revising it critically for important intellectual content, final approval, agreement to be accountable. A Basu contributed in interpretation of data for the work, revising it critically for important intellectual content, final approval, agreement to be accountable
Acknowledgments
The authors thank N Connors (NCC Medical & Scientific Communications, Inc.) for medical writing assistance. Part of this research was presented at the ESMO Virtual Congress 2020, 19–21 September 2020.
Financial & competing interests disclosure
Merck & Co., Inc. sponsored this study and provided financial support for the conduct of the research and for preparation of the article. S Kachroo is employed by Merck & Co., Inc. and holds stock and options. A Basu is a Professor at the University of Washington and a paid consultant through Salutis Consulting LLC. S Gautam, RW DeClue, and MD Fisher are employees of ConcertAI and report research funding from Merck & Co., Inc. to their institution. The authors have no other relevant affiliations or financial involvement with any organization or entity with a financial interest in or financial conflict with the subject matter or materials discussed in the manuscript apart from those disclosed.
Medical writing assistance was provided by Nate Connors, PhD, CMPP and was funded by ConcertAI.
Ethical conduct of research
This retrospective chart review study involving human participants was in accordance with the ethical standards of the institutional and/or national research committee and with the 1964 Helsinki Declaration and its later amendments or comparable ethical standards. This research was reviewed and approved by the Institutional Review Board of IntegReview. This research study was conducted retrospectively from data obtained for clinical purposes. An institutional review board waiver of consent was granted from IntegReview.
Data sharing statement
ConcertAI does not make datasets publicly available because study data are used under license from source practices. ConcertAI will consider requests to access study datasets on a case-by-case basis.
References
Papers of special note have been highlighted as: • of interest
1.
Galuppini F, Dal Pozzo CA, Deckert J, Loupakis F, Fassan M, Baffa R. Tumor mutation burden: from comprehensive mutational screening to the clinic. Cancer Cell. Int. 19, 209 (2019).
2.
Yarchoan M, Hopkins A, Jaffee EM. Tumor mutational burden and response rate to PD-1 inhibition. N. Engl. J. Med. 377(25), 2500–2501 (2017).
3.
Johnson DB, Frampton GM, Rioth MJ et al. Targeted next generation sequencing identifies markers of response to PD-1 blockade. Cancer Immunol. Res. 4(11), 959–967 (2016).
4.
Buttner R, Longshore JW, Lopez-Rios F et al. Implementing TMB measurement in clinical practice: considerations on assay requirements. ESMO Open 4(1), e000442 (2019).
• Highlights the importance of use of tumor mutational burden (TMB) testing in clinical practice.
5.
Fancello L, Gandini S, Pelicci PG, Mazzarella L. Tumor mutational burden quantification from targeted gene panels: major advancements and challenges. J. Immunother. Cancer 7(1), 183 (2019).
6.
Lee M, Samstein RM, Valero C, Chan TA, Morris LGT. Tumor mutational burden as a predictive biomarker for checkpoint inhibitor immunotherapy. Hum. Vaccin. Immunother. 16(1), 112–115 (2020).
7.
Rizvi NA, Hellmann MD, Snyder A et al. Cancer immunology. Mutational landscape determines sensitivity to PD-1 blockade in non-small-cell lung cancer. Science 348(6230), 124–128 (2015).
8.
Krummel MF, Allison JP. CD28 and CTLA-4 have opposing effects on the response of T cells to stimulation. J. Exp. Med. 182(2), 459–465 (1995).
9.
Brown KE, Freeman GJ, Wherry EJ, Sharpe AH. Role of PD-1 in regulating acute infections. Curr. Opin. Immunol. 22(3), 397–401 (2010).
10.
Iwai Y, Ishida M, Tanaka Y, Okazaki T, Honjo T, Minato N. Involvement of PD-L1 on tumor cells in the escape from host immune system and tumor immunotherapy by PD-L1 blockade. Proc. Natl Acad. Sci. USA 99(19), 12293–12297 (2002).
11.
Dunn GP, Old LJ, Schreiber RD. The immunobiology of cancer immunosurveillance and immunoediting. Immunity 21(2), 137–148 (2004).
12.
Leach DR, Krummel MF, Allison JP. Enhancement of antitumor immunity by CTLA-4 blockade. Science 271(5256), 1734–1736 (1996).
13.
Pardoll DM. The blockade of immune checkpoints in cancer immunotherapy. Nat. Rev. Cancer 12(4), 252–264 (2012).
14.
Chalmers ZR, Connelly CF, Fabrizio D et al. Analysis of 100,000 human cancer genomes reveals the landscape of tumor mutational burden. Genome Med. 9(1), 34 (2017).
• Represents one of the important studies highlighting the landscape of TMB across several cancer types.
15.
Reck M, Rodriguez-Abreu D, Robinson AG et al. Pembrolizumab versus chemotherapy for PD-L1-positive non-small-cell lung cancer. N. Engl. J. Med. 375(19), 1823–1833 (2016).
16.
Samstein RM, Lee CH, Shoushtari AN et al. Tumor mutational load predicts survival after immunotherapy across multiple cancer types. Nat. Genet. 51(2), 202–206 (2019).
• Highlights the clinical implications of TMB. Patients with higher TMB have better survival when treated with immunotherapy.
17.
Melendez B, Van Campenhout C, Rorive S, Remmelink M, Salmon I, D'haene N. Methods of measurement for tumor mutational burden in tumor tissue. Transl. Lung Cancer Res. 7(6), 661–667 (2018).
18.
Le DT, Durham JN, Smith KN et al. Mismatch repair deficiency predicts response of solid tumors to PD-1 blockade. Science 357(6349), 409–413 (2017).
19.
Friends of Cancer Research. Tissue agnostic TMB clinical cut-off harmonization initiative (2020). www.focr.org/sites/default/files/Tissue-Agnostic-TMB_Summary.pdf
• Reveals the findings from an initiative to align a single TMB cut-off point for use across pan-tumor indication. Such an alignment is important for usability of TMB tests and to get benefits from it.
20.
Houts AC, Olufade T, Shenolikar R, Walker MS, Schwartzberg LS. Treatment patterns, clinical outcomes, health resource utilization, and cost in patients with BRCA-mutated metastatic breast cancer treated in community oncology settings. Cancer Treat. Res. Commun. 19, 100121 (2019).
21.
Krieger T, Pearson I, Bell J, Doherty J, Robbins P. Targeted literature review on use of tumor mutational burden status and programmed cell death ligand 1 expression to predict outcomes of checkpoint inhibitor treatment. Diagn. Pathol. 15(1), 6 (2020).
22.
Goodman AM, Kato S, Bazhenova L et al. Tumor mutational burden as an independent predictor of response to immunotherapy in diverse cancers. Mol. Cancer Ther. 16(11), 2598–2608 (2017).
• Examines the association between TMB and clinical outcomes in a pan-tumor population. All patients were treated with immunotherapy, unlike our study, and they observed favorable response for patients with high TMB.
23.
Shao C, Li G, Huang L et al. Prevalence of high tumor mutational burden and association with survival in patients with less common solid tumors. JAMA Netw. Open 3(10), e2025109 (2020).
• Compares outcomes between patients with high TMB to those with low-TMB using the real-world data. The study focuses on less common solid tumors only.
24.
Gautam S, Kachroo S, Declue RW, Fisher MD, Basu A. Real-world patterns on tumor mutation burden testing in a pan-tumor population. Future Oncol. 17(15), 1879–1887 (2021).
25.
Alexandrov LB, Nik-Zainal S, Wedge DC et al. Signatures of mutational processes in human cancer. Nature 500(7463), 415–421 (2013).
26.
Gould MK, Munoz-Plaza CE, Hahn EE, Lee JS, Parry C, Shen E. comorbidity profiles and their effect on treatment selection and survival among patients with lung cancer. Ann. Am. Thorac. Soc. 14(10), 1571–1580 (2017).
27.
Simeoni R, Breitenstein K, Eßer D, Guntinas-Lichius O. Cardiac comorbidity in head and neck cancer patients and its influence on cancer treatment selection and mortality: a prospective cohort study. Eur. Arch. Otorhinolaryngol. 273(9), 2765–2772 (2016).
28.
Bøje CR. Impact of comorbidity on treatment outcome in head and neck squamous cell carcinoma - a systematic review. Radiother. Oncol. 110(1), 81–90 (2014).
29.
Salem ME, Puccini A, Grothey A et al. Landscape of tumor mutation load, mismatch repair deficiency, and PD-L1 expression in a large patient cohort of gastrointestinal cancers. Mol. Cancer Res. 16(5), 805–812 (2018).
Information & Authors
Information
Published In
Pages: 857 - 868
PubMed: 34047199
Copyright
© 2021 Future Medicine Ltd.
History
Received: 22 December 2020
Accepted: 29 April 2021
Published online: 28 May 2021
Keywords:
Topics
Authors
Funding Information
Metrics & Citations
Metrics
Article Usage
Article usage data only available from February 2023. Historical article usage data, showing the number of article downloads, is available upon request.
Citations
How to Cite
Clinical and utilization outcomes associated with tumor mutational burden in a real-world pan-tumor population. (2021) Journal of Comparative Effectiveness Research. DOI: 10.2217/cer-2020-0288
Export citation
Select the citation format you wish to export for this article or chapter.