The impact of implementation of a hysterectomy enhanced recovery pathway on anesthetic medication costs
Publication: Journal of Comparative Effectiveness Research
Abstract
Aim: To evaluate the effect of implementation of a hysterectomy Enhanced Recovery After Surgery (ERAS) protocol on perioperative anesthetic medication costs. Patients & methods: Historical cohort study of 84 adult patients who underwent a hysterectomy. Forty-two patients who underwent surgery before protocol implementation comprised the pre-ERAS group. Forty-two patients who underwent surgery after protocol implementation comprised the post-ERAS group. Data on anesthetic medication costs and outcomes were analyzed. Results: Compared with the pre-ERAS group, the post-ERAS group’s total medication cost was significantly lower (median: 325.20 USD; interquartile range [IQR]: 256.12–430.65 USD vs median: 273.10 USD; IQR: 220.63–370.59 USD, median difference: -40.76, 95% CI: -130.39, 16.99, p = 0.047). Length of stay was significantly longer in pre-ERAS when compared with post-ERAS groups (median: 5.0 days; IQR: 4.0–7.0 days vs median: 3.0 days; IQR: 3.0–4.0 days, median difference: -2.0 days, 95% CI: -2.5581, -1.4419, p < 0.0001). Conclusion: ERAS protocols may reduce perioperative medication costs.
Enhanced Recovery Pathways (ERPs) or Enhanced Recovery After Surgery (ERAS) pathways are integrated, evidence-based, multidisciplinary protocols used to guide the perioperative management of surgical patients. Originally designed to speed recovery and minimize the surgical stress response in patients undergoing colorectal surgery, ERAS pathways have since been developed for several surgical specialties, including gynecologic oncology surgery [1–3]. In this patient population, the implementation of ERAS programs has been associated with improvements in hospital length of stay (LOS) and time to return of bowel function [3–6]. Furthermore, evidence has shown that ERAS programs have no negative impact on rates of readmission, reoperation or mortality [7,8].
In addition to the clinical benefits of these pathways, there is a growing body of evidence indicating that ERAS protocols contribute to a reduction in cost for both hospitals and patients [9–13]. Specifically, there are three studies of ERAS implementation in gynecologic oncology surgery that have demonstrated cost savings. Gerardi et al. reported that an ERP for patients undergoing cytoreductive surgery for ovarian and peritoneal cancers reduced the total direct and indirect hospital postoperative care cost by 5,410 USD per patient [14]. In a different population, the introduction of an ERAS pathway for patients undergoing cytoreduction, surgical staging or pelvic organ prolapse surgery resulted in a reduction of more than 7600 USD per patient for all-cause, 30-day postsurgical costs [8]. Finally, following implementation of an ERAS program for patients undergoing surgery for a suspected gynecologic cancer, Harrison et al. reported a 15.6% reduction in median 30-day surgical and postoperative hospital charges and a 30% reduction in charges for pharmacy services [15].
While total hospital cost savings have been demonstrated with the use of ERAS practices, no studies have directly examined whether the perioperative anesthetic medication costs differ in conventional care versus when administered as a component of an integrated ERAS pathway. This data would be useful for all perioperative healthcare providers and especially those who may be hesitant to adopt ERAS initiatives due to concern for increasing costs or those who assess their service-specific costs separately from those of the hospital system at large. Overall, this insight would help to further our knowledge of how and where ERAS principles contribute to cost savings during different phases along the continuum of care.
Understanding these nuances is increasingly important for healthcare professionals, researchers and policymakers, especially given the current state of the US healthcare system. In 2015, Americans spent 3.2 trillion USD on healthcare, constituting nearly 18% of the country’s gross domestic product. Actuaries from the Centers for Medicare & Medicaid Services forecast that this percentage will increase to over 20% of the gross domestic product by 2025 [16]. Consequently, the American healthcare system has begun transitioning to a value-based model centered on providing the highest quality of patient care for the lowest possible cost [17].
In this context we undertook a historical cohort study of patients undergoing an open hysterectomy for oncologic indications with the primary objective to evaluate the effect of implementation of our gynecologic oncology ERAS pathway on the total cost of perioperative anesthetic medications. Our secondary objective was to evaluate the impact of our ERAS pathway on hospital LOS.
Patients & methods
Study design
This study complies with Strengthening the Reporting of Observational Studies in Epidemiology (STROBE) reporting recommendations wherever applicable [18]. This historical cohort study was approved by the University of Texas Southwestern Medical Center Institutional Review Board (IRB; #STU 062017-077) in August 2017. The requirement for written informed consent was waived by the IRB as this was a historical study. This study was performed according to Good Clinical Practice guidelines. The study was conducted at William P. Clements Jr. University Hospital, one of the academic teaching hospitals within the University of Texas Southwestern Health System in Dallas, TX, USA.
Study population
Between 1 January 2015 and 31 December 2018, 84 adult female patients who underwent an open abdominal hysterectomy for malignant disease were identified. Our study cohort included patients who underwent an open abdominal hysterectomy with any associated procedures necessary to treat their primary gynecologic oncologic disease (e.g., bilateral salpingo-oophorectomy, lymph node dissection, omentectomy, etc.). Forty-two consecutive patients who underwent surgery between 1 January 2015 and 31 December 2016 made up the pre-ERAS group and 42 consecutive patients who underwent surgery between 20 February 2017 and 31 December 2018 made up the post-ERAS group. We allowed for a 2-month washout period after instituting our ERP to achieve optimal data accuracy in the post-ERAS group as providers became increasingly familiar with the protocol. Study dates were chosen to include two years preceding and following implementation of our gynecologic oncology ERAS pathway on 1 January 2017. Patients were excluded if they met any of the following criteria: pre-existing chronic pain, acute or chronic renal failure (plasma creatinine >1.5 mg/dl), dementia, delirium, sepsis, acute heart failure, severe diabetes with gastroparesis, severe chronic obstructive pulmonary disease, nonelective procedures and surgery that included an additional procedure not related to their primary gynecologic oncologic disease (e.g., hysterectomy with a mastectomy or bowel resection).
Intervention & measurements
The ERAS protocol was codeveloped by members of the Department of Anesthesiology and the Division of Gynecologic Oncology. It was designed to standardize the anesthetic and surgical management of patients undergoing gynecologic oncology surgery. Among its components, it recommended multimodal analgesia, routine antiemetic prophylaxis, protocolized antibiotic administration, minimally invasive surgical techniques whenever possible, an ultrasound-guided transversus abdominis plane (TAP) block with local anesthetic, balanced intravenous (iv.) fluid administration targeting euvolemia, early mobilization and early diet initiation.
We calculated the total anesthetic medication cost for all agents administered by anesthesiology providers in the preoperative and intraoperative phases of care. We did not include in our analysis any medications that were administered in the postanesthesia care unit (PACU) because medication administration in this phase of care is not performed by anesthesiology providers at our institution. Drug costs were obtained from our central operating room pharmacy reflecting costs in August 2017. Other extracted data included age, American Society of Anesthesiologists physical status (ASA-PS) classification, actual bodyweight, hospital LOS, thromboembolism prophylaxis, antibiotic prophylaxis, intraoperative fluids, analgesics, antiemetic prophylaxis, neuromuscular blockade reversal agents, volatile anesthetics, TAP block, normothermia (defined as >36°C), total anesthesia time, total surgery time, tolerance of sips of clear liquids in the PACU, advancement of diet on postoperative day 1, performance of ambulation on postoperative day 1 and the development of postoperative complications including thromboembolism, ileus and infection. Total anesthesia time was defined as the time period from patient arrival in the operating room to the time the patient was transported to the PACU. Total surgery time was defined as the time period from skin incision to the time when the final surgical dressing was applied. Data were extracted via manual chart review of the Epic® electronic medical record. Data quality was verified by two independent reviewers. All data were de-identified to maintain patient confidentiality.
Outcomes
The primary outcome was to detect a one-sided difference in perioperative anesthesia-related medication costs between pre-ERAS and post-ERAS groups. In order to validate our pathway results and to confirm our ERAS implementation outcomes were consistent with published data, we evaluated hospital LOS as a secondary outcome.
Statistical analysis
The power calculation was performed based on our primary outcome. We determined that 84 total patients (42 in each group) were needed to obtain a statistically significant difference in cost at 80% power and 0.05 alpha level. Categorical outcomes are presented as frequency and percentages and compared using chi-square and/or Fisher’s exact test. Depending on the data’s distribution, continuous outcomes are summarized by median and interquartile range (IQR) or mean and standard deviation. The Mann–Whitney U/Wilcoxon Rank Sum or Student t-test was used for statistical comparisons of continuous data. To assess the impact of our ERAS protocol on cost and LOS, multivariate linear regression models were built to account for potential patient-level confounding bias. Cut-off values for alpha based on the univariate analysis were p < 0.2. All analyses were performed using SAS 9.4 (SAS Institute Inc., NC, USA) and p < 0.05 are considered statistically significant [19,20].
Results
Patient demographics & procedural characteristics
Eighty-four patients were included, with 42 patients providing pre-ERAS data and 42 patients providing post-ERAS data. Patients in the pre-ERAS and post-ERAS groups were well-matched (Table 1). The median total surgery time per case was significantly different (p = 0.045) when comparing the pre-ERAS group and the post-ERAS group (pre-ERAS median: 217 min; IQR: 154–285 min vs post-ERAS median: 176 min; IQR: 149–217 min, median difference: -39 min, 95% CI: -82.349, 11.674), however the total anesthesia time per case was not significantly different between groups (p = 0.080). Hospital LOS was significantly higher in pre-ERAS when compared with post-ERAS groups (pre-ERAS median: 5.0 days; IQR: 4.0–7.0 days vs post-ERAS median: 3.0 days; IQR: 3.0–4.0 days, median difference: -2.0 days, 95% CI: -2.5581, -1.4419, p < 0.0001).
| Demographics | Pre-ERAS (n = 42) | Post-ERAS (n = 42) | Difference (95% CI) | p-value |
|---|---|---|---|---|
| Age (years), mean (SD)† | 55.7 (12.9) | 52.5 (14.9) | -2.00 (-10.1162, 9.558) | 0.298 |
| Actual bodyweight (kg), Mean (SD)† | 79.5 (19.3) | 79.9 (17.4) | -0.33 (-8.321, 7.654) | 0.934 |
| Total anesthesia time/case (min), median (IQR)§ | 284 (221–361) | 240 (219–297) | -40.00 (-86.116, 13.581) | 0.080 |
| Total surgery time/case (min), median (IQR)§ | 217 (154–285) | 176 (149–217) | -39.00 (-82.349, 11.674) | 0.045 |
| ASA-PS classification (%)‡ | ||||
| – 1 | 2 (4.8) | 2 (4.8) | NA | 0.809 |
| – 2 | 19 (45.2) | 23 (54.8) | ||
| – 3 | 21 (50.0) | 17 (40.5) | ||
†
Pooled student t-test performed;
‡
Fisher’s exact test performed due to small cell size;
§
Mann–Whitney U/Wilcoxon rank sum performed due to non-normality.
ASA-PS: American Society of Anesthesiologists physical status; ERAS: Enhanced recovery after surgery; IQR: Interquartile range; SD: Standard deviation.
Pathway compliance & clinical metrics
There was a high level of compliance with our ERAS pathway (Table 2). Significantly more patients in the post-ERAS group received preoperative multimodal analgesia (p < 0.0001), preoperative multimodal antiemetic prophylaxis with a scopolamine patch (p = 0.024) and an intraoperative TAP block (p < 0.0001). ERAS pathway implementation allowed a higher percentage of patients to meet their clinical milestones. Significantly more patients in the post-ERAS group were able to tolerate sips of clear liquids in the PACU (p < 0.0001), have their diet advanced on postoperative day 1 (p = 0.015), and ambulate on postoperative day 1 (p = 0.002). Significantly fewer patients in the post-ERAS group developed a postoperative ileus (p = 0.026).
| Clinical metrics | Pre-ERAS (n = 42) | Post-ERAS (n = 42) | p-value |
|---|---|---|---|
| Preoperative ERAS metrics: | |||
| Antibiotic prophylaxis, n (%)† | 40 (95.2) | 41 (97.6) | >0.999 |
| Thromboembolism prophylaxis, n (%)† | 10 (23.8) | 13 (31.0) | 0.625 |
| Multimodal analgesia‡ | |||
| – Acetaminophen, n (%) | 4 (9.5) | 40 (95.2) | <0.0001 |
| – Gabapentin, n (%) | 2 (4.8) | 40 (95.2) | <0.0001 |
| Multimodal antiemetic prophylaxis†,‡ | |||
| – Aprepitant, n (%) | 4 (9.5) | 6 (14.3) | 0.738 |
| – Scopolamine patch, n (%) | 6 (14.3) | 16 (38.1) | 0.024 |
| Intraoperative ERAS metrics: | |||
| Multimodal analgesia† | |||
| – Opioids (mg, morphine equivalents), median (IQR) | 18 (11–22) | 18 (14–22) | 0.543 |
| – Ketamine, n (%) | 24 (57.1) | 31 (73.8) | 0.168 |
| – Antiemetic prophylaxis, n (%)† | 36 (85.7) | 39 (92.9) | 0.482 |
| Reversal agents†,‡ | |||
| Neostigmine, n (%) | 39 (92.9) | 30 (71.4) | 0.020 |
| Sugammadex, n (%) | 0 (0) | 9 (21.4) | 0.002 |
| iv. fluids§ | |||
| – Crystalloids, l/pt, median (IQR) | 2.6 (1.9–3.2) | 1.55 (0.8–2.2) | <0.0001 |
| – Colloids, ml/pt, median (IQR) | 250 (0–750) | 250 (0–500) | 0.741 |
| Volatile agents† | |||
| – Desflurane, n (%) | 15 (35.7) | 6 (14.3) | 0.023 |
| – Sevoflurane, n (%) | 27 (64.3) | 36 (85.7) | 0.023 |
| Normothermia maintained, n (%)† | 38 (90.5) | 42 (100) | 0.116 |
| TAP block performed, n (%)† | 19 (45.2) | 38 (90.5) | <0.0001 |
| PACU ERAS metrics: | |||
| Sips of clear liquids tolerated, n (%)‡ | 2 (4.8) | 20 (47.6) | <0.0001 |
| Postoperative ERAS metrics: | |||
| Advancement of diet, n (%)† | 33 (78.6) | 41 (97.6) | 0.015 |
| Timely ambulation, n (%)† | 33 (78.6) | 42 (100) | 0.002 |
| Hospital length of stay (days), median (IQR)§ | 5.0 (4.0–7.0) | 3.0 (3.0–4.0) | <0.0001 |
| Postoperative complications: | |||
| Thromboembolism, n (%) | 0 (0) | 0 (0) | – |
| Ileus, n (%)‡ | 10 (23.8) | 2 (4.7) | 0.026 |
| Infection, n (%)‡ | 6 (14.3) | 3 (7.1) | 0.483 |
†
Pearson chi-square test performed to assess homogeneity;
‡
Fisher’s exact test performed due to small cell size;
§
Mann–Whitney U/Wilcoxon rank sum performed due to non-normality.
ERAS: Enhanced recovery after surgery; IQR: Interquartile range; l/pt: Liters/patient; ml/pt: ml/patient; PACU: Postanesthesia care unit; TAP: Transversus abdominis plane; iv.: Intravenous.
The median milligram of morphine equivalents administered was not significantly different (p < 0.741) when comparing the pre-ERAS (median morphine equivalents: 18 mg; IQR: 11–22 mg) and post-ERAS groups (median morphine equivalents: 18 mg; IQR: 14–22 mg). Our results were similar for colloid administration. The median volume of colloids was not significantly different (p = 0.741) when comparing the pre-ERAS (median colloids: 250 ml; IQR: 0–750 ml) and the post-ERAS groups (median colloids: 250 ml; IQR: 0–500 ml). Conversely, median crystalloid administration was significantly less in the post-ERAS group when compared with the pre-ERAS group (median: 1.55 liters/patient [l/pt]; IQR: 0.8–2.2 vs median: 2.6 l/pt; IQR: 1.9–3.2, median difference: -0.9 l/pt, 95% CI: -1.92–0.42, p < 0.0001).
Cost
Compared with the pre-ERAS group, the post-ERAS median total medication cost was significantly lower (median: $325.20 USD; IQR: $256.12–430.65 vs median: $273.10 USD; IQR: $220.63–370.59, median difference: -$40.76, 95% CI: -130.39, 16.99, p = 0.047). There were no between-group differences in cost when the data were analyzed by ASA-PS classification, minute of anesthesia time, minute of surgery time or when the cost of volatile agents was removed (Table 3). Table 4 displays the cost difference in several categories of medications between the two groups (Table 4). The multivariate regression analysis of anesthetic medication cost is shown in (Table 5). The data do not show any significant differences in cost between groups.
| Cost | Pre-ERAS (n = 42) | Post-ERAS (n = 42) | Difference (95% CI) | p-value |
|---|---|---|---|---|
| Total anesthetic medication cost (USD), median (IQR) | $325.20 ($256.12–430.65) | $273.10 ($220.63–370.59) | -$40.76 (-$130.39–16.99) | 0.047 |
| Median cost/ASA-PS classification (IQR) | $133.06 ($107.78–198.04) | $114.88 ($101.62–145.80) | -$17.32 (-$36.22, -$1.01) | 0.092 |
| Median cost/min of anesthesia time (IQR) | $1.17 ($0.92–1.50) | $1.11 ($0.96–1.37) | -$0.06 (-$0.22–0.10) | 0.290 |
| Median cost/minute of surgery time (IQR) | $1.60 ($1.19–1.87) | $1.52 ($1.25–2.09) | -$0.06 (-$0.30–0.18) | 0.468 |
| Median cost without volatile anesthetics (IQR) | $236.57 ($173.10–335.97) | $190.51 ($145.94–295.90) | -$40.74 (-$87.93–10.18) | 0.075 |
ASA-PS: American Society of Anesthesiologists physical status; ERAS: Enhanced recovery after surgery; IQR: Interquartile range.
One-sided Mann–Whitney U/Wilcoxon rank sum test performed.
| Medication class | Pre-ERAS (n = 42) | Post-ERAS (n = 42) | p-value |
|---|---|---|---|
| Sedatives‡ | $2.45 ($2.44–2.45) | $2.45 ($2.17–2.45) | 0.441 |
| Local anesthetics | $6.08 ($2.45–13.26) | $13.26 ($13.26–13.26) | <0.001 |
| Paralytics | $5.94 ($5.28–8.36) | $5.28 ($4.40–6.60) | 0.044 |
| Antiemetics | $0.94 ($0.88–2.36) | $0.94 ($0.94–16.88) | 0.074 |
| Antibiotics | $10.90 ($5.45–16.35) | $1.70 ($1.70–3.40) | <0.0001 |
| Vasopressors | $21.62 ($4.65–30.88) | $26.23 ($9.30–30.88) | 0.197 |
| Antihypertensives | $0.00 ($0.00–0.69) | $0.00 ($0.00–0.00) | 0.021 |
| Electrolyte repletion | $0.00 ($0.00–6.06) | $0.00 ($0.00–0.00) | 0.054 |
| Analgesics | |||
| – Opioids | $4.49 ($3.31–9.87) | $2.39 ($1.79–3.58) | <0.0001 |
| – Nonopioids | $36.06 ($36.06–40.78) | $5.52 ($4.82–10.24) | <0.001 |
| Fluids | |||
| – Crystalloids | $13.53 ($8.53–17.06) | $8.53 ($7.06–10.59) | <0.0001 |
| – Colloids | $79.16 ($0.00–118.74) | $59.37 ($0.00–79.16) | 0.233 |
| Reversal agents | |||
| – Neostigmine/glycopyrrolate | $40.04 ($32.31–40.04) | $32.31 ($7.73–40.04) | 0.002 |
| – Sugammadex | $0.00 ($0.00–0.00) | $0.00 ($0.00–0.00) | <0.001 |
| Volatile anesthetics | |||
| – Sevoflurane | $74.69 ($0.00–74.69) | $74.69 ($74.69–74.69) | 0.008 |
| – Desflurane | $0.00 ($0.00–130.47) | $0.00 ($0.00–0.00) | 0.006 |
| Miscellaneous§ | $0.56 ($0.00–0.87) | $0.72 ($0.00–0.87) | 0.451 |
ERAS: Enhanced recovery after surgery.
†
All values are reported in USD with median, (interquartile ranges);
‡
Includes induction agents and anxiolytics;
§
Includes insulin, albuterol, heparin, diphenhydramine, diuretics, steroids, bicarbonate and lubricating ointments.
| Variable | Estimate | (95% CI) | p-value |
|---|---|---|---|
| Intercept | 116.71 | (-251.514, 484.934) | 0.530 |
| Anesthesia time | -0.65 | (-3.948, 2.655) | 0.698 |
| Surgery time | 1.29 | (-2.13, 4.71) | 0.455 |
| Volatile agents | |||
| – Desflurane | 60.7 | (-38.791, 160.192) | 0.228 |
| – Sevoflurane | Reference | Reference | Reference |
| Age | 0.66 | (-2.364, 3.688) | 0.664 |
| ASA-PS classification | |||
| – ASA-PS 1 | -15.6 | (-211.974, 180.78) | 0.875 |
| – ASA-PS 2 | -5.88 | (-96.744, 84.989) | 0.898 |
| – ASA-PS 3 | Reference | Reference | Reference |
| Actual bodyweight | 1.98 | (-0.379, 4.347) | 0.099 |
| Morphine equivalent | -3.49 | (-7.633, 0.65) | 0.097 |
| ERAS status | |||
| – Post-ERAS | 7.52 | (-77.853, 92.9) | 0.861 |
| – Pre-ERAS | Reference | Reference | Reference |
ASA-PS: American Society of Anesthesiologists physical status; ERAS: Enhanced recovery after surgery.
Discussion
The results of this study demonstrate that implementation of our hysterectomy ERP was not associated with an increase in perioperative anesthetic medication costs. Instead, on average the median total cost in the post-ERAS group was $40.76 USD lower than the median total cost in the pre-ERAS group. This corresponded to a 12.5% reduction in cost between the two groups. Patients in the post-ERAS group experienced less complications and attained their clinical milestones more frequently. Finally, the median hospital LOS was 2 days shorter in the post-ERAS group. This reduction in hospital LOS is similar to that described in other studies, validating our protocol’s effectiveness [7,21]. Implementation of our ERP was associated with excellent clinical outcomes and was no more costly than our pre-ERAS anesthetic technique. This indicates that perioperative providers can adhere to ERAS principles and deliver high quality care without incurring additional expense. These results are important for financial forecasting and outcomes analysis, especially as the US healthcare system transitions to a value-based care model. There are several potential reasons for our study’s findings.
Decrease in practice variation through standardization may explain the reduction in anesthetic medication cost following implementation of our protocol. More providers were likely to employ a multimodal analgesic regimen that included preoperative administration of inexpensive oral medications instead of administering expensive iv. agents intraoperatively. In the pre-ERAS group, only 9.5% of patients (4/42 patients) received oral acetaminophen while 76.2% of patients (32/42 patients) received iv. acetaminophen. Following ERP implementation, the percentage of patients who received oral acetaminophen increased to 95.2% (40/42 patients) while the percentage of patients who received iv. acetaminophen decreased to 23.8% (10/42 patients). This administration route standardization helps to explain our findings given that 1 g of oral acetaminophen cost $0.02 USD while 1 g of iv. acetaminophen cost $36.06 USD. This is shown in Table 4 in the significant reduction in the cost of nonopioid analgesics in the post-ERAS group. Table 4 also displays the effect of standardizing our antibiotic administration practice and the resulting costs savings the followed. Finally, the impact of standardization can be directly observed in Figure 1 and Figure 2; providers exhibited less variation in the amount of administered opioids and colloids as a result of implementation of our ERP.
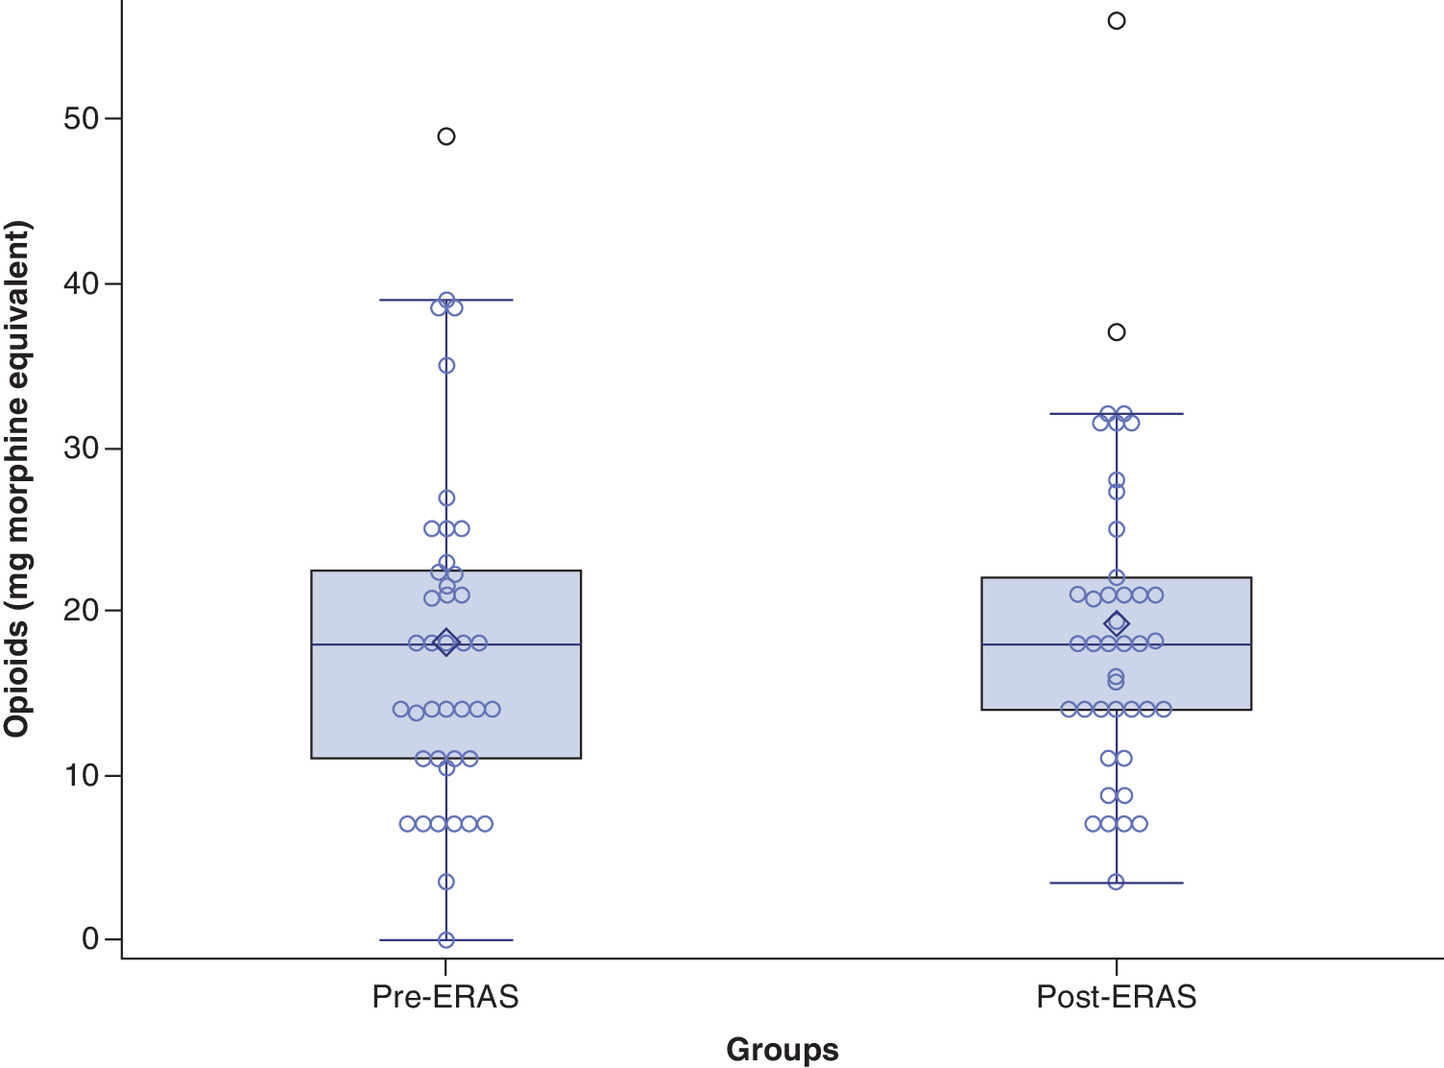
Figure 1. Opioid administration across groups.
Boxplot displaying the median and IQR for opioids administered to patients in each group. Opioid administration is displayed as mg of morphine equivalents. Data from the pre-ERAS group show a wider IQR with more values at the higher and lower ends of the distribution.
ERAS: Enhanced recovery after surgery; IQR: Interquartile range.
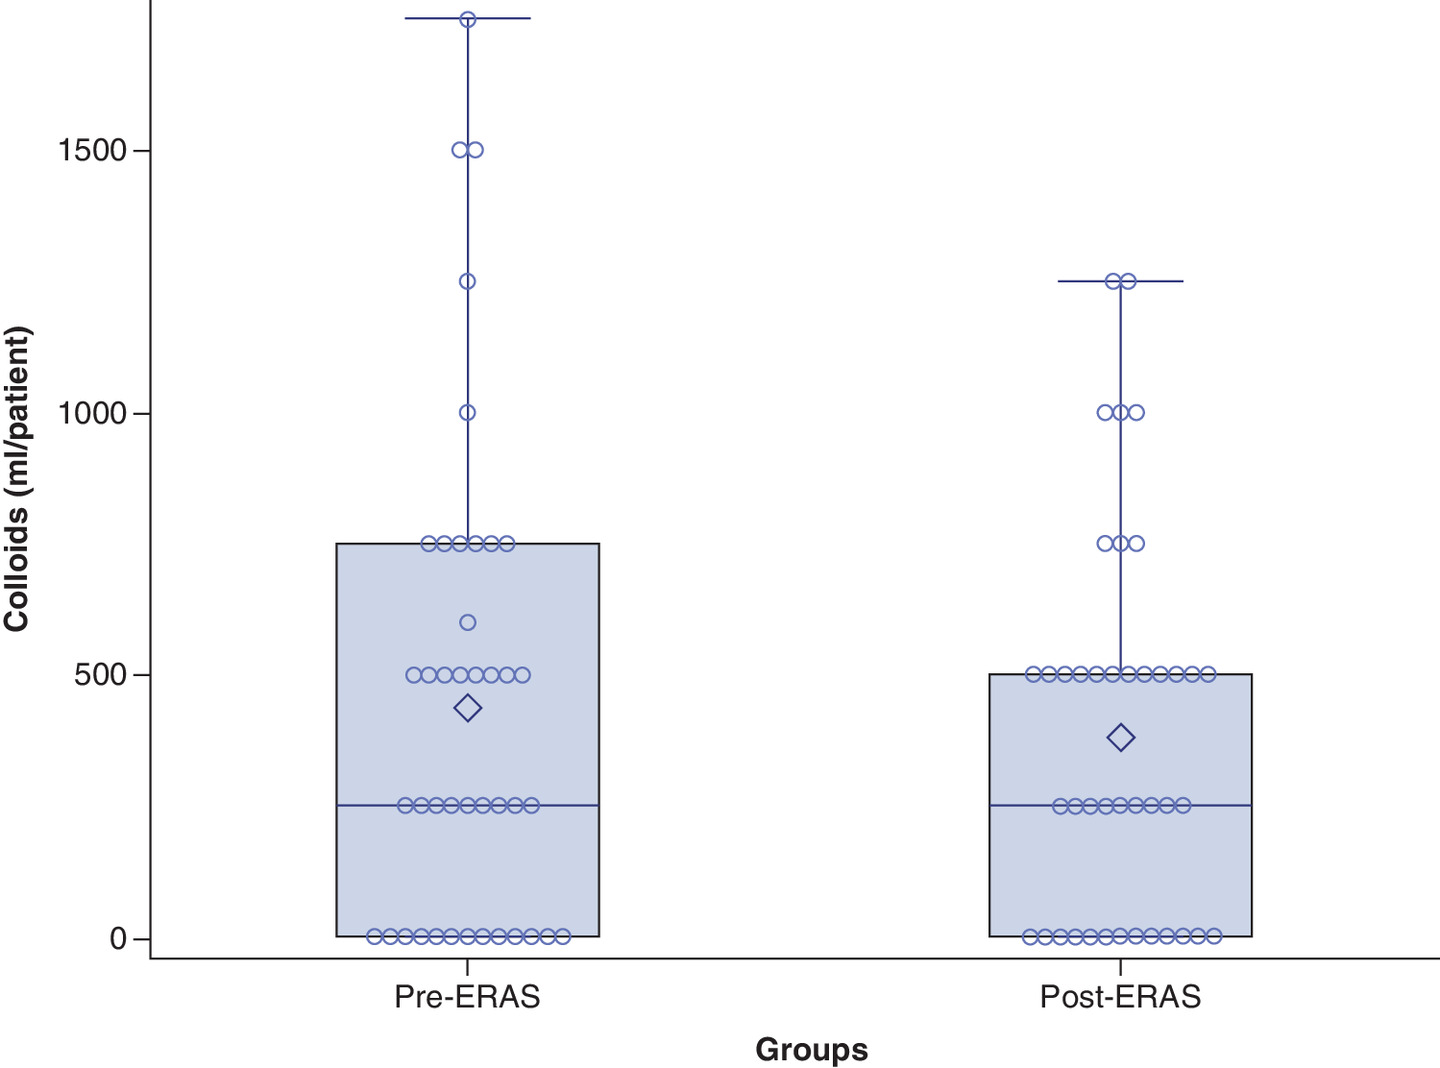
Figure 2. Colloid administration across groups.
Boxplot displaying the median and IQR for colloids administered to patients in each group. Colloid administration is displayed as ml/patient. Data from the pre-ERAS group show a wider IQR with more values at the higher end of the distribution.
ERAS: Enhanced recovery after surgery; IQR: Interquartile range.
In a study using regression models to evaluate sources of variation in anesthetic drug costs, Wanderer et al. examined anesthetic records for patients undergoing eight types of surgical procedures at two institutions [22]. Although the majority of variation could not be described by their models, the largest sources of variation included attending anesthesiologist, procedure type and case duration. While procedure type and case duration are not easily modifiable sources of variation, practice patterns among attending anesthesiologists are open to modification. In their study, with all other variables held constant, the average change in cost between attending anesthesiologists ranged from a cost decrease of $41.25 USD to a cost increase of $95.67 USD when compared with the provider with the median value for mean cost-per-case [22]. Depending on the scale of operations, the magnitude of cost savings from practice modification could be considerable. Distinct from providers, that unexplained factors represented the greatest amount of observed variation in their study suggests there exists considerable variation resulting from either unmeasured influences or random per-case variation. We observed a similar pattern in our data. The results of our regression analysis were unable to identify a single variable that accounted for the difference in cost between our groups. Overall, protocol-driven care may help to reduce hidden sources of variation (and subsequently cost), even if the mechanisms by which they do so are not immediately apparent.
There was an increase in the number of patients in the post-ERAS group who received sevoflurane as their volatile anesthetic agent while significantly more patients in the pre-ERAS group received desflurane. Within ERAS pathways for this patient population, there are no recommendations regarding the use of specific volatile agents. In order to facilitate a faster emergence, some guidelines suggest the use of short-acting inhalational agents such as sevoflurane or desflurane [23,24]. We did not advocate for the use of any one agent as these are the two volatiles that are routinely used at our institution. There are several methods to quantify volatile anesthetic consumption. One method involves weighing the vaporizer before and after use and taking the difference as the consumed amount. This practice requires advanced planning and a precise scale with a wide range of measurements [25]. Volatile anesthetic costs can be calculated using the vaporizer concentration, fresh gas flow rate, time, molecular weight, density and cost of the specific agent [25,26]. Unfortunately, our electronic medical records did not delineate these individual metrics. Given the historical nature of our study we were unable to calculate exact volatile agent usage. Consequently, we assigned a uniform volatile cost of $130.47 USD to patients who received desflurane and a $74.49 USD cost to patients who received sevoflurane. These values represented the costs for a full bottle of the respective agent. We classified each patient as having received only one volatile agent for their anesthetic. In cases where patients received multiple agents during the duration of the case, they were assigned the agent that they received for the longest amount of time. As shown in Table 3, even after removing all volatiles from our analysis, the median cost in the post-ERAS group was $46.06 USD lower than the pre-ERAS group, corresponding to a 19.5% reduction in cost. Therefore, we believe it was unlikely that the choice of volatile agent served as a major cost saving mechanism between the two groups.
There were procedure-related characteristics that may have contributed to our findings. Patients in the post-ERAS group underwent shorter anesthesia and surgery times compared with patients in the pre-ERAS group. With more time available, it stands to reason that providers could administer more medications and iv. fluids, thus increasing the total cost of the delivered anesthetic. However, when we analyzed our data on a per minute basis, our findings remained similar. The median cost per minute of anesthesia time was $0.06 USD lower in the post-ERAS group, corresponding to a 5.1% reduction in cost. Likewise, the median cost per minute of surgery time was $0.08 USD lower in the post-ERAS group, corresponding to a 5.0% reduction in cost.
It is unlikely that patient-related characteristics impacted our results. While there are sex-gender differences in the dose response to several anesthetic medications and the overall response to pain, all of the patients included in our study were female [27]. The normal aging process impacts the pharmacokinetics and pharmacodynamics of many anesthetic agents and in general, elderly patients have increased drug sensitivity. As such, providers are advised to administer smaller doses of medications when caring for this population [28]. This recommendation was unlikely to have influenced our results as patients in our study were of similar age. As with aging, the physiologic and anthropometric changes associated with obesity affect the pharmacokinetics and pharmacodynamics of anesthetic medications [29]. Drug doses are typically calculated using a patient’s actual bodyweight and patients in both groups were of similar bodyweight [30]. The ASA-PS classification system is commonly used by perioperative providers to estimate preoperative health status. The system includes six categories with increasing levels of patient impairment [31]. Although it is subjectively assigned, the ASA-PS has strong independent associations with postoperative complications and mortality across procedures [32]. We believe patients in our study were of similar preoperative health as there were no significant differences in ASA-PS classification scores for patients in the two groups.
Our study has several limitations. The study population was relatively small and consisted of a homogenous group of patients undergoing a specialized procedure at a single institution. Despite the recommendation for minimally invasive techniques in our ERAS protocol, a considerable number of procedures requiring an open surgical technique are still performed at our institution. This is most commonly done when the patient has a history of prior abdominal surgery or extensive disease, making a minimally invasive approach more technically challenging. This patient selection characteristic may limit the generalizability of our results. We were unable to accurately provide costs for volatile agent administration like some other pharmacoeconomic studies, however, our results remained similar even after removing volatiles from our calculation. We focused exclusively on medications that were administered in the preoperative and intraoperative phases and did not include any agents that were administered in the PACU. While we quantified the degree of patient health status using ASA-PS classification, it is possible that delineating a more detailed list of comorbidities may have better differentiated our two groups. Finally, when analyzing the impact of an initiative containing multiple interventions, it is difficult to discern which intervention yields positive results and which does not.
Conclusion
The results of this study demonstrate that implementation of our hysterectomy ERP was associated with a significant reduction in hospital LOS and a significant reduction in the total perioperative anesthetic medication cost. Our data indicate that ERAS protocols can improve clinical outcomes and lead to cost savings in these phases of care. The results provide evidence that ERAS programs can add unique value in the preoperative and intraoperative settings, separate from their impact on rates of postoperative complications and total cost of care.
•
While there is growing evidence that Enhanced Recovery After Surgery (ERAS) pathways contribute to total hospital cost savings, no studies have examined the impact of these pathways on perioperative medication-related costs.
•
This historical cohort study analyzed the impact of implementation of a hysterectomy ERAS pathway on clinical outcomes and the total cost of anesthetic medications.
•
Patients on the ERAS pathway had a significant improvement in their hospital length of stay versus those who were not on the ERAS pathway (median: 5.0 days; interquartile range [IQR]: 4.0–7.0 days vs median: 3.0 days; IQR: 3.0–4.0 days, median difference: -2.0 days, 95% CI: -2.5581, -1.4419, p < 0.0001).
•
Patients on the ERAS pathway were more likely to meet their postoperative clinical milestones and less likely to develop postoperative complications.
•
Patients on the ERAS pathway had a significant reduction in the total cost of their anesthetic medications (median: $325.20 USD; IQR: $256.12–430.65 vs median: $273.10; IQR: $220.63–370.59, median difference: -$40.76, 95% CI: -$130.39, $16.99, p = 0.047).
•
The median anesthetic medication cost for patients on the ERAS pathway remained lower when the data was analyzed by time units and by patient health status.
•
These findings provide evidence that ERAS programs can add unique value in the perioperative setting by both improving outcomes and decreasing costs.
•
Future studies should continue to examine how and where ERAS initiatives contribute to cost savings.
Author contributions
AD Street, JM Elia and BT Romito did study design; AD Street, JM Elia, BT Romito, MM McBroom, AJ Hamilton, JE Grundt and JMN Blackwell worked on data analysis and interpretation of results; manuscript writing and editing.
Acknowledgments
The authors are grateful to the members of the Division of Gynecologic Oncology at the University of Texas Southwestern Medical Center for their teamwork in making our ERAS protocol successful.
Financial & competing interests disclosure
The authors have no relevant affiliations or financial involvement with any organization or entity with a financial interest in or financial conflict with the subject matter or materials discussed in the manuscript. This includes employment, consultancies, honoraria, stock ownership or options, expert testimony, grants or patents received or pending, or royalties.
No writing assistance was utilized in the production of this manuscript.
Ethical conduct of research
The authors state that they have obtained appropriate IRB approval or have followed the principles outlined in the Declaration of Helsinki for all human or animal experimental investigations. The requirement for written informed consent was waived by the IRB as this was a historical study.
References
Papers of special note have been highlighted as: • of interest; •• of considerable interest
1.
Kehlet H. Multimodal approach to control postoperative pathophysiology and rehabilitation. Br. J. Anaesth. 78(5), 606–617 (1997).
2.
Nelson G, Dowdy SC, Lasala J et al. Enhanced recovery after surgery (ERAS®) in gynecologic oncology – Practical considerations for program development. Gynecol. Oncol. 147(3), 617–620 (2017).
3.
Miralpeix E, Nick AM, Meyer LA et al. A call for new standard of care in perioperative gynecologic oncology practice: impact of enhanced recovery after surgery (ERAS) programs. Gynecol. Oncol. 141(2), 371–378 (2016).
4.
Chase DM, Lopez S, Nguyen C, Pugmire GA, Monk BJ. A clinical pathway for postoperative management and early patient discharge: does it work in gynecologic oncology? Am. J. Obstet. Gynecol. 199(5), 541.e1–e7 (2008).
5.
Lu D, Wang X, Shi G. Perioperative enhanced recovery programmes for gynaecological cancer patients. Cochrane Database Syst. Rev. 2015(3), CD008239 (2015).
6.
Boitano TKL, Smith HJ, Rushton T et al. Impact of enhanced recovery after surgery (ERAS) protocol on gastrointestinal function in gynecologic oncology patients undergoing laparotomy. Gynecol. Oncol. 151(2), 282–286 (2018).
7.
Bisch SP, Wells T, Gramlich L et al. Enhanced Recovery After Surgery (ERAS) in gynecologic oncology: system-wide implementation and audit leads to improved value and patient outcomes. Gynecol. Oncol. 151(1), 117–123 (2018).
8.
Kalogera E, Bakkum-Gamez JN, Jankowski CJ et al. Enhanced recovery in gynecologic surgery. Obstet. Gynecol. 122(2 Pt 1), 319–328 (2013).
9.
Joliat GR, Ljungqvist O, Wasylak T, Peters O, Demartines N. Beyond surgery: clinical and economic impact of Enhanced Recovery After Surgery programs. BMC Health Serv. Res. 18(1), 1008 (2018).
• A review article discussing the reduction in complications and total costs associated with Enhanced Recovery After Surgery (ERAS) implementation for several surgical specialties.
10.
Nelson G, Kiyang LN, Crumley ET et al. Implementation of Enhanced Recovery After Surgery (ERAS) across a provincial healthcare system: the ERAS Alberta colorectal surgery experience. World J. Surg. 40(5), 1092–1103 (2016).
11.
Stowers MD, Lemanu DP, Hill AG. Health economics in Enhanced Recovery After Surgery programs. Can. J. Anaesth. 62(2), 219–230 (2015).
•• A systematic review of the impact of ERAS programs on cost that highlights the lack of long-term cost data.
12.
Relph S, Bell A, Sivashanmugarajan V et al. Cost effectiveness of enhanced recovery after surgery programme for vaginal hysterectomy: a comparison of pre and post-implementation expenditures. Int. J. Health Plann. Manage. 29(4), 399–406 (2014).
13.
Yoong W, Sivashanmugarajan V, Relph S et al. Can enhanced recovery pathways improve outcomes of vaginal hysterectomy? Cohort control study. J. Minim. Invasive Gynecol. 21(1), 83–89 (2014).
14.
Gerardi MA, Santillan A, Meisner B et al. A clinical pathway for patients undergoing primary cytoreductive surgery with rectosigmoid colectomy for advanced ovarian and primary peritoneal cancers. Gynecol. Oncol. 108(2), 282–286 (2008).
15.
Harrison RF, Li Y, Guzman A et al. Impact of implementation of an enhanced recovery program in gynecologic surgery on healthcare costs. Am. J. Obstet. Gynecol. 222(1), 66.e1–66.e9 (2020).
•• A retrospective cohort study of patients undergoing surgery for suspected gynecologic cancer using an ERAS pathway that showed a reduction in hospital charges and healthcare services.
16.
Branning G, Vater M. Healthcare spending: plenty of blame to go around. Am. Health Drug Benefits 9(8), 445–447 (2016).
17.
Badash I, Kleinman NP, Barr S, Jang J, Rahman S, Wu BW. Redefining health: the evolution of health ideas from antiquity to the era of value-based care. Cureus 9(2), e1018 (2017).
•• A review article that discusses the evolution of modern health care and proposes a novel definition for health that incorporates well-being, patient needs and value-based care.
18.
von Elm E, Altman DG, Egger M, Pocock SJ, Gotzsche PC, Vandenbroucke JP. Strengthening the Reporting of Observational Studies in Epidemiology (STROBE) statement: guidelines for reporting observational studies. BMJ 335(7624), 806–808 (2007).
19.
Mickey RM, Greenland S. The impact of confounder selection criteria on effect estimation. Am. J. Epidemiol. 129(1), 125–137 (1989).
20.
Bendel RB, Afifi AA. Comparison of stopping rules in forward “Stepwise” regression. J. Am. Stat. Assoc. 72(357), 46–53 (1977).
21.
Wijk L, Udumyan R, Pache B et al. International validation of Enhanced Recovery After Surgery Society guidelines on enhanced recovery for gynecologic surgery. Am. J. Obstet. Gynecol. 221(3), 237.e1–237.e11 (2019).
22.
Wanderer JP, Nelson SE, Hester DL et al. Sources of variation in anesthetic drug costs. Anesth. Analg. 126(4), 1241–1248 (2018).
• A real-world, observational study of anesthetic drug costs that identified sources of variation accounting for differences in costs.
23.
Nelson G, Bakkum-Gamez J, Kalogera E et al. Guidelines for perioperative care in gynecologic/oncology: Enhanced Recovery After Surgery (ERAS) Society recommendations-2019 update. Int. J. Gynecol. Cancer 29(4), 651–668 (2019).
•• Recently updated ERAS Society guidelines discussing the optimal perioperative care for patients undergoing gynecologic oncology surgery.
24.
White PF, Kehlet H, Neal JM, Schricker T, Carr DB, Carli F. The role of the anesthesiologist in fast-track surgery: from multimodal analgesia to perioperative medical care. Anesth. Analg. 104(6), 1380–1396 (2007).
25.
Biro P. Calculation of volatile anaesthetics consumption from agent concentration and fresh gas flow. Acta Anaesthesiol. Scand. 58(8), 968–972 (2014).
26.
Dion P. The cost of anaesthetic vapours. Can. J. Anaesth. 39(6), 633 (1992).
27.
Campesi I, Fois M, Franconi F. Sex and gender aspects in anesthetics and pain medication. In: Sex and Gender Differences in Pharmacology. Handb. Exp. Pharmacol. Regitz-Zagrosek V (Ed.). Springer, Berlin, Heidelberg, 265–278 (2013).
28.
Rivera R, Antognini JF. Perioperative drug therapy in elderly patients. Anesthesiology 110(5), 1176–1181 (2009).
29.
Ingrande J, Lemmens HJ. Anesthetic pharmacology and the morbidly obese patient. Curr. Anesthesiol. Rep. 3(1), 10–17 (2013).
30.
Barras M, Legg A. Drug dosing in obese adults. Aust. Prescr. 40(5), 189–193 (2017).
31.
Sankar A, Johnson SR, Beattie WS, Tait G, Wijeysundera DN. Reliability of the American Society of Anesthesiologists physical status scale in clinical practice. Br. J. Anaesth. 113(3), 424–432 (2014).
32.
Hackett NJ, De Oliveira GS, Jain UK, Kim JY. ASA class is a reliable independent predictor of medical complications and mortality following surgery. Int. J. Surg. 18, 184–190 (2015).
Information & Authors
Information
Published In
Pages: 1067 - 1077
PubMed: 33052053
Copyright
© 2020 Future Medicine Ltd.
History
Received: 7 July 2020
Accepted: 26 August 2020
Published online: 14 October 2020
Keywords:
Topics
Authors
Metrics & Citations
Metrics
Article Usage
Article usage data only available from February 2023. Historical article usage data, showing the number of article downloads, is available upon request.
Citations
How to Cite
The impact of implementation of a hysterectomy enhanced recovery pathway on anesthetic medication costs. (2020) Journal of Comparative Effectiveness Research. DOI: 10.2217/cer-2020-0142
Export citation
Select the citation format you wish to export for this article or chapter.
Citing Literature
- Jinxia Nian, Zhenming Li, Pinying Chen, Peiying Ye, Chenyin Liu, Enhanced recovery after surgery versus conventional postoperative care in patients undergoing hysterectomy: a systematic review and meta-analysis, Archives of Gynecology and Obstetrics, 10.1007/s00404-024-07475-5, 310, 1, (515-524), (2024).
- Megan G. Maxwell, Kehinde O. Odedosu, Bryan T. Romito, Preoperative Optimization and Intraoperative Enhanced Recovery Principles for Patients Undergoing Spine Surgery, Multidisciplinary Spine Care, 10.1007/978-3-031-04990-3_15, (355-379), (2022).
- Flora Martin, Nicolas Vautrin, Arpiné Ardzivian Elnar, Christophe Goetz, Antoine Bécret, Evaluation of the impact of an enhanced recovery after surgery (ERAS) programme on the quality of recovery in patients undergoing a scheduled hysterectomy: a prospective single-centre before-after study protocol (RAACHYS study), BMJ Open, 10.1136/bmjopen-2021-055822, 12, 4, (e055822), (2022).
- Haiwei Yu, Ziming Zhao, Xiuping Duan, Jian Zhou, Dechun Su, Ultrasound Image under Artificial Intelligence Algorithm to Evaluate the Intervention Effect of Accelerated Rehabilitation Surgery Nursing on Laparoscopic Hysterectomy, Computational Intelligence and Neuroscience, 10.1155/2022/9042954, 2022, (1-11), (2022).