Cost–effectiveness of empagliflozin compared with liraglutide based on cardiovascular outcome trials in Type II diabetes
Publication: Journal of Comparative Effectiveness Research
Abstract
Aim: Cost–effectiveness (CE) analysis of empagliflozin+standard of care (SoC) compared with SoC and liraglutide+SoC, in patients with Type II diabetes and established cardiovascular disease, was conducted using evidence from cardiovascular outcomes trials. Methods: The IQVIA Core Diabetes Model was calibrated to predict same outcomes observed in EMPA-REG OUTCOME and LEADER trials. Three-year observed cardiovascular events of SoC, empagliflozin+SoC and liraglutide+SoC were derived from EMPA-REG OUTCOME trial and an indirect comparison. Time horizon was 50 years and the UK payer perspective was taken. Results: Empagliflozin+SoC dominated liraglutide+SoC with greater quality-adjusted life years and reduced costs. Base-case incremental CE ratio of 6428 GBP/QALY was observed for empagliflozin+SoC versus SoC. Conclusion: Results suggest that empagliflozin+SoC is cost effective versus SoC and liraglutide+SoC.
Diabetes is a major global health issue with a prevalence of 463 million at present and is projected to reach 700 million by 2045 [1]. Patients with diabetes have an increased risk of developing macrovascular complications (cardiovascular disease [CVD], ischemic heart disease, peripheral vascular disease and cerebrovascular disease) and microvascular complications (retinopathy, nephropathy and neuropathy), among which cardiovascular (CV) conditions are considered to be the leading cause of both morbidity and mortality for patients with Type II diabetes (T2D) [1–3].
Several trials have demonstrated that there is a potential risk of heart failure (HF) associated with certain anti-diabetic medications such as thiazolidinediones [4].
In 2008, the US FDA released guidance on glucose-lowering treatments stating that, in addition to assessing their impact on HbA1c, long-term cardiovascular outcome (CVO) effects should also be studied and reported [5]. The European Medicines Agency also revised their guidelines in 2012, wherein new glucose-reducing therapies are required to provide CV safety evidence through large-scale cardiovascular outcome trials (CVOT) [6].
Subsequently, several CVOTs were conducted on glucose-reducing drugs like DPP-4 inhibitors [7–9], GLP-1 receptor agonists [10–13] and SGLT2 inhibitors [14,15]. The evidence generated by these CVOTs has confirmed that it is not only relevant to achieve and maintain target glycemic control (HbA1c) to avoid or delay the progression of diabetes [16], but also to reduce the risks of CV complications and CV death [17]. Empagliflozin, a selective inhibitor of SGLT2 and liraglutide, a GLP-1 analog, have been assessed in randomized, double-blind placebo-controlled trials assessing the CV risk in T2D patients.
The effect of empagliflozin on CVOs was assessed in the EMPA-REG OUTCOME trial [14] in patients with T2D and established CV disease. Patients were treated with 10 or 25 mg of empagliflozin or placebo, on top of SoC, over a median observation time of 3.1 years. The primary end points, in other words, death from CV causes, nonfatal myocardial infarction (MI), or nonfatal stroke, occurred in significantly fewer patients in the empagliflozin group than in the placebo group (hazard ratio [HR] = 0.86; p = 0.038). Empagliflozin resulted in a significantly lower risk of death from CV causes (HR: 0.62; p < 0.001), death from all causes (HR: 0.68; p < 0.001) and hospitalization for heart failure (HR: 0.65; p = 0.002) as compared with placebo [18–20].
The CV safety profile of liraglutide has been assessed in the LEADER trial in which T2D patients with high CV risk (vast majority with established CV disease) were randomly assigned to receive liraglutide or placebo as an add-on to SoC [11]. The primary outcomes, in other words, death from CV causes, nonfatal MI or nonfatal stroke occurred in significantly fewer patients in the liraglutide group than in the placebo group (HR: 0.87; p < 0.001 for noninferiority; p = 0.01 for superiority). Significantly fewer deaths from CV causes were reported in the liraglutide group than in the placebo group (HR: 0.78; p = 0.007). The risk of death from any cause was lower in the liraglutide group than in the placebo group (HR: 0.85; p = 0.02). The rates of nonfatal MI, nonfatal stroke and hospitalization due to HF were similar in the two arms of the study.
As healthcare resources are scarce, clinical and economic benefits need to be assessed before making any treatment recommendation. This study aimed to evaluate the cost–effectiveness (CE) of empagliflozin+SoC versus SoC alone and liraglutide+SoC in T2D patients with established CVD using the IQVIA Core Diabetes model (CDM).
Methods
IQVIA core diabetes model calibrated for cardiovascular outcomes trials
The IQVIA CDM is a web-based computer simulation model used to project long-term health economic outcomes of therapies commonly considered in the management of diabetes, for a range of economic analyses (CE, cost-utility, cost-benefit or cost of disease). Drug therapies, lifestyle interventions, public health programs, medical devices and surgical interventions can be modeled using the CDM. The basic structure of the CDM has been described by Palmer and colleagues in 2004 [21], and has been extensively validated against results from clinical and epidemiological studies [22]. The outcomes of analyses consist of life years (LYs), quality-adjusted life years (QALYs), cumulative incidence of diabetes-related complications, progression of physiologic parameters, direct medical costs and indirect costs.
For the current analysis, the standard version of CDM 9.0 was used and calibrated to reflect the outcomes observed in both EMPA-REG OUTCOME and LEADER trials. The data input structure and model codes were modified to calibrate the model for CVOTs [23]. First, the annual progression of risk factors for each treatment arm were programmed in the CDM for the initial cycles, according to the follow-up period and end points available in each trial. These risk factors included HbA1c, systolic blood pressure (SBP), diastolic blood pressure (DBP), low-density lipoprotein cholesterol (LDL), high-density lipoprotein cholesterol (HDL), hypoglycemia rates, body mass index (BMI) change and heart rate that were reported in both EMPA-REG OUTCOME and LEADER trials. The risk equations (REs) available in the CDM v9.0 predict diabetes complications and are dependent on the progression of these risk factors. The REs used in the model have been derived from UKPDS 68 [24], UKPDS 82 [25], Advance [26], Swedish national Diabetes Register [27,28], ARIC study [29], Fremantle [30] and PROCAM [31]. To identify which CDM RE was the best fit to predict the macrovascular complications reported in the EMPA-REG OUTCOME trial, a pre-analysis was conducted. The CDM analyses with a time horizon restricted to 3 years were run, to match the trial follow-up period. By comparing the predicted outcomes of CDM and the observed outcomes reported in the EMPA-REG OUTCOME trial, UKPDS 82 RE [25] was found to be the best fit.
The second step of the calibration was an iterative process to identify the best set of relative risk (RR) adjustments required to align the UKPDS 82 RE predictions to match the observed 3-year clinical outcomes. The selected outcomes for this analysis were primary and secondary MI, primary and secondary stroke, angina, HF, CV death, non-CV death, microalbuminuria and end stage renal disease (ESRD).
The observed outcomes from empagliflozin+SoC and SoC arms were taken from the EMPA-REG OUTCOME trial. Using the RR adjustments described in the indirect treatment comparison (ITC) [32], the corresponding outcomes for liraglutide+SoC were estimated (Table 1).
| Comparison Empagliflozin+SoC vs | Cardiovascular-related mortality | All-cause mortality | Composite end point | Hospitalization due to heart failure | Nonfatal stroke | Nonfatal myocardial infarction | ||
|---|---|---|---|---|---|---|---|---|
| Liraglutide+SoC | HR (95% Crl) | 0.80 (0.60, 1.06) | 0.80 (0.64, 1.00) | 0.99 (0.82, 1.18) | 0.75 (0.54, 1.03) | 1.39 (0.97, 2.01) | 0.99 (0.76, 1.30) | |
Data published from [32].
HR: Hazard ratio.
Since there was inconsistency in reporting certain end points in the CDM and the ITC, a number of assumptions were made (Supplementary Table 1); for example, renal outcomes were not reported in the ITC, so similar effects were assumed.
Patient data
Baseline characteristics of T2D patients with established CV disease were used in the model which were derived from the patients of the EMPA-REG OUTCOME trial at study onset [14] (Supplementary Table 2).
Clinical data
Treatment effects
The EMPA-REG OUTCOME and LEADER trials were designed to assess the effect of the investigational drug versus placebo as an add-on to background therapy on CV complications. The progression of risk factors over time (first year till the end of the trial period) were populated in the CDM as annual increments and aligned with each trial. The associated adverse event rates per treatment were taken from the respective trials (Table 2) [11,14,33]. It is important to note that the treatment effects described in each trial reflected the impact of both main therapy and the intensification of SoC, as specified in the study protocols.
| Treatment effects | Empagliflozin+SoC[14] | SoC[14] | Liraglutide+SoC[11] | Basal bolus[23,36] |
|---|---|---|---|---|
| HbA1c† | -0.58 | -0.1 | -1.37 | -0.828 |
| SBP† | -3.9 | -0.62 | -1.82 | 0 |
| DBP† | -1.72 | -0.78 | 0.17 | 0 |
| T-Chol† | 7.81 | 3.56 | 0 | 0 |
| HDL† | 1.81 | -0.09 | 0 | 0 |
| LDL† | 4.79 | 1.42 | 0 | 0 |
| TRIG† | 0 | 0 | 0 | 0 |
| BMI† | -0.64 | -0.04 | -0.88 | 0.32 |
| eGFR† | -0.16 | 0.18 | 0 | 0 |
| NSHE rate‡ | 13.62 | 13.98 | 289.12 | 2566.83 |
| SHE1 rate‡ | 0.44 | 0.56 | 8.24 | 23.81 |
| SHE2 rate‡ | 0.06 | 0.07 | 1.10 | 3.19 |
| GUI‡ | 10.53 | 8.95 | 8.95§ | – |
†
Effect on the surrogate end points is applied on the first year of treatment.
‡
Rate per 100 patient-year.
§
Aside HbA1c effect, all other end points are assumed to be equal to placebo described in the EMPA-REG OUTCOME trial.
BMI: Body mass index; DBP: Diastolic blood pressure; eGRFL: Estimated glomerular filtration rate; GUI: Genital and urinary tract infection; HbA1c: Glycated hemoglobin; HDL: High-density lipoprotein cholesterol; LDL: Low-density lipoprotein cholesterol; NSHE: Nonsevere hypoglycemic event; SBP: Systolic blood pressure; SHE: Severe hypoglycemic event; SoC: Standard of care; TChol: Total cholesterol; TRIG: Triglyceride.
In both EMPA-REG OUTCOME and LEADER trials, patients received high doses of combined glucose-lowering drugs. Background treatment intensification, considered in both trials, was performed at the discretion of the physicians according to patients' needs, with the purpose to have glycemia controlled to the same extent in the two arms. Thus, different combinations of glucose-lowering drugs such as sulphonylureas, metformin, glitazone, glinide and insulin were either administered at study initiation, or added, or escalated over the study duration. This was reflected in the treatment effect measured at the completion of both the CVOTs. In particular, background insulin was given to 50, 58 and 73% of patients receiving empagliflozin+SoC, SoC and liraglutide+SoC, respectively, at the end of the trial period. However, over the course of the studies, there was a relatively greater increase in the proportion of patients in the liraglutide+SoC arm (29%) as compared with the empagliflozin+SoC arm (3%).
Treatment duration/switch to second line
As CE analyses are lifelong and treatment strategies for T2D may change, it would not be suitable to apply the same reported combined therapies throughout the time horizon of 50 years. Therefore, treatment switch to next line of therapy was defined when HbA1c level reached 8.5%. Following the progression of HbA1c over time, treatment switch happened after 8 years for empagliflozin+SoC, and after 7 years for SoC alone. For liraglutide+SoC, treatment switch would occur after 13 years due to the steep initial decrease in HbA1c levels as reported in the LEADER trial (Figure 2). Due to differences in the background therapy pattern between EMPA-REG OUTCOME and LEADER trials (much more use of insulin in the latter), progression of HbA1c could be considered an unreliable predictor for the time of treatment escalation. Thus, it was assumed that treatment intensification with discontinuation of study drug after 8 years of treatment was also applicable to liraglutide.
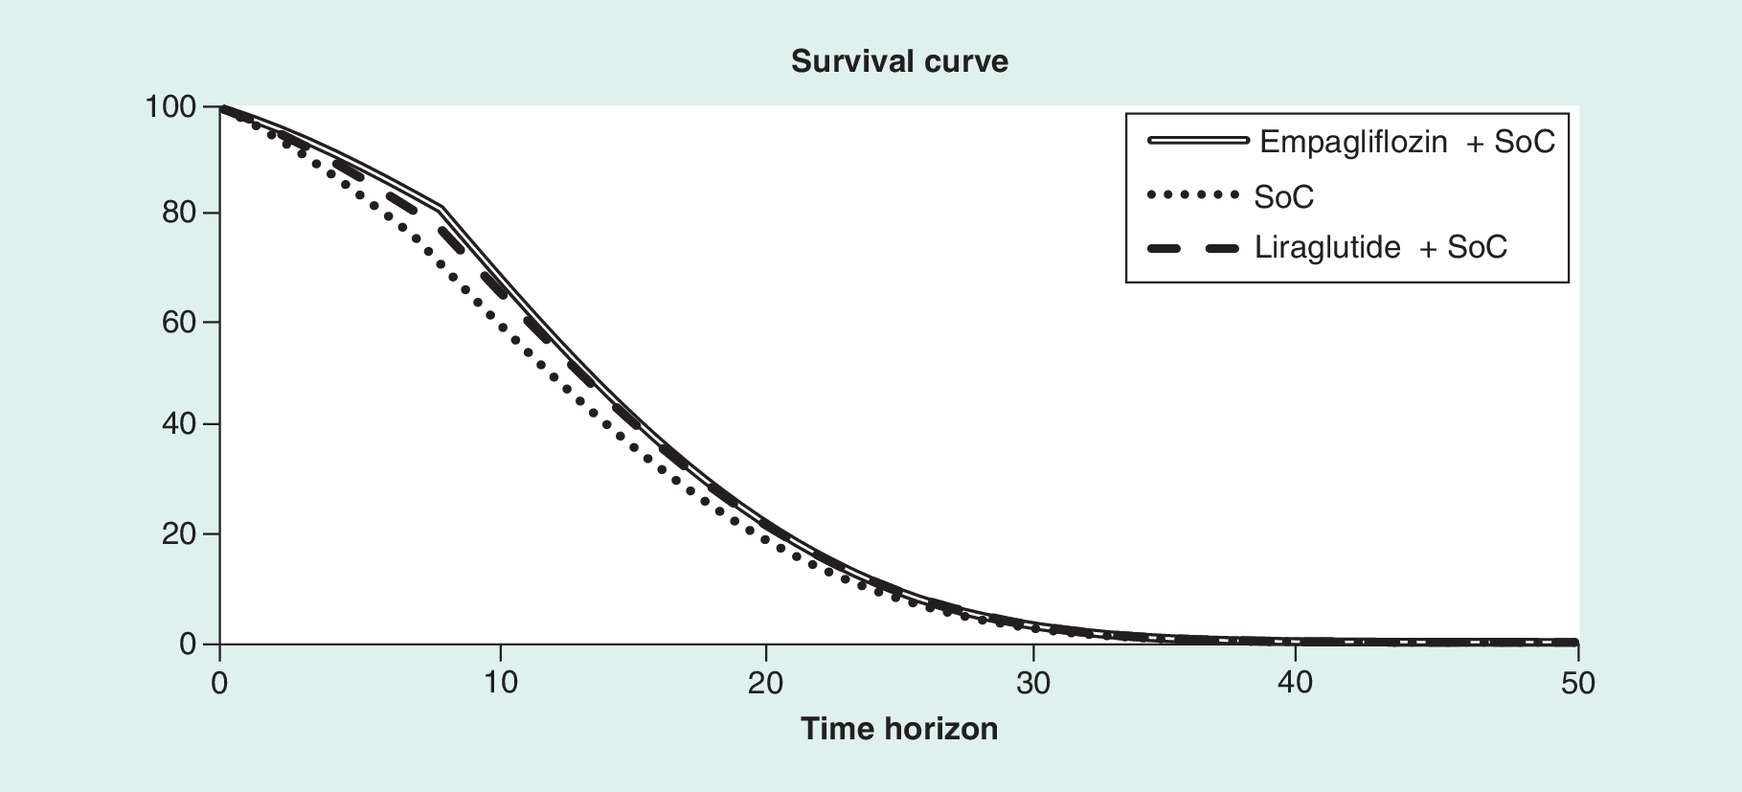
Figure 1. Lifetime survival of all therapies.
SoC: Standard of care.
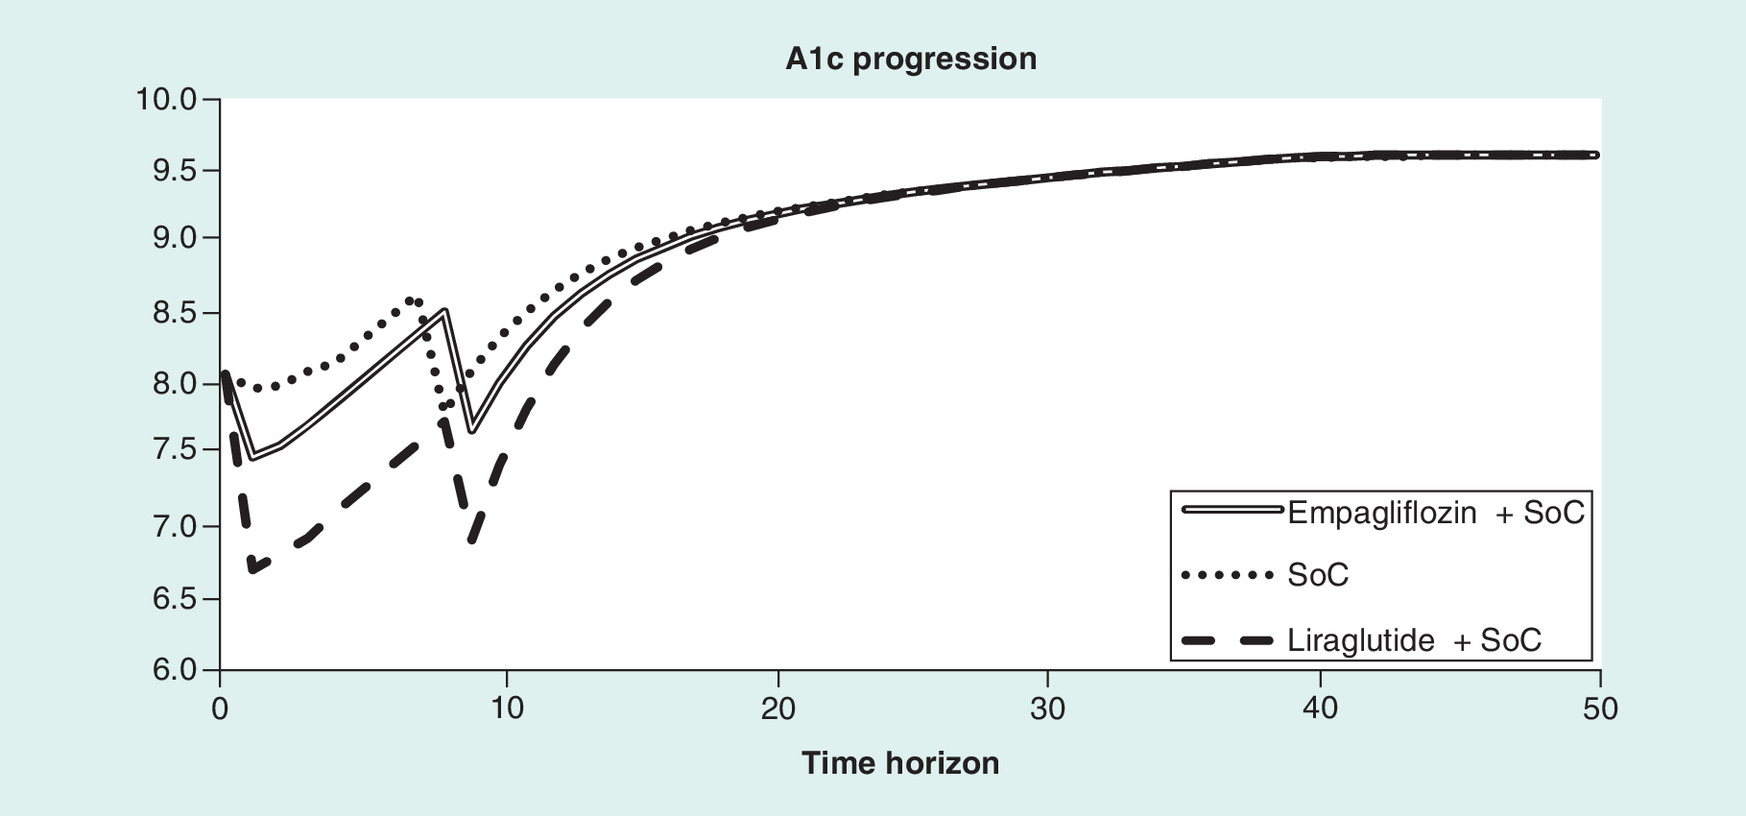
Figure 2. Progression of HbA1c over time.
SoC: Standard of care.
Given the duration of diabetes and the proportion of patients receiving background insulin at the end of both trials, a high dose of basal bolus insulin regimen, described by Riddle et al. 2014 was applied as the next line of treatment [36]. It consists of a high dose mealtime insulin (57 international unit [IU]) combined with high dose glargine (94 IU).
Up to treatment switch, the RRs described in the calibration section, were applied. After treatment switch, the treatment effects observed in the CVOTs were no longer considered, and the standard UKPDS 82 RE [25] without the calibrated RRs, was applied to predict all CV outcomes.
Sensitivity analysis was performed to further explore the implications of these assumptions in the study outcomes.
Disease management
Clinical management information included costs associated with preventive medications such as aspirin, statins and angiotensin blocking agents, undergoing routine screening for diabetic complications and the sensitivity and specificity of the screening tests performed. Data on disease management costs were sourced from the published literature (Supplementary Table 4).
Cost data
The study considered UK healthcare payer perspective and only direct costs were included. The key cost inputs comprised cost of drugs, needles and the associated self-monitoring blood glucose (SMBG) strips, as applicable. Unit costs were extracted from the British National Formulary (BNF) and Monthly Index of Medical Specialities (MIMS) [34,37]. Cost of background insulin therapy was considered as an additive cost to the treatment alternatives under assessment. Since the proportion of patients receiving this additional medication varied from the start to the end of the trials, distinct annual treatment costs of each therapy was included for first year and subsequent years (Table 3). The impact of this cost on the results was explored in sensitivity analysis. Cost of diabetes-related complications was also considered as direct costs and were deduced from the published literature (Supplementary Table 4). Costs associated with all other concomitant medications were excluded from the analysis. All costs were inflated to 2018 using the Hospital & Community Health Service (HCHS) Index from Personal Social Services Research Unit (PSSRU 2017) [35].
| Treatment | 1st year | Subsequent years |
|---|---|---|
| Empagliflozin+SoC | 816.65 | 833.97 |
| SoC | 343.60 | 406.11 |
| Liraglutide+SoC | 1741.88 | 1945.29 |
| Basal bolus | 1718.91 | 1718.91 |
SoC: Standard of care.
Utility data
The default CDM utility data were taken from Beaudet et al. 2014 [38]. A minimum approach was applied to estimate utilities, meaning that for a patient with a history of MI and stroke, the lowest utility value (i.e., associated to stroke event) was used. In addition, the impact of change in BMI on utility was estimated through the inclusion of a disutility of -0.0061 per unit gain in BMI for over 25 kg/m2, based on Bagust et al. 2005 [39]. It was assumed that BMI remained constant over time in all trial arms after treatment switch.
Analysis plan
Base case
A time horizon of 50 years was applied to estimate lifetime clinical and economic outcomes using nonparametric bootstrapping. Base-case analyses were run with 1000 hypothetical patients (generated randomly according to the baseline characteristics) for 1000 iterations. Costs and effects were discounted at an annual rate of 3.5%, as per the recommendations by the National Institute for Health and Care Excellence (NICE) [40].
Scenario analyses and probabilistic sensitivity analyses (PSA) were also conducted.
Scenarios
Key inputs and assumptions were varied to assess their impact on clinical and economic outcomes. These included scenarios where insulin cost from treatment costs were excluded, direct CVOT outcomes for 3 years followed by the standard UKPDS82 RE to predict events was applied, and time horizon of 5 years with CVOT outcomes. Furthermore, HbA1c threshold was altered from 8.5 to 9% for treatment switch, and the treatment duration of liraglutide was varied.
Probabilistic sensitivity analysis
The CDM uses Monte Carlo simulations with a nonparametric bootstrapping approach to capture parameter uncertainty. This process involves sampling of input parameters by distribution in each bootstrap iteration of the analysis. Cohort baseline values (age, duration of diabetes and baseline physiological parameter levels), treatment effects on physiological parameter levels, transition probabilities for events, health state utilities and event disutilities, as well as direct costs were subjected to random sampling. The outcomes were represented in the form of a CE scatter plot and the CE acceptability curve.
Results
Calibration
The observed and CDM projected outcomes are displayed in Table 4. Differences between the observed and projected outcomes were considered acceptable when below 5%, implying that the model has been calibrated to an acceptable degree of accuracy.
| Observed outcomes | From EMPA-REG OUTCOME trial | ITC | |
|---|---|---|---|
| Empagliflozin+SoC | SoC | Liraglutide+SoC | |
| Death from any cause | 5.82 | 8.58 | 7.28 |
| Death from cardiovascular causes | 3.72 | 6.06 | 4.65 |
| Myocardial infarction | 5.04 | 5.79 | 5.09 |
| Angina | 3.00 | 3.00 | 3.00 |
| Stroke | 3.69 | 3.15 | 2.72 |
| Heart failure | 2.82 | 4.35 | 3.76 |
| Microalbuminuria | 75.75 | 79.8 | 75.75 |
| Gross renal proteinuria | 12.54 | 19.47 | 12.54 |
| End-stage renal disease | 0.3 | 0.63 | 0.3 |
| Predicted outcomes | Empagliflozin+SoC | SoC | Liraglutide+SoC |
| Death from any cause | 5.78 | 8.74 | 7.24 |
| Death from CV causes | 3.68 | 6.10 | 4.63 |
| Myocardial Infarction | 5.05 | 5.81 | 5.08 |
| Angina | 3.01 | 3.00 | 3.06 |
| Stroke | 3.70 | 3.18 | 2.71 |
| Heart failure | 2.83 | 4.34 | 3.79 |
| Microalbuminuria | 75.86 | 80.2 | 76.76 |
| Gross renal proteinuria | 12.34 | 15.9 | 9.17 |
| End-stage renal disease | 0.3 | 0.63 | 0.28 |
CV: Cardiovascular; ITC: Indirect treatment comparison; SoC: Standard of care.
Base-case analysis
When compared with SoC alone, empagliflozin+SoC was associated with an increase in LYs (0.85) and QALYs (0.57), and higher direct lifetime costs (GPB 50,801 vs GPB 47,137; ΔGPB 3664), which resulted in an incremental cost–effectiveness ratio (ICER) of GPB 6428 per QALY gained. As ICER remained below the willingness-to-pay (WTP) threshold of GBP 20,000 per QALY as recommended by NICE, empagliflozin+SoC was deemed cost effective in comparison to SoC alone [40]. When compared with liraglutide+SoC, empagliflozin+SoC was associated with an increase in LYs (0.23) and QALYs (0.22), but lower direct lifetime costs (GPB 50,801 vs GPB 54,185; ΔGPB 3384) (Table 5), which led to empagliflozin+SoC being dominant over liraglutide+SoC.
| Cost–effectiveness results per arm | Incremental cost–effectiveness results empaglifozin+SoC versus | SoC | Liraglutide+SoC |
|---|---|---|---|
| LY | 10.259 | 9.406 | 10.029 |
| QALY | 6.408 | 5.838 | 6.190 |
| Total costs | 50,801 | 47,137 | 54,185 |
| incremental cost–effectiveness of Empagliflozin+SoC vs | SoC | Liraglutide+SoC | |
| Incremental LY | 0.853 | 0.230 | |
| Incremental QALY | 0.570 | 0.218 | |
| Incremental total cost (GBP) | 3664 | -3384 | |
| ICER (GBP/QALY) | 6428 | Dominant | |
Cardiovascular outcomes till treatment switch.
ICER: Incremental cost–effectiveness ratio; ICUR: Incremental cost-utility ratio; LY: Life year; QALY: Quality-adjusted life year; SoC: Standard of care.
For the long-term outcomes, patients treated with empagliflozin+SoC were projected to have better survival compared with liraglutide+SoC and SoC alone (Figure 1). It should be noted that by having a better survival than liraglutide+SoC and SoC alone, more events are expected to happen (survival paradox) and, therefore, the cumulative incidence of events were reported over a shorter time period so that this effect is less evident.
For the short-term outcomes, patients receiving empagliflozin+SoC reported a lower incidence of HF but a higher incidence of stroke compared with liraglutide+SoC (Table 6). Compared with SoC alone, patients receiving empagliflozin+SoC had a lower incidence of CV and renal disease (Table 6). Overall, patients receiving empagliflozin+SoC had the lowest CV-related or non-CV-related mortality compared with liraglutide+SoC and SoC alone (Table 8).
| Clinical outcomes | Empagliflozin+SoC | SoC | Liraglutide+SoC |
|---|---|---|---|
| Cardiovascular disease | |||
| Peripheral vascular disease | 3.67 | 3.76 | 2.91 |
| Heart failure | 5.79 | 8.7 | 7.77 |
| Angina | 7.11 | 7.1 | 4.46 |
| Stroke | 3.41 | 2.99 | 2.43 |
| Myocardial infarction | 6.1 | 7.47 | 6.07 |
| Renal disease | |||
| Microalbuminuria | 91.41 | 92.58 | 91.65 |
| Gross proteinuria | 16.07 | 20.04 | 11.86 |
| End-stage renal disease | 1.08 | 2.1 | 1.09 |
| Eye disease | |||
| Background diabetic retinopathy | 4.55 | 5.49 | 3.27 |
| Proliferative diabetic retinopathy | 0.43 | 0.54 | 0.3 |
| Macular edema | 3.96 | 4.75 | 2.82 |
| Severe vision loss | 1.63 | 1.91 | 1.15 |
| Cataract | 2.52 | 2.65 | 2.13 |
| Ulcer/amputation/neuropathy | |||
| Ulcer | 0.9 | 0.99 | 0.82 |
| Recurrent ulcer | 0.81 | 0.84 | 0.8 |
| Amputation ulcer | 0.27 | 0.29 | 0.25 |
| Amputation rec ulcer | 0.04 | 0.04 | 0.04 |
| Neuropathy | 20.59 | 24.05 | 15.06 |
| Hypoglycemia (event/patient) | |||
| Non-severe hypoglycemia | 0.69 | 0.68 | 13.829 |
| Severe hypoglycemia (type 1) | 0.05 | 0.05 | 0.424 |
| Severe hypoglycemia (Type II) | 0.00 | 0.00 | 0.053 |
SoC: Standard of care.
| Breakdown of costs | Empagliflozin+SoC | SoC | Liraglutide+SoC |
|---|---|---|---|
| Total | 50,801 | 47,137 | 54,185 |
| Treatment | 13,017 | 9898 | 19,542 |
| Management | 581 | 532 | 568 |
| Cardiovascular disease | 24,097 | 21,926 | 22,853 |
| Renal disease | 10,517 | 12,245 | 8507 |
| Ulcer/amputation/neuropathy | 430 | 395 | 383 |
| Eye disease | 1025 | 1013 | 848 |
| NSHE | 479 | 478 | 537 |
| SHE (req. nonmed. assistance) | 504 | 500 | 702 |
| SHE (req. med. assistance) | 151 | 150 | 244 |
NSHE: Nonsevere hypoglycemic event; SHE: Severe hypoglycemic event; SoC: Standard of care.
| Cost–effectiveness results | Empagliflozin+SoC | SoC | Liraglutide+SoC |
|---|---|---|---|
| Insulin costs are excluded | |||
| LY | 10.259 | 9.406 | 10.029 |
| QALY | 6.408 | 5.838 | 6.190 |
| Total cost | 48,541 | 44,937 | 51,159 |
| ICER (GBP/QALY) | 6322 | Dominant | |
| Time horizon up to 5 years | |||
| LY | 4.254 | 4.118 | 4.201 |
| QALY | 2.789 | 2.688 | 2.685 |
| Total cost | 13,973 | 12,255 | 18,432 |
| ICER (GBP/QALY) | 17,007 | Dominant | |
| Mortality | |||
| CV-related | 6.70 | 11.18 | 7.87 |
| Non-CV related | 3.82 | 4.79 | 4.8 |
| All mortality | 10.52 | 15.97 | 12.67 |
| CVO up to 3 years | |||
| LY | 9.614 | 9.215 | 9.573 |
| QALY | 6.036 | 5.734 | 5.923 |
| Total cost | 44,592 | 43,392 | 48,846 |
| ICER (GBP/QALY) | 3972 | Dominant | |
| HbA1c threshold at 9% | |||
| LY | 10.742 | 9.539 | 10.354 |
| QALY | 6.776 | 5.984 | 6.428 |
| Total cost | 44,592 | 43,392 | 48,846 |
| ICER (GBP/QALY) | 8720 | Dominant | |
ICER provides data of emplagliflozin+SoC vs SoC or Liraglutide+SoC.
CV: Cardiovascular; CVO: Cardiovascular outcome; ICER: Incremental cost–effectiveness ratio; LY: Life year; QALY: Quality-adjusted life year; SoC: Standard of care.
In terms of costs, treatment with empagliflozin+SoC was associated with higher CVD costs compared with liraglutide+SoC and SoC alone. Treatment costs with liraglutide+SoC were higher than those with empagliflozin+SoC and SoC alone. As empagliflozin+SoC slowed down the progression of renal disease, the costs of treating these complications declined compared with SoC alone. Management costs were also higher compared with liraglutide+SoC and SoC alone due to longer survival in the empagliflozin+SoC arm (Table 7).
Scenario analyses
When the time horizon was limited to 5 years, empagliflozin+SoC led to additional LYs (0.136), QALYs (0.101) and total cost (GBP 1718) in comparison to SoC alone, thus resulting in an ICER of GBP 17,007 per QALY gained. Compared with liraglutide+SoC, empagliflozin+SoC led to additional LYs (0.053) and QALYs (0.104), but at a lower cost (GBP 4459), and thus continued to be dominant over liraglutide+SoC (Table 8). After applying the direct CVOT outcomes up to 3 years (time horizon of the EMPA-REG OUTCOME trial) [14], the ICER comparing empagliflozin+SoC versus SoC alone was GBP 3972 per QALY gained, based on an incremental cost of GBP 1200 and incremental LY and QALY of 0.399 and 0.302, respectively. Compared with liraglutide+SoC, empagliflozin+SoC remained dominant as a result of additional LYs and QALYs (0.041 and 0.113) and lower total cost attributed to empagliflozin+SoC (incremental cost: - GBP 4254) (Table 8). Similar results were observed after varying the treatment switch threshold from HbA1c 8.5 to 9% and excluding the cost of insulin therapy (Table 8). Overall, all ICERs remained under the threshold of 20,000GBP per QALY.
To assess the impact of treatment duration of liraglutide, an additional scenario analysis was conducted, with treatment switch occurring at 13 years (i.e., an additional 5 years of therapy, when liraglutide reaches the HbA1c threshold of 8.5%). In addition, CVOT outcome benefits were applied across the full treatment duration. This resulted in negative incremental LYs and QALYs (-0.102 and -0.038, respectively) but higher cost savings of GBP 9877 for empagliflozin+SoC as compared with liraglutide+SoC, positioning it in the south-western quadrant on the CE plane. The resulting ICER was above GBP 250,000 per QALY gain, thereby indicating empagliflozin+SoC as being cost effective compared with liraglutide+SoC (net monetary benefit >0).
Probabilistic sensitivity analyses
PSA showed that empagliflozin+SoC is a cost-effective therapy in 97% of the simulations versus SoC alone and in 91% of simulations versus liraglutide+SoC, for a WTP threshold of GPB 20,000 per QALY (Figures 3 & 4).
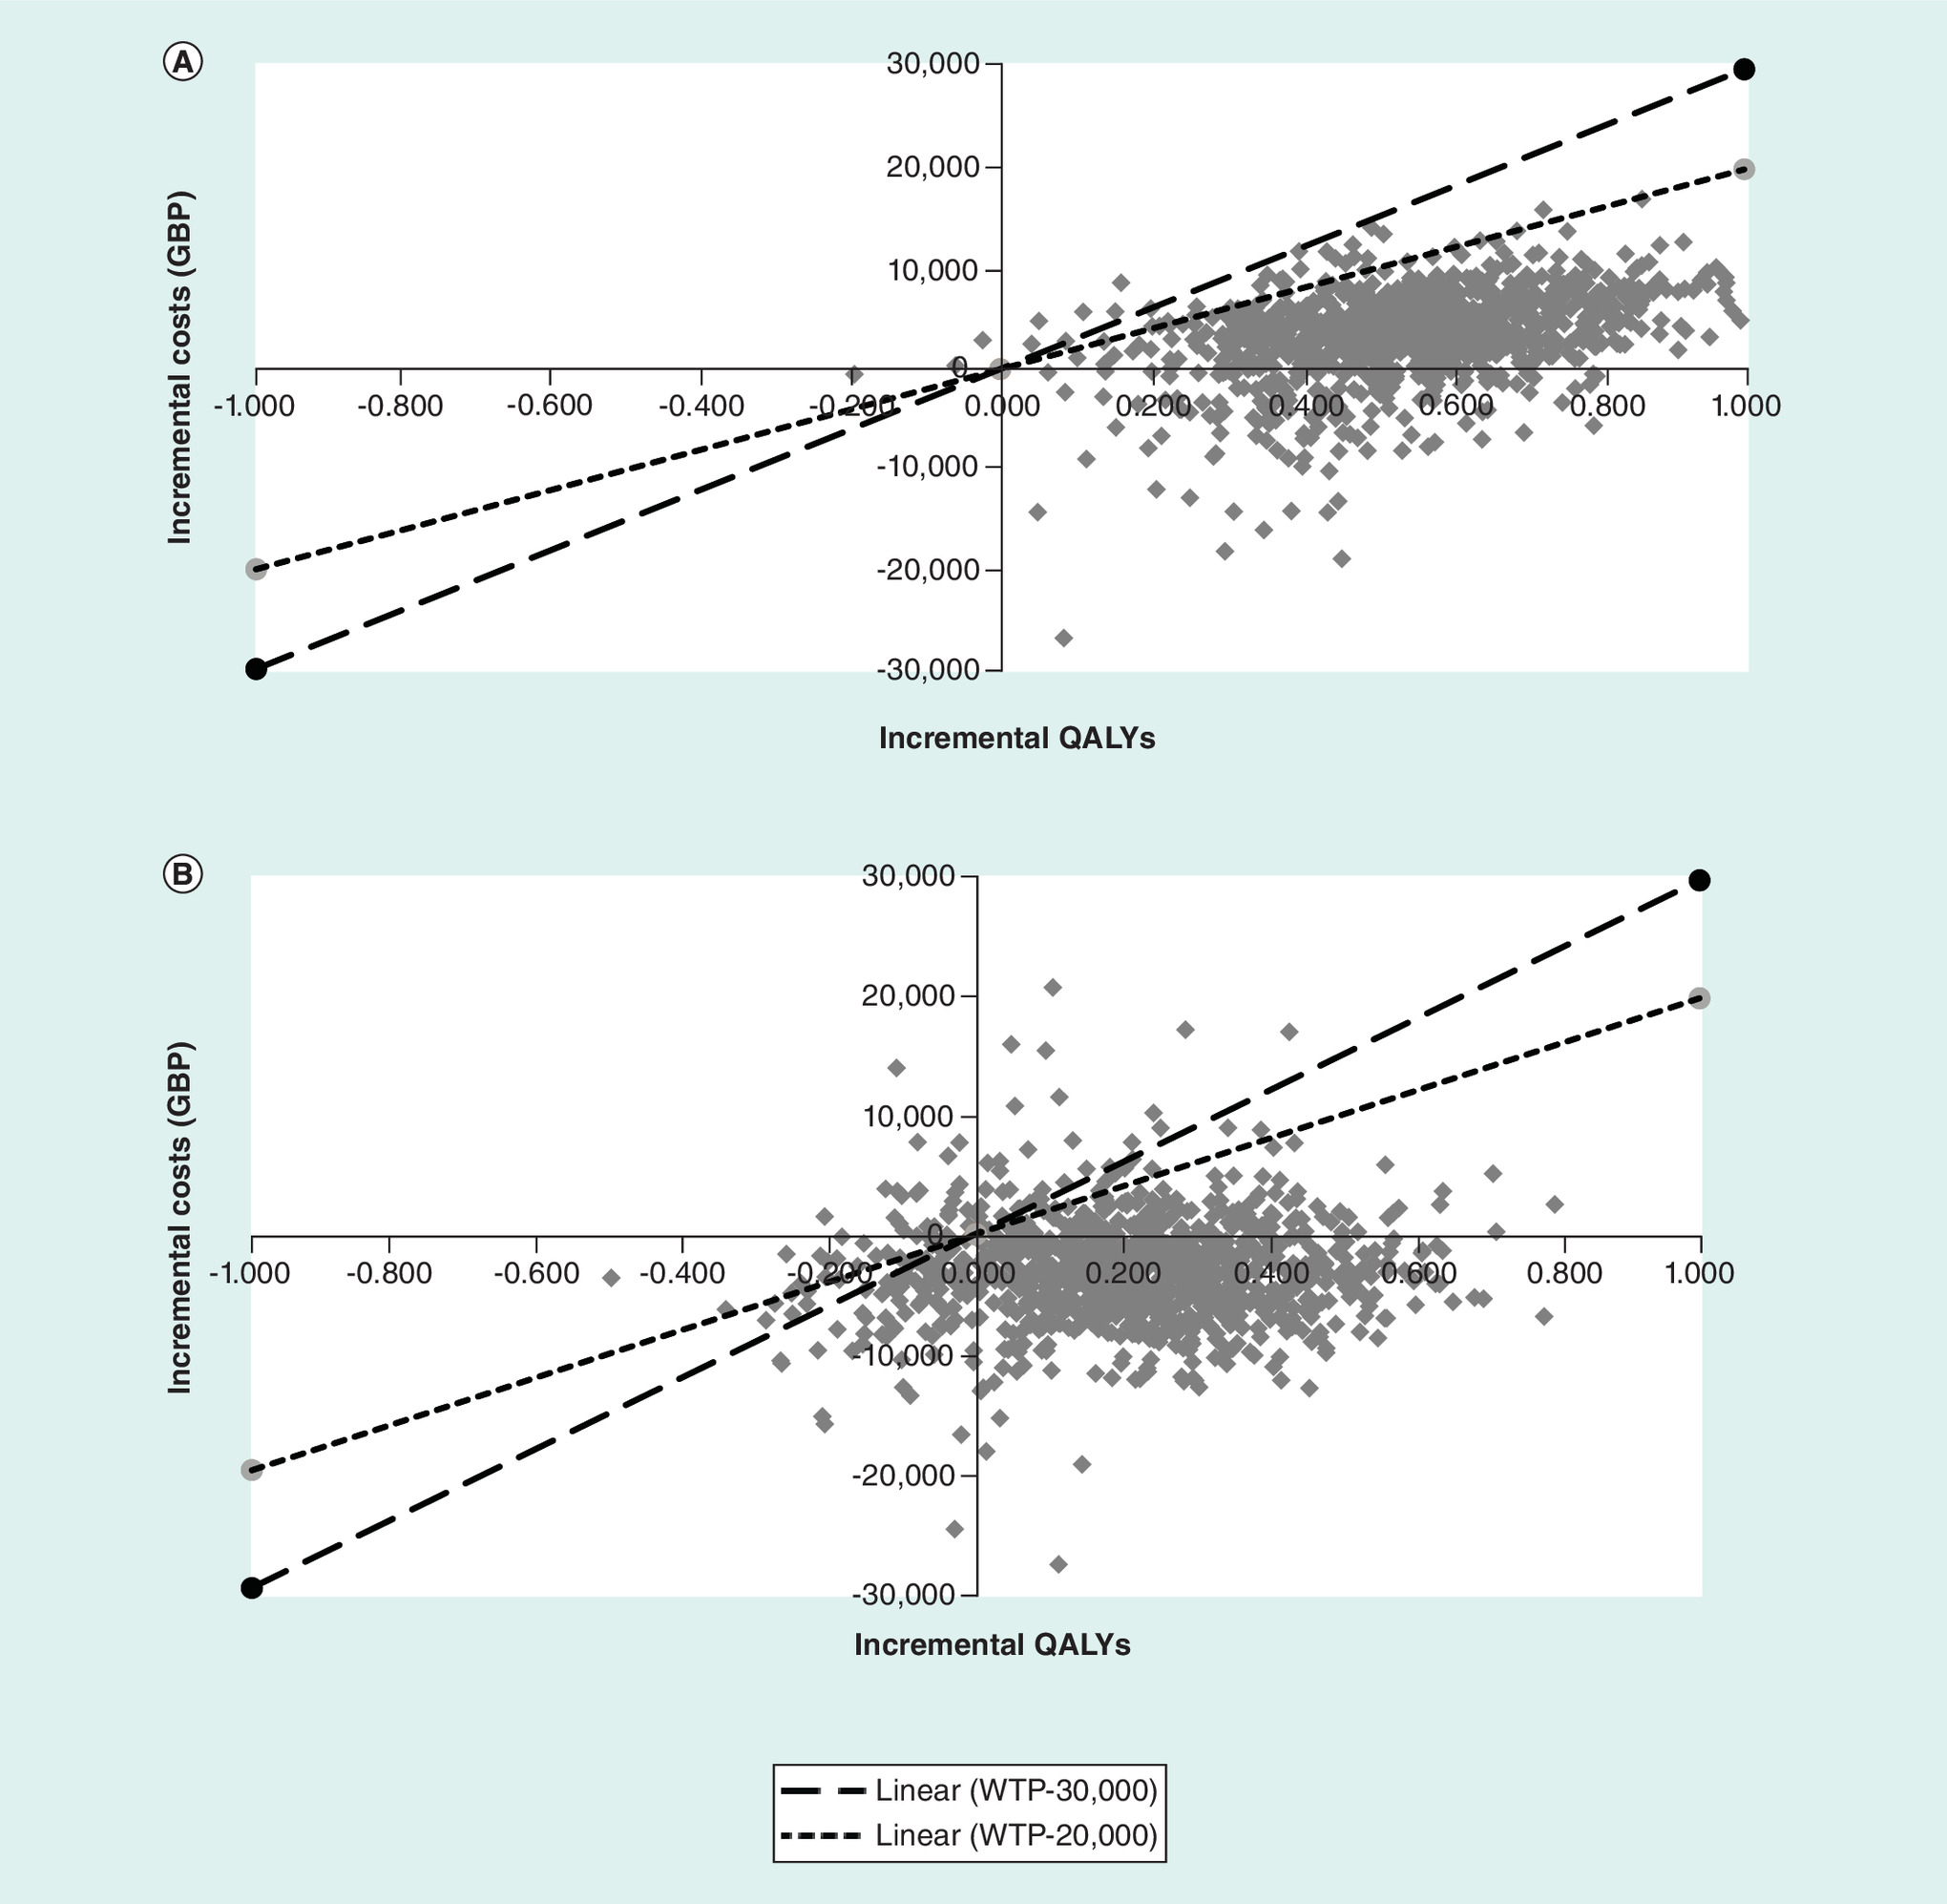
Figure 3. Cost–effectiveness scatter plot of empagliflozin+SoC versus SoC (A) and Liraglutide+SoC (B) (in terms of QALYs).
QALY: Quality adjusted life-year; SoC: Standard of care; WTP: Willingness to pay.
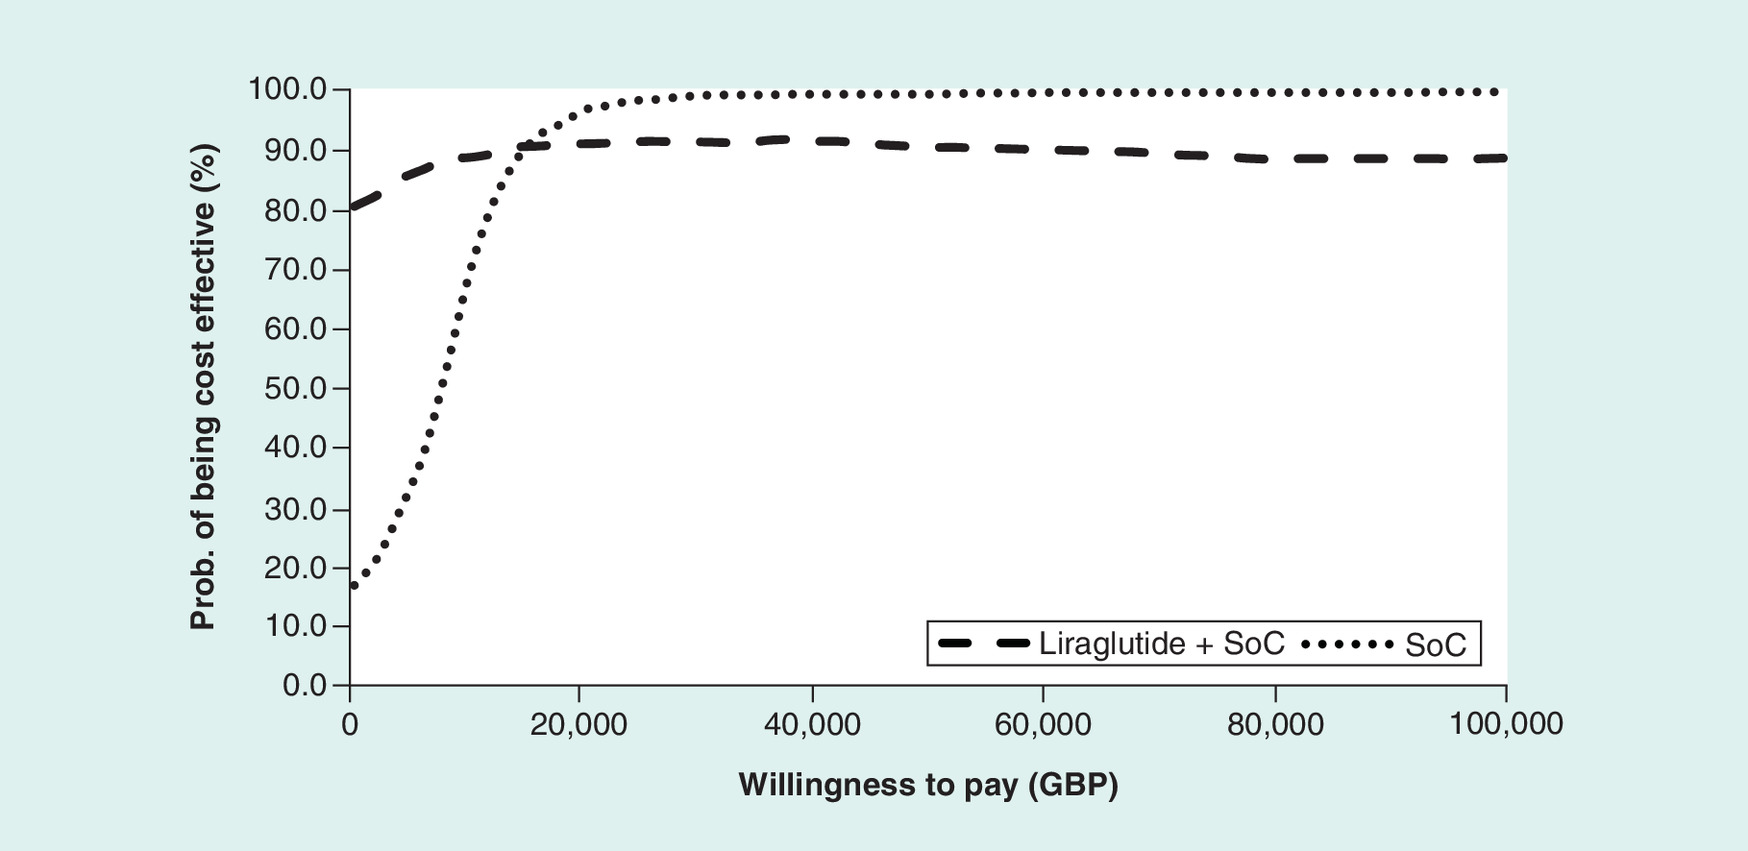
Figure 4. Cost–effectiveness acceptability curve of empagliflozin versus SoC and Liraglutide.
SoC: Standard of care.
Discussion
This study projects the outcomes of the EMPA-REG OUTCOME trial [14,33] and ITC [32] in patients with established CVD. The CDM version 9.0 was calibrated to project CV and renal outcomes that matched the results of CVOTs.
The base-case analysis demonstrated that empagliflozin+SoC is associated with improved LYs and QALYs compared with liraglutide+SoC and SoC alone. Empagliflozin+SoC was considered more effective since it reported the lowest CV-related or non-CV-related mortality compared with both liraglutide+SoC and SoC alone. In terms of costs, empagliflozin+SoC was costlier than SoC alone, which can be attributed to higher CVD costs and management costs. In contrast, the treatment costs in the liraglutide+SoC arm was higher than that in the empagliflozin+SoC and SoC alone arms. The resulting ICER for empagliflozin+SoC versus SoC alone was GPB 6428 per QALY gained, meaning that at the WTP threshold of GBP 20,000 per QALY gained, empagliflozin+SoC is considered cost effective versus SoC alone. Compared with liraglutide+SoC, empagliflozin can be considered dominant.
The scenario analyses performed in this study reported similar findings, confirming the robustness and the validity of the base-case analysis. In all scenarios (except longer treatment duration of liraglutide), empagliflozin+SoC remained cost effective compared with SoC alone and dominant versus liraglutide+SoC at a WTP threshold of GBP 20,000 per QALY. In the scenario where treatment duration of liraglutide was extended to 13 years, empagliflozin+SoC, despite, being associated with lower incremental LYs and QALYs, it was still cost effective as compared with liraglutide+ SoC due to increased cost savings. It should be noted that this scenario was introduced primarily to assess the impact of treatment duration of administering liraglutide than to assess the value of the drug. This extended treatment duration for liraglutide+SoC was prolonged due to a strong immediate decrease in HbA1c, followed by continuous treatment escalation as reported in the LEADER trial (with insulin), thereby, delaying the progression of HbA1c over the study period.
Furthermore, when fixing the time horizon at 5 years, short-term clinical benefits of empagliflozin+SoC confirmed lower CV and non-CV events and HF events; however, lifetime analyses showed that these benefits were partly offset by the extended life expectancy and prolonged exposure to diabetes complications (‘survival paradox’). As a result of higher survival, both complications and management costs were greater in the empagliflozin+SoC arm compared with both liraglutide+SoC and SoC alone.
The PSA findings also confirmed the robustness of the results. In most simulations (at least 90 and 83%), empagliflozin+SoC is a cost-effective therapy compared with both SoC alone and liraglutide+SoC respectively and dominant over liraglutide+SoC in 69% of simulations.
Recently, several health economic studies have been published based on the EMPA-REG OUTCOME trial [23,41–46] demonstrating that empagliflozin is a cost-effective therapy in patients with diabetes and established CVD. Another study also used the CDM 9.0 with calibration to study empagliflozin in patients with T2D, free of a history of CVD [47]. Similar to the current study, both studies also demonstrated that with the existing evidence on the impact of drugs on CV and renal outcomes, calibration of the CDM is valuable option to assess and compare the long-term and short-term clinical and economic benefits of medications.
Due to the absence of head-to-head clinical trials between empagliflozin and liraglutide, the present study inherited some limitations by obtaining relative efficacy of the comparators via ITC [32]. Authors described some drawbacks related to its methodology, as a consequence of the existing differences across CVOTs. The same limitations apply also to the current economic analyses [23,32,48].
Nevertheless, the present study used a customized version of the CDM, to project the outcomes of different CVO trials and the ITC in the analyses. The CDM calibration process included a validation step, to ensure that the methodology used would allow the CDM to predict the trials' outcomes accurately at 3 years.
Conclusion
This study demonstrates that empagliflozin+SoC is a cost-effective treatment compared with SoC alone and dominant versus liraglutide+SoC in the management of patients with T2D with established CVD from the UK healthcare payer perspective. Sensitivity and scenario analyses confirmed the robustness of the base-case findings.
Future perspective
Typical diabetes disease models using well-established risk equations (REs) to predict diabetes complications need to be calibrated to project the outcomes of CVO trials. Calibrating for one drug in a class does not mean the calibration is valid for another drug in the same class. The evidence generated by clinical trials should be analysed in detail to pinpoint relevant physiological parameters/risk factors that explain differences between these trials and REs predictions. Also, to identify which drug class effects impact the human body. The CVO trials have a limited time horizon (maximum up to 4–5 years but most trials much less), thus, real world effectiveness data and observational studies could be used to confirm and validate CVO trials findings.
•
EMPA-REG OUTCOME and LEADER trials provide relevant information about the safety profile of empagliflozin and liraglutide as add-on to standard of care (SoC), in patients with established cardiovascular disease. The main outcomes of the cardiovascular outcome trials (CVOT) point toward cardiovascular and renal complications.
•
Using the treatment effects reported in these trials and the comparative evidence derived from an indirect treatment comparison, the Core Diabetes model was calibrated to be able to predict well the outcomes observed on the treatment alternatives (less than 5% variation).
•
In the calibration process, the UKPDS 82 REs was found to be the best option to predict diabetes complications.
•
The analysis assumed that CVOT benefits would apply while patients were on treatment. Several scenarios were added to assess the impact of this assumption.
•
Considering the background insulin therapy given to patients in both trials, the next line therapy was defined with high dose of basal bolus insulin.
•
In the short-term, empagliflozin+SoC was projected to reduce the risk of CV death, non-CV death and heart failure hospitalizations compared with SoC alone and liraglutide+SoC.
•
Treatment with empagliflozin resulted in additional life years (0.853, 0.230) and quality-adjusted life years (QALY) (0.570, 0.218), for an incremental cost of GBP(+3664–3384) compared with SoC alone and liraglutide+SoC, respectively.
•
The present analysis has demonstrated that empagliflozin+SoC is a cost-effective therapy compared with SoC alone and dominant compared with liraglutide+SoC from the UK healthcare payer perspective.
Supplementary data
To view the supplementary data that accompany this paper please visit the journal website at: Supplementary Material
Author contributions
All authors are responsible for the content of the manuscript, including the data collection and analyses. M Ramos, M Lamotte, A Ustyugova and N Hau contributed to the conception and design of the study, acquisition and review of data, analyses and interpretation of results. M Ramos and M Lamotte drafted the manuscript. A Ustyugova and N Hau revised it critically for important intellectual content and final approval of the version to be submitted.
Financial & competing interests disclosure
This study was sponsored by Boehringer Ingelheim International GmbH. IQVIA, the employer of M Ramos and M Lamotte received consulting fees for the adaptation of the Core Diabetes model. A Ustyugova and N Hau were full-time employees of Boehringer Ingelheim at the time the study was conducted. Part of the content of this manuscript was presented as a poster at the 2018 European ISPOR, held in Barcelona. The current health economic analysis was conducted based on the results of published clinical trials. The authors have no other relevant affiliations or financial involvement with any organization or entity with a financial interest in or financial conflict with the subject matter or materials discussed in the manuscript apart from those disclosed.
No writing assistance was utilized in the production of this manuscript.
Open access
This work is licensed under the Attribution-NonCommercial-NoDerivatives 4.0 Unported License. To view a copy of this license, visit http://creativecommons.org/licenses/by-nc-nd/4.0/
Supplementary Material
File (suppl_file.docx)
- Download
- 81.02 KB
References
Papers of special note have been highlighted as: • of interest
1.
International Diabetes Federation. IDF Diabetes Atlas, 9th Edition 2019 (2019). www.diabetesatlas.org/en/
2.
Emerging Risk Factors Collaboration, Sarwar N, Gao P, Kondapally Seshasai SR et al. Diabetes mellitus, fasting blood glucose concentration, and risk of vascular disease: a collaborative meta-analysis of 102 prospective studies. Lancet 375(9733), 2215–2222 (2010).
3.
Kondapally Seshasai SR, Kaptoge S, Thompson A et al. Diabetes mellitus, fasting glucose, and risk of cause-specific death. N. Engl. J. Med. 364(9), 829–841 (2011).
4.
Kaul S, Bolger AF, Herrington D, Giugliano RP, Eckel RH. Thiazolidinedione drugs and cardiovascular risks. Circulation 121(16), 1868–1877 (2010).
5.
Food and Drug Administration. Guidance for Industry on Diabetes Mellitus – Evaluating Cardiovascular Risk in New Antidiabetic Therapies to Treat Type II Diabetes (2008). www.federalregister.gov/documents/2008/12/19/E8-30086/guidance-for-industry-on-diabetes-mellitus-evaluating-cardiovascular-risk-in-new-antidiabetic
• Sets the need to evaluate diabetes therapies not only from the point of view of controlling blood glucose level, but also demands that industry provides safety data in terms of cardiovascular outcomes (CVO) on drugs. Since then, CVO trials have been designed and run to respond to both needs, in some of them including also other outcomes (e.g., renal outcomes).
6.
European Medicines Agency. Guideline on clinical investigation of medicinal products in the treatment or prevention of diabetes mellitus (2012). www.ema.europa.eu/en/documents/scientific-guideline/guideline-clinical-investigation-medicinal-products-treatment-prevention-diabetes-mellitus-revision_en.pdf
• Sets the need to evaluate diabetes therapies not only from the point of view of controlling blood glucose level, but also demands that industry provides safety data in terms of CVO on drugs. Since then, CVO trials have been designed and run to respond to both needs, in some of them including also other outcomes (e.g., renal outcomes).
7.
Scirica BM, Bhatt DL, Braunwald E et al. Saxagliptin and cardiovascular outcomes in patients with Type II diabetes mellitus. N. Engl. J. Med. 369(14), 1317–1326 (2013).
8.
White WB, Cannon CP, Heller SR et al. Alogliptin after acute coronary syndrome in patients with Type II diabetes. N. Engl. J. Med. 369(14), 1327–1335 (2013).
9.
Green JB, Bethel MA, Armstrong PW et al. Effect of sitagliptin on cardiovascular outcomes in Type II diabetes. N. Engl. J. Med. 373(3), 232–242 (2015).
10.
Pfeffer MA, Claggett B, Diaz R et al. Lixisenatide in patients with Type II diabetes and acute coronary syndrome. N. Engl. J. Med. 373(23), 2247–2257 (2015).
11.
Marso SP, Daniels GH, Brown-Frandsen K et al. Liraglutide and cardiovascular outcomes in Type II diabetes. N. Engl. J. Med. 375(4), 311–322 (2016).
• Describes the efficacy of liraglutide versus standard of care that allowed to estimate the clinical outcomes in the liraglutide arm.
12.
Marso SP, Bain SC, Consoli A et al. Semaglutide and cardiovascular outcomes in patients with Type II diabetes. N. Engl. J. Med. 375(19), 1834–1844 (2016).
13.
Holman RR, Bethel MA, Mentz RJ et al. Effects of once-weekly exenatide on cardiovascular outcomes in Type II diabetes. N. Engl. J. Med. 377(13), 1228–1239 (2017).
14.
Zinman B, Wanner C, Lachin JM et al. Empagliflozin, cardiovascular outcomes, and mortality in Type II diabetes. N. Engl. J. Med. 373(22), 2117–2128 (2015).
• Describes the efficacy of empagliflozin versus standard of care in terms of changes in physiological parameters and CVD and renal outcomes.
15.
Neal B, Perkovic V, Mahaffey KW et al. Canagliflozin and cardiovascular and renal events in Type II diabetes. N. Engl. J. Med. 377(7), 644–657 (2017).
16.
Nathan DM, Buse JB, Davidson MB et al. Medical management of hyperglycemia in Type II diabetes: a consensus algorithm for the initiation and adjustment of therapy: a consensus statement of the American Diabetes Association and the European Association for the Study of Diabetes. Diabetes Care 32(1), 193–203 (2009).
17.
on behalf of the D&CVD EASD Study Group. Schnell O, Rydén L, Standl E, Ceriello A. Current perspectives on cardiovascular outcome trials in diabetes. Cardiovasc. Diabetol. 15(1), 139 (2016).
18.
Mudaliar S, Alloju S, Henry RR. Can a shift in fuel energetics explain the beneficial cardiorenal outcomes in the EMPA-REG OUTCOME Study? A unifying hypothesis. Diabetes Care 39(7), 1115–1122 (2016).
19.
Abdul-Ghani M, DeFronzo RA, Del Prato S, Chilton R, Singh R, Ryder REJ. Cardiovascular disease and Type II diabetes: has the dawn of a new era arrived? Diabetes Care 40(7), 813–820 (2017).
20.
Ferrannini E, Mark M, Mayoux E. CV protection in the EMPA-REG OUTCOME Trial: a “thrifty substrate” hypothesis. Diabetes Care 39(7), 1108–1114 (2016).
21.
Palmer AJ, Roze S, Valentine WJ et al. The CORE Diabetes Model: projecting long-term clinical outcomes, costs and cost–effectiveness of interventions in diabetes mellitus (Types 1 and 2) to support clinical and reimbursement decision-making. Curr. Med. Res. Opin. 20(Suppl. 1), S5–S26 (2004).
• Along with reference 22, one of the standard articles to describe the IQVIA Core Diabetes model, its structure and functionality and validation.
22.
McEwan P, Foos V, Palmer JL, Lamotte M, Lloyd A, Grant D. Validation of the IMS CORE diabetes model. Value Health 17(6), 714–724 (2014).
• Along with reference 21, one of the standard articles to describe the IQVIA Core Diabetes model, its structure and functionality and validation.
23.
Ramos M, Foos V, Ustyugova A, Hau N, Gandhi P, Lamotte M. Cost–effectiveness analysis of empagliflozin in comparison to sitagliptin and saxagliptin based on cardiovascular outcome trials in patients with Type II diabetes and established cardiovascular disease. Diabetes Ther. 10(6), 2153–2167 (2019).
24.
Clarke PM, Gray AM, Briggs A et al. A model to estimate the lifetime health outcomes of patients with Type II diabetes: the United Kingdom Prospective Diabetes Study (UKPDS) Outcomes Model (UKPDS no. 68). Diabetologia 47(10), 1747–1759 (2004).
25.
Hayes AJ, Leal J, Gray AM, Holman RR, Clarke PM. UKPDS Outcomes Model 2: a new version of a model to simulate lifetime health outcomes of patients with Type II diabetes mellitus using data from the 30 year United Kingdom Prospective Diabetes Study: UKPDS 82. Diabetologia 56(9), 1925–1933 (2013).
26.
Kengne AP, Patel A, Marre M et al. Contemporary model for cardiovascular risk prediction in people with Type II diabetes. Eur. J. Cardiovasc. Prev. Rehabil. 18(3), 393–398 (2011).
27.
Ahmad Kiadaliri A, Clarke PM, Gerdtham U-G et al. Predicting changes in cardiovascular risk factors in Type II diabetes in the post-UKPDS era: longitudinal analysis of the Swedish National Diabetes Register. J. Diabetes Res. 2013, 241347 (2013).
28.
Cederholm J, Eeg-Olofsson K, Eliasson B, Zethelius B, Nilsson PM, Gudbjörnsdottir S. Risk prediction of cardiovascular disease in Type II diabetes. Diabetes Care 31(10), 2038–2043 (2008).
29.
Folsom AR, Chambless LE, Duncan BB, Gilbert AC, Pankow JS. Atherosclerosis Risk in Communities Study Investigators. Prediction of coronary heart disease in middle-aged adults with diabetes. Diabetes Care 26(10), 2777–2784 (2003).
30.
Davis WA, Knuiman MW, Davis TME. An Australian cardiovascular risk equation for Type II diabetes: the Fremantle Diabetes Study. Intern. Med. J. 40(4), 286–292 (2010).
31.
Assmann G, Cullen P, Schulte H. Simple scoring scheme for calculating the risk of acute coronary events based on the 10-year follow-up of the prospective cardiovascular Münster (PROCAM) study. Circulation 105(3), 310–315 (2002).
32.
Balijepalli C, Ayers D, Kandaswamy P et al. Cardiovascular safety of empagliflozin versus glucagon-like peptide-1 (GLP-1) receptor agonists: systematic literature review and indirect comparisons (Abstract). Presented at: ISPOR Europe, Barcelona, Spain (2018).
33.
Wanner C, Inzucchi SE, Lachin JM et al. Empagliflozin and progression of kidney disease in Type II diabetes. N. Engl. J. Med. 375(4), 323–334 (2016).
• Describes the efficacy of empagliflozin versus standard of care in terms of changes in physiological parameters and CVD and renal outcomes.
34.
Database of prescription and generic drugs, clinical guidelines. MIMS online (2019). www.mims.co.uk/
35.
Personal Social Services Research Unit. Unit Costs of Health and Social Care 2017 (2017). www.pssru.ac.uk/project-pages/unit-costs/unit-costs-2017/
36.
Riddle MC, Bolli GB, Ziemen M et al. New insulin glargine 300 units/mL versus glargine 100 units/mL in people with Type II diabetes using basal and mealtime insulin: glucose control and hypoglycemia in a 6-month randomized controlled trial (EDITION 1). Diabetes Care 37(10), 2755–2762 (2014).
37.
BNF Publications. BNF Online (2020). www.bnf.org/products/bnf-online/
38.
Beaudet A, Clegg J, Thuresson P-O, Lloyd A, McEwan P. Review of utility values for economic modeling in Type II diabetes. Value Health 17(4), 462–470 (2014).
39.
Bagust A, Beale S. Modelling EuroQol health-related utility values for diabetic complications from CODE-2 data. Health Econ. 14(3), 217–230 (2005).
40.
NICE. Developing NICE guidelines: the manual (2014). www.nice.org.uk/process/pmg20/chapter/introduction-and-overview
41.
Daacke I, Kandaswamy P, Tebboth A, Kansal A, Reifsnider O. Cost–effectiveness of empagliflozin (Jardiance) in the treatment of patients with Type II diabetes mellitus (T2DM) in the UK based on EMPA-REG OUTCOME data. Value Health 19(7), A673 (2016).
42.
Gourzoulidis G, Tzanetakos C, Ioannidis I et al. Cost–effectiveness of empagliflozin for the treatment of patients with Type II diabetes mellitus at increased cardiovascular risk in Greece. Clin. Drug Investig. 38(5), 417–426 (2018).
43.
Iannazzo S, Mannucci E, Reifsnider O, Maggioni AP. Cost–effectiveness analysis of empagliflozin in the treatment of patients with Type II diabetes and established cardiovascular disease in Italy, based on the results of the EMPA-REG OUTCOME study. Farmeconomia Health Econ. Ther. Pathw. 18(1), (2017).
44.
Kansal A, Reifsnider O, Lee J et al. Cost–effectiveness analysis of empagliflozin compared with canagliflozin or standard of care (SoC) in patients with T2DM and established cardiovascular (CV) disease. Diabetes 67(Suppl. 1), 1294–P (2018).
45.
Mettam SR, Bajaj H, Kansal AR, Kandaswamy P. Cost–effectiveness of empagliflozin in patients with T2DM and high CV risk in Canada. Value Health 19(7), A674 (2016).
46.
Nguyen E, Coleman CI, Nair S, Weeda ER. Cost-utility of empagliflozin in patients with Type II diabetes at high cardiovascular risk. J. Diabetes Complications 32(2), 210–215 (2018).
47.
Lamotte M, Salem A, Mettam SR, Ustyugova AV, Zhang E, Ramos M. 1292-P: projected long-term clinical benefit and cost–effectiveness of empagliflozin compared with glimepiride in patients with Type II diabetes in China. Diabetes 68(Suppl. 1), 1292–P (2019).
48.
Balijepalli C, Shirali R, Kandaswamy P et al. Cardiovascular safety of empagliflozin versus dipeptidyl peptidase-4 (DPP-4) inhibitors in Type II diabetes: systematic literature review and indirect comparisons. Diabetes Ther. 9(4), 1491–1500 (2018).
Information & Authors
Information
Published In
Pages: 781 - 794
PubMed: 32573253
Copyright
© 2020 M Ramos, A Ustyugova, N Hau & M Lamotte. This work is licensed under the Attribution-NonCommercial-NoDerivatives 4.0 Unported License
History
Received: 6 May 2020
Accepted: 26 May 2020
Published online: 23 June 2020
Keywords:
Topics
Authors
Metrics & Citations
Metrics
Article Usage
Article usage data only available from February 2023. Historical article usage data, showing the number of article downloads, is available upon request.
Citations
How to Cite
Cost–effectiveness of empagliflozin compared with liraglutide based on cardiovascular outcome trials in Type II diabetes. (2020) Journal of Comparative Effectiveness Research. DOI: 10.2217/cer-2020-0071
Export citation
Select the citation format you wish to export for this article or chapter.
Citing Literature
- Ian W. Campbell, Kerstin M. G. Brand, Ulrike Gottwald-Hostalek, Julian Dettenbach, Evaluating Cost-Effectiveness in Relation to the Supporting Clinical Evidence Across the Type 2 Diabetes Continuum: A Review of Metformin and SGLT2is, Advances in Therapy, 10.1007/s12325-026-03592-6, (2026).
- Lu Wang, Yinglin Wang, Quan Zhao, Economic evaluation of sodium-glucose transporter 2 inhibitors compared with glucagon-like peptide 1 receptor agonist for the treatment of type 2 diabetes: a systematic review, European Journal of Clinical Pharmacology, 10.1007/s00228-026-04015-9, 82, 4, (2026).
- Kristoffer Nilsson, Adam Fridhammar, Riku Ota, Morten Sall Jensen, Michael Willis, Sofie Persson, Validation of the IHE type 2 diabetes cohort model in the Japanese clinical setting, Journal of Medical Economics, 10.1080/13696998.2025.2517506, 28, 1, (944-963), (2025).
- Mari Pesonen, Virpi Jylhä, Eila Kankaanpää, Adverse drug events in cost-effectiveness models of pharmacological interventions for diabetes, diabetic retinopathy, and diabetic macular edema: a scoping review, JBI Evidence Synthesis, 10.11124/JBIES-23-00511, 22, 11, (2194-2266), (2024).
- Henrik Vitus Bering Laursen, Emmelie Ploug Jørgensen, Peter Vestergaard, Lars Holger Ehlers, A Systematic Review of Cost-Effectiveness Studies of Newer Non-Insulin Antidiabetic Drugs: Trends in Decision-Analytical Models for Modelling of Type 2 Diabetes Mellitus, PharmacoEconomics, 10.1007/s40273-023-01268-5, 41, 11, (1469-1514), (2023).
- Gianni Ghetti, Lorenzo Pradelli, Giannis Papageorgiou, George Karpouzos, Yelda Arikan, CELESTIA: Cost-Effectiveness Analysis of Empagliflozin Versus Sitagliptin in Patients with Type 2 Diabetes in Greece, ClinicoEconomics and Outcomes Research, 10.2147/CEOR.S400522, Volume 15, (97-109), (2023).
- Kristoffer Nilsson, Emelie Andersson, Sofie Persson, Kristina Karlsdotter, Josefin Skogsberg, Staffan Gustavsson, Johan Jendle, Katarina Steen Carlsson, Model‐based predictions on health benefits and budget impact of implementing empagliflozin in people with type 2 diabetes and established cardiovascular disease, Diabetes, Obesity and Metabolism, 10.1111/dom.14921, 25, 3, (748-757), (2022).
- Marc Evans, Sasha Berry, Avideh Nazeri, Samuel JP Malkin, Donna Ashley, Barnaby Hunt, Stephen C Bain, The challenges and pitfalls of incorporating evidence from cardiovascular outcomes trials in health economic modelling of type 2 diabetes, Diabetes, Obesity and Metabolism, 10.1111/dom.14917, 25, 3, (639-648), (2022).
- Odette S. Reifsnider, Pratik Pimple, Sarah Brand, Evelien Bergrath Washington, Sharash Shetty, Nihar R. Desai, Cost‐effectiveness of second‐line empagliflozin versus liraglutide for type 2 diabetes in the United States , Diabetes, Obesity and Metabolism, 10.1111/dom.14625, 24, 4, (652-661), (2022).
- Margaret F Zupa, Ronald A Codario, Kenneth J Smith, Cost–effectiveness of empagliflozin versus weekly semaglutide as add-on therapy for Type 2 diabetes, Journal of Comparative Effectiveness Research, 10.2217/cer-2021-0016, 10, 15, (1133-1141), (2021).