Real-world switch patterns and healthcare costs in biologic-naive psoriasis patients initiating apremilast or biologics
Publication: Journal of Comparative Effectiveness Research
Abstract
Aim: Treatment switching and healthcare costs were compared among biologic-naive psoriasis patients initiating apremilast or biologics with ≥12 months pre-/post-index continuous enrollment in Optum Clinformatics™ Data Mart. Methods: After propensity score matching, switch rates (new therapy post-index) and days between index and switch were assessed. Total and per-patient per-month costs by service type were assessed. Results: Apremilast initiators (n = 533) were matched and compared with biologic initiators (n = 955). Twelve-month cumulative switch rates and days to switch were similar. Apremilast initiators had significantly lower total healthcare costs than biologic initiators; apremilast switchers and nonswitchers had significantly lower per-patient per-month costs than biologic switchers and nonswitchers, driven mainly by reduced outpatient pharmacy costs. Conclusion: Apremilast initiators had lower healthcare costs even with treatment switching.
Psoriasis, a chronic, systemic, inflammatory skin disease, affects an estimated 7.4 million adults in the USA [1]. Common symptoms of psoriasis (e.g., itching, scaling, flaking) can be bothersome and disabling, and many patients report psoriasis has a substantial impact on their quality of life and functioning [2–5]. Psoriasis is associated with chronic comorbid conditions such as psoriatic arthritis, Type 2 diabetes, hyperlipidemia, hypertension, cardiovascular disease, obesity and inflammatory bowel disease [6], which may contribute to reduced work capacity, anxiety, depression, social stigma and isolation [7], reduced life expectancy [6] and substantial economic burden [8]. Systematic reviews estimated the total annual direct cost of psoriasis at US$12.2 billion in 2013 [2,7].
Because psoriasis is a relapsing-remitting chronic condition, its management may require long-term treatment [9,10]. Topical therapies are commonly used as first-line treatment for patients with mild-to-moderate disease, but they may not provide adequate clearance of psoriatic lesions [10], and patients with moderate-to-severe psoriasis may be treated with phototherapy, nonbiologic systemic therapies or biologic agents [9,11]. Several biologic agents, including drugs targeting TNFα, IL-12, IL-23 and IL-17, have demonstrated efficacy in clinical trials and are approved by the US FDA for treatment of patients with moderate-to-severe plaque psoriasis [10,12], and the choice of an appropriate biologic therapy is often determined by the presence of comorbidities [13,14]. Long-term use of available systemic treatments and biologics may be associated with safety risks, including increased risk of infection, and require frequent monitoring [9,10,15,16]. Apremilast, an oral PDE4 inhibitor approved by the FDA in 2014, is indicated for treatment of adult patients with moderate-to-severe plaque psoriasis who are candidates for phototherapy or systemic therapy and for adult patients with active psoriatic arthritis [17]. Unlike biologic agents that target a single inflammatory mediator (eg, TNF-α), apremilast, through inhibition of PDE4, partially inhibits production of several cytokines implicated in the pathogenesis of psoriasis, such as TNF-α, IL-23, and interferon-γ [18–20]. In clinical trials, apremilast has demonstrated efficacy in managing psoriasis, with an acceptable safety profile versus placebo [21–24]. Adverse events most commonly reported in apremilast clinical trials include diarrhea, nausea, upper respiratory tract infection, nasopharyngitis, vomiting and headache [21,22].
Given the variable nature of psoriasis and its symptoms and the potential for disease progression, patients commonly switch therapies during long-term disease management [7,10,25]. A survey of 4862 patients with psoriasis conducted by the National Psoriasis Foundation reported that 52% were dissatisfied with their psoriasis treatment [26]. Large studies have identified side effects and loss of efficacy as the most common reasons why patients discontinue oral or biologic therapy for psoriasis [5,26,27]. Many patients also report cost as a reason for switching from biologic therapy [5,26,27]. Data regarding the economic impact of switching specific psoriasis treatments can help inform physicians when making treatment decisions and population health decision-makers (i.e., managed care organizations, employer groups, pharmacy benefit managers) when managing the utilization of and access to psoriasis treatments. Because dosing schedules, route of administration and healthcare costs can affect clinical outcomes, real-world evidence reflects overall treatment effectiveness and can complement clinical trial data. Such claims-based measures are not typically captured in clinical trials, and data comparing real-world treatment patterns and total cost of care with apremilast versus biologics are limited. A recent administrative claims-based analysis found that persistence rates were similar between biologic-naive patients initiating treatment for psoriasis with apremilast or a biologic [28]. In that study, treatment discontinuation, based on a >60-day gap in therapy, was the most common reason for nonpersistence, particularly among patients receiving apremilast; switching treatments was also a major reason for nonpersistence [28]. Regardless of whether patients were persistent or nonpersistent on treatment, apremilast demonstrated a significant cost advantage versus biologics in total healthcare costs from the payer perspective (including insurer and health plan payments, but not patient copayments, deductibles or co-insurance) [28]. Evaluating switching rates provides more detailed information than persistence or discontinuation rates on the economic impact of patients changing from one targeted psoriasis treatment to another. Understanding switching rates may be important from a population health management perspective to better predict and forecast drug spending. Data regarding trends in treatment switching can also increase understanding of the patients' journeys across different lines of therapy and may be of interest to physicians. Because the impact of switching therapies on the cost of treating psoriasis is a substantial concern for payers [29], more research is needed to characterize treatment patterns and healthcare costs for apremilast versus biologics. This study compared treatment switch patterns among biologic-naive psoriasis patients who initiated treatment with apremilast versus a biologic. A second objective was to evaluate the total cost of care in these two cohorts overall and by treatment switch status.
Patients & methods
Study design, data source & patient population
The current study uses a data source (Optum Clinformatics™ Data Mart [CDM]) and methodology (retrospective cohort) similar to a previous study [30] we conducted that examined treatment adherence, persistence and costs – but not switching patterns – for apremilast versus biologics. Complete details on the study design, CDM database and patient population for this study are reported in Wu et al. [30]. Briefly, biologic-naive patients who initiated treatment with apremilast or biologics agent between 1 January 2014 and 30 September 2016 were identified in the database. The date of treatment initiation was defined as the index date. Key inclusion criteria were age ≥18 years on the index date and at least two medical claims with an International Classification of Diseases, Ninth or Tenth Revision, Clinical Modification (ICD-9-CM or ICD-10-CM) diagnosis of psoriasis (ICD-9-CM code 696.1/ICD-10-CM code L40). Patients were excluded from this analysis if they had a diagnosis of psoriatic arthritis, other biologic-indicated autoimmune conditions or cancer (except nonmelanoma skin cancer).
Study outcomes
Outcomes analyzed in this study were treatment patterns (switch rate, days to switch and adherence while on index treatment) and healthcare costs (total and per-patient per-month [PPPM]) (2016 US$). A switch could be either a switch to a different treatment or the addition of a new treatment for combination therapy. The switch rate was defined as the cumulative proportion of patients who switched to a new treatment (apremilast or biologic) at 3, 6, 9, 12, 15, 18, 21 and 24 months after initiation of the index treatment. Addition of a new therapy (apremilast or biologic) to the index treatment was also captured within the switch rates. At 3, 6, 9 and 12 months, switch rates were calculated within the total post-matched patient sample; at 15, 18, 21 and 24 months, switch rates were calculated only within the subgroups of patients with ≥15 months, ≥18 months, ≥21 months and ≥24 months of post-index follow-up with full medical and pharmacy coverage, respectively. Number of days to switch was defined as the time from the date of initiation of the index treatment (apremilast or biologic) to the date of initiation of a new treatment. Adherence while on index treatment was calculated using the proportion of days covered (PDC; number of days in the period ‘covered’/number of days in the period; variable denominator) and medication possession ratio (MPR; total days supply in period/last fill date-first fill date+last fill date supply).
Healthcare costs were calculated using Optum's standard pricing methodology for all claims data in the CDM database and included inpatient admissions, outpatient visits or services (including emergency department visits, office visits and laboratory tests) and outpatient pharmacy claims. The standard pricing algorithm, applied to de-identified claims data, is used to estimate standard prices that reflect allowed payment amounts (i.e., the insurance payment amounts) across all provider services. Total healthcare costs at 6, 12 and 18 months were defined as the total sum of healthcare costs over a span of 6, 12 or 18 months since initiating treatment, and PPPM total healthcare costs were defined as the average total monthly healthcare costs while patients remained on the index treatment. Total and PPPM healthcare costs were calculated based on the 6-, 12- and 18-month post-index periods (within the total post-matched patient sample for the 6- and 12-month analyses and within a subgroup of patients with ≥18 months of post-index follow-up for the 18-month analysis). Healthcare costs were calculated and reported for the overall study population and for patients who switched and did not switch therapies; among those who switched, costs were calculated before and after the switch.
Statistical analysis
To adjust for possible selection bias within the database, patients in the apremilast and biologic cohorts were propensity score matched (up to 1:2) using the nearest neighbor matching with a caliper width equal to 0.2 of the standard deviation of the logit of the propensity score [31]. A 1:2 ratio was selected to increase statistical power and to maximize the number of apremilast and biologic users within the database. The propensity score was defined as the probability of being treated with apremilast given the baseline characteristics. Logistic regression was used to estimate the propensity score for individual patients with the following variables: age, gender, region, payer (commercial or Medicare Advantage), plan type, index year, prescriber specialty (dermatology, rheumatology, other), Charlson Comorbidity Index score, pre-index healthcare costs, number of prior systemic agents (i.e., acitretin, cyclosporine, methotrexate, sulfasalazine and leflunomide), corticosteroids and phototherapy. These measures were identified as variables that were possibly related to exposure cohort membership and outcomes and were selected based on the literature [28,29] and available data from the CDM database. P-value adjustments for multiple comparisons were not done as this was an observational study.
Patient demographics, clinical characteristics and treatment patterns between the apremilast and biologic cohorts were compared using a t-test for continuous variables and chi-square test for categorical variables. Variables were summarized descriptively using means and standard deviations for continuous variables and counts and percentages of patients for categorical variables; descriptive results were stratified by index agent and number of prior treatments. To account for patient-censoring criteria, Kaplan–Meier methodology was utilized to test for differences in switch rates between the apremilast and biologic cohorts. Wilcoxon rank-sum tests were used to evaluate cost differences for patients initiating apremilast compared with those initiating biologics. A p-value ≤0.05 was considered statistically significant.
Results
Patients
From the Optum CDM database, a total of 62,578 patients were identified as having a new treatment episode with apremilast or biologics for psoriasis between 1 January 2014 and 30 September 2016. After applying the inclusion and exclusion criteria, 2746 patients were eligible for the analysis (Figure 1). The apremilast and biologic patients were then propensity score matched to provide a final matched sample comprising 533 biologic-naive psoriasis patients initiating apremilast and 955 biologic-naive psoriasis patients initiating biologics. Biologic index therapies included adalimumab (n = 538), ustekinumab (n = 293), etanercept (n = 104), secukinumab (n = 14), infliximab (n = 4) and ixekizumab (n = 2).

Figure 1. Psoriasis patient disposition.
†Adalimumab, certolizumab (not approved for psoriasis at the time of study), etanercept, infliximab, ixekizumab, secukinumab and ustekinumab.
‡Ulcerative colitis, Crohn's disease, rheumatoid arthritis and other inflammatory polyarthropathies (Felty's syndrome), ankylosing spondylitis and juvenile idiopathic arthritis.
CDM: Clinformatics data mart; ICD-9-CM: International Classification of Diseases, Ninth Revision, Clinical Modification; ICD-10-CM: International Classification of Diseases, Tenth Revision, Clinical Modification.
Patient demographics and clinical characteristics are shown in Table 1. Prior to matching, the apremilast patients were generally older (49.2 vs 46.9 years; p = 0.0014) and had a higher prevalence of certain comorbidities (e.g., osteoarthritis [p = 0.0128], peptic ulcer disease/gastrointestinal bleeding [p = 0.0433]) compared with the biologic patients. After matching, baseline patient demographics and clinical characteristics, comorbidities and history of prior therapies were similar between cohorts. Mean age was 48.3 years in the apremilast cohort and 47.9 years in the biologic cohort, and there were 47.5 and 46.7% female patients in the apremilast and biologic cohorts, respectively. In both cohorts, the majority of patients were white and the most common comorbid conditions were hypertension and cardiovascular disease.
| Demographics & characteristics | Pre-match | Post-match | ||||
|---|---|---|---|---|---|---|
| Apremilast n = 585 | Biologics n = 1446 | p-value | Apremilast n = 533 | Biologics n = 955 | p-value | |
| Age, mean (SD), years | 49.2 (14.4) | 46.9 (14.6) | 0.0014 | 48.3 (14.2) | 47.9 (14.4) | 0.6529 |
| Female, n (%) | 267 (45.6) | 674 (46.6) | 0.6913 | 253 (47.5) | 446 (46.7) | 0.7766 |
| Race, n (%) | ||||||
| – Asian | 29 (5.0) | 66 (4.6) | 0.2791 | 28 (5.3) | 48 (5.0) | 0.9418 |
| – Black or African American | 38 (6.5) | 113 (7.8) | 35 (6.6) | 55 (5.8) | ||
| – White | 394 (67.4) | 978 (67.6) | 360 (67.5) | 659 (69.0) | ||
| – Hispanic | 68 (11.6) | 187 (12.9) | 63 (11.8) | 116 (12.2) | ||
| – Unknown | 56 (9.6) | 102 (7.1) | 47 (8.8) | 77 (8.1) | ||
| Geographic region, n (%) | ||||||
| – Northeast | 74 (12.7) | 146 (10.1) | 0.0059 | 60 (11.3) | 99 (10.4) | 0.8165 |
| – South | 237 (40.5) | 675 (46.7) | 226 (42.4) | 422 (44.2) | ||
| – Midwest | 157 (26.8) | 387 (26.8) | 150 (28.1) | 252 (26.4) | ||
| – West | 113 (19.3) | 237 (16.4) | 97 (18.2) | 181 (19.0) | ||
| – Unknown | 4 (0.7) | 1 (0.1) | 0 (0.0) | 1 (0.1) | ||
| Medicare Advantage, n (%) | 88 (15.0) | 203 (14.0) | 0.5587 | 78 (14.6) | 140 (14.7) | 0.9893 |
| Prescriber specialty, n (%) | ||||||
| – Dermatology | 349 (59.7) | 980 (67.8) | 0.0020 | 330 (61.9) | 610 (63.9) | 0.6036 |
| – Rheumatology | 6 (1.0) | 15 (1.0) | 5 (0.9) | 12 (1.3) | ||
| – Other/unknown | 230 (39.3) | 451 (31.2) | 198 (37.2) | 333 (34.9) | ||
| Baseline comorbid condition, n (%) | ||||||
| – Hypertension | 263 (45.0) | 620 (42.9) | 0.3917 | 228 (42.8) | 427 (44.7) | 0.4709 |
| – Cardiovascular disease | 183 (31.3) | 397 (27.5) | 0.0838 | 155 (29.1) | 289 (30.3) | 0.6331 |
| – Osteoarthritis | 120 (20.5) | 230 (15.9) | 0.0128 | 103 (19.3) | 156 (16.3) | 0.1448 |
| – Type 2 diabetes | 117 (20.0) | 280 (19.4) | 0.7433 | 100 (18.8) | 194 (20.3) | 0.4708 |
| – Anxiety | 115 (19.7) | 271 (18.7) | 0.6335 | 105 (19.7) | 191 (20.0) | 0.8894 |
| – Depression | 115 (19.7) | 299 (20.7) | 0.6055 | 102 (19.1) | 196 (20.5) | 0.5216 |
| – Headache | 100 (17.1) | 242 (16.7) | 0.8451 | 88 (16.5) | 160 (16.8) | 0.9038 |
| – Post-menopausal symptoms | 70 (12.0) | 152 (10.5) | 0.3416 | 64 (12.0) | 117 (12.3) | 0.8903 |
| – Fibromyalgia | 64 (10.9) | 143 (9.9) | 0.4784 | 53 (9.9) | 96 (10.1) | 0.9466 |
| – Peptic ulcer disease/gastrointestinal bleeding | 42 (7.2) | 71 (4.9) | 0.0433 | 38 (7.1) | 47 (4.9) | 0.0785 |
| – Moderate/severe renal disease | 35 (6.0) | 58 (4.0) | 0.0542 | 26 (4.9) | 40 (4.2) | 0.5356 |
| – Osteoporosis | 20 (3.4) | 51 (3.5) | 0.9043 | 19 (3.6) | 33 (3.5) | 0.9124 |
| – Hepatotoxicity | 15 (2.6) | 38 (2.6) | 0.9349 | 13 (2.4) | 20 (2.1) | 0.6650 |
| – Topical corticosteroid | 563 (96.2) | 1371 (94.8) | 0.1724 | 511 (95.9) | 916 (95.9) | 0.9674 |
| – Phototherapy | 118 (20.2) | 235 (16.3) | 0.0348 | 98 (18.4) | 161 (16.9) | 0.4561 |
| – Methotrexate | 79 (13.5) | 299 (20.7) | 0.0002 | 74 (13.9) | 149 (15.6) | 0.3732 |
| Total healthcare costs per month†, mean (standard deviation), US$ | 970 (2091) | 842 (1474) | 0.3200 | 825 (1431) | 875 (1577) | 0.6371 |
†
Costs were inflated to 2016 US$.
Treatment patterns
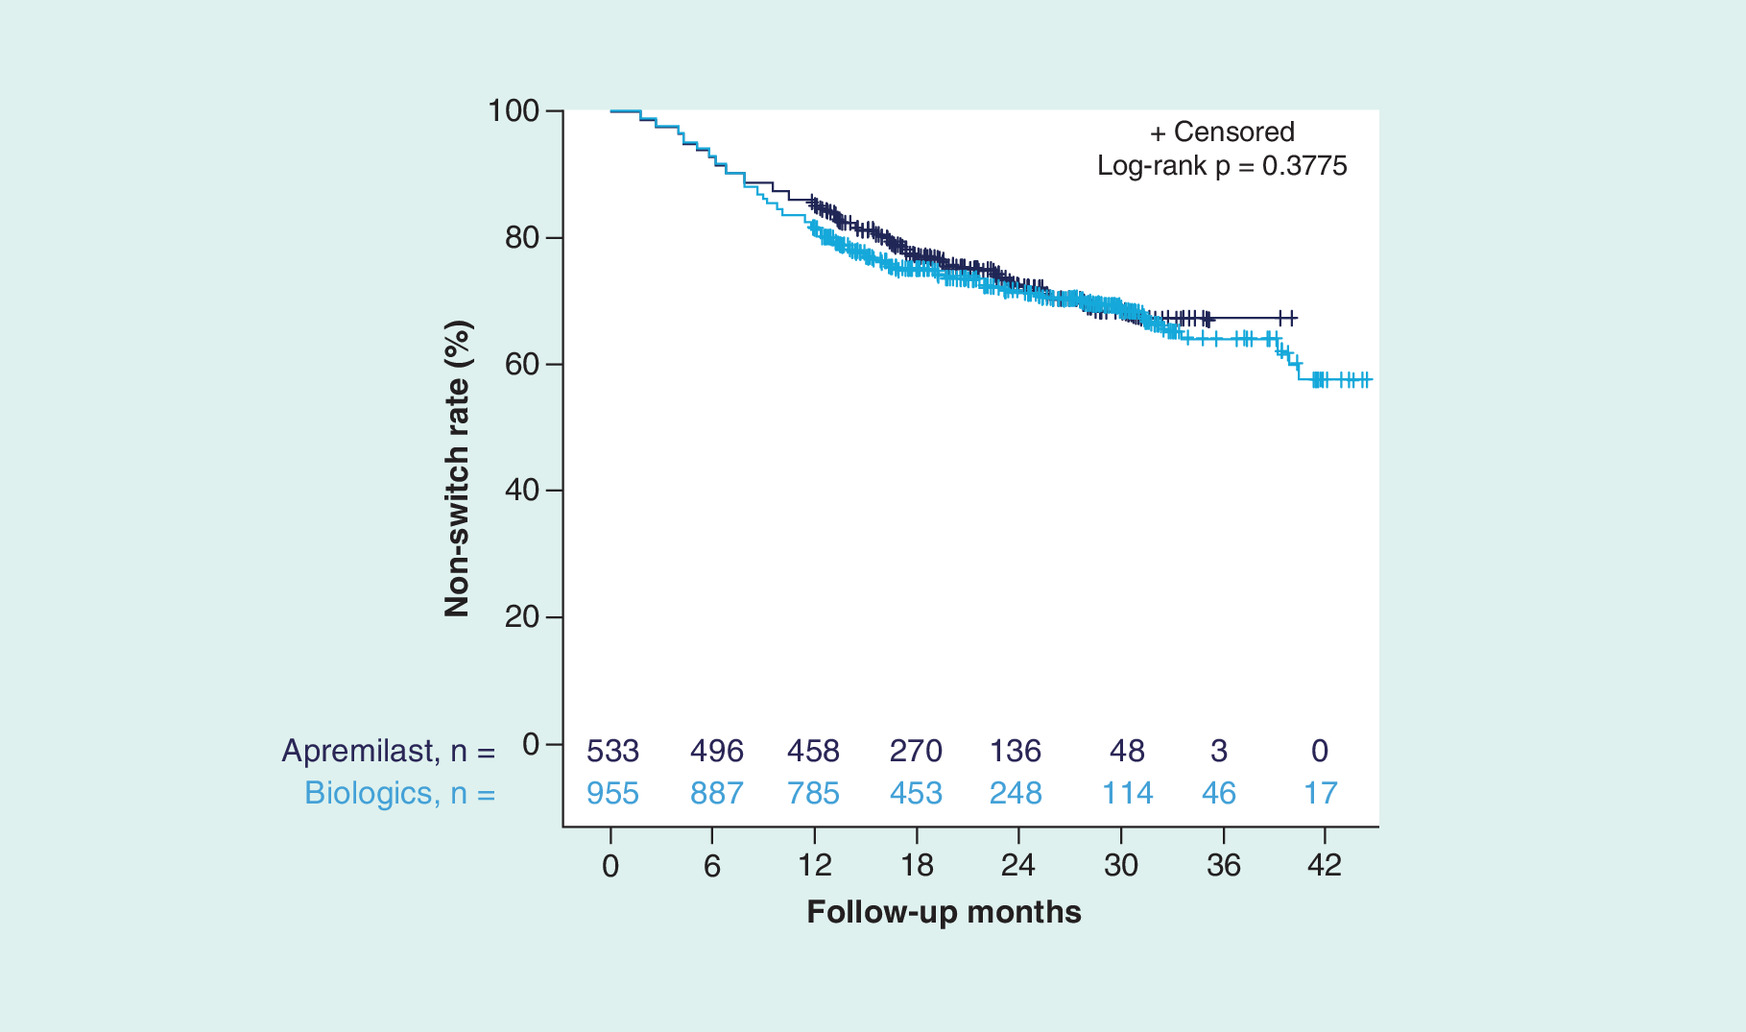
Throughout the study time period, no statistically significant difference in switch rates was observed among apremilast versus biologic cohorts with a minimum of 12-months post-index follow-up (24.6 vs 27.0%; p = 0.30). The mean number of days to switch was similar among apremilast versus biologic cohorts (334 vs 330 days; p = 0.67) who switched throughout the study time period and among those who switched at 12 months (190 vs 213 days; p = 0.06). The switch rates were similar for patients initiating apremilast versus those on biologics at 6, 12 and 18 months (6 months: 6.9 vs 7.1%; p = 0.90; 12 months: 14.1 vs 17.8%; p = 0.06; 18 months: 22.9 vs 25.0%; p = 0.46) and throughout the post-index period (Figure 2). After adjusting for patient censoring, there was no statistically significant difference in switch rates among patients treated with apremilast or biologics; neither group achieved a >50% switch rate (p = 0.38; Figure 3).

Figure 2. Switch rates† among biologic-naive patients initiating apremilast or biologics during the 0- to 24-month follow-up period.
†Calculated within the subgroup of patients with 0- to 15-month post-index follow-up, n = 435 (apremilast) and n = 780 (biologics); with 0- to 18-month post-index follow-up, n = 350 (apremilast) and n = 604 (biologics); with 0- to 21-month post-index follow-up, n = 255 (apremilast) and n = 454 (biologics); and with 0- to 24-month post-index follow-up, n = 186 (apremilast) and n = 346 (biologics).
While on the index treatment, no statistically significant difference in mean adherence rates was observed among apremilast versus biologic cohorts. Mean (SD) PDC while on index treatment was 0.79 (0.21) for the apremilast cohort and 0.79 (0.19) for the biologic cohort (p = 0.31), and mean (SD) MPR while on index treatment was 0.80 (0.21) and 0.82 (0.19) (p = 0.99), respectively.
Healthcare costs
Total & PPPM costs
At baseline, mean (SD) total healthcare costs per month in the matched apremilast and biologic cohorts were US$825 (US$1431) and US$875 (US$1577), respectively (p = 0.64; Table 1). Mean 12-month total healthcare costs were significantly lower among patients initiating apremilast versus those initiating biologics (US$24,452 vs US$46,290; p < 0.0001). This cost difference was driven by significantly lower mean total outpatient pharmacy costs with apremilast versus biologics over the 12-month post-index period; differences in mean inpatient and total outpatient costs (including office visits, emergency department visits, laboratory testing, diagnostics and infusions) were not significantly different between the two treatments over the 12 months (Table 2). Mean total healthcare costs with apremilast versus biologics were also significantly lower during the 6-month post-index period (US$12,679 vs US$26,691; p < 0.0001) and the 18-month post-index period (US$34,912 vs $64,819; p < 0.0001). Trends in mean total outpatient pharmacy, inpatient and total outpatient costs at 6 months were consistent with those seen at 12 months; however, at 18 months, mean total outpatient pharmacy, inpatient and total outpatient costs were all significantly lower with apremilast versus biologics (Table 2). Mean total 12-month PPPM healthcare costs were significantly lower with apremilast versus biologics (US$2037 vs US$3855; p < 0.0001; Figure 4).
| Mean healthcare costs | All | Switch‡ | No switch‡ | ||||||
|---|---|---|---|---|---|---|---|---|---|
| Apremilast (2016 US$) | Biologics (2016 US$) | p-value | Apremilast (2016 US$) | Biologics (2016 US$) | p-value | Apremilast (2016 US$) | Biologics (2016 US$) | p-value | |
| 6 Months | |||||||||
| Total outpatient pharmacy | 9882 | 22,019 | <0.0001 | 18,344 | 30,492 | <0.0001 | 9250 | 21,369 | <0.0001 |
| Total inpatient | 388 | 1543 | 0.1355 | 604 | 886 | 0.4784 | 371 | 1594 | 0.1832 |
| Total outpatient† | 2410 | 3129 | 0.0580 | 3007 | 4256 | 0.7022 | 2365 | 3043 | 0.0590 |
| PPPM pharmacy | 1624 | 3658 | <0.0001 | 3047 | 5065 | <0.0001 | 1537 | 3550 | <0.0001 |
| PPPM inpatient | 64 | 256 | 0.1355 | 100 | 147 | 0.4784 | 62 | 265 | 0.1832 |
| PPPM outpatient† | 400 | 520 | 0.0580 | 500 | 707 | 0.7022 | 393 | 505 | 0.590 |
| 12 Months | |||||||||
| Total outpatient pharmacy | 18,567 | 37,315 | <0.0001 | 30,602 | 46,083 | <0.0001 | 16,596 | 35,416 | <0.0001 |
| Total inpatient | 824 | 2378 | 0.1408 | 353 | 1257 | 0.1314 | 901 | 2621 | 0.3599 |
| Total outpatient† | 5062 | 6597 | 0.1067 | 6057 | 6384 | 0.7029 | 4825 | 6643 | 0.1593 |
| PPPM outpatient pharmacy | 1546 | 3108 | <0.001 | 2549 | 3838 | <0.0001 | 1382 | 2950 | <0.0001 |
| PPPM inpatient | 69 | 198 | 0.1408 | 29 | 105 | 0.1314 | 75 | 218 | 0.3599 |
| PPPM outpatient† | 422 | 549 | 0.1067 | 542 | 532 | 0.7029 | 402 | 553 | 0.1593 |
| 18 Months | |||||||||
| Total outpatient pharmacy | 25,776 | 51,498 | <0.0001 | 40,210 | 58,686 | <0.0001 | 21,499 | 49,102 | <0.0001 |
| Total inpatient | 1299 | 3823 | 0.0263 | 972 | 3064 | 0.2078 | 1396 | 4076 | 0.0696 |
| Total outpatient† | 7838 | 9498 | 0.0453 | 10,746 | 8741 | 0.4161 | 6976 | 9750 | 0.0772 |
| PPPM outpatient pharmacy | 1430 | 2857 | <0.0001 | 2231 | 3256 | <0.0001 | 1193 | 2724 | <0.0001 |
| PPPM inpatient | 72 | 212 | 0.0263 | 54 | 170 | 0.2078 | 77 | 226 | 0.0696 |
| PPPM outpatient† | 435 | 527 | 0.0453 | 596 | 485 | 0.4161 | 387 | 541 | 0.0772 |
†
Outpatient costs include office visits, emergency department visits, laboratory testing, diagnostics and infusions.
‡
Patients who switched by 6 months were included in the Switch group at 6, 12 and 18 months; those who switched by 12 months were included in the Switch group at 12 and 18 months; and those who switched by 18 months were included in the Switch group at 18 months. At each time point, patients in the Switch group were excluded from the No Switch group.
PPPM: Per-patient per-month.
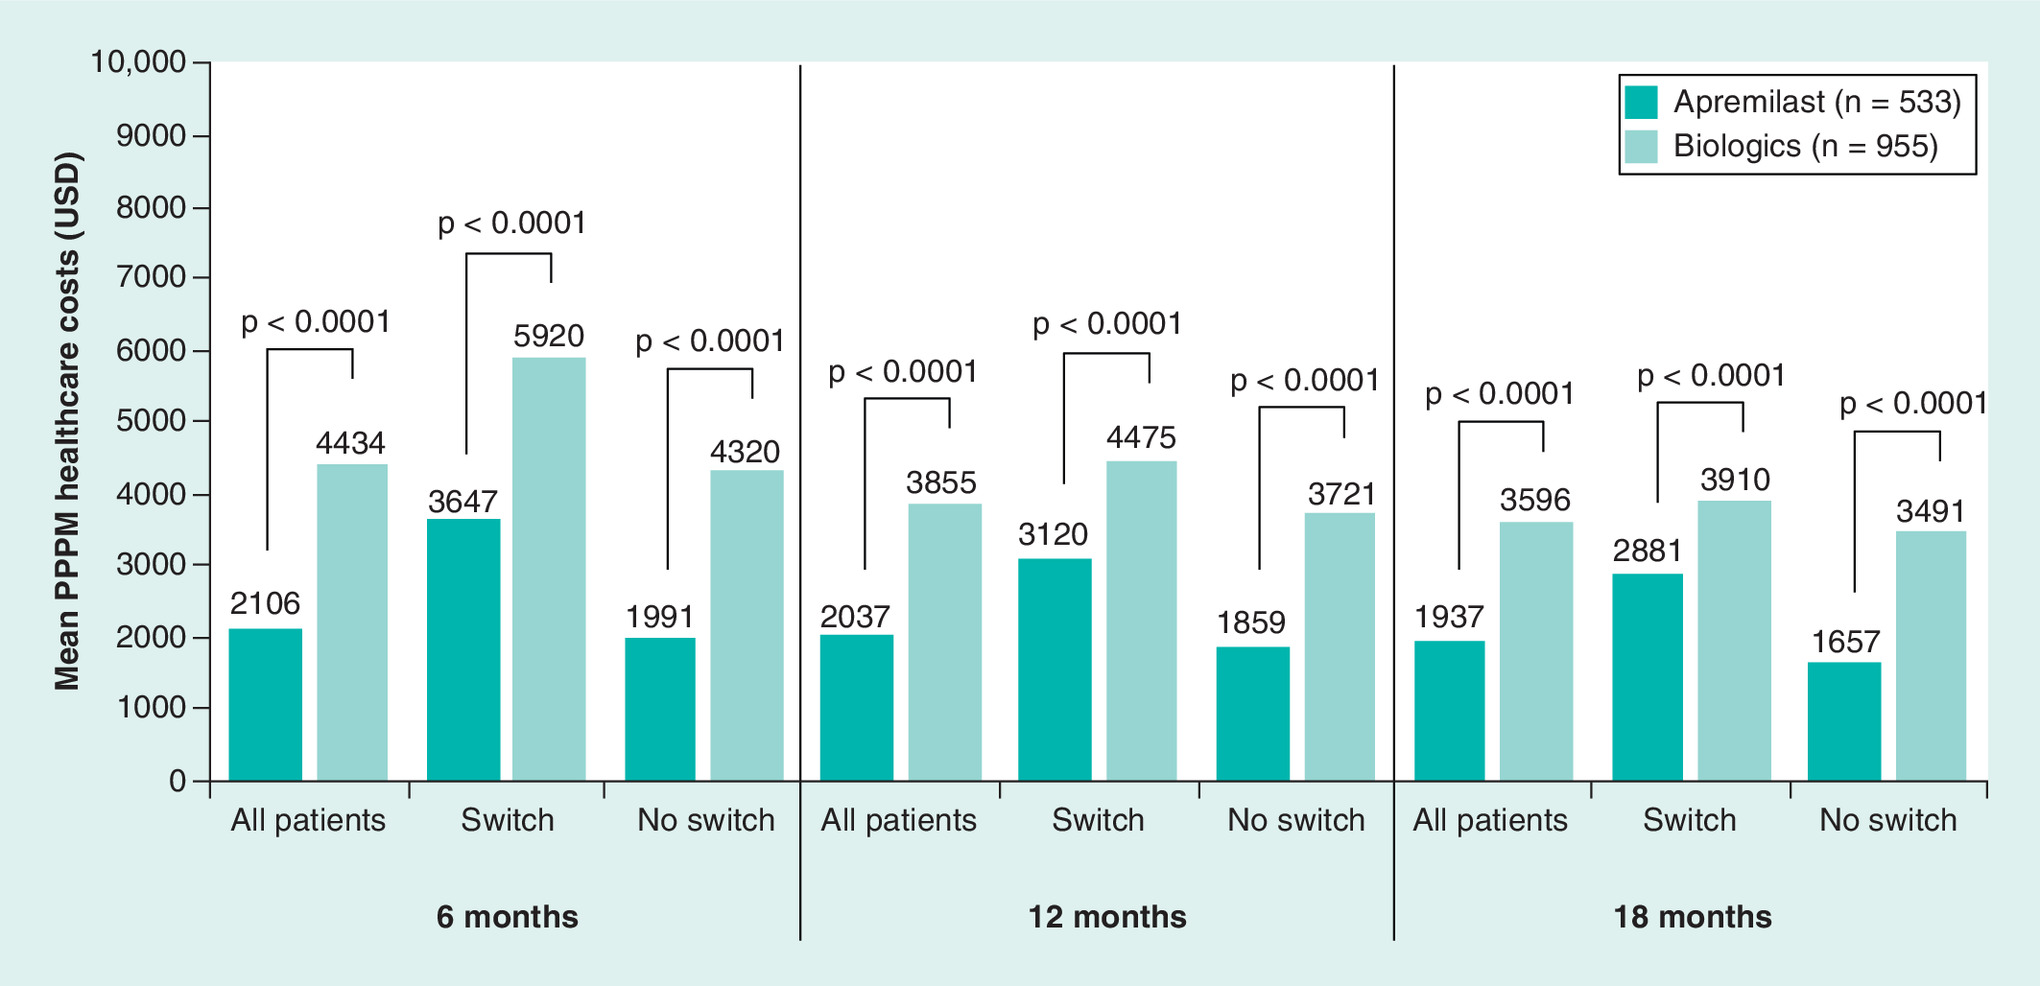
Figure 4. Mean per-patient per-month healthcare costs† over the 6-, 12- and 18-month post-index periods, overall and by treatment pattern.
†Optum's standard pricing algorithms were applied to the de-identified claims data in the Clinformatics Data Mart database. Standard prices were estimated. Allowed payment amounts (i.e., the insurance payment amounts) were across all provider services.
PPPM: Per-patient per-month.
Total costs associated with switching treatments
During the 12-month post-index period, mean total healthcare costs were significantly lower with apremilast versus biologics among patients who switched (US$37,462 vs US$53,724; p < 0.0001) and those who did not switch (US$22,322 vs US$44,680; p < 0.0001) treatments. Mean total outpatient pharmacy costs were also significantly lower with apremilast versus biologics at 12 months regardless of treatment switching status; however, mean inpatient and total outpatient healthcare costs did not differ significantly between the two treatments (Table 2). Mean total healthcare costs with apremilast versus biologics were also significantly lower during the 6- and 18-month post-index periods in patients who switched (6 months: US$21,954 vs US$35,634; p < 0.0001; 18 months: US$51,927 vs US$70,491; p < 0.0001) and those who did not switch (6 months: US$11,987 vs US$26,005; p < 0.0001; 18 months: US$29,871 vs US$62,928; p < 0.0001) treatments. Mean total outpatient pharmacy costs were significantly lower during the 6- and 18-month post-index periods with apremilast versus biologics regardless of treatment switching status; however, no significant differences in mean inpatient and total outpatient costs were noted between the two treatments (Table 2). In each treatment group, patients who switched therapies incurred higher levels of healthcare costs at all time points and cost categories than patients who did not switch.
PPPM costs associated with switching treatments
During the 12-month post-index period, mean total PPPM healthcare costs were significantly lower with apremilast versus biologics among patient who switched (US$3120 vs US$4475; p < 0.0001) and those who did not switch (US$1859 vs US$3721; p < 0.0001) treatments (Figure 4). Significantly lower mean PPPM outpatient pharmacy costs were seen with apremilast versus biologics at 12 months in patients who switched and did not switch treatments; no significant differences were observed in mean PPPM inpatient and total outpatient costs regardless of treatment switching status (Table 2). During the 6- and 18-month post-index periods, mean PPPM healthcare costs were also significantly lower with apremilast versus biologics regardless of treatment switching status (Figure 4). Similarly, trends at 6 and 18 months in mean PPPM outpatient pharmacy, inpatient and total outpatient costs were consistent with those at 12 months (Table 2). Patients who did not switch treatments had numerically lower PPPM healthcare costs compared with patients who switched at 6, 12 and 18 months regardless of treatment group (Table 2).
Among patients who switched treatments, mean PPPM healthcare costs before and after the switch were significantly lower for the apremilast versus biologic cohorts during the 12-month post-index period (Figure 5). Mean PPPM pharmacy costs were lower in the apremilast versus biologics cohort before (US$1380 vs US$3363; p < 0.0001) and after switching (US$5025 vs US$7623; p = 0.06). No significant differences were observed in mean PPPM inpatient costs among patients who initiated apremilast or biologics before (US$0 vs US$104; p = 0.08) and after switching (US$39 vs US$134; p = 0.71); mean PPPM outpatient costs were not significantly different for patients in the apremilast and biologic cohorts before (US$409 vs US$551; p = 0.90) and after switching (US$649 vs US$630; p = 0.71).

Figure 5. Mean per-patient per-month costs† over the 12-month post-index period, overall and by treatment pattern.
†Optum's standard pricing algorithms were applied to the de-identified claims data in the Clinformatics Data Mart database. Standard prices were estimated. Allowed payment amounts (i.e., the insurance payment amounts) were across all provider services.
PPPM: Per-patient per-month.
Discussion
This real-world, retrospective, administrative claims analysis compared treatment patterns and healthcare costs among biologic-naive psoriasis patients initiating treatment with apremilast or biologics. Our results demonstrated biologic-naive patients initiating treatment with apremilast versus biologics had switch rates that were numerically, but not significantly, lower. Biologic-naive patients initiating treatment with apremilast versus biologics also had significantly lower total and PPPM healthcare costs whether or not they switched to a biologic during the 12-month post-index period. The cost advantage with apremilast was most notably due to differences in outpatient pharmacy costs versus biologics. Patients who switched treatments had numerically higher healthcare costs compared with those who remained on the index treatment.
Because lack of treatment effectiveness or tolerability issues are common reasons for switching and discontinuing therapies among patients with psoriasis [5,32], switch rates may reflect how patients are responding to or tolerating treatment. Our finding that switch rates were not significantly different in the apremilast and biologics cohorts at 12 months are consistent with recent studies that found similar persistence rates among commercially insured, biologic-naive patients with psoriasis in the first year after starting treatment [28,33]. The mean adherence rates we observed in the biologic cohort (PDC, 79%; MPR, 82%) were similar to a recent systematic review of studies in patients with psoriasis receiving biologics (PDC, 70.2%; MPR, 73.9%) [34]. In agreement with our analysis, Feldman et al. [28] and Wu et al. [33] found significantly lower total healthcare costs for apremilast versus biologics at 12 months, including among patients who switched to a biologic during follow-up. We also found that mean total healthcare costs for patients who did not switch therapies during the first year of treatment (apremilast, US$22,322; biologics, US$44,680) were similar to the estimated mean total yearly cost of apremilast treatment (US$27,375) and estimated first-year costs of treatment with a biologic for psoriasis, ranging from US$39,041 to US$53,909 [35] and US$22,122 to US$47,701 [36].
We observed significantly lower mean PPPM healthcare costs in the apremilast cohort compared with the biologic cohort in the 12-month post-index period (US$2037 vs US$3855; p < 0.0001), and the cost difference was driven by lower mean PPPM outpatient pharmacy costs (US$1546 vs US$3108; p < 0.0001). This finding is consistent with a prior analysis that also found lower PPPM outpatient pharmacy costs with apremilast compared with biologics (US$2478 vs US$4922) [28]. Additionally, the numerically lower switch rates and significantly reduced PPPM healthcare costs observed with apremilast versus biologics in the 12-month post-index period may have contributed to the reduced annual total healthcare costs. Other analyses have shown switching from one psoriasis treatment to another increases healthcare costs compared with not switching, driven in part by higher prescription costs [29]. We did observe some instances where patients who did not switch had higher costs. Although it was unclear why this was the case, a possible reason is that these patients were experiencing suboptimal efficacy and/or tolerability issues and yet they remained on their initial therapy, which could conceivably lead to higher disease and treatment costs.
Considering that low treatment satisfaction, frequent therapy switching and high direct costs are common barriers to the optimal management of psoriasis [4,7], there is a need for effective oral therapies that are also cost-effective. Taken together, our results and those of previous studies indicate that starting treatment with apremilast may be a cost-effective strategy for biologic-naive patients, whether or not they later switch to a biologic. Our findings expand on prior research on health economic research with apremilast [27,28,33,37] and may help providers and payers make treatment choices that improve patient outcomes while reducing costs and treatment burden.
This study was limited to individuals with United Healthcare commercial health coverage or Medicare Advantage; as such, these findings may not be generalizable to psoriasis patients with other insurance plans or without health insurance coverage. Patients with an apremilast claim were included, irrespective of dosage strength or schedule, and some patients may have received apremilast or biologics with a dosing regimen that differs from the approved dose or schedule in the package insert. The Optum CDM database relies on administrative claims data, which are subject to coding limitations and entry error. Additionally, administrative claims data do not provide clinical details such as disease severity or activity, and unmeasured baseline disease severity or activity may contribute to observed differences in costs. While the propensity score matching controlled for differences between the two exposure cohorts, adjustment was limited to characteristics that can be measured from administrative claims. Moreover, in the comparison of switch versus nonswitch patients, propensity score matching did not take into account switch status and thus these groups may be characteristically unbalanced. Furthermore, measures of medication adherence were based on filled prescriptions; however, it was not possible to confirm whether patients actually took the medication as directed. This analysis did not assess reasons for switching and was limited to claims-based definitions of a switch. The possibility of under-diagnosis of psoriasis may lead to selection bias and/or smaller sample sizes, as psoriasis patients who were untreated or did not have a relevant diagnosis recorded on their medical claims were excluded. Furthermore, psoriasis claims do not provide information about disease severity, and our findings about treatment patterns with apremilast and biologics may not be generalizable to patients with different levels of disease severity or those with previous biologic experience. It is also possible that apremilast may be prescribed for patients with more moderate psoriasis compared with biologics. Our claims-based analysis was limited to treatment patterns and costs and did not assess the effect of disease severity on these parameters. However, to the extent that our baseline characteristics (including costs) were well balanced between groups post-switch, this concern may be somewhat attenuated. Future research using notes in electronic medical records or interviews with physicians and patients is needed to evaluate switch rates, reasons for switching and markers of disease severity. Some biologics currently available for the treatment of psoriasis were not included in this analysis because they were not approved by the FDA at the time of the study. Sample size was also limited in newer biologic agents included within the study; to increase our sample size for biologic agents, we chose an index period starting 1 January 2014, despite FDA approval of apremilast on 23 September 2015, but this would not impact these results. Furthermore, due to variations in utilization management criteria (e.g., fewer prior authorizations), it may be necessary to perform additional studies evaluating the effectiveness and switch rates of newer agents, consistency of results across multiple settings and changes in treatment patterns over time. Replication of this study in different databases is also warranted to assess and identify trends in other patient populations, including subgroups receiving other biologics, and increase the understanding of treatment switching behaviors in psoriasis.
Conclusion
In this real-world analysis of biologic-naive psoriasis patients, initiating apremilast treatment was associated with lower healthcare costs with similar switch rates and adherence rates versus biologic therapy. The cost advantage with apremilast treatment was driven by lower pharmacy costs and was observed regardless of whether patients switched to a biologic during the post-index period. Further analysis should be conducted to identify potential predictors of switching from one agent to another.
What is already known about this subject?
•
Treatment switching and low treatment satisfaction, along with high direct healthcare costs, are common barriers to the optimal management of psoriasis.
•
A recent study showed that treatment switching from one psoriasis treatment to another increases healthcare costs compared with not switching, driven in part by higher prescription costs.
What are the new findings?
•
In a real-world setting, biologic-naive patients with psoriasis initiating treatment with apremilast versus biologics had significantly lower total and per-patient per-month healthcare costs, with difference in costs primarily due to outpatient pharmacy costs with apremilast.
•
The cost advantage with apremilast treatment was observed regardless of whether patients switched to a biologic during the post-index period.
•
No difference in adherence or rate of switching was observed between biologic-naive patients initiating treatment with apremilast versus biologics.
Impact on clinical practice
•
This study's finding of lower healthcare costs among patients initiating apremilast indicates that starting treatment with apremilast may be a cost-effective strategy for biologic-naive patients, regardless of whether they later switch to a biologic.
•
Given that low treatment satisfaction and frequent therapy switching may impact patient outcomes, our findings of no difference in adherence or rate of switching with apremilast versus biologics may help providers and payers make treatment choices that improve patient outcomes and reduce barriers to treatment.
Author contributions
All authors were involved in the design and conduction of the study, as well as drafting the report or revising it critically for intellectual content. All authors had access to the data and interpreted the data.
Financial & competing interests of disclosure
This study was funded by Celgene. JJ Wu reports serving as an investigator for AbbVie, Amgen Inc., Eli Lilly, Janssen, and Novartis; as a consultant for AbbVie, Almirall, Amgen Inc., Bristol-Myers Squibb, Celgene, Dermira, Dr Reddy's Laboratories, Eli Lilly, Janssen, LEO Pharma, Novartis, Promius Pharma, Regeneron, Sun, UCB and Valeant; and as a speaker for AbbVie, Celgene, Novartis, Sun, UCB and Valeant. C Pelletier, B Ung and M Tian are employees of Bristol-Myers Squibb and were employees of Celgene at the time of the study. I Khilfeh is an employee of Amgen Inc. and was an employee of Celgene at the time of the study. JR Curtis has received grant/research support from AbbVie, Amgen Inc., Eli Lilly, Janssen and Novartis, and has served as a speaker for AbbVie, Almirall, Amgen Inc., Bristol-Myers Squibb, Celgene, Dermira, Dr Reddy's Laboratories, Eli Lilly, Janssen, LEO Pharma, Novartis, Ortho Dermatologics, Promius Pharma, Regeneron, Sun, UCB and Valeant. The authors have no other relevant affiliations or financial involvement with any organization or entity with a financial interest in or financial conflict with the subject matter or materials discussed in the manuscript apart from those disclosed.
Writing support was funded by Celgene and provided by L Radican of Peloton Advantage, LLC, an OPEN Health company.
Ethical conduct of research
No institutional review was required because this analysis used only de-identified patient records and did not involve the collection, use or transmittal of individually identifiable data, as dictated by Title 45 Code of Federal Regulations 46.101(b)(4).
Open access
This work is licensed under the Attribution-NonCommercial-NoDerivatives 4.0 Unported License. To view a copy of this license, visit http://creativecommons.org/licenses/by-nc-nd/4.0/
References
Papers of special note have been highlighted as: • of interest; •• of considerable interest
1.
Rachakonda TD, Schupp CW, Armstrong AW. Psoriasis prevalence among adults in the United States. J. Am. Acad. Dermatol. 70(3), 512–516 (2014).
2.
Vanderpuye-Orgle J, Zhao Y, Lu J et al. Evaluating the economic burden of psoriasis in the United States. J. Am. Acad. Dermatol. 72(6), 961–967.e965 (2015).
3.
Gelfand JM, Feldman SR, Stern RS et al. Determinants of quality of life in patients with psoriasis: a study from the US population. J. Am. Acad. Dermatol. 51(5), 704–708 (2004).
4.
Stern RS, Nijsten T, Feldman SR et al. Psoriasis is common, carries a substantial burden even when not extensive, and is associated with widespread treatment dissatisfaction. J. Investig. Dermatol. Symp. Proc. 9(2), 136–139 (2004).
• This large, US population-based survey found that psoriasis is common and has a strong negative impact on everyday life, even in patients with less extensive disease.
5.
Lebwohl MG, Bachelez H, Barker J et al. Patient perspectives in the management of psoriasis: results from the population-based Multinational Assessment of Psoriasis and Psoriatic Arthritis Survey. J. Am. Acad. Dermatol. 70(5), 871–881 (2014).
6.
Vide J, Magina S. Moderate-to-severe psoriasis treatment challenges through the era of biological drugs. An. Bras. Dermatol. 92(5), 668–674 (2017).
7.
Feldman SR, Goffe B, Rice G et al. The challenge of managing psoriasis: unmet medical needs and stakeholder perspectives. Am. Health Drug Benefits 9(9), 504–513 (2016).
8.
Brezinski EA, Dhillon JS, Armstrong AW. Economic burden of psoriasis in the United States: a systematic review. JAMA Dermatol. 151(6), 651–658 (2015).
9.
Menter A, Gottlieb A, Feldman SR et al. Guidelines of care for the management of psoriasis and psoriatic arthritis: section 1. Overview of psoriasis and guidelines of care for the treatment of psoriasis with biologics. J. Am. Acad. Dermatol. 58(5), 826–850 (2008).
10.
Menter A, Korman NJ, Elmets CA et al. Guidelines of care for the management of psoriasis and psoriatic arthritis: section 6. Guidelines of care for the treatment of psoriasis and psoriatic arthritis: case-based presentations and evidence-based conclusions. J. Am. Acad. Dermatol. 65(1), 137–174 (2011).
11.
Hsu S, Papp KA, Lebwohl MG et al. Consensus guidelines for the management of plaque psoriasis. Arch. Dermatol. 148(1), 95–102 (2012).
12.
Blauvelt A, Chiricozzi A. The immunologic role of IL-17 in psoriasis and psoriatic arthritis pathogenesis. Clin. Rev. Allergy Immunol. 55(3), 379–390 (2018).
13.
Kaushik SB, Lebwohl MG. Psoriasis: which therapy for which patient: focus on special populations and chronic infections. J. Am. Acad. Dermatol. 80(1), 43–53 (2019).
14.
Kaushik SB, Lebwohl MG. Psoriasis: which therapy for which patient: psoriasis comorbidities and preferred systemic agents. J. Am. Acad. Dermatol. 80(1), 27–40 (2019).
15.
Kalb RE, Fiorentino DF, Lebwohl MG et al. Risk of serious infection with biologic and systemic treatment of psoriasis: results from the Psoriasis Longitudinal Assessment and Registry (PSOLAR). JAMA Dermatol. 151(9), 961–969 (2015).
16.
Menter A, Strober BE, Kaplan DH et al. Joint AAD-NPF guidelines of care for the management and treatment of psoriasis with biologics. J. Am. Acad. Dermatol. 80(4), 1029–1072 (2019).
17.
Otezla (apremilast) [package insert]. Amgen Inc, CA, USA (April 2020).
18.
Schafer P. Apremilast mechanism of action and application to psoriasis and psoriatic arthritis. Biochem. Pharmacol. 83(12), 1583–1590 (2012).
19.
Zerilli T, Ocheretyaner E. Apremilast (Otezla): a new oral treatment for adults with psoriasis and psoriatic arthritis. PT 40(8), 495–500 (2015).
20.
Coates LC, FitzGerald O, Helliwell PS et al. Psoriasis, psoriatic arthritis, and rheumatoid arthritis: is all inflammation the same?. Semin Arthritis Rheum. 46(3), 291–304 (2016).
21.
Papp K, Reich K, Leonardi CL et al. Apremilast, an oral phosphodiesterase 4 (PDE4) inhibitor, in patients with moderate-to-severe plaque psoriasis: results of a phase III, randomized, controlled trial (Efficacy and Safety Trial Evaluating the Effects of Apremilast in Psoriasis [ESTEEM 1]). J. Am. Acad. Dermatol. 73(1), 37–49 (2015).
•• This Phase III, multicenter, randomized, double-blind, placebo-controlled study demonstrated that oral apremilast was effective in the treatment of patients with moderate-to-severe plaque psoriasis for up to 52 weeks and was well tolerated.
22.
Paul C, Cather J, Gooderham M et al. Efficacy and safety of apremilast, an oral phosphodiesterase 4 inhibitor, in patients with moderate-to-severe plaque psoriasis over 52 weeks: a phase III, randomized, controlled trial (ESTEEM 2). Br. J. Dermatol. 173(6), 1387–1399 (2015).
23.
Papadavid E, Rompoti N, Theodoropoulos K et al. Real-world data on the efficacy and safety of apremilast in patients with moderate-to-severe plaque psoriasis. J. Eur. Acad. Dermatol. Venereol. 23(7), 1173–1179 (2018).
24.
Armstrong A, Levi E. Real-world clinical experience with apremilast in a large US retrospective cohort study of patients with moderate-to-severe plaque psoriasis. J. Drugs Dermatol. 16(12), 1240–1245 (2017).
25.
Feldman SR, Zhao Y, Navaratnam P et al. Patterns of medication utilization and costs associated with the use of etanercept, adalimumab, and ustekinumab in the management of moderate-to-severe psoriasis. J. Manag. Care Spec. Pharm. 21(3), 201–209 (2015).
26.
Armstrong AW, Robertson AD, Wu J et al. Undertreatment, treatment trends, and treatment dissatisfaction among patients with psoriasis and psoriatic arthritis in the United States: findings from the National Psoriasis Foundation surveys, 2003–2011. JAMA Dermatol. 149(10), 1180–1185 (2013).
27.
Armstrong AW, Foster SA, Comer BS et al. Real-world health outcomes in adults with moderate-to-severe psoriasis in the United States: a population study using electronic health records to examine patient-perceived treatment effectiveness, medication use, and healthcare resource utilization. BMC Dermatol. 18(1), 4 (2018).
• This study, which used electronic health records of adult patients with psoriasis to evaluate costs and treatment switching, found higher annual medication costs per patient for biologics compared with oral systemics.
28.
Feldman SR, Pelletier CL, Wilson KL et al. Real-world US healthcare costs of psoriasis for biologic-naive patients initiating apremilast or biologics. J. Comp. Eff. Res. 8(1), 45–54 (2019).
•• A retrospective, observational cohort study using administrative claims from the IBM MarketScan database analyzed treatment patterns and all-cause healthcare costs in biologic-naive patients receiving apremilast or biologic therapy for psoriasis. This study found that apremilast users had treatment adherence rates similar to biologic users and lower total healthcare costs.
29.
Feldman SR, Tian H, Wang X et al. Health care utilization and cost associated with biologic treatment patterns among patients with moderate-to-severe psoriasis: analyses from a large U.S. claims database. J. Manag. Care Spec. Pharm. 479–488 (2019).
•• This retrospective, observational cohort study using the administrative claims of patients with moderate-to-severe psoriasis in the Truven Health Analytics MarketScan database examined nonswitchers, switchers, and discontinuers of biologics with respect to healthcare utilization and costs associated with switching. Switchers had higher adjusted mean total healthcare costs compared with nonswitchers while discontinuers had lower adjusted mean total healthcare costs but higher mean medical costs.
30.
Wu JJ, Pelletier C, Ung Bet al. et al. (Eds). Rates of treatment switching and all-cause healthcare costs in biologic-naive patients initiating apremilast or biologics for the treatment of psoriasis [poster]. AMCP Nexus, FL, USA (22-25 October 2018).
31.
Austin PC. A comparison of 12 algorithms for matching on the propensity score. Stat. Med. 33(6), 1057–1069 (2014).
32.
Glintborg B, Ostergaard M, Dreyer L et al. Treatment response, drug survival, and predictors thereof in 764 patients with psoriatic arthritis treated with anti-tumor necrosis factor alpha therapy: results from the nationwide Danish DANBIO registry. Arthritis Rheum. 63(2), 382–390 (2011).
33.
Wu JJ, Pelletier C, Ung B et al. Real-world treatment patterns and healthcare costs among biologic-naive patients initiating apremilast or biologics for the treatment of psoriasis. J. Med. Econ. 22(4), 365–371 (2019).
•• This retrospective, observational cohort study was conducted using the Optum Clinformatics claims database to assess real-world treatment patterns and healthcare costs among biologic-naive patients with psoriasis initiating apremilast or biologics. This study found significantly lower total healthcare costs for apremilast versus biologics at 12 months, including among patients who switched to a biologic during follow-up.
34.
Murage MJ, Anderson A, Casso D et al. Treatment patterns, adherence, and persistence among psoriasis patients treated with biologics in a real-world setting, overall and by disease severity. J. Dermatolog. Treat. 30(2), 141–149 (2019).
35.
Cheng J, Feldman SR. The cost of biologics for psoriasis is increasing. Drugs Context. 3, 212266 (2014).
36.
Howe A, Eyck LT, Dufour R et al. Treatment patterns and annual drug costs of biologic therapies across indications from the Humana commercial database. J. Manag. Care Spec. Pharm. 20(12), 1236–1244 (2014).
37.
Kromer C, Celis D, Sonntag D et al. Biologicals and small molecules in psoriasis: a systematic review of economic evaluations. PLoS ONE 13(1), e0189765 (2018).
Information & Authors
Information
Published In
Pages: 767 - 779
PubMed: 32638609
Copyright
© 2020 Jashin J Wu. This work is licensed under the Attribution-NonCommercial-NoDerivatives 4.0 Unported License
History
Received: 13 March 2020
Accepted: 20 May 2020
Published online: 8 July 2020
Keywords:
Topics
Authors
Metrics & Citations
Metrics
Article Usage
Article usage data only available from February 2023. Historical article usage data, showing the number of article downloads, is available upon request.
Citations
How to Cite
Real-world switch patterns and healthcare costs in biologic-naive psoriasis patients initiating apremilast or biologics. (2020) Journal of Comparative Effectiveness Research. DOI: 10.2217/cer-2020-0045
Export citation
Select the citation format you wish to export for this article or chapter.
Citing Literature
- Andreas Pinter, Marcus Schulte, Nils Kossack, Marc Pignot, Michael Schultze, Andrea Feldhus, Real-world psoriasis treatment patterns and disease burden in Germany, with a focus on biologics and apremilast: data from a German statutory health insurance database, Journal of Medical Economics, 10.1080/13696998.2025.2452054, 28, 1, (207-220), (2025).
- Vardhaman Patel, Sang Hee Park, Yichen Zhong, Adam Sima, Joe Zhuo, Carla Roberts-Toler, Brandon Becker, Sara Hovland, Bruce Strober, The Association Between Patient-Reported Disease Burden and Treatment Switching in Patients with Plaque Psoriasis Treated with Nonbiologic Systemic Therapy, Psoriasis: Targets and Therapy, 10.2147/PTT.S478352, Volume 14, (167-174), (2024).
- Andreas Pinter, Ahmed M. Soliman, Karina C. Manz, Valeria Weber, Paul Ludwig, Anja Mocek, Ariane Höer, Mark G. Lebwohl, Treatment switching and associated economic outcomes in patients with plaque psoriasis treated with biologics: A retrospective analysis of German claims data 2016−2021, JEADV Clinical Practice, 10.1002/jvc2.512, 3, 5, (1537-1547), (2024).
- Andreas Pinter, Ahmed M. Soliman, Karina C. Manz, Valeria Weber, Paul Ludwig, Anja Mocek, Ariane Höer, Mark G. Lebwohl, Treatment Discontinuation in Patients with Psoriasis Treated with Biologics: A Retrospective Analysis of German Health Claims Data, Dermatology and Therapy, 10.1007/s13555-024-01172-6, 14, 6, (1575-1585), (2024).
- Sydney Thai, Sophie Barlow, James Lucas, James Piercy, Yichen Zhong, Joe Zhuo, Jashin J. Wu, Suboptimal Clinical and Quality of Life Outcomes in Patients with Psoriasis Undertreated with Oral Therapies: International Physician and Patient Survey, Dermatology and Therapy, 10.1007/s13555-023-00927-x, 13, 6, (1289-1303), (2023).
- April W. Armstrong, Manish Patel, Chao Li, Vishvas Garg, Monika Rao Mandava, Jashin J. Wu, Real-world switching patterns and associated characteristics in patients with psoriasis treated with biologics in the United States, Journal of Dermatological Treatment, 10.1080/09546634.2023.2200870, 34, 1, (2023).
- Sydney Thai, Joe Zhuo, Yichen Zhong, Qian Xia, Xiu Chen, Ying Bao, Devender Dhanda, Lawshia Priya, Jashin J. Wu, Real-world treatment patterns and healthcare costs in patients with psoriasis taking systemic oral or biologic therapies, Journal of Dermatological Treatment, 10.1080/09546634.2023.2176708, 34, 1, (2023).
- Jashin J. Wu, Ching An Wang, Greeta Jobson, David Davidson, Samaneh Kalirai, Julia Zhu, Manasi Suryavanshi, Mayank Mittal, Vardhaman Patel, Lauren Seigel, Treatment patterns and healthcare costs among patients with psoriasis initiating apremilast or biologics: a retrospective claims database cohort analysis, Journal of Dermatological Treatment, 10.1080/09546634.2023.2177095, 34, 1, (2023).
- Yayoi Tada, Hyunchung Kim, Dionysis Spanopoulos, Katsuyoshi Habiro, Katsuki Tsuritani, Yoshiyuki Yamada, Amartya Mandal, Yichen Zhong, Yusuke Hikichi, Treatment patterns, healthcare resource utilization, and costs in patients with moderate‐to‐severe psoriasis treated with systemic therapy in Japan: A retrospective claims database study, The Journal of Dermatology, 10.1111/1346-8138.16543, 49, 11, (1106-1117), (2022).
- Andrea Picchianti-Diamanti, Francesca Romana Spinelli, Maria Manuela Rosado, Fabrizio Conti, Bruno Laganà, Inhibition of Phosphodiesterase-4 in Psoriatic Arthritis and Inflammatory Bowel Diseases, International Journal of Molecular Sciences, 10.3390/ijms22052638, 22, 5, (2638), (2021).