Cost–effectiveness of overactive bladder treatments: from the US payer perspective
Abstract
Aim: To assess the cost–effectiveness of onabotulinumtoxinA (onabotA), implantable sacral nerve stimulation devices, percutaneous tibial nerve stimulation, anticholinergic medications and mirabegron compared with best supportive care (BSC) for management of refractory overactive bladder (OAB). Methods: A Markov model was developed to compare the cost–effectiveness of treatment options with BSC over a 10-year time horizon. Resource utilization, discontinuation rates and costs were derived from unpublished and published sources. Quality-adjusted life-years (QALYs) and incremental cost–effectiveness ratios were reported. Results: Treatment with onabotA 100U produced the largest gain in QALYs (7.179) and lowest estimated incremental cost–effectiveness ratio ($32,680/QALY) of all assessed treatments compared with BSC. Conclusion: Compared with BSC, onabotA 100U was the most cost-effective treatment option for patients with refractory OAB.
Overactive bladder (OAB) is a chronic condition characterized by urinary urgency, urinary frequency and nocturia [1]. Overall prevalence of OAB is estimated to be 16.9 and 16.0% among women and men, respectively, with prevalence increasing with age [1].
In a 2007 report, an estimated 34 million US patients with OAB incurred a national cost of $65.9 billion, which is projected to rise to $82.6 billion by 2020 [2]. Conservative management with best supportive care (BSC), which comprises behavioral therapy, incontinence pads and occasional catheterization, is often employed as first-line treatment, although pharmacotherapy with anticholinergics is eventually required for most patients [3,4]. Those receiving pharmacotherapy often cycle through multiple therapies and continue receiving treatment without adequate relief, which can further impact healthcare expenditures and health-related quality of life (HRQoL) [5]. For patients with OAB inadequately managed by anticholinergics, onabotulinumtoxinA (onabotA) injection (BOTOX®, Allergan plc), implantable sacral nerve stimulation (SNS) devices, percutaneous tibial nerve stimulation (PTNS) and mirabegron are alternative treatment options.
Given the health and economic burden of OAB, understanding the cost–effectiveness of all available treatment options is critical for informing treatment decisions. Yet, to date, most economic assessments were performed outside the USA, with only a single investigation having reported a cost–comparative analysis of OAB treatments in the USA [6]. Notably, that study was centered around the cost–effectiveness of mirabegron versus six antimuscarinics. To this end, the cost–effectiveness of both pharmacologic and nonpharmacologic treatment options relative to BSC has not been comprehensively assessed from a US payer perspective. This study evaluated the cost–effectiveness of onabotA, SNS, PTNS, anticholinergic medication and mirabegron compared with BSC for management of refractory OAB in adult patients from a US payer perspective.
Materials & methods
Model structure & overview
Overactive bladder was modeled using a Markov model (Figure 1) with health states based on daily urinary incontinence episodes (UIEs). The duration of the model cycle was set at 3 months, which was consistent with the majority of OAB trials for which clinical data were available, with the base-case employing a 10-year time horizon and an annual discount rate of 3%. The 10-year time horizon was selected for the base-case analysis to reflect the chronic nature of OAB and capture the key costs and effects related to all treatments assessed. The model evaluated the cost–effectiveness of treatment with onabotA 100U, SNS, PTNS, anticholinergics (i.e., solifenacin 5 or 10 mg, tolterodine extended release [ER]), or mirabegron (25 or 50 mg) compared with BSC (reference therapy). The model did not permit for the comparison of all six treatments simultaneously; rather, its design was a collection of two-arm models with BSC as the reference treatment. Treatment expenses were calculated as the wholesale acquisition price minus 15% [7]. The mean cost of anticholinergic treatment was obtained from the Micromedex RED BOOK™ [8]. Markov model inputs and assumptions were obtained from a variety of sources as outlined in Table 1 [8–13] and described below. The model comprised five health states, including dry (i.e., 0 UIEs), >0 and ≤2 UIEs, >2 and <5 UIEs, ≥5 UIEs per day, and dead (as an absorbing state). Each of the health states was assigned a value reflecting both utility and costs. The overall costs and benefits of receiving each treatment were calculated by multiplying the number of patients in each state by the corresponding cost and utility values at the end of each cycle, and then summing accrued costs, accrued quality-adjusted life-years (QALYs), and utilities adjusted by time spent in each state across health states and model time horizon. Efficacy and safety inputs for onabotA and BSC were derived from onabotA 100U trials. The proportion of patients who responded to therapy and the incidence of adverse events (AEs) for SNS and PTNS were based on published studies [10–14]. In instances for which SNS- and PTNS-specific data were required to populate model parameters that were not available from the literature, assumptions were applied based on data from onabotA 100U trials. Efficacy and safety data for solifenacin (5 or 10 mg), tolterodine ER and mirabegron (25 or 50 mg) were based on a network meta-analysis [15].
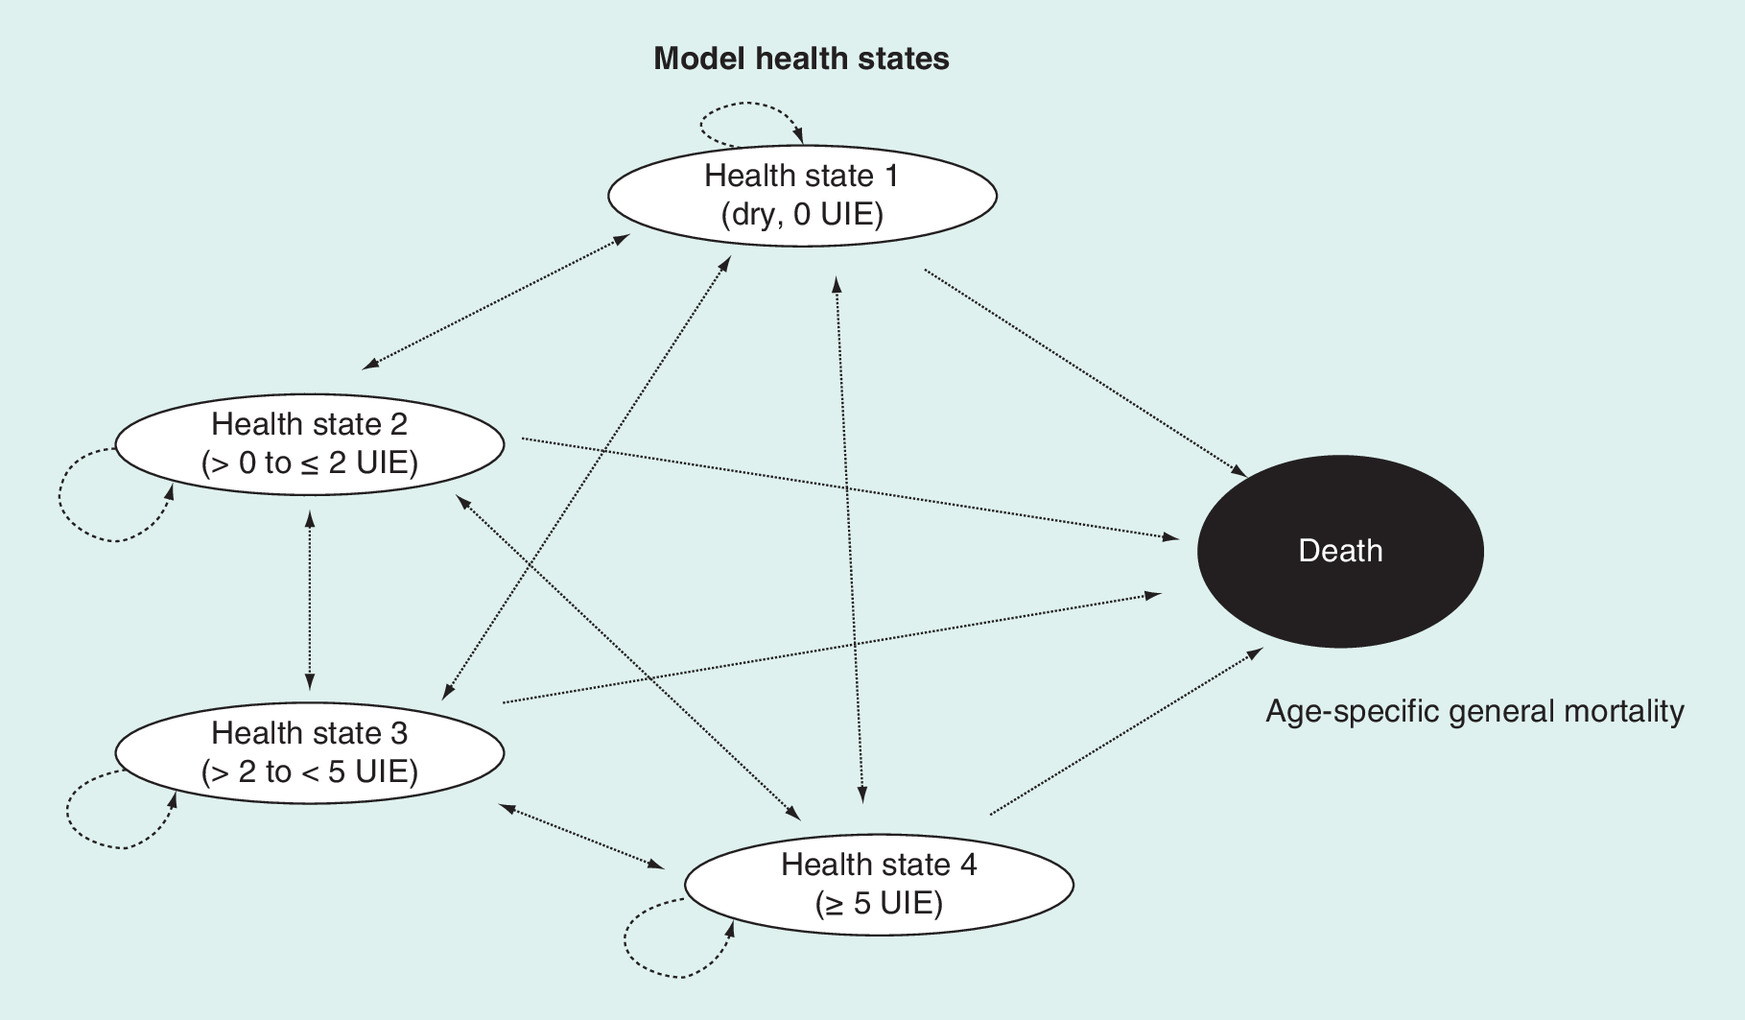
Figure 1. Model diagram and health states.
At baseline and at the end of model cycle 1 (week 12), patients are distributed across health states 1–4 as observed from the pooled onabotulinumtoxinA 100U trial patient level. Patients receive either BSC or whichever comparator is selected. Patients assigned to BSC remain on this treatment for the duration of the model. Patients assigned to the selected comparator remain on that treatment if they respond; if they do not respond, they revert to BSC for the duration of the model.
BSC: Best supportive care; UIE: Urinary incontinence episode.
| Parameter | Input | Ref. |
|---|---|---|
| Costs and resource use of onabotA | ||
| Per injection unit cost of onabotA 100U | $591 | RED BOOK™ 2016 [8] |
| Administration as hospital outpatient | $581 | MDCR reimbursement rates 2016 [16] |
| Administration in ambulatory clinic office/physician office | $311 | MDCR reimbursement rates 2014 [16] |
| Administration in ambulatory surgery center | $1605 | ASC payment rate [17] |
| Cost and resource use for BSC | ||
| Proportion of patients using anticholinergics | 24% | Expert opinion |
| Average monthly cost of anticholinergics | $211 | RED BOOK 2016 [8] |
| Cost and resource use for SNS | ||
| Cost of testing | $11,080 | MDCR reimbursement rates 2015 [16] |
| Cost of the permanent implant | $16,336 | MDCR reimbursement rates 2015 [16] |
| Cost of additional physician visits (follow-up) | $220 | MDCR reimbursement rates 2015 [16] |
| Cost of battery replacement | $16,336 | MDCR reimbursement rates 2015 [16] |
| Cost of revision | $1091 | MDCR reimbursement rates 2015 [16] |
| Cost of device explantation | $16,336 | MDCR reimbursement rates 2015 [16] |
| Cost and resource use for PTNS | ||
| Cost of treatment (0–3 months) | $1483 | Peters et al. 2010 [11] |
| Cost of treatment (3–6 months) | $618 | Peters et al. 2013a [12] |
| Cost of treatment (after 6 months) | $371 | Peters et al. 2013a [12] and Peters et al. 2013b [13] |
| Cost and resource use for mirabegron and anticholinergics | ||
| Mirabegron 25 and 50 mg | $282 | RED BOOK 2016 [8] |
| Tolterodine ER | $208 | RED BOOK 2016 [8] |
| Solifenacin 5 and 10 mg | $274 | RED BOOK 2016 [8] |
| Adverse event resource use and cost | ||
| Cost per CIC | $3 | Noridian Healthcare Solutions, LLC 2013 [18] |
| Medication cost to treat UTI | $4 | RED BOOK 2016 [8] |
| Medical care cost to treat UTI | $73 | AMA 2014 [19] |
| Proportion of patients on SNS receiving surgical intervention at 12 months | 8% | Noblett 2014 [10] |
| Proportion of patients on SNS requiring device explantation at 12 months | 5% | Noblett 2014 [10] |
| Health state utility values, mean (SD)† | I-QOL scores mapped to EQ-5D scores | |
| Dry | 0.918 (0.044) | Kay et al. 2013 [9] |
| >0–≤2 UIEs | 0.874 (0.052) | Kay et al. 2013 [9] |
| >2–<5 UIEs | 0.846 (0.048) | Kay et al. 2013 [9] |
| ≥5 UIEs | 0.822 (0.05) | Kay et al. 2013 [9] |
All monetary values in US dollars.
†Utility values are not treatment-specific.
AMA: American Medical Association; ASC: Ambulatory surgical center; BSC: Best supportive care; CIC: Clean intermittent catheterization; EQ-5D: EuroQol five dimensions health-related quality of life questionnaire; ER: Extended release; I-QOL: Incontinence quality of life questionnaire; MDCR: Medicare; OnabotA: OnabotulinumtoxinA; PTNS: Percutaneous tibial nerve stimulation; SD: Standard deviation; SNS: Sacral nerve stimulation; UIE: Urinary incontinence episode; UTI: Urinary tract infection.
Transition probabilities
Transition probabilities were calculated to assess the probability of transitioning to a different health state at the end of each model cycle for each treatment arm. BSC and onabotA 100U transition probabilities were derived from pooled Phase III onabotA clinical trial records [20,21] and a long-term extension study of the same patients [22]. Transitions for BSC were derived from data on placebo patients from the pooled trial population. Because randomization in the Phase III trials was not maintained after week 12 (patients were allowed to cross over to onabotA 100U), no transition probabilities were applied in model cycle 2 or beyond, and it was assumed that patients treated with BSC would maintain the health state they were in at the end of model cycle 1 (week 12) throughout the entire time horizon (Supplementary Table 1). Transitions for patients on onabotA 100U were derived directly from the pooled Phase III trial data on patients randomized to the onabotA 100U arm and applied at the appropriate time points as follows: at the end of model cycle 1 (week 12; Supplementary Table 1); the average transition probability for model cycles 2–4 was applied at the end of each respective model cycle (year 1; Supplementary Table 2). Pooled Phase III data on patients who remained on onabotA 100U for ≥12 months were used to approximate long-term efficacy (beyond year 1); the average transition probability for model cycles 5–8 was applied at the end of each respective model cycle 1 (year 2; Supplementary Table 3); the average transition probability for model cycles 9–16 was applied at the end of each respective cycle and beyond year 2 (Supplementary Table 4). The baseline distribution and transition probabilities for the health states utilized in the model were not available in the SNS and PTNS literature because no data were available regarding transition probabilities displaying the distribution of patients across different UIE cutoffs. Hence, UIE distributions for SNS and PTNS were assumed to be equal to onabotA 100U at baseline. For solifenacin, tolterodine and mirabegron, results of the network meta-analysis were converted into probabilities for transitioning between health states through a simulation that applied the specific comparator treatment effect results from the original analysis (Supplementary Methods, Part II).
Utilities
The average utility value associated with each health state was derived from pooled patient-level data from the onabotA trials [20–22]. Utility values were calculated from the EuroQol five dimensions HRQoL questionnaire scores, which were obtained from the Incontinence Quality of Life questionnaire scores collected throughout the trial using a pre-existing mapping algorithm [9]. The Incontinence Quality of Life questionnaire was administered regularly during these trials to capture HRQoL information.
Resource utilization & discontinuation rates
The model accounted for costs of all included therapies (including administration/implantation costs for SNS, PTNS and onabotA), costs to manage AEs for onabotA and SNS, and costs of follow-up physician visits across all treatments. Resource utilization and unit cost data were obtained from published sources and MarketScan® data from 2016 (Table 1) [11–13,19,23]. Based on clinical input wherein patients may remain on anticholinergic therapy even after treatment failure in the absence of any other therapy, the base-case analysis assumed that a subset of patients receiving BSC (23.9%) was still undergoing anticholinergic therapy [22]. The cost of continued use of anticholinergic therapy in the BSC arm was included in the model without any associated gain in efficacy. Patients were permitted to discontinue treatment once in the model but could not return to the same treatment. All discontinued patients were assumed to receive BSC. Discontinuation rules for onabotA 100U are outlined in detail in the Supplementary Methods (Part I) and data derived from pooled clinical trials [20–22]. In the base case, patients were permitted to remain on onabotA 100U unless they failed to experience a treatment response (i.e., 50% reduction in UIEs) following receipt of 2 injections. The proportion of patients discontinuing SNS and PTNS treatment was based on published and unpublished literature [3,11–13,20–22]. The patients considered nonresponders to SNS were those who did not achieve treatment response following their testing procedure. The patients who did not achieve treatment response within the first 3 months of PTNS were assumed to discontinue therapy. Data regarding discontinuation during treatment maintenance (i.e., after model cycle 3) was derived from PTNS long-term trials [11–13]. Data related to treatment discontinuation of solifenacin, tolterodine and mirabegron were based on a retrospective claims analysis [22]. The patients who discontinued therapy transitioned to BSC.
Adverse events
AEs in the model incurred costs and an associated transient utility decrement. Data for AEs specific to onabotA and BSC included costs associated with the occurrence of urinary retention (resulting in the need for clean intermittent catheterization) and urinary tract infections (UTIs) and were obtained from patient-level data in the onabotA clinical trials [20–22]. Based on the SNS postapproval study, 25% of patients receiving SNS were assumed to experience minor device-related AEs (e.g., undesirable change in stimulation, site pain, site infection and lead fracture) [24]. As a consequence of inadequate management of urinary incontinence, one UTI episode was assumed per patient. Incurred costs associated with AEs related to mirabegron (25 and 50 mg) included UTI treatment costs (i.e., drug therapy and physician visits) and costs associated with hypertension (one physician visit). No AEs were included in the model for PTNS, solifenacin 5 and 10 mg or tolterodine ER. Given limited published evidence on AEs in the OAB population, a simple 5% utility decrement was assumed, based on a published cost–effectiveness model by Chen and colleagues [25]. A 5% utility decrement of 5 days (assumed duration of a UTI event) was uniformly associated with patients who experienced a UTI event.
Base-case analysis
The overall costs and effects of onabotA 100U, SNS, PTNS, anticholinergics (e.g., solifenacin 5 or 10 mg, tolterodine ER) and mirabegron (25 or 50 mg) were compared with BSC. The base-case analysis assumed that a subset of patients receiving BSC (23.9%) were receiving anticholinergic therapy, utilized a 3% discount rate, and analyzed data over a 10-year time horizon. Outcomes were expressed as costs (2014 US dollars) per QALY.
Scenario & sensitivity analyses
Incremental cost–effectiveness ratios (ICERs) were calculated for a range of scenario analyses to evaluate major underlying assumptions, including discount rates of 0 and 6%, 1- and 5-year time horizons, no anticholinergic use in the BSC treatment arm, utilization of baseline instead of week 12 health state distributions to model the BSC treatment arm, and not allowing retreatment for patients not responding to their initial onabotA injection instead of allowing for 2 injections. Parameter uncertainty was investigated through deterministic one-way sensitivity analyses (OWSAs) and probabilistic sensitivity analyses (PSAs). Key model parameters were independently varied over a plausible range determined by the standard error of each variable. In line with the recommended approach for handling uncertainty around transitional probabilities [26], these parameters were varied using the Dirichlet distribution. For parameters for which a measure of uncertainty was not available, the range was estimated as ± 10% of the point estimate in the OWSAs. For the PSAs, parameters were assigned a distribution based on the underlying data. The PSAs were conducted using 1000 iterations and the Monte Carlo method [27], and a willingness-to-pay (WTP) threshold of $100,000 was employed as a reference.
Results
Base-case economic model results
Based on a 10-year time horizon, the estimated number of UIEs per patient per year for the evaluated treatments ranged from 1076 for onabotA 100U to 1480 for BSC (Table 2). The costliest therapy was SNS at $27,823 per patient over 10 years and the least expensive was BSC at $11,460 per patient. Total number of QALYs gained was greatest for patients receiving onabotA 100U (7.179) compared with BSC (7.069). QALYs accrued in the other treatment arms ranged from 7.071 with tolterodine ER to 7.125 with SNS (Table 2). OnabotA 100U resulted in a cost difference of $3599 when compared with BSC (Table 2 and Supplementary Figure 1). Treatment with onabotA 100U was most cost-effective relative to BSC, with an estimated ICER of $32,680/QALY gained. The next lowest ICER/QALY gained was observed for PTNS ($71,126). Compared with BSC, all other assessed treatments yielded an ICER above the $100,000 threshold (Table 2).
| Treatment | UIEs (PPPY) | Total costs | QALYs† | Incremental costs vs BSC | Incremental QALYs vs BSC† | ICER ($ per QALY) |
|---|---|---|---|---|---|---|
| BSC | 1480 | $11,460 | 7.069 | Reference | Reference | N/A |
| OnabotA 100U | 1076 | $15,059 | 7.179 | $3599 | 0.110 | $32,680 |
| SNS | 1271 | $27,823 | 7.125 | $16,363 | 0.057 | $288,096 |
| PTNS | 1359 | $14,103 | 7.106 | $2643 | 0.037 | $71,126 |
| Mirabegron (25 mg) | 1464 | $14,745 | 7.073 | $3285 | 0.004 | $794,395 |
| Mirabegron (50 mg) | 1462 | $14,738 | 7.073 | $3278 | 0.005 | $697,803 |
| Tolterodine ER (4 mg) | 1472 | $12,776 | 7.071 | $1316 | 0.002 | $687,849 |
| Solifenacin (5 mg) | 1463 | $13,342 | 7.072 | $1882 | 0.004 | $527,018 |
| Solifenacin (10 mg) | 1466 | $13,335 | 7.073 | $1875 | 0.005 | $409,245 |
Estimated total costs in US dollars (per patient) and QALYs over 10-year time period; all treatments discounted using 3.0% annual rate.
†Values rounded to nearest three decimal places.
BSC: Best supportive care; ER: Extended release; ICER: Incremental cost–effectiveness ratio; OnabotA: OnabotulinumtoxinA; PPPY: Per patient per year; PTNS: Percutaneous tibial nerve stimulation; QALY: Quality-adjusted life-year; SNS: Sacral nerve stimulation; UIE: Urinary incontinence episode.
Scenario & sensitivity analyses
In scenario analyses, ICERs exceeded $100,000/QALY across a 5-year time horizon for all comparators with the exception of onabotA 100U and PTNS. Over a 1-year time horizon, all comparators exceeded $100,000 (Table 3). All other scenarios evaluated had minimal impact on base-case model results, and no treatments other than onabotA 100U and PTNS were cost-effective at a $100,000/QALY threshold. For all scenario analyses, when compared with BSC, onabotA 100U was more cost-effective than any other treatment (Table 3). OnabotA 100U demonstrated a >50% probability of being cost-effective using a WTP threshold of $35,000/QALY and >99% probability using a $50,000/QALY WTP threshold (Figure 2). When compared with BSC, PTNS only became cost–effective with a 50% probability at a WTP threshold of $75,000/QALY. Other treatments required a much higher WTP to be cost–effective (Figure 2). Sensitivity analyses, both one-way and probabilistic, supported the base-case findings. OWSAs demonstrated that results with onabotA 100U were most influenced by the use of anticholinergics in the BSC arm (23.9%; Supplementary Figure 2). However, reducing or increasing this value from 20.1 to 27.9% had no marked impact on the ICER range (29,211–$35,987). PSAs for onabotA 100U showed that the proportion of patients receiving BSC in each health state (33.0%) and follow-up physician visit costs (18.0%) accounted for the most uncertainty in the model (Supplementary Figure 3).
| Incremental | |||
|---|---|---|---|
| Treatment scenario | Cost | QALY† | ICER |
| Discount rate: 0% (costs and effects) | |||
| OnabotA 100U vs BSC | $3735 | 0.121 | $30,821 |
| SNS vs BSC | $16,735 | 0.064 | $262,881 |
| PTNS vs BSC | $2704 | 0.039 | $69,737 |
| Mirabegron (25/50 mg) vs BSC | $3348/$3341 | 0.004/0.005 | $794,271/$697,712 |
| Tolterodine ER (4 mg) vs BSC | $1325 | 0.002 | $687,808 |
| Solifenacin (5/10 mg) vs BSC | $1895/$1887 | 0.004/0.005 | $527,001/$409,235 |
| Discount rate: 6% (costs and effects) | |||
| OnabotA 100U vs BSC | $3484 | 0.101 | $34,522 |
| SNS vs BSC | $16,056 | 0.051 | $313,760 |
| PTNS vs BSC | $2589 | 0.036 | $72,478 |
| Mirabegron (25/50 mg) vs BSC | $3227/$3221 | 0.004/0.005 | $794,510/$697,887 |
| Tolterodine ER (4 mg) vs BSC | $1308 | 0.002 | $687,887 |
| Solifenacin (5/10 mg) vs BSC | $1871/$1863 | 0.004/0.005 | $527,034/$409,255 |
| 1-year time horizon | |||
| OnabotA 100U vs BSC | $2103 | 0.019 | $110,858 |
| SNS vs BSC | $15,041 | 0.008 | $1,812,332 |
| PTNS vs BSC | $1743 | 0.013 | $131,793 |
| Mirabegron (25/50 mg) vs BSC | $2015/$2011 | 0.003/0.003 | $797,935/$700,400 |
| Tolterodine ER (4 mg) vs BSC | $1085 | 0.002 | $689,172 |
| Solifenacin (5/10 mg) vs BSC | $1548/$1541 | 0.003/0.004 | $527,569/$409,579 |
| 5-year time horizon | |||
| OnabotA 100U vs BSC | $3255 | 0.079 | $41,405 |
| SNS vs BSC | $1452 | 0.035 | $387,998 |
| PTNS vs BSC | $2643 | 0.037 | $71,126 |
| Mirabegron (25/50 mg) vs BSC | $3257/$3251 | 0.004/0.005 | $794,466/$697,855 |
| Tolterodine ER (4 mg) vs BSC | $1316 | 0.002 | $687,850 |
| Solifenacin (5/10 mg) vs BSC | $1882/$1874 | 0.004/0.005 | $527,018/$409,246 |
| No anticholinergic therapy use in BSC arm | |||
| OnabotA 100U vs BSC | $5868 | 0.110 | $53,285 |
| SNS vs BSC | $19,343 | 0.057 | $340,573 |
| PTNS vs BSC | $3718 | 0.037 | $100,044 |
| Mirabegron (25/50 mg) vs BSC | $4005/$3999 | 0.004/0.005 | $968,535/$851,075 |
| Tolterodine ER (4 mg) vs BSC | $1748 | 0.002 | $913,295 |
| Solifenacin (5/10 mg) vs BSC | $2316/$2308 | 0.004/0.005 | $648,425/$503,898 |
| Baseline data used to model BSC arm | |||
| OnabotA 100U vs BSC | $3243 | 0.156 | $20,799 |
| SNS vs BSC | $16,041 | 0.098 | $163,399 |
| PTNS vs BSC | $2475 | 0.059 | $42,049 |
| Mirabegron (25/50 mg) vs BSC | $3172/$3166 | 0.019/0.019 | $169,901/$164,587 |
| Tolterodine ER (4 mg) vs BSC | $1249 | 0.011 | $117,557 |
| Solifenacin (5/10 mg) vs BSC | $1814/$1807 | 0.012/0.013 | $147,219/$135,511 |
| OnabotA nonresponders not offered 1 retreatment | |||
| OnabotA 100U vs BSC | $3014 | 0.105 | $28,713 |
All monetary values in US dollars.
†Values rounded to nearest three decimal places.
BSC: Best supportive care; ER: Extended release; ICER: Incremental cost–effectiveness ratio; OnabotA: OnabotulinumtoxinA; PTNS: Percutaneous tibial nerve stimulation; QALY: Quality-adjusted life-year; SNS: Sacral nerve stimulation.
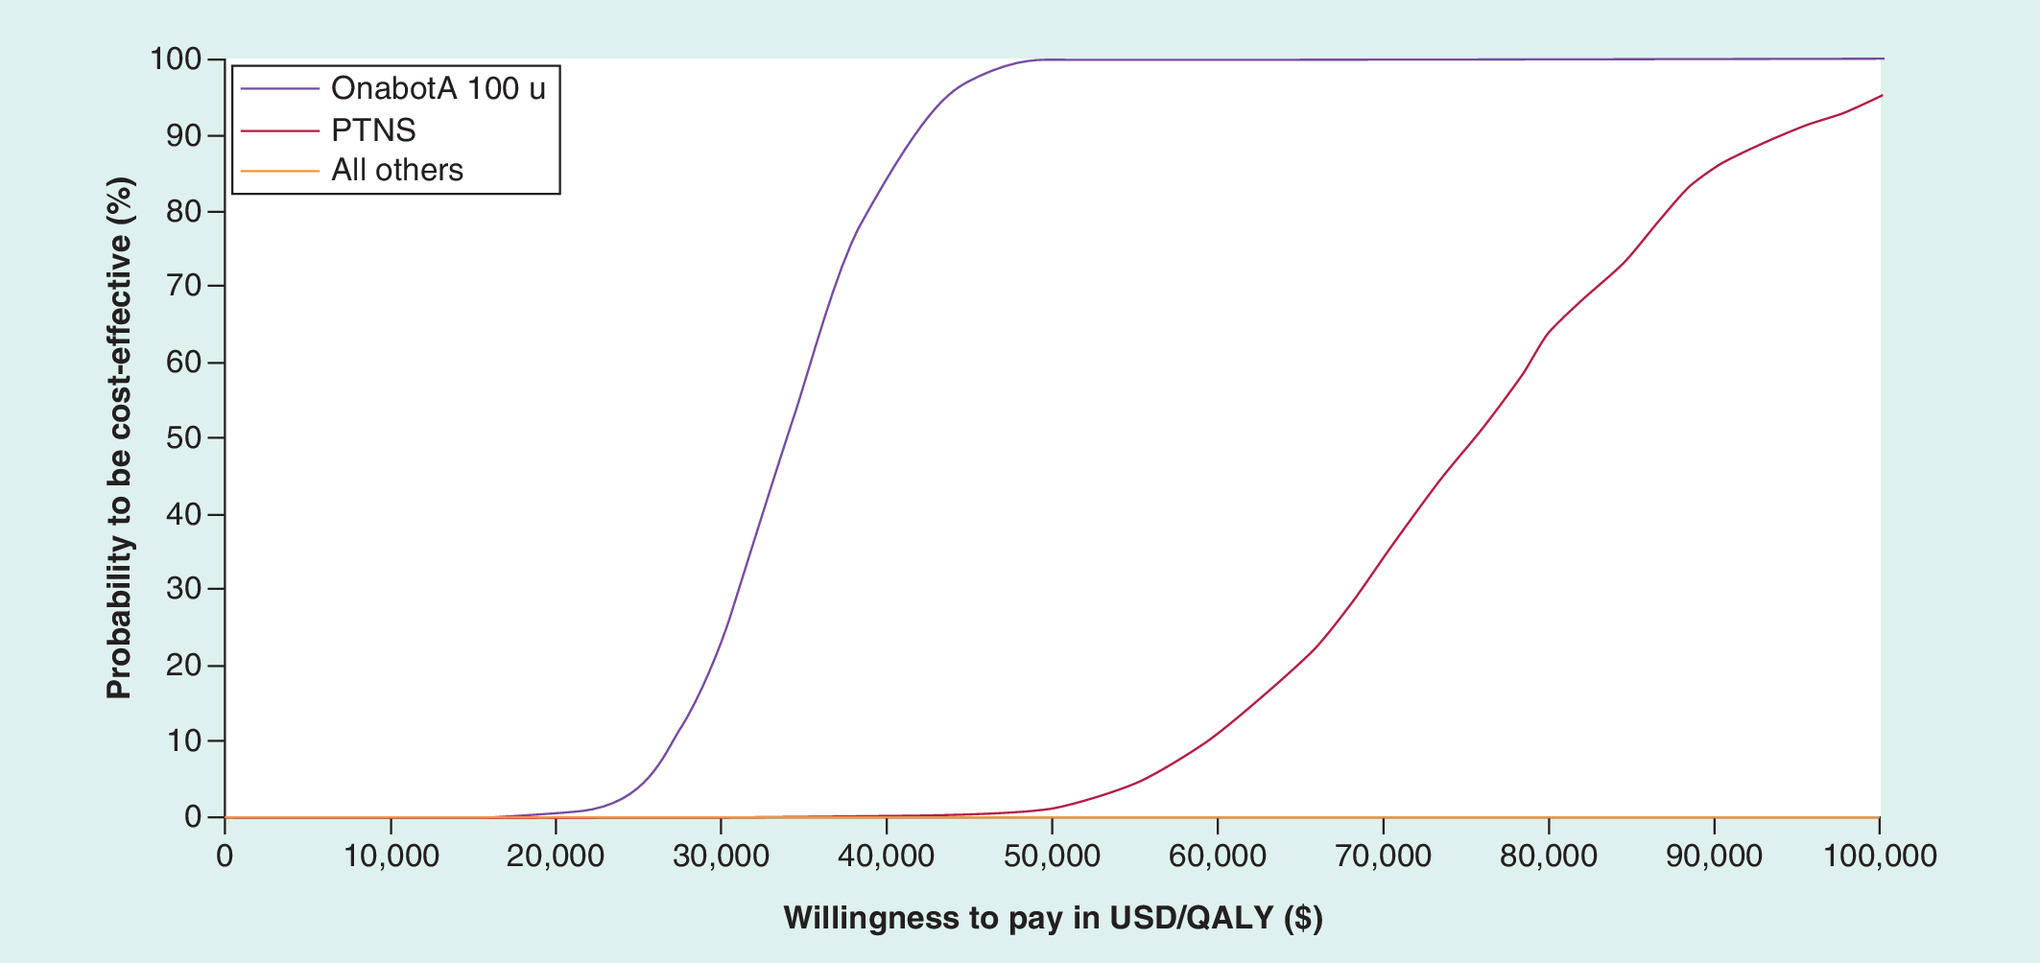
Figure 2. Cost–effectiveness acceptability curves of overactive bladder treatments compared with best supportive care.
The graph above shows the probability that each respective treatment is cost-effective compared with best supportive care (y-axis) under increasing willingness-to-pay thresholds (x-axis).
OnabotA: OnabotulinumtoxinA; PTNS: Percutaneous tibial nerve stimulation; QALY: Quality-adjusted life-year; USD: US dollars.
Discussion
The results of this study show that when compared with BSC, onabotA is the most cost-effective therapy for refractory OAB from the US payer perspective relative to other available treatments, including SNS, PTNS, anticholinergic medications and mirabegron. PSAs showed that onabotA is the most cost-effective treatment and that there is close to 100% probability that the ICER for onabotA is <$50,000 per QALY gained. Model results were shown to be robust, with only a minor impact on the onabotA ICER based on the varying assumptions assessed in sensitivity and scenario analyses. To our knowledge, this is the first model that provides a comprehensive evaluation across both pharmacologic and nonpharmacologic treatment options for the management of refractory OAB.
Comparison of other OAB economic models
Several other OAB economic models have been published. In The Netherlands, Leong et al. [28] compared onabotA with SNS and reported SNS to be more cost-effective over the long term (>5 years), whereas in the model presented here, onabotA 100U was shown to dominate SNS (i.e., less costly and more effective) at any time horizon. These differences appear to be in large part due to the disparity in treatment costs assumed (i.e., the cost of onabotA treatment was €1854 in Leong et al. vs $1265.28 here, and the cost of SNS treatment was €10,585.50 in Leong et al. vs $15,436.90 here). Further, the reported QALY according to time horizon presented by Leong et al. appeared to be inconsistent with their stated assumptions [28]. For instance, in Leong et al. [28], patients appeared to gain 1.66 QALYs with a 1-year time horizon, which seems implausible because neither health state had a utility >1, and the onabotA treatment arm experienced no incremental utility gain over BSC beyond the first year.
A group of models employed a similar structure to the Dutch model, comparing SNS with other treatments including onabotA, PTNS or optimized medical treatment [29–31]. These models were populated with parameters specific to a Spanish, UK or Italian context. Although each of these publications concluded that SNS was the most cost-effective option, it is unclear how the authors arrived at this conclusion. In the Spanish model by Arlandis et al. [29], assumptions pertaining to model structure, treatment outcomes and cost were not sufficiently described (e.g., therapy switch, handling of treatment failure, calculation of dropout rates and the nature and timing of treatment costs at different stages in the model). Further, in the UK and Italian models by Autiero et al. and Bertapelle et al. [30,31], respectively, application of the stated assumptions could only show a much lower number of QALYs gained for SNS than for onabotA and higher SNS-associated costs in the case of Bertapelle and colleagues, although these papers reported the opposite. On this basis, the assumptions built on unit costs applied over the modeled time horizons outlined in the models by Arlandis et al. [29], Autiero et al. [30] and Bertapelle et al. [31] (i.e., lower number of QALYs gained for onabotA vs SNS) appear similarly discrepant as documented by Leong et al. [28].
In a Canadian study, Hassouna et al. [32] compared SNS versus onabotA and optimized medical therapy and concluded that SNS was the most cost-effective treatment in the management of refractory OAB. However, the authors failed to provide any specific cost or utility assumptions or the actual utility value employed in the model. Consequently, it remains unclear what influenced the greater incremental improvement for SNS relative to the other comparators in the Canadian model.
An additional cost–effectiveness model was developed by Visco and colleagues based on the results of the ABC trial [33], a study that directly compared the safety and efficacy of anticholinergic medication (e.g., solifenacin 5 or 10 mg or trospium XR 60 mg) with onabotA for management of urinary urgency incontinence. This model indicated that costs and effectiveness were comparable between anticholinergic medication and onabotA during the initial 6 months of treatment, although a longer treatment time frame of 9 months showed that onabotA may lead to lower costs relative to anticholinergic therapies. The ABC trial [33] was included in the systematic literature review and network meta-analysis used to demonstrate the relative efficacy of anticholinergics in the model used in the present study, and our overall results are in line with the findings from that trial.
Recent data have been published from the InSite study [24,34] and ROSETTA trial [35], the latter being a head-to-head trial that compared the safety and efficacy of SNS and onabotA. Of note, the ROSETTA investigators intend to utilize data from the 2-year follow-up period to model the cost–effectiveness of onabotA and SNS using all data collected, including real-world health resource utilization and HRQoL [36]. Once available, these findings will undeniably supplement the extant literature by enhancing our understanding of the clinical and cost utility of these treatments for OAB.
Limitations & strengths
The sensitivity analyses did not account for alternate patient pathways and disease progression through model health states by exploring scenarios with varying transition probabilities. Additionally, any potential heterogeneity within the examined patient population was not considered in this model, although sensitivity analyses conducted to address uncertainty around parameter estimates did not appear to influence the overall findings. Some strengths of our model included the base-case comparison of onabotA 100U with BSC, wherein the model simulated data from a randomized, double-blind, placebo-controlled, Phase III clinical trial and a long-term extension study. Notably, HRQoL data were collected directly from patients using a validated, disease-specific instrument [9]. In addition, key model assumptions were validated by external experts.
Conclusion
In this cost–effectiveness model, onabotA 100U generated more QALYs than BSC and all other treatment comparators for management of OAB refractory to anticholinergic therapy. From the perspective of a US payer, when compared with BSC, onabotA appears to be the most cost–effective therapy owing to the highest estimated ICER compared with SNS, PTNS, solifenacin, tolterodine ER and mirabegron for patients with OAB who have an inadequate response to or are intolerant of an oral anticholinergic therapy.
Overactive bladder represents a prevalent and chronic condition that imposes a high health and economic burden.
Understanding the cost–effectiveness of available treatment options for management of overactive bladder is crucial for guiding treatment decision making.
The present study evaluated onabotulinumtoxinA, implantable sacral nerve stimulation devices, percutaneous tibial nerve stimulation, anticholinergic medications and mirabegron compared with best supportive care for management of refractory overactive bladder.
Of the available treatment options examined in this study, onabotulinumtoxinA was the most cost-effective for management of overactive bladder in patients who have inadequate response to or are intolerant of oral anticholinergic therapy.
Acknowledgments
All authors adhered to the ICMJE authorship criteria by participating in the study design/conduct, data interpretation, as well as review and final approval of the manuscript for submission.
Financial & competing interests disclosure
This study was funded by Allergan plc, Dublin, Ireland. Neither honoraria nor payments were provided for authorship. B Murray is a consultant and speaker for Allergan plc. SH Hessami is a consultant and speaker for Allergan plc. D Gultyaev is a consultant for Allergan plc and an employee of Analytica LASER. J Lister is a consultant for Allergan plc and an employee of Analytica LASER. R Dmochowski is a consultant and speaker for Allergan plc. KK Gillard is a consultant for Allergan plc and an employee of Xcenda. S Stanisic is a consultant for Allergan plc and an employee of Analytica LASER. A Tung and R Boer are both employees of Allergan plc. S Kaplan has no disclosures to report. The authors have no other relevant affiliations or financial involvement with any organization or entity with a financial interest in or financial conflict with the subject matter or materials discussed in the manuscript apart from those disclosed.
Editorial assistance was provided by BO Hartaigh and KE Smoyer of Evidence Scientific Solutions, Philadelphia, PA, and funded by Allergan plc.
Supplementary data
To view the supplementary data that accompany this paper please visit the journal website at: Supplementary Material
Open access
This work is licensed under the Attribution-NonCommercial-NoDerivatives 4.0 Unported License. To view a copy of this license, visit http://creativecommons.org/licenses/by-nc-nd/4.0/
Supplementary Material
File (supplementary materials.docx)
- Download
- 133.64 KB
References
Papers of special note have been highlighted as: • of interest; •• of considerable interest
1.
Stewart WF, Van Rooyen JB, Cundiff GW et al. Prevalence and burden of overactive bladder in the United States. World J. Urol. 20(6), 327–336 (2003).
•• This is a seminal paper describing the prevalence and burden of overactive bladder (OAB).
2.
Milsom I, Coyne KS, Nicholson S, Kvasz M, Chen CI, Wein AJ. Global prevalence and economic burden of urgency urinary incontinence: a systematic review. Eur. Urol. 65(1), 79–95 (2014).
•• This is a seminal paper describing the prevalence and burden of OAB.
3.
Gormley EA, Lightner DJ, Burgio KL et al. Diagnosis and treatment of overactive bladder (non-neurogenic) in adults: AUA/SUFU guideline. J. Urol. 188(6 Suppl.), 2455–2463 (2012).
•• This is a seminal paper describing the most relevant guidelines for OAB management in the USA.
4.
Gormley EA, Lightner DJ, Faraday M, Vasavada SP. American Urological Association, Society of Urodynamics; Female Pelvic Medicine. Diagnosis and treatment of overactive bladder (non-neurogenic) in adults: AUA/SUFU guideline amendment. J. Urol. 193(5), 1572–1580 (2015).
•• This is an update of the guidelines for OAB management in the USA.
5.
Weiss JP. Nocturia: focus on etiology and consequences. Rev. Urol. 14(3–4), 48–55 (2012).
6.
Wielage RC, Perk S, Campbell NL et al. Mirabegron for the treatment of overactive bladder: cost–effectiveness from US commercial health-plan and medicare advantage perspectives. J. Med. Econ. 19(12), 1135–1143 (2016).
7.
Mansley EC, Carroll NV, Chen KS et al. Good research practices for measuring drug costs in cost–effectiveness analyses: a managed care perspective: the ISPOR Drug Cost Task Force report--Part III. Value Health 13(1), 14–17 (2010).
8.
Micromedex RED BOOK Online® 2.0. A comprehensive, consistent drug pricing resource. http://truvenhealth.com/Products/Micromedex/Product-Suites/Clinical-Knowledge/RED-BOOK.
9.
Kay S, Tolley K, Colayco D, Khalaf K, Anderson P, Globe D. Mapping EQ-5D utility scores from the incontinence quality of life questionnaire among patients with neurogenic and idiopathic overactive bladder. Value Health 16(2), 394–402 (2013).
• This is the primary source for derivation of quality-adjusted life-years in the model.
10.
Noblett KL, Cadish LA. Sacral nerve stimulation for the treatment of refractory voiding and bowel dysfunction. Am. J. Obstet. Gynecol. 210(2), 99–106 (2014).
11.
Peters KM, Carrico DJ, Perez-Marrero RA et al. Randomized trial of percutaneous tibial nerve stimulation versus Sham efficacy in the treatment of overactive bladder syndrome: results from the SUmiT trial. J. Urol. 183(4), 1438–1443 (2010).
12.
Peters KM, Carrico DJ, Wooldridge LS, Miller CJ, Macdiarmid SA. Percutaneous tibial nerve stimulation for the long-term treatment of overactive bladder: 3-year results of the STEP study. J. Urol. 189(6), 2194–2201 (2013).
13.
Peters KM, Carrico DJ, Macdiarmid SA et al. Sustained therapeutic effects of percutaneous tibial nerve stimulation: 24-month results of the STEP study. Neurourol. Urodyn. 32(1), 24–29 (2013).
14.
Cameron AP, Anger JT, Madison R, Saigal CS, Clemens JQ. Urologic Diseases in America Project. National trends in the usage and success of sacral nerve test stimulation. J. Urol. 185(3), 970–975 (2011).
15.
York Health Economics Consortium. Allergan data on file. Network meta-analysis for BOTOX: mirabegron and anticholinergics (2016).
16.
Centers for Medicare and Medicaid Services Medicare Physician Fee Schedule. www.cms.gov/Medicare/Medicare-Fee-for-Service-Payment/PhysicianFeeSched/.
17.
Centers for Medicare and Medicaid Services Ambulatory Surgical Center (ASC) Payment Rates. www.cms.gov/Medicare/Medicare-Fee-for-Service-Payment/ASCPayment/archive.html.
18.
Noridian Healthcare Solutions Durable Medical Equipment Coding System Fee Schedule Lookup Tool. https://med.noridianmedicare.com/web/jddme/fees-news/fee-schedules/lookup-tool.
19.
American Medical Association. Code Book (2016). https://ocm.ama-assn.org/OCM/CPTRelativeValueSearch.do.
20.
Chapple C, Sievert KD, Macdiarmid S et al. OnabotulinumtoxinA 100 U significantly improves all idiopathic overactive bladder symptoms and quality of life in patients with overactive bladder and urinary incontinence: a randomised, double-blind, placebo-controlled trial. Eur. Urol. 64(2), 249–256 (2013).
21.
Nitti VW, Dmochowski R, Herschorn S et al. OnabotulinumtoxinA for the treatment of patients with overactive bladder and urinary incontinence: results of a phase 3, randomized, placebo controlled trial. J. Urol. 189(6), 2186–2193 (2013).
22.
Nitti VW, Ginsberg D, Sievert KD et al. Durable efficacy and safety of long-term onabotulinumtoxinA treatment in patients with overactive bladder syndrome: final results of a 3.5-year study. J. Urol. 196(3), 791–800 (2016).
23.
Allergan plc. MarketScan. Data on file (2016).
24.
Noblett K, Benson K, Kreder K. Detailed analysis of adverse events and surgical interventions in a large prospective trial of sacral neuromodulation therapy for overactive bladder patients. Neurourol. Urodyn. 36(4), 1136–1139 (2017).
25.
Chen HW, Bercik RS, Werner EF, Thung SF. Cost–effectiveness of percutaneous tibial nerve stimulation versus extended release tolterodine for overactive bladder. J. Urol. 187(1), 178–184 (2012).
26.
Briggs AH, Ades AE, Price MJ. Probabilistic sensitivity analysis for decision trees with multiple branches: use of the Dirichlet distribution in a Bayesian framework. Med. Decis. Making 23(4), 341–350 (2003).
27.
Sonnenberg FA, Beck JR. Markov models in medical decision making: a practical guide. Med. Decis. Making 13(4), 322–338 (1993).
28.
Leong RK, De Wachter SG, Joore MA, Van Kerrebroeck PE. Cost–effectiveness analysis of sacral neuromodulation and botulinum toxin A treatment for patients with idiopathic overactive bladder. BJU Int. 108(4), 558–564 (2011).
29.
Arlandis S, Castro D, Errando C et al. Cost–effectiveness of sacral neuromodulation compared to botulinum neurotoxin a or continued medical management in refractory overactive bladder. Value Health 14(2), 219–228 (2011).
30.
Autiero SW, Hallas N, Betts CD, Ockrim JL. The cost–effectiveness of sacral nerve stimulation (SNS) for the treatment of idiopathic medically refractory overactive bladder (wet) in the UK. BJU Int. 116(6), 945–954 (2015).
31.
Bertapelle MP, Vottero M, Popolo GD et al. Sacral neuromodulation and Botulinum toxin A for refractory idiopathic overactive bladder: a cost–utility analysis in the perspective of Italian healthcare system. World J. Urol. 33(8), 1109–1117 (2015).
32.
Hassouna MM, Sadri H. Economic evaluation of sacral neuromodulation in overactive bladder: a Canadian perspective. Can. Urol. Assoc. 9(7–8), 242–247 (2015).
33.
Visco AG, Zyczynski H, Brubaker L et al. Cost–effectiveness analysis of anticholinergics versus botox for urgency urinary incontinence: results from the anticholinergic versus botox comparison randomized trial. Female Pelvic Med. Reconstr. Surg. 22(5), 311–316 (2016).
34.
Siegel S, Noblett K, Mangel J et al. Three-year follow-up results of a prospective, multicenter study in overactive bladder subjects treated with sacral neuromodulation. Urology 94, 57–63 (2016).
35.
Amundsen CL, Richter HE, Menefee SA et al. OnabotulinumtoxinA vs sacral neuromodulation on refractory urgency urinary incontinence in women: a randomized clinical trial. JAMA 316(13), 1366–1374 (2016).
36.
Amundsen CL, Richter HE, Menefee S et al. The refractory overactive bladder: Sacral NEuromodulation vs. BoTulinum Toxin Assessment: ROSETTA trial. Contemp. Clin. Trials 37(2), 272–283 (2014).
Information & Authors
Information
Published In
Copyright
© 2018 Brian Murray et al.
History
Received: 23 July 2018
Accepted: 29 October 2018
Published online: 4 December 2018
Keywords:
Topics
Authors
Metrics & Citations
Metrics
Article Usage
Article usage data only available from February 2023. Historical article usage data, showing the number of article downloads, is available upon request.
Citations
How to Cite
Cost–effectiveness of overactive bladder treatments: from the US payer perspective. (2018) Journal of Comparative Effectiveness Research. DOI: 10.2217/cer-2018-0079
Export citation
Select the citation format you wish to export for this article or chapter.
Citing Literature
- Nesreen Elsaadi, Matthew Buell, Akin S Amasyali, Forrest Jellison, Andrea Staack, Patient-centred coaching programme for improvement of overactive bladder symptoms, Journal of Clinical Urology, 10.1177/20514158251364036, 19, 3, (273-280), (2025).
- Mohamed Abdel-Fattah, Christopher Chapple, Suzanne Breeman, David Cooper, Helen Bell-Gorrod, Preksha Kuppanda, Karen Guerrero, Simon Dixon, Nikki Cotterill, Karen Ward, Hashim Hashim, Ash Monga, Karen Brown, Marcus Drake, Andrew Gammie, Alyaa Mostafa, Rebecca Bruce, Victoria Bell, Christine Kennedy, Suzanne Evans, Graeme MacLennan, John Norrie, Invasive urodynamic investigations in the management of women with refractory overactive bladder symptoms: FUTURE, a superiority RCT and economic evaluation, Health Technology Assessment, 10.3310/UKYW4923, (1-139), (2025).
- Mohamed Abdel-Fattah, Christopher Chapple, David Cooper, Suzanne Breeman, Helen Bell-Gorrod, Preksha Kuppanda, Karen Guerrero, Simon Dixon, Nikki Cotterill, Karen Ward, Hashim Hashim, Ash Monga, Karen Brown, Marcus Drake, Andrew Gammie, Alyaa Mostafa, Rebecca Bruce, Victoria Bell, Christine Kennedy, Suzanne Evans, Graeme MacLennan, John Norrie, Invasive urodynamic investigations in the management of women with refractory overactive bladder symptoms (FUTURE) in the UK: a multicentre, superiority, parallel, open-label, randomised controlled trial, The Lancet, 10.1016/S0140-6736(24)01886-5, 405, 10484, (1057-1068), (2025).
- Agnieszka A. Licow-Kamińska, Sylwester M. Ciećwież, Magdalena Ptak, Dariusz Kotlęga, Agnieszka Brodowska, Quality of Life in Female Patients with Overactive Bladder after Botulinum Toxin Treatment, Toxins, 10.3390/toxins16010007, 16, 1, (7), (2023).
- Kayla Polcari, Max J. Hyman, Ted A. Skolarus, Anne E. Sales, David O. Meltzer, Parth K. Modi, Industry Payments for Vibegron and Prescribing Patterns Among Urologic Clinicians, JAMA Health Forum, 10.1001/jamahealthforum.2023.4020, 4, 12, (e234020), (2023).
- Linda Fenocchi, Helen Mason, Lisa Macaulay, Catriona O’Dolan, Shaun Treweek, Joanne Booth, Cost consequence analysis of transcutaneous tibial nerve stimulation (TTNS) for urinary incontinence in care home residents alongside a randomised controlled trial, BMC Geriatrics, 10.1186/s12877-023-04459-z, 23, 1, (2023).
- Gabriela Gonzalez, Jennifer T. Anger, The Epidemiology and Socioeconomic Impact of Female GU and Pelvic Floor Disorders, Female Genitourinary and Pelvic Floor Reconstruction, 10.1007/978-3-031-19598-3_5, (85-95), (2023).
- Jose Ponce Díaz-Reixa, Marcos Aller Rodríguez, Sara Martínez Breijo, Jorge Suanzes Hernández, Eva Ruiz Casares, Teresa Perucho Alcalde, Manuel Bohorquez Cruz, Teresa Mosquera Seoane, Jose M. Sánchez Merino, Jacobo Freire Calvo, Paula Fernández Suárez, Venancio Chantada Abal, Lower Urinary Tract Symptoms (LUTS) as a New Clinical Presentation of Histamine Intolerance: A Prevalence Study of Genetic Diamine Oxidase Deficiency, Journal of Clinical Medicine, 10.3390/jcm12216870, 12, 21, (6870), (2023).
- Victor Nitti, Cornelia Haag-Molkenteller, Michael Kennelly, Michael Chancellor, Brenda Jenkins, Brigitte Schurch, Treatment of neurogenic detrusor overactivity and overactive bladder with Botox (onabotulinumtoxinA): Development, insights, and impact, Medicine, 10.1097/MD.0000000000032377, 102, S1, (e32377), (2023).
- Nawal Khan, Muhammad Shamim Khan, Sachin Malde, Arun Sahai, Prokar Dasgupta, The translational implications of the science behind the overactive bladder and the role of OnabotulinumtoxinA, The Surgeon, 10.1016/j.surge.2022.09.004, 21, 3, (e126-e132), (2023).