A cost–utility analysis of dulaglutide versus insulin glargine as third-line therapy for Type 2 diabetes in Canada
Abstract
Aim: The prevalence of Type 2 diabetes in Canada is estimated to be 7.6% and rising. Given the substantial economic burden associated with Type 2 diabetes treatment, optimizing healthcare expenditure is extremely important. In the present analysis, we evaluated the cost–effectiveness of dulaglutide 1.5 mg, a once-weekly glucagon-like peptide 1 agonist as third-line therapy relative to insulin glargine from the perspective of a Canadian healthcare payer. Methods: A patient-level cost-utility model of Type 2 diabetes was developed to capture seven microvascular and macrovascular complications and severe and nonsevere hypoglycemia. Cohort characteristics and the relative efficacy of dulaglutide 1.5 mg and insulin glargine were derived from the AWARD-2 head-to-head trial, which was identified by systematic literature review. Cost data were derived from Canadian sources and expressed in 2016 Canadian dollars (CAD), and future cost and quality-adjusted life expectancy (QALE) estimates were discounted at 1.5% per annum. One-way and probabilistic sensitivity analyses were conducted. Results: Based on the AWARD-2 trial, relative to insulin glargine, dulaglutide 1.5 mg was projected to increase QALE by 0.38 quality-adjusted life years and increase costs by CAD 19,773, resulting in an incremental cost–effectiveness ratio of CAD 52,580 per quality-adjusted life year gained. Conclusion: A computer simulation analysis showed that dulaglutide 1.5 mg would likely be cost-effective relative to insulin glargine in patients with Type 2 diabetes inadequately controlled on metformin and sulfonylurea in Canada.
There are currently an estimated 424.9 million adults with Type 1 or Type 2 diabetes mellitus (T2DM) worldwide, and the global prevalence is expected to increase to 628.6 million by 2045 [1]. The current prevalence of T2DM in Canada is estimated to be 7.6%, and this is predicted to rise alongside the global prevalence [2]. The high prevalence is associated with both a high clinical and economic burden, with diabetes resulting in approximately 15,700 deaths each year in Canada [1]. The economic burden of T2DM was estimated to be CAD 12.2 billion in 2010 and is expected to increase to CAD 16.9 billion by 2020 according to estimates from the Canadian Diabetes Association [3].
The substantial costs incurred by T2DM are mainly a consequence of diabetes-associated complications [4]. These can be microvascular or macrovascular and commonly manifest as retinopathy, neuropathy, nephropathy, cardiovascular disease and stroke [5]. Early detection and effective management are imperative for reducing the risk of onset of complications and thereby the subsequent healthcare costs. To that end, numerous drug classes are available for the treatment and management of T2DM including metformin, sulfonylureas, GLP-1 receptor agonists, DPP-4 inhibitors and insulin [6,7]. These drugs target different stages of the disease and are prescribed accordingly.
In 2013, the Canadian Agency for Drugs and Technologies in Health (CADTH) published optimal use reports for second- and third-line agents used for the treatment of adults with T2DM [8,9]. Results of the second-line analysis demonstrated that GLP-1 receptor agonists provided the highest QALE among second-line interventions in patients inadequately controlled on metformin while sulfonylureas added to metformin represented the most cost–effective option. Results of the third-line analysis (i.e., after experiencing insufficient glycemic control with metformin and sulfonylurea) found basal insulin to be the most cost–effective intervention in combination with metformin and sulfonylurea, and was therefore recommened over GLP-1 receptor agonists, DPP-4 inhibitors and biphasic insulin in most patients [9]. The CADTH analyses were conducted using the United Kingdom Prospective Diabetes Study Outcomes Model (UKPDS OM) and driven primarily by the findings of a network meta-analysis (NMA) of the included comparators [9,10]. Conducted in 2013, the NMA included only exenatide twice-daily and liraglutide from the GLP-1 receptor agonist class, excluding agents with more recently published registration trial data such as dulaglutide, albiglutide, exenatide extended-release and lixisenatide.
Dulaglutide (Trulicity®) is a once-weekly injectable GLP-1 receptor agonist evaluated in the Assessment of Weekly Administration of LY2189265 (dulaglutide) in Diabetes (AWARD) trial program [11]. In AWARD-2, dulaglutide was compared with insulin glargine over 52 weeks in patients inadequately controlled with optimized doses of metformin and a sulfonylurea [12]. Results of the AWARD-2 study demonstrated that dulaglutide 1.5 mg once-weekly significantly reduced HbA1c and mean fasting glucose levels while resulting in weight loss of 1.87 kg at week 52 (compared with a weight gain of 1.44 kg with insulin glargine).
The aim of the present study was to conduct a systematic literature review to identify other evidence comparing dulaglutide with insulin glargine, the most frequently prescribed basal insulin in Canada, and then to conduct a cost–effectiveness analysis of dulaglutide relative to insulin glargine in patients inadequately controlled with metformin and a sulfonylurea [13]. In order to conduct an economic analysis most relevant to Canadian healthcare payers, the methods utilized by CADTH were followed as closely as possible.
Methods
Systematic literature review
A systematic literature review was conducted to identify randomized controlled trials (RCTs) in adult patients diagnosed with T2DM and inadequately controlled with metformin and sulfonylurea combination therapy. The search focused on identifying RCTs of all diabetes interventions currently approved for use in Canada, the USA or the EU. Searches were conducted across Medline, EMBASE and the Cochrane Central Register of Controlled Trials; the search strategy for Medline and EMBASE is presented in Supplementary Table 1. All abstracts identified from the searches were assessed for potential eligibility in duplicate, and any disagreement in eligibility was resolved by discussion or by consulting a third adjudicator. Potentially eligible full-text articles were similarly assessed in duplicate and any disagreement resolved by a third adjudicator. A network diagram was constructed based on the studies identified (Supplementary Table 2) in the literature review, with comparators grouped into therapeutic classes (Supplementary Figure 1). A Bayesian NMA was also performed around HbA1c, BMI and severe hypoglycemia, but since the literature review identified only one trial directly comparing insulin glargine with dulaglutide 1.5 mg (AWARD-2) [12], the AWARD-2 data were ultimately used to inform the base case analysis, with the NMA results (Supplementary Material) being used as the basis of a sensitivity analysis. This trial was therefore used to inform the cohort characteristics and treatment effects employed in the analysis.
Model & analyses
A patient-level cost-utility model was developed in Microsoft Excel (Microsoft Corporation, WA, USA) closely following the model structure of the UKPDS OM, described as a ‘probabilistic discrete-time illness-death model’ in the original publication [10]. The incidence of complications was estimated based on risk equations from the UKPDS OM, which has been used by the CADTH in their optimal use report [9]. The UKPDS OM structure, risk equation functional forms, and coefficients have been described previously [10]. Specifically, the model captured incidence of ischemic heart disease, myocardial infarction, stroke, congestive heart failure, end-stage renal disease, blindness and amputation (based on the UKPDS risk equations) and nonsevere and severe hypoglycemia. In addition to implementing the Weibull risk equations from the UKPDS OM, the model incorporated a number of adaptations. Notably, the model included the ability to switch patients to a subsequent treatment at a specific time or in response to reaching a specified risk factor threshold. The model also allowed health-related quality of life disutilities to be associated with self-monitoring of blood glucose (SMBG) testing, excess BMI, including the option to avoid double counting the effect of BMI by simultaneously excluding it as a driver of complication risk. Finally, the model could switch between the UKPDS Gompertz proportional hazards model and Canadian life tables to capture background mortality risk [10,14].
The model was used to run a base case analysis comparing dulaglutide 1.5 mg with insulin glargine based on the AWARD-2 study. In the base case, 20,000 simulated patients were run through the model, at which point incremental QALE and cost had converged sufficiently (with two different random seeds of 27,183 and 31,416; e and π × 105, respectively, rounded to the nearest integer) that further simulations would not have contributed useful information to the analyses.
Cohort
Baseline cohort risk factors were based on the overall population in the AWARD-2 trial (Table 1). AWARD-2 was an open-label, parallel-arm, randomized, multicenter trial comprising three periods: screening/lead-in period of 10–12 weeks, 78 week treatment period and a 4 week safety follow-up period [12]. As the baseline prevalence of all complications was not available from the AWARD-2 population, surrogate estimates were taken from the economic evaluation included in the CADTH therapeutic review of third-line therapies (Table 1), which was in turn derived from the DICE Study or the Ontario and Alberta Diabetes Atlases [15–18]. The cohort characteristics employed by CADTH were relatively well matched to those in AWARD-2 with a similar age (57.7 years vs 56.7 years in AWARD-2), duration of diabetes (9.5 years vs 9.1 in AWARD-2) and HbA1c (8.6% vs 8.1% in AWARD-2).
| Risk factors | Mean | n | SE |
|---|---|---|---|
| Age (years) | 56.66 | 807 | 0.33 |
| Duration of diabetes (years) | 9.10 | 807 | 0.21 |
| Male (%) | 51.3 | 414 | – |
| Baseline HbA1c (%) | 8.14 | 807 | 0.03 |
| Baseline systolic blood pressure (mmHg) | 131.07 | 807 | 0.53 |
| Baseline total cholesterol (mmol/l) | 4.56 | 795 | 0.04 |
| Baseline low-density lipoprotein (mmol/l) | 2.48 | 764 | 0.03 |
| Baseline high-density lipoprotein (mmol/l) | 1.20 | 795 | 0.01 |
| Baseline BMI (kg/m2) | 31.55 | 807 | 0.19 |
| Baseline weight (kg) | 86.31 | 807 | 0.65 |
| Complications | Baseline proportion with history | Ref. | |
| Atrial fibrillation (%) | 1.2 | [12] | |
| Peripheral vascular disease (%) | 2.7 | [12] | |
| Amputation (%) | 1.0 | [18] | |
| Ischemic heart disease (%) | 1.1 | [12] | |
| Congestive heart failure (%) | 0.5 | [12] | |
| Blindness (%) | 1.0 | [18] | |
| Renal failure (%) | 1.0 | [18] | |
| Stroke (%) | 0.9 | [12] | |
| Myocardial infarction (%) | 3.0 | [12] | |
BMI: Body mass index; HbA1c: Glycated hemoglobin; SE: Standard error.
Treatment effects
Treatment effects and rates of hypoglycemia were taken directly from the insulin glargine and dulaglutide arms of the trial at 52 weeks (Table 2), with treatment effects being applied to the baseline characteristics at the start of the analysis. HbA1c and systolic blood pressure (SBP) risk factor progressions over time were modeled in line with the UKPDS OM panel regression equations as previously published [10]. All other risk factors were held constant over time. Treatment intensification to a basal-bolus insulin regimen was modeled at an HbA1c threshold of 9.0% in line with a sensitivity analysis conducted in the CADTH therapeutic review of third-line therapies. At the point of intensification, changes in HbA1c and BMI were applied based on the difference in HbA1c and BMI change in the basal and prandial arms of the 4-T trial (-0.2% and +1.0 kg/m2, respectively) [19]. No change in SBP was modeled based on the non-significant difference between the basal and prandial arms in the 4-T trial [19]. Subsequent to intensification, risk factor progressions were modeled as previously; HbA1c and SBP followed the UKPDS panel regression equations while all other risk factors were held constant for the remainder of the simulation [19]. Rates of nonsevere and severe hypoglycemia after intensification were applied from the prandial insulin arm of the 4-T study (5.5 nonsevere events/patient/year and 0 severe events/patient/year) [19], and SMBG test strip use was assumed to increase to four tests/day in both arms when treatments were intensified.
| Treatment effects | Glargine (n = 262) | Dulaglutide 1.5 mg (n = 273) |
|---|---|---|
| LS mean change from baseline HbA1c, % (SE) | -0.63 (0.06) | -1.08 (0.06) |
| LS mean change from baseline SBP, mmHg (SE) | 0.51 (0.83) | 0.17 (0.81) |
| Mean change from baseline total cholesterol, mmol/l (SE) | 0.026 (0.05) | 0.011 (0.05) |
| Mean change from baseline HDL, mmol/l (SE) | -0.031 (0.01) | -0.009 (0.01) |
| LS mean change from baseline BMI, kg/m2 (SE) | 0.62 (0.08) | -0.64 (0.08) |
| Patients requiring rescue medication by end of trial (%) | 16 (6.1%) | 24 (8.8%) |
| Hypoglycemia rates in AWARD-2 | Glargine | Dulaglutide 1.5 mg |
| Mean nonsevere hypoglycemic event rate per 100 patient years (SE) | 341 (36.82) | 209 (25.60) |
| Mean severe hypoglycemic event rate per 100 patient years (SE) | 1.0 (0.56) | 0.00 (N/A) |
Treatment effects were analyzed using ANCOVA with treatment, country and baseline value as covariates. The LOCF was used in the case of missing data.
ANCOVA: Analysis of covariance; BMI: Body mass index; HDL: High-density lipoprotein; HbA1c: Glycated hemoglobin; LOCF: Last observation carried forward; LS: Least squares; SBP: Systolic blood pressure; SE: Standard error.
Costs & resource use
Drug costs were taken from the Ontario Drug Benefit Formulary/Comparative Drug Index, effective December 2016 (Table 3) [20]. The insulin glargine dose was based on the mean dose of 32.12 international unit (IU)/day in the AWARD-2 trial. Costs associated with each diabetes complication were taken from the 2013 update to the CADTH optimal use report and expressed in 2016 CAD by inflating the CADTH costs (in 2012 CAD) using the Health Component of the Canadian Consumer Price Index (Table 4), which was 120.7 in 2012 and 124.7 in 2016 yielding a multiplier of 1.033 [9].
| Comparator | Drug cost (CAD) | Cost with 8% mark-up (CAD) | Total cost per day (CAD) |
|---|---|---|---|
| Dulaglutide 1.5 mg | 6.97 per day† | 7.52 per day | 7.52 |
| Insulin glargine | 0.0619 per IU‡ | 0.0669 per IU | 2.15§ |
| Basal-bolus (intensification) | 1.69 per day¶ | 1.82 per day | 1.82 |
Drug costs were reported in 2016 Canadian dollars.
†Based on the cost of CAD 195.06 for 4 pens.
‡Based on cost CAD 92.85 per 15 ml pen pack at 100 IU/ml.
§Based on the mean dose of 32.12 IU/day in the AWARD-2 trial.
¶Based on a basal-bolus split of 40–60% at a total dose of 0.4 IU/kg/day, a mean weight based on mean body mass index of 31.55 kg/m2 and mean height as in the AWARD-2 trial, and market share-weighted costs of basal and bolus insulin.
CAD: Canadian dollar; IU: International unit.
| Cost in year of event (CAD) | Cost in subsequent years (CAD) | |
|---|---|---|
| Myocardial infarction | 19,642 | 3072 |
| Stroke | 26,754 | 3712 |
| Congestive heart failure | 17,968 | 5038 |
| Ischemic heart disease | 6147 | 3550 |
| Blindness | 3286 | 2342 |
| First digit amputation | 41501 | 5684 |
| Renal failure | 26628 | 12086 |
| Severe hypoglycemia | 2098 | – |
Complication costs were inflated to 2016 Canadian dollars using the Health Component of the Canadian Consumer Price Index of 120.7 in 2012 and 124.7 in 2016 (1.0331 multiple).
CAD: Canadian dollar.
SMBG test strips were included in the analysis, assuming 3.85 tests per week for dulaglutide based on the maximum reimbursement of 200 test strips for nonhypoglycemia inducing medications in patients with T2DM in Ontario, and 2.08 tests per day for insulin glargine based on a 2010 study by Gomes et al. [21]. The maximum reimbursable number of strips was selected for dulaglutide as a conservative estimate of the SMBG test cost ultimately borne by the healthcare payer while the 2.08 tests per day for insulin glargine was based on utilization data from Canada. The cost per strip was taken to be CAD 0.79 based on the 2016 Ontario drug benefit formulary price of CAD 0.729 plus pharmacy fee [20].
Insulin costs after intensification were assumed to be the same in both arms, based on a market-share weighted cost of basal and bolus insulin, assuming total insulin use of 0.4 IUs/kg/day split into 40% basal insulin and 60% prandial insulin, based on the mid-point of the recommended dose range (and the exact dose split) from the Canadian diabetes association clinical practice guidelines (Table 3) [22].
Quality of life
Health state utility values were taken from a US EQ-5D score catalogue in combination with an amputation disutility based on a Tobit model-derived tariff value (Table 5) [23–25]. The ‘baseline’ quality of life was taken to be 0.753, based on a US catalog of EQ-5D scores from Sullivan et al. and utilized by CADTH in the analyses presented in the Optimal use report of third-line pharmacotherapy for Type 2 Diabetes [9,24]. Disutilities associated with hypoglycemia were taken from a study by Harris et al., which employed a time trade-off approach to estimate the utility values associated with nonsevere and severe hypoglycemia [26]. All 1696 patients who completed the analysis were Canadian, with 49.3% coming from Ontario, 13.3% from British Columbia, 9.2% from Alberta and at least one participant coming from each of the remaining ten provinces/territories [26].
| QoL change in year of event | QoL change in subsequent years | Ref. | |
|---|---|---|---|
| Myocardial infarction | -0.041 | -0.012 | [23,24] |
| Stroke | -0.052 | -0.040 | [23,24] |
| Congestive heart failure | -0.064 | -0.018 | [23,24] |
| Ischemic heart disease | -0.041 | -0.041 | [23,24] |
| Blindness | -0.050 | -0.050 | [23,24] |
| Renal failure | -0.263 | -0.263 | [18] |
| First digit amputation | -0.280 | -0.280 | [25] |
| Nonsevere hypoglycemic event | -0.0028 | N/A | [26] |
| Severe hypoglycemic event | -0.0726 | N/A | [26] |
CADTH: Canadian Agency for Drugs and Technologies in Health; QoL: Quality of life.
A disutility of -0.0061 (standard error 0.001) was applied in the base case analysis for every unit of BMI above 25 kg/m2 in line with the CODE-2 study published by Bagust and Beale in 2005 [27]. The study used a time trade-off approach to establish the disutility associated with each unit of BMI over 25 kg/m2 in a European population enrolled. The CODE-2 population was 50% male and had a mean age at enrollment of 65.9 years, a mean BMI of 28.7 kg/m2 and a mean time since diagnosis of diabetes of 9.3 years [28]. Finally, in addition to the complication, BMI and hypoglycemia-related disutilities, a disutility was also associated with each SMBG test based on an annual disutility of -0.0058 associated with weekly testing, yielding a disutility per test of -0.000111 [29].
Time horizon & discounting
The analysis was conducted over a 40-year time horizon, corresponding to patient lifetimes. Future cost and effectiveness outcomes were discounted at a rate of 1.5% per annum in line with CADTH guidelines on economic evaluation of health technologies [30].
Sensitivity analyses
A series of one-way sensitivity analyses were conducted around the AWARD-2 base case parameters to establish the magnitude of the contributions of individual model parameters to model outcomes. The influence of the analysis time horizon on projected model outcomes was investigated by running analyses over 10, 20 and 30 years. Cost and effectiveness discount rates were set to 0 and 3% (symmetrically) to establish the importance of discounting values to present-day values. Sensitivity analyses were also performed in which the cost of all diabetes complications was increased and decreased by 10% relative to the base case values. Five simulations were then run to assess the key drivers of clinical benefit associated with dulaglutide; in the dulaglutide arm, all risk factors were set to the same values as the insulin glargine arm with changes in HbA1c, systolic blood pressure, serum lipids, BMI and hypoglycemia rates from the comparator arm applied in turn. Disutilities of -0.01 and -0.0000048 were associated with each severe and nonsevere hypoglycemic event based on the CADTH therapeutic review of third-line therapy for Type 2 diabetes base case value. A second analysis was conducted in which a disutility of -0.0033 was applied in line with a sensitivity analysis from the same report and originally reported by Levy et al. for mild-to-moderate hypoglycemia [31]. The -0.0061 disutility associated with each BMI unit above 25 kg/m2 was abolished, and the -0.000111 disutility associated with each additional SMBG test was abolished in a separate analysis and then both the BMI and SMBG disutilities were abolished in the same analysis [27,29]. An insulin glargine dose of 0.53 IUs/kg/day was used to calculate the cost of insulin glargine (in place of the dose from AWARD-2) based on the dose for insulin analogs used in the CADTH therapeutic review of third-line therapy for Type 2 diabetes. The per-kilo dose was converted to a mean dose per patient per day using the mean patient bodyweight in the insulin glargine arm at the end of AWARD-2 (86.31 kg + 1.44 kg = 87.75 kg). Finally, an analysis was run in which the base case assumption of intensifying to basal-bolus insulin therapy at an HbA1c threshold of 9% was changed to intensify therapy after 5 years.
Results
In the base case analysis based on the results of the AWARD-2 trial, dulaglutide 1.5 mg increased QALE by 0.38 quality-adjusted life years (QALYs) relative to insulin glargine with absolute QALE estimates of 12.90 QALYs relative to 12.52 QALYs (Table 6). The increase in QALE was accompanied by an increase in costs from CAD 72,879 to CAD 92,652 over patient lifetimes, yielding a incremental cost–effectiveness ratio (ICER) of CAD 52,580 per QALY gained. The 9% HbA1c threshold for treatment switching resulted in a mean duration of treatment with dulaglutide 1.5 mg of 23.98 years. A cost–effectiveness scatterplot was plotted by grouping patients into cohorts of 50 and plotting the mean incremental cost and QALE for each of the 400 resulting groups (Figure 1). The scatterplot data were then used to generate a cost–effectiveness acceptability curve showing the likelihood that dulaglutide would be cost–effective relative to insulin glargine over a range of willingness-to-pay (WTP) thresholds (Figure 2).
| Cost with insulin glargine (CAD) | Cost with dulaglutide (CAD) | Incremental cost (CAD) | QALE with insulin glargine (QALYs) | QALE with dulaglutide (QALYs) | Incremental QALE (CAD) | ICER (CAD per QALY gained) | |
|---|---|---|---|---|---|---|---|
| Base case analysis | 72,879 | 92,652 | 19,773 | 12.52 | 12.90 | 0.38 | 52,580 |
CAD: Canadian dollar; ICER: Incremental cost–effectiveness ratio; QALE: Quality-adjusted life expectancy; QALY: Quality-adjusted life year.
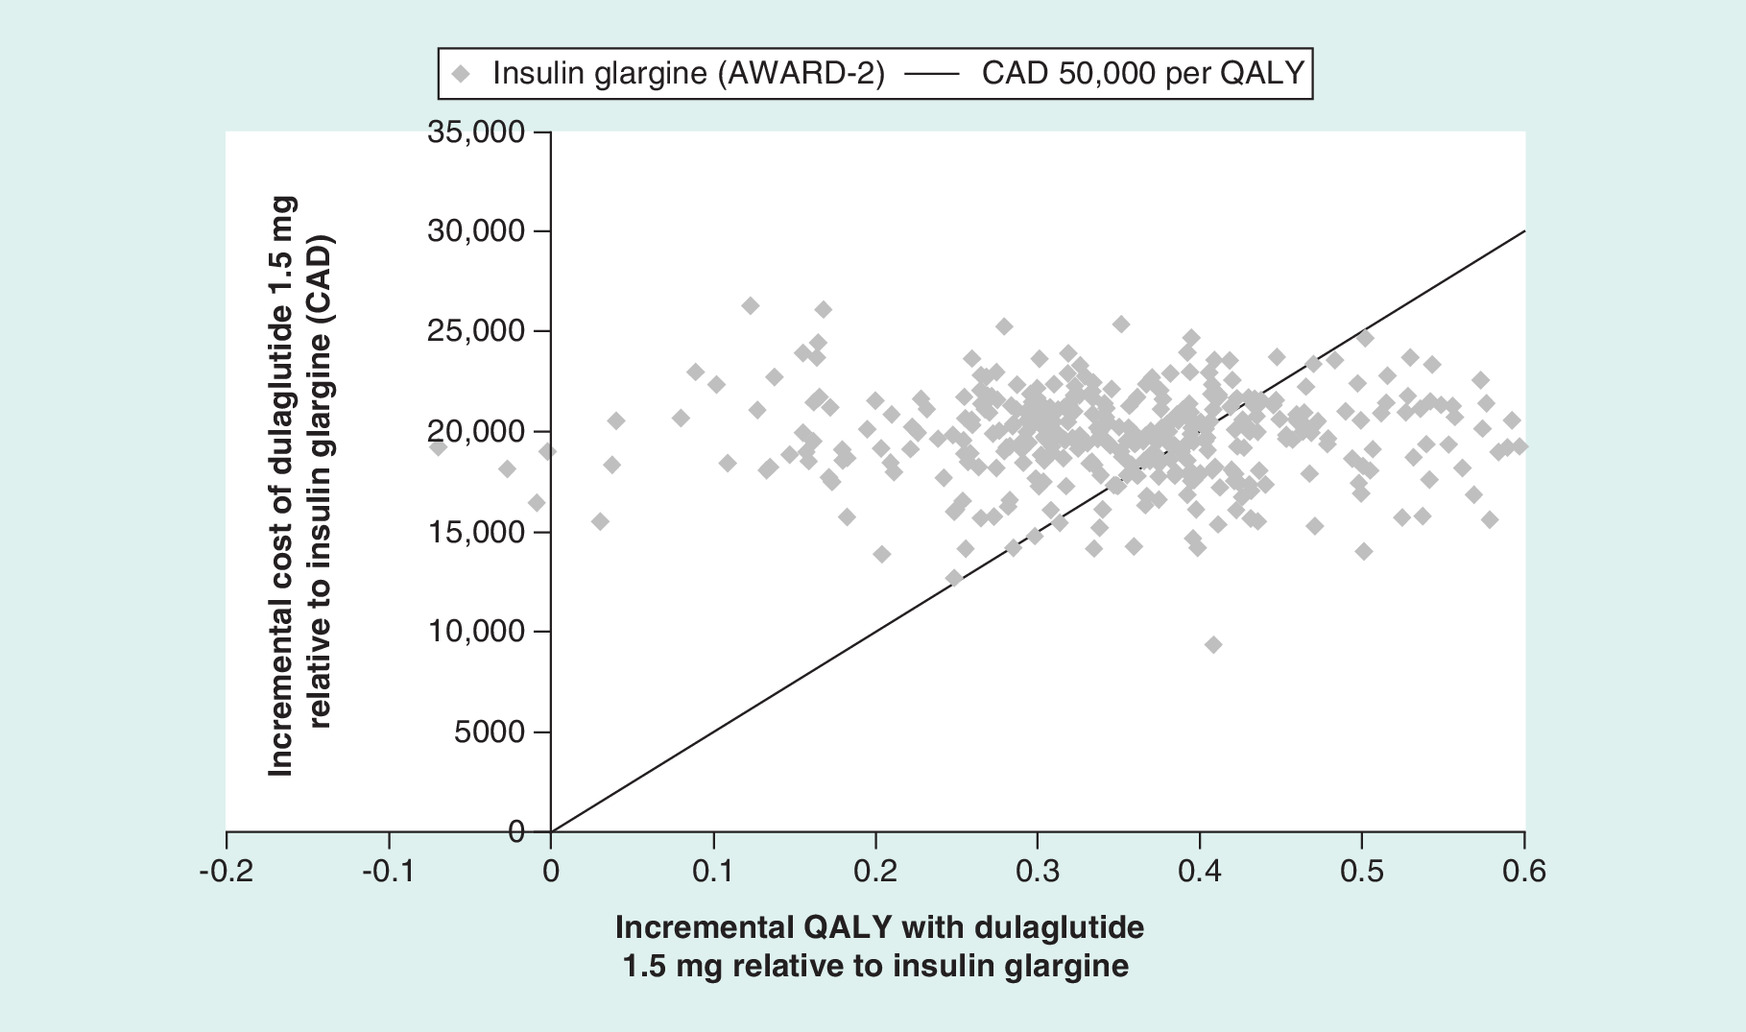
Figure 1. Scatterplot of incremental costs versus incremental quality-adjusted life expectancy with dulaglutide 1.5 mg versus insulin glargine based on AWARD-2.
CAD: Canadian dollars; QALY: Quality-adjusted life years.
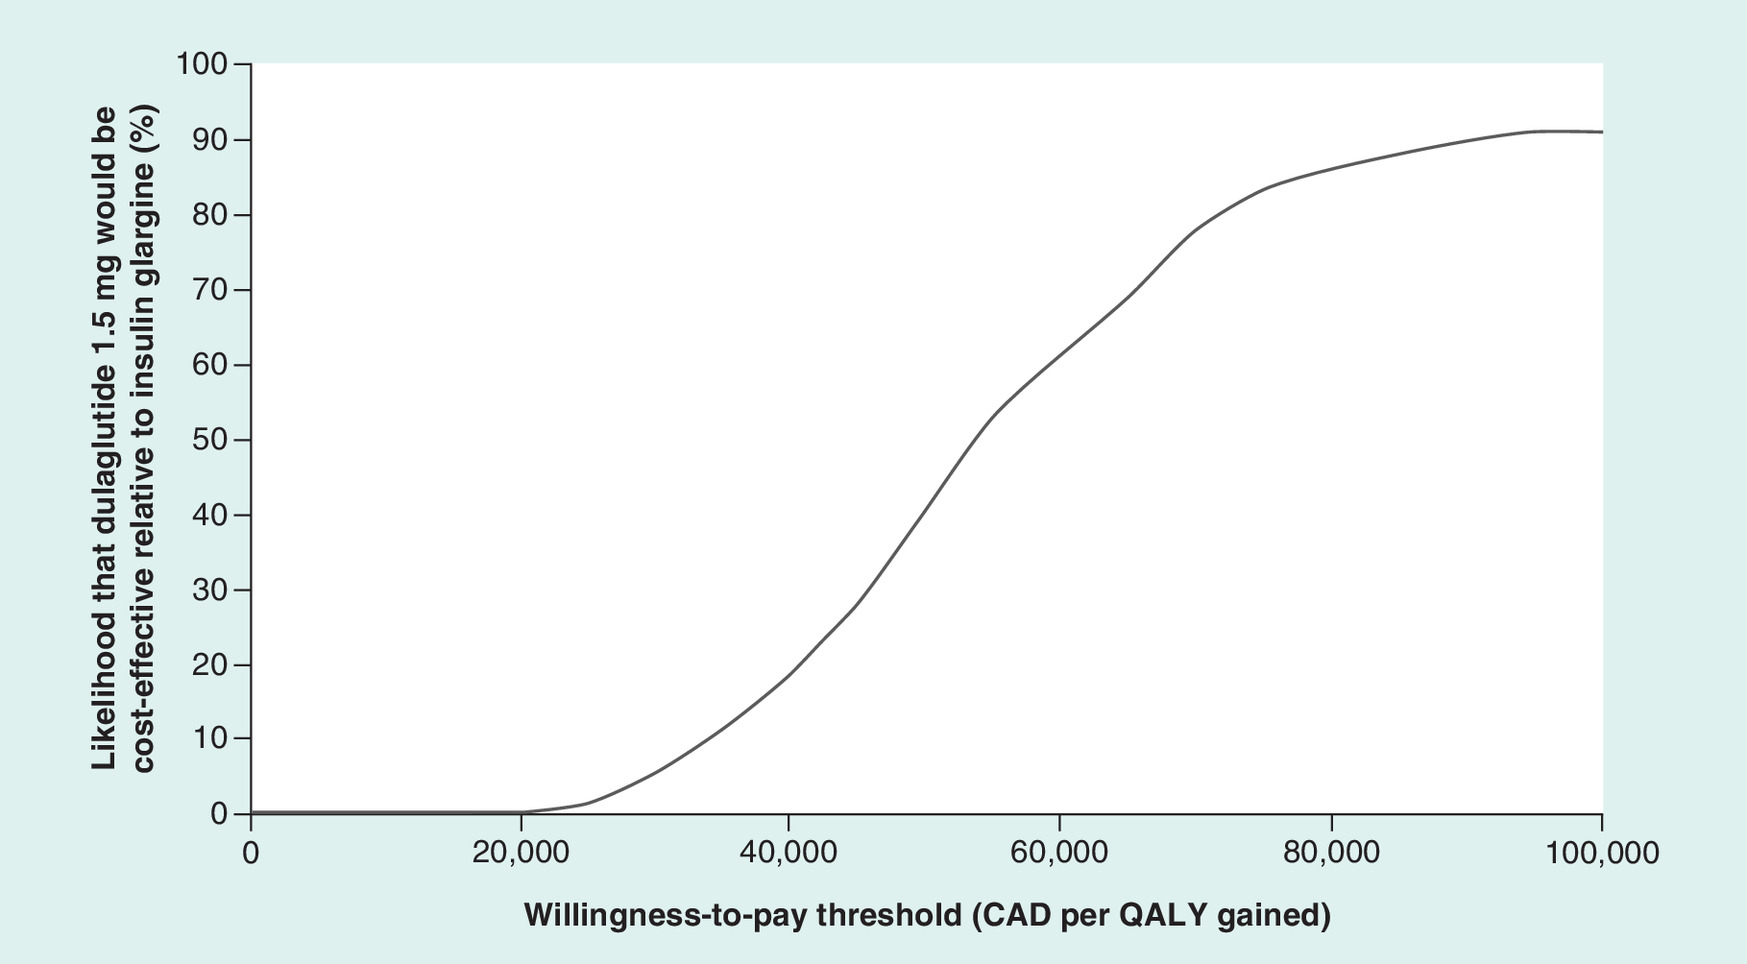
Figure 2. Cost–effectiveness acceptability curve showing the likelihood of dulaglutide 1.5 mg being cost-effective relative to insulin glargine based on AWARD-2.
CAD: Canadian dollars; QALY: Qualilty-adjusted life years.
One-way sensitivity analyses showed the analysis to be most sensitive to the analysis time horizon, the exclusion of BMI and HbA1c treatment effects and hypoglycemia benefits in the dulaglutide arm, the assumed dose (and therefore cost) of insulin and the choice (or use) of utilities associated with hypoglycemic events, SMBG testing and excess BMI (Table 7). Abolishing the disutilities associated with excess BMI and SMBG testing resulted in ICERs of CAD 90,819 and CAD 62,989 per QALY gained, respectively, while abolishing both disutilities in the same analysis resulted in an ICER of CAD 127,096 per QALY gained. Assuming a higher mean basal insulin dose per patient reduced the ICER considerably (by CAD 11,098 to CAD 41,482 per QALY gained), demonstrating that changes in insulin costs could substantially affect the findings of the analysis. However, the sensitivity analysis should be interpreted with caution as the higher dose assumption (of 0.53 IU/kg/day) may also have resulted in different clinical outcomes from those modeled (such as improved glycemic control and increased rates of hypoglycemia). Switching to a time-based approach to treatment intensification resulted in a much lower ICER (of CAD 19,677 per QALY gained relative to CAD 52,580 in the base case) driven by greatly reduced costs in the dulaglutide arm of CAD 81,949 relative to CAD 75,860 in the insulin glargine arm (an incremental cost of CAD 6,089) and only a modest reduction in incremental QALE to 0.31 QALYs relative to the base case of 0.38 QALYs.
| Glargine QALE (QALYs) | Dulaglutide QALE (QALYs) | ΔQALE (QALYs) | Glargine cost (CAD) | Dulaglutide cost (CAD) | ΔCost (CAD) | ICER (CAD/QALY) | |
|---|---|---|---|---|---|---|---|
| Base case | 12.52 | 12.90 | 0.38 | 72,879 | 92,652 | 19,773 | 52,580 |
| 10 year time horizon | 6.00 | 6.18 | 0.18 | 24,776 | 37,650 | 12,874 | 71,241 |
| 20 year time horizon | 10.11 | 10.40 | 0.29 | 51,472 | 70,280 | 18,808 | 65,152 |
| 30 year time horizon | 12.14 | 12.51 | 0.37 | 68,524 | 88,537 | 20,014 | 53,973 |
| 0% discount rate | 14.98 | 15.43 | 0.45 | 91,119 | 113,421 | 22,302 | 49,632 |
| 3% discount rate | 10.66 | 10.98 | 0.32 | 59,502 | 77,198 | 17,696 | 54,990 |
| Complication cost +10% | 12.52 | 12.90 | 0.38 | 77,231 | 96,878 | 19,647 | 52,244 |
| Complication cost -10% | 12.52 | 12.90 | 0.38 | 68,528 | 88,427 | 19,900 | 52,916 |
| Mortality from Canadian life tables | 12.02 | 12.39 | 0.37 | 69,257 | 88,538 | 19,281 | 52,381 |
| Insulin glargine 0.53 IUs/kg cost basis | 12.52 | 12.90 | 0.38 | 77,053 | 92,652 | 15,599 | 41,482 |
| Abolition of HbA1c difference | 12.52 | 12.81 | 0.29 | 72,879 | 90,223 | 17,344 | 59,681 |
| Abolition of SBP difference | 12.52 | 12.89 | 0.37 | 72,879 | 92,706 | 19,827 | 52,995 |
| Abolition of BMI difference | 12.52 | 12.72 | 0.21 | 72,879 | 93,120 | 20,241 | 98,679 |
| Abolition of lipid difference | 12.52 | 12.90 | 0.38 | 72,879 | 92,644 | 19,765 | 52,577 |
| Abolition of hypoglycemia difference | 12.52 | 12.83 | 0.31 | 72,879 | 92,963 | 20,083 | 64,547 |
| CADTH hypoglycemia disutilities | 12.75 | 13.05 | 0.30 | 72,879 | 92,652 | 19,773 | 66,009 |
| Levy et al. nonsevere hypoglycemia disutility [31] | 12.48 | 12.87 | 0.39 | 72,879 | 92,652 | 19,773 | 50,909 |
| No SMBG test disutility | 12.60 | 12.92 | 0.31 | 72,879 | 92,652 | 19,773 | 62,989 |
| No BMI disutility | 13.39 | 13.61 | 0.22 | 72,879 | 92,652 | 19,773 | 90,819 |
| No SMBG or BMI disutility | 13.47 | 13.63 | 0.16 | 72,879 | 92,652 | 19,773 | 127,096 |
| Treatment intensification after 5 years | 12.43 | 12.74 | 0.31 | 75,860 | 81,949 | 6,089 | 19,677 |
| Based on NMA HbA1c BMI and nonsevere hypoglycemia | 12.45 | 12.81 | 0.36 | 70,920 | 95,406 | 24,486 | 67,456 |
BMI: Body mass index; CAD: Canadian dollar; CADTH: Canadian Agency for Drugs and Technologies in Health; HbA1c: Glycated hemoglobin; ICER: Incremental cost–effectiveness ratio; IU: International unit; NMA: Network meta-analysis; QALE: Quality-adjusted life expectancy; QALY: Quality-adjusted life year; SBP: Systolic blood pressure; SMBG: Self-monitoring of blood glucose.
Discussion
The present analysis showed that dulaglutide 1.5 mg improved QALE compared with insulin glargine as an add-on to metformin and sulfonylurea in a simulated cohort representative of patients with T2DM inadequately controlled on metformin and sulfonylurea. Relative to insulin glargine, improvements in QALE were accompanied by increases in cost, resulting in an ICER of CAD 52,580 per QALY gained which could be considered borderline cost-effective based on a WTP threshold of CAD 50,000 per QALY gained. The likelihood of cost–effectiveness increased rapidly to 91.2% at a WTP threshold of CAD 100,000 per QALY gained. While the base case analysis did not show dulaglutide to be unequivocally cost-effective relative to insulin glargine, the conservatism of the base case analyses should be taken into consideration. Notably, a one-way sensitivity analysis in which the time of treatment intensification was brought forward to 5 years showed dulaglutide 1.5 mg to be cost-effective, and the analysis in which the insulin dose was taken from the CADTH therapeutic review of third-line therapy for Type 2 diabetes also showed dulaglutide 1.5 mg to be cost-effective.
As with all modeling analyses, there are limitations in the modeling approach that should be considered when interpreting the findings of the analysis. Notably, the structure of the model used includes the same limitations of the original UKPDS OM. In the case of equations from the UKPDS OM, these limitations include the ability to capture only first events (e.g., not capturing multiple amputations, myocardial infarcts and strokes), an inability to capture peripheral neuropathy, ulceration, depression and other complications of diabetes, and the simplifying clinical assumptions used to capture certain complications. For instance, eye disease is represented as the single state of ‘blindness in one eye’. Although the endpoint matches the blindness endpoint in the UKPDS trial, the full progression of diabetic retinopathy is not captured in the model, which would yield a conservative analysis from the dulaglutide perspective as less severe stages of ocular disease would not be captured. Furthermore, patients in the UKPDS were enrolled between 1977 and 1988, the vast majority prior to the approval of the first statin [32]; the cardiovascular risk profile of the UKPDS population is therefore likely to differ considerably from a modern population of patients with T2DM.
The analysis also had many strengths; most notably, the base case was well-adapted to the Canadian setting, making use of complication costs, drug costs, SMBG resource use assumptions, diabetes complication disutilities and hypoglycemia disutilities taken from Canadian populations or from analyses previously conducted by CADTH. The analysis was also conducted using a model based on risk equations from the published and validated UKPDS outcomes model, adapted to capture hypoglycemia and treatment intensification to better reflect the long-term management of Type 2 diabetes. The clinical data employed were also robust, with a relatively large RCT (N = 810) being the primary driver of the comparison with insulin glargine.
Conclusion
Based on an adaptation of a widely cited, published and validated economic model of T2DM, and clinical data from the AWARD-2 study, dulaglutide represents a cost-effective addition to the T2D armamentarium in patients experiencing inadequate glycemic control on metformin and a sulfonylurea and considering an injectable treatment in Canada.
The objective of the study was to conduct a cost-utility analysis of the once-weekly glucagon-like peptide 1 agonist dulaglutide 1.5 mg relative insulin glargine as third-line therapy in the treatment of patients with Type 2 diabetes mellitus (T2DM) inadequately controlled on metformin and sulfonylurea in Canada.
A cost-utility model was developed based on risk equations from the United Kingdom Prospective Diabetes Study with adaptations to the Canadian setting.
The choice of model parameters was guided by a previous economic evaluation of third-line therapies for patients with T2D in the Canadian setting, published by the Canadian Agency for Drugs and Technologies in Health.
The analysis was conducted over a 40-year time horizon, using data from the AWARD-2 randomized controlled trial to inform initial changes in patient risk factors (including glycated hemoglobin, systolic blood pressure and BMI) upon initiation of treatment.
Over a 40-year time horizon, the analysis demonstrated that dulaglutide 1.5 mg would increase quality-adjusted life expectancy by 0.38 quality-adjusted life years (QALYs) relative to insulin glargine, from 12.52 QALYs to 12.90 QALYs.
The increase in quality-adjusted life expectancy was accompanied by a projected increase in costs from CAD 72,879 to CAD 92,652 over the analysis time horizon, yielding an incremental cost-utility ratio of CAD 52,580 per QALY gained.
One-way sensitivity analyses showed that the model was most sensitive to assumptions around treatment intensification, and the inclusion of a quality of life decrement associated with high BMI. The model was relatively insensitive to changes in other individual model parameters.
Overall, the analysis showed that dulaglutide 1.5 mg would likely be cost-effective relative to insulin glargine in patients with T2D inadequately controlled on metformin and sulfonylurea in Canada.
Supplementary data
To view the supplementary data that accompany this paper please visit the journal website at: www.futuremedicine.com/doi/full/10.2217/cer-2018-0073
Financial & competing interests disclosure
This study was supported by a grant from Eli Lilly and Company. At the time of submission, RF Pollock was a full-time employee of Ossian Health Economics and Communications GmbH, which received consultancy fees from Eli Lilly and Company (the marketing authorization holder for dulaglutide) to develop the cost-utility model, conduct the analyses and write the manuscript. K Norrbacka is a full-time employee of Oy Eli Lilly Finland Ab, a subsidiary of Eli Lilly and Company. C Cameron is a full-time employee of Cornerstone Research Group, Inc., which received consultancy fees from Eli Lilly and Company to provide expert input on the model structure and parameters from a Canadian reimbursement perspective. At the time of the study, L Mancillas-Adame was an employee of Eli Lilly Canada, Inc., Toronto, Canada, and at the time of submission an employee of Medical School & University Hospital ‘Dr. Jose E. Gonzalez,’ Universidad Autonoma de Nuevo Leon, Monterrey, Mexico. M Jeddi is an employee of Eli Lilly Canada, Inc., Toronto, Canada. The authors have no other relevant affiliations or financial involvement with any organization or entity with a financial interest in or financial conflict with the subject matter or materials discussed in the manuscript apart from those disclosed.
No writing assistance was utilized in the production of this manuscript.
Ethical conduct of research
The authors state that they have obtained appropriate institutional review board approval or have followed the principles outlined in the Declaration of Helsinki for all human or animal experimental investigations. In addition, for investigations involving human subjects, informed consent has been obtained from the participants involved.
Open access
This work is licensed under the Attribution-NonCommercial-NoDerivatives 4.0 Unported License. To view a copy of this license, visit http://creativecommons.org/licenses/by-nc-nd/4.0/
Supplementary Material
File (suppl_file.docx)
- Download
- 508.11 KB
References
Papers of special note have been highlighted as: • of interest; •• of considerable interest
1.
International Diabetes Federation. IDF Diabetes Atlas (8th Edition). International Diabetes Federation, Brussels, Belgium (2017). www.idf.org/diabetesatlas.
2.
Greiver M, Williamson T, Barber D et al. Prevalence and epidemiology of diabetes in Canadian primary care practices: a report from the Canadian Primary Care Sentinel Surveillance Network. Can. J. Diabetes 38, 179–185 (2014).
3.
Canadian Diabetes Association. Access, equity and prosperity for all. Recommendations by the Canadian Diabetes Association for the 2011 Federal Budget (2010). www.diabetes.ca/CDA/media/documents/about/cda-recommendations-for-2011-federal-budget-english.pdf.
4.
Goeree R, Lim ME, Hopkins R et al. Prevalence, total and excess costs of diabetes and related complications in Ontario, Canada. Can. J. Diabetes 33, 35–45 (2009).
5.
Nathan DM. Long-term complications of diabetes mellitus. N. Engl. J. Med. 328, 1676–1685 (1993).
6.
Canadian Diabetes Association Clinical Practice Guidelines Expert Committee. Canadian Diabetes Association 2013 Clinical Practice Guidelines for the prevention and management of diabetes in Canada. Can. J. Diabetes 37(Suppl. 1), S1–S212 (2013).
7.
Inzucchi SE, Bergenstal RM, Buse JB et al. Management of hyperglycaemia in Type 2 diabetes, 2015: a patient-centred approach. Update to a position statement of the American Diabetes Association and the European Association for the Study of Diabetes. Diabetologia 58(3), 429–442 (2015).
8.
Canadian Agency for Drugs and Technologies in Health. Second-line pharmacotherapy for Type 2 diabetes – update. CADTH Optimal Use Report 3(1A), (2013). www.cadth.ca/media/pdf/OP0512_DiabetesUpdate_Second-line_e.pdf.
9.
Canadian Agency for Drugs and Technologies in Health. Third-line pharmacotherapy for Type 2 diabetes – update. CADTH optimal use report 3(1B), (2013). www.cadth.ca/sites/default/files/pdf/OP0512_Diabetes%20Update_Third-line_e.pdf.
10.
Clarke PM, Gray AM, Briggs A et al. A model to estimate the lifetime health outcomes of patients with Type 2 diabetes: the United Kingdom Prospective Diabetes Study (UKPDS) Outcomes Model (UKPDS No. 68). Diabetologia 47(10), 1747–1759 (2004).
•• Includes all of the parameters for the United Kingdom Prospective Diabetes Study Outcomes Model risk equations that governed the long-term projections of diabetes complication risk.
11.
Jendle J, Grunberger G, Blevins T, Giorgino F, Hietpas RT, Botros FT. Efficacy and safety of dulaglutide in the treatment of Type 2 diabetes: a comprehensive review of the dulaglutide clinical data focusing on the AWARD Phase III clinical trial program. Diabetes Metab. Res. Rev. 32(8), 776–790 (2016).
12.
Giorgino F, Benroubi M, Sun JH, Zimmermann AG, Pechtner V. Efficacy and safety of once-weekly dulaglutide versus insulin glargine in patients with Type 2 diabetes on metformin and glimepiride (AWARD-2). Diabetes Care 38(12), 2241–2249 (2015).
•• The findings of the AWARD-2 randomized controlled trial informed the changes in key risk factors with dulaglutide 1.5 mg relative to insulin glargine.
13.
Express Scripts Canada. Express scripts Canada® drug trend report 2016 (2017). www.express-scripts.ca/sites/default/files/2016-Drug-Trend-Report.pdf.
14.
Statistics Canada Demography Division. Life tables, canada, provinces and territories, 2009 to 2011. www.statcan.gc.ca/pub/84-537-x/84-537-x2013005-eng.pdf.
15.
Harris SB, Ekoe JM, Zdanowicz Y, Webster-Bogaert S. Glycemic control and morbidity in the Canadian primary care setting (results of the diabetes in Canada evaluation study). Diabetes Res. Clin. Pract. 70(1), 90–7 (2005).
16.
Hux JE, Booth GL, Slaughter PM, Laupacis A. Diabetes in Ontario: an ICES practice atlas. Toronto, Canada (2003). www.ices.on.ca/∼/media/Files/Atlases-Reports/2003/Diabetes-in-Ontario/Full%20report.ashx.
17.
Institute of Health Economics. Alberta Diabetes Atlas 2007. Edmonton, Canada (2007). www.ihe.ca/advanced-search/alberta-diabetes-atlas-2007.
18.
Canadian Agency for Drugs and Technologies in Health. CADTH therapeutic review. Economic evaluation: third-line therapy for patients with Type 2 diabetes inadequately controlled with metformin and sulfonylurea combination therapy (2010). www.cadth.ca/sites/default/files/pdf/Diabetes_TR_Economic_Evaluation_Final_e.pdf.
•• A previous economic evaluation of third-line therapies for Type 2 diabetes conducted by the Canadian Agency for Drugs and Technologies in Health (CADTH) was used to tailor multiple aspects of the analysis to the Canadian reimbursement environment.
19.
Holman RR, Farmer AJ, Davies MJ et al. Three-year efficacy of complex insulin regimens in Type 2 diabetes. N. Engl. J. Med. 361(18), 1736–1747 (2009).
• The findings of the Treating To Target in Type 2 Diabetes (4-T) randomized controlled trial were used to inform changes in risk factors occurring at the time of treatment intensification to basal-bolus insulin.
20.
Ontario Ministry of Health and Long-Term Care. Ontario drug benefit formulary/comparative drug index formulary search. www.formulary.health.gov.on.ca/formulary/.
21.
Gomes T, Juurlink DN, Shah BR, Paterson JM, Mamdani MM. Blood glucose test strips: options to reduce usage. CMAJ 182(1), 35–38 (2010).
22.
Canadian Diabetes Association Clinical Practice Guidelines Expert Committee. Clinical practice guidelines. Can. J. Diabetes 37, S1–S212 (2013). http://guidelines.diabetes.ca/app_themes/cdacpg/resources/cpg_2013_full_en.pdf.
23.
Sullivan PW, Ghushchyan V. Preference-based EQ-5D index scores for chronic conditions in the United States. Med. Decis. Making 26(4), 410–420 (2006).
24.
Sullivan PW, Lawrence WF, Ghushchyan V. A national catalog of preference-based scores for chronic conditions in the United States. Med. Care 43(7), 736–749 (2005).
25.
Clarke P, Gray A, Holman R. Estimating utility values for health states of Type 2 diabetic patients using the EQ-5D (UKPDS 62). Med. Decis. Making 22(4), 340–349 (2002).
26.
Harris S, Mamdani M, Galbo-Jørgensen CB, Bøgelund M, Gundgaard J, Groleau D. The effect of hypoglycemia on health-related quality of life: Canadian results from a multinational time trade-off survey. Can. J. Diabetes 38(1), 45–52 (2014).
27.
Bagust A, Beale S. Modelling EuroQol health-related utility values for diabetic complications from CODE-2 data. Health Econ. 14(3), 217–230 (2005).
28.
Jönsson B, CODE-2 Advisory Board. Revealing the cost of Type II diabetes in Europe. Diabetologia 45(7), S5–S12 (2002).
29.
Scottish Medicines Consortium. Advice on Tresiba. www.scottishmedicines.org.uk/files/advice/insulin_degludec_Tresiba_FINAL_March_2013_for_website.pdf.
30.
Canadian Agency for Drugs and Technologies in Health. Guidelines for the Economic Evaluation of Health Technologies: Canada (4th Edition). CADTH, Ottawa, Canada (2017). www.cadth.ca/sites/default/files/pdf/guidelines_for_the_economic_evaluation_of_health_technologies_canada_4th_ed.pdf.
• The analysis was conducted in line with the latest (2018) economic evaluation guidelines from the Canadian Agency for Drugs and Technologies in Health.
31.
Levy AR, Christensen TL, Johnson JA. Utility values for symptomatic non-severe hypoglycaemia elicited from persons with and without diabetes in Canada and the United Kingdom. Health Qual. Life Outcomes 6, 73 (2008).
32.
United Kingdom Prospective Diabetes Study (UKPDS) Group. UKPDS VIII. Study design, progress and performance. Diabetologia 34(12), 877–890 (1991).
Information & Authors
Information
Published In
Copyright
© 2019 Eli Lilly and Company.
History
Received: 19 July 2018
Accepted: 3 December 2018
Published online: 15 January 2019
Keywords:
Topics
Authors
Metrics & Citations
Metrics
Article Usage
Article usage data only available from February 2023. Historical article usage data, showing the number of article downloads, is available upon request.
Citations
How to Cite
A cost–utility analysis of dulaglutide versus insulin glargine as third-line therapy for Type 2 diabetes in Canada. (2019) Journal of Comparative Effectiveness Research. DOI: 10.2217/cer-2018-0073
Export citation
Select the citation format you wish to export for this article or chapter.
Citing Literature
- Mari Pesonen, Virpi Jylhä, Eila Kankaanpää, Adverse drug events in cost-effectiveness models of pharmacological interventions for diabetes, diabetic retinopathy, and diabetic macular edema: a scoping review, JBI Evidence Synthesis, 10.11124/JBIES-23-00511, 22, 11, (2194-2266), (2024).
- Suman Baishnab, Ravinder Singh Jaura, Saksham Sharma, Honey Garg, Thakur Gurjeet Singh, Pharmacoeconomic Aspects of Diabetes Mellitus: Outcomes and Analysis of Health Benefits Approach, Current Diabetes Reviews, 10.2174/0115733998246567230924134603, 20, 8, (2024).
- Meredith Hoog, Juan M. Maldonado, Ruth Wangia-Dixon, Rachel Halpern, Erin Buysman, Garrett W. Gremel, Ahong Huang, Manige Konig, Glycemic and Cost Outcomes among Hispanic/Latino People with Type 2 Diabetes in the USA Initiating Dulaglutide versus Basal Insulin: a Real-World Study, Diabetes Therapy, 10.1007/s13300-024-01542-5, 15, 4, (855-867), (2024).
- Elvira Meni Maria Gkrinia, Andrea Katrin Faour, Andrej Belančić, Jacques Bazile, Emma Marland, Dinko Vitezić, A Systematic Review of Economic Evaluations of Insulin for the Management of Type 2 Diabetes, Diabetology, 10.3390/diabetology4040038, 4, 4, (440-452), (2023).
- Chun-Ting Yang, Wen-Yu Yao, Huang-Tz Ou, Shihchen Kuo, Value of GLP-1 receptor agonists versus long-acting insulins for type 2 diabetes patients with and without established cardiovascular or chronic kidney diseases: A model-based cost-effectiveness analysis using real-world data, Diabetes Research and Clinical Practice, 10.1016/j.diabres.2023.110625, 198, (110625), (2023).
- Irene Romera, Miriam Rubio-de Santos, Sara Artola, Carmen Suárez Fernández, Ignacio Conget, GLP-1 RAs in Spain: A Short Narrative Review of Their Use in Real Clinical Practice, Advances in Therapy, 10.1007/s12325-023-02442-z, 40, 4, (1418-1429), (2023).
- Lizheng Shi, Vivian Fonseca, Belinda Childs, Economic burden of diabetes-related hypoglycemia on patients, payors, and employers, Journal of Diabetes and its Complications, 10.1016/j.jdiacomp.2021.107916, 35, 6, (107916), (2021).
- Chen-Yi Yang, Ying-Ren Chen, Huang-Tz Ou, Shihchen Kuo, Cost-effectiveness of GLP-1 receptor agonists versus insulin for the treatment of type 2 diabetes: a real-world study and systematic review, Cardiovascular Diabetology, 10.1186/s12933-020-01211-4, 20, 1, (2021).
- Enrico Torre, Giacomo M Bruno, Sergio Di Matteo, Chiara Martinotti, Maria Chiara Valentino, Luigi C Bottaro, Giorgio L Colombo,
Economic Evaluation of Dulaglutide vs Traditional Therapies: Implications of the Outcomes of the Rewind Study
, ClinicoEconomics and Outcomes Research, 10.2147/CEOR.S240183, Volume 12, (177-189), (2020). - Dulaglutide cost effective as third-line therapy in T2DM in Canada, PharmacoEconomics & Outcomes News, 10.1007/s40274-019-5592-4, 820, 1, (13-13), (2019).