Demonstrating efficacy and effectiveness in clinical studies with recurrent event as primary end point: a chronic obstructive pulmonary disease example
Abstract
Pivotal clinical trials of persistent disorders such as chronic obstructive pulmonary disease and severe asthma often utilize recurrent event (e.g., exacerbations) as primary study end point. Such infrequent and correlated end points usually have skewed distributions, which can result in clinical efficacy criterion being met even while clinical effectiveness may be poor. Patients, prescribers and, increasingly, payers want evidence of both a medicine's clinical efficacy and its effectiveness. This duality in evidentiary requirements is causing a shift from the traditional one-size-fits-all blockbuster drug development paradigm to newer patient-centric models. Using a simulated study, we illustrate how clinical studies using enrichment designs can collect and present such patient-centric evidence that will simultaneously demonstrate clinical efficacy and effectiveness, while increasing probability of trial success and overall efficiency.
Globally, drug companies spend $135 billion annually on research and development (R&D) to produce 25–30 new drugs, many with mediocre health outcomes and often sold at staggering prices [1]. Despite rising costs of R&D, output of new drugs has been constant since 1950 [2], underlining a productivity problem. Consequently, the biopharmaceutical industry has begun to shift R&D focus from ‘therapy-centrism’ toward ‘patient-centrism’. This focal shift toward patients is causing a paradigm change from the traditional one-size-fits-all block-bluster model of drug development to more targeted ‘precision’ or ‘stratified’ medicine. A major implication of this paradigm change toward increased personalized healthcare will be in payer reimbursement decisions, which is already being anticipated. This is exemplified in an editorial [3], which characterized ‘increased likelihood of reimbursement’ as a ‘fourth’ hurdle for successful commercialization of biopharmaceutical products (in addition to the three standard hurdles of efficacy, safety and favorable benefit-to-risk profile). Evidence of ‘comparative effectiveness’ of a new product may soon become routinely required to insure return on investments made in R&D. Asking whether a new drug is effective for patients is fundamentally different from asking ‘for which patients is the new drug effective?’ [4] Evidence of patient enrichment and study results demonstrating probability of benefit to individual patients will be especially important in clinical trials in which the primary clinical end point is a recurrent event. Such end point variables lead to special challenges in study design, data analysis and evidence synthesis.
Exacerbations have been recommended as primary clinical end point by regulatory guidelines in studies of persistent disorders like severe asthma [5] and are also used commonly in studies of chronic obstructive pulmonary disease (COPD) [6]. Some recent examples of pivotal trials of COPD and asthma that use exacerbation rate as the primary clinical end point are Mpex Pharmaceuticals’ Aeroquin (NCT00739648; CA, USA), MedImmune's Benralizumab (NCT0127278, NCT01238861; MA, USA), Teva Pharmaceutical's Reslizumab (NCT01287039; Petah Tikva, Israel) and GlaxoSmithKline's Mepolizumab (NCT01000506; Brentford, England). In such studies, evidence of superior efficacy of a new investigational therapy (NIT) over a standard of care (SoC) is provided by demonstrating statistically significant difference in exacerbation rates between the treatment arms. Evidence is usually generated through statistical modeling of count data (e.g., Poisson or negative binomial regressions). Cook and Lawless [7] provide an excellent overview of different statistical methods used to analyze repeated events in medical research. One important limitation of such statistical methods, in which cumulative total recurrent events are compared between two competing therapies over a standardized time interval, is that the results do not provide direct evidence of the likelihood of benefit to an individual patient (measure of ‘clinical effectiveness’ in this paper). Because evidence of ‘clinical efficacy’ is based on difference in average rates between a NIT and the SoC, it is associated with sample statistics of populations and not sufficiently informative on how likely it will be for an individual patient to benefit from the new treatment.
Comparing treatments using sample averages is particularly worrisome when the primary clinical end point is infrequent and recurrent like exacerbation counts used in COPD trials. A large proportion of study subjects in both treatment arms of a clinical trial may not exacerbate at all during the study period, or they may have very similar exacerbation counts in both treatment groups. In such situations, observation of a statistically significant difference in event rates can be heavily influenced by a small subgroup of study participants who have more frequent exacerbations. Such an example can be seen in a recent asthma clinical study of omalizumab [8]. One potential solution for satisfying the dual evidentiary requirement of both clinical efficacy and clinical effectiveness is by using companion diagnostics (CDx) to enrich study populations.
We simulated a mock clinical study of eosinophilic COPD for use as an illustrative example in this paper. We demonstrate how utilization of prognostic or predictive biomarkers as CDx to enrich eosinophilic patient populations can be used to generate evidence of both therapeutic clinical efficacy and likelihood of clinical effectiveness in individual patients. COPD is an appropriate illustrative example for two reasons: it is a major disease syndrome of global significance [9] with substantial patient heterogeneity [10] and pivotal trials in COPD often use severe exacerbation as the primary clinical end point [11]. Specifically, we address two important but related questions in our simulation: what are the specific advantages of using a CDx in designing prospective clinical trials when the primary clinical end point is a recurrent event; and how can information from such clinical trials be synthesized to provide evidence of both therapeutic clinical efficacy and clinical effectiveness in individual patients to satisfy regulators as well as payers and prescribers.
Methods
Simulation of clinical trial
We simulated a COPD clinical trial with severe eosinophilic exacerbation as the primary end point. For our hypothetical study, eosinophilic exacerbation in COPD was defined similar to asthma exacerbation in the European Medicines Agency guidelines [5], as ‘a requirement for systemic corticosteroids or an increase from the maintenance dose of corticosteroids for at least 3 days and/or a need for an emergency visit, or hospitalization due to COPD’. The simulation mimicked current real-world studies such as the clinical trial examples previously identified in the introduction. It used the primary efficacy end point of a clinically meaningful measure of exacerbation as stated in the US FDA draft guidance to industry for developing drugs to treat COPD [6]. The inclusion criteria for a hypothetical 12-month clinical trial specified a requirement of two or more exacerbations in the preceding year for subjects to be eligible for enrollment. We initially assumed mean exacerbation rates in a 1-year study to be 1.5 events per person in the standard of care (SoC) arm and 0.9 in the NIT arm, which corresponds to a 40% reduction in exacerbation rate. Similar exacerbation rates have been reported in other real-world examples of COPD clinical studies (e.g., 1-year HIACE study [12]). We assumed the hypothetical NIT to be an anti-IL5 biologic treatment targeting an ‘eosinophilic’ phenotype of COPD. A statistical analysis software (SAS) macro implementing a method developed for Poisson regression by Signorini was used to calculate sample size [13,14]. For a 1:1 allocation ratio, 80% power, a two-sided test of significance and a 5% Type I error rate (α = 0.05), a total sample size (n) of 176 study subjects was needed. To further mimic a likely real-world scenario, we increased placebo effect in our initial assumption and decreased the mean exacerbation rates to 1.05 and 0.7 events for the SoC and NIT arms, respectively. Subsequently, individual patient-level data were generated to correspond to a clinical efficacy of 33% reduction in exacerbations in the NIT treatment arm.
Mersenne–Twister random number generator in SYSTAT (Version 11.0.0.1) was used to generate pseudo-random variates from the Poisson distribution to represent the SoC and NIT populations with 88 subjects in each treatment arm corresponding to exacerbation rates, λ = 1.05 and 0.7, respectively. As per the inclusion criteria, the prior expectation of exacerbation per person during the study duration was ≥ 2 events (or ≥ 1.5 events after an assumed placebo effect). Utilizing this expectation of events, we established two different dichotomization cutoffs of the primary clinical end point to quantify and test for per-person meaningful clinical effectiveness: a stringent dichotomization that required zero exacerbation during the 12-month study, and a less stringent one with ≤ 1 exacerbation during the study duration. Subsequently, we created mock variables to represent binary predictive diagnostics measures (e.g., an eosinophil index such as described in [15] for discriminating between sputum–eosinophilic and noneosinophilic phenotypes), which mimicked 100, 90, 80 and 70% positive predictive value (PPV). Each mock individual subject in the study was randomly assigned to the binary variable, Dx +ve/-ve. To assess effects of accuracy of the diagnostics, we established a prior probability (prevalence of eosinophilic phenotype) of 35% in the population. Three popular statistical software, SYSTAT (Version 11.0.0.1), SAS (Version 9.1) and R (Version 2.10.1), were used to generate hypothetical study data, calculate sample size and conduct statistical analyses.
Test of clinical efficacy
Test of clinical efficacy was conducted with Poisson regression [16]. Counts of COPD exacerbation, and the response variable (y), were analyzed with the Poisson regression model assuming an underlying Poisson distribution:
(1)
As part of the Poisson process, we assumed that the waiting time between events (exacerbations) are independent and exponentially distributed with common mean, and that the number of events occurring up to the study duration time (t) of 12 months has a Poisson distribution with mean μ = λt. Thus, the parameter of interest is λ, the rate at which events occur. For a single explanatory variable x (the two treatment arms), we examined the dependence of λ on x by adopting a Poisson regression approach using the model:
(2)
Rearrangement of Eq. 2 resulted in:
(3)
Equation 3 was fitted within the generalized linear models framework where log t is an offset fixed at unity [17].
Test of clinical effectiveness
To demonstrate clinical effectiveness (as operationalized in this paper), study results must provide evidence of probability of likely benefit to individual patients. One way to provide such patient-centric evidence is by demonstrating that a large proportion of targeted patients in a clinical trial benefit from a novel therapy by attaining clinically meaningful effects (e.g., exacerbation reduction) on a per patient basis. Thus, we considered proportion benefiting within a targeted group as surrogate for probability of success in individual patients who all share the group characteristics. An example of a COPD clinical study with such a patient-centric design is a Phase III trial of tiotropium bromide sponsored by Boehringer Ingelheim (NCT00274547; Ingelheim am Rhein, Germany) in which the proportion of patients experiencing an exacerbation and the proportion of patients hospitalized for a COPD exacerbation were coprimary clinical end points and number of exacerbations a secondary outcome measure.
Similar to the real-world Boehringer Ingelheim Tiotropium study, our mock study utilized the proportion of patients benefiting from NIT as a measure of clinical effectiveness, and also as a coprimary clinical end point. Our evidence of clinical effectiveness follows a rationale derived from Baye's theorem that as PPV of CDx increases; it will directly correspond with proportion benefiting from a novel therapy. Comparison of the proportion of subjects with reduced exacerbation between the treatment arms was carried out with the exact test method of Fisher for fourfold table based on the hypergeometric distribution. The p-values from the Fisher test were used to infer statistically significant differences in the proportion of subjects between treatments that attained clinical effectiveness. The simple difference between the two exacerbation reduction proportions was used to describe the differential clinical effectiveness of the NIT over the SoC. Normal approximation was used to calculate 95% CIs. If zero counts occurred in a cell, the 95% lower confidence bound was calculated using the rule of threes [18]. The difference in proportions between SoC and NIT implies that for every 100 patients in a population who have exacerbation reductions qualifying as clinically effective in the SoC arm, 100 plus the difference in proportion (converted to percent) are expected to have clinically effective exacerbation reductions in the NIT arm [19]. Results displayed in tables associated with clinical effectiveness are based on data with dichotomization at 0 versus > 0 exacerbations per patient during the study period. An exception is panel (b) in Table 5 (based on dichotomization at ≤ 1 versus > 1 events per patient), which illustrates how outcome variables with lower measurement precision can impact study results.
Results
Key results are summarized in Tables 1–5 and presented graphically in Figures 1 and 2. Descriptive statistics of exacerbation events occurring during the hypothetical study period are shown in Table 1. Each treatment arm had 88 study subjects, and both groups had identical minimum, maximum and median number of exacerbations per person. However, there are 33% fewer total exacerbations in the NIT arm than in the SoC arm (corresponding to mean exacerbation rates of 0.72 vs 1.07 or cumulative total events of 63 vs 94, respectively). The means and variances are relatively close within each treatment arm, indicating that the Poisson distribution (without a need to account for over dispersion) is appropriate for hypothesis testing.
| Statistics | SoC | NIT |
|---|---|---|
| n | 88 | 88 |
| Minimum | 0 | 0 |
| Maximum | 4 | 4 |
| Median | 1 | 1 |
| Mean | 1.07 | 0.72 |
| Variance | 1.01 | 0.69 |
| Sum | 94 | 63 |
Statistics denote events in the two treatment arms except n, the number of enrolled subjects.
NIT: New investigational therapy; SoC: Standard of care.
| Sample | n | Intercept | Intercept SE | Intercept p-value | Treatment | Treatment SE | Treatment p-value |
|---|---|---|---|---|---|---|---|
| All subjects | 176 | 0.0660 | 0.1031 | 0.5225 | -0.4002 | 0.1628 | 0.0140 |
| 100% PPV | 62 | 0.6091 | 0.1325 | <0.0001 | -0.7850 | 0.2367 | 0.0009 |
| 90% PPV | 62 | 0.6265 | 0.1313 | <0.0001 | -0.6592 | 0.2249 | 0.0034 |
| 80% PPV | 70 | 0.6035 | 0.1250 | <0.0001 | -0.5754 | 0.2083 | 0.0058 |
| 70% PPV | 60 | 0.5108 | 0.1414 | 0.0003 | -0.5447 | 0.2334 | 0.0196 |
Analyzed sample sets include all subjects in the study and subsets predicted to be positive by the diagnostics test at positive predictive values of 100, 90, 80 and 70%.
PPV: Positive predictive value; SE: Standard error.
| Sample | n | λ (SoC) | λ (NIT) | p-value | δ (CI) | Prop. TP (%) (CI) | Power (CI) | n (80% Power) |
|---|---|---|---|---|---|---|---|---|
| All | 176 | 1.068 | 0.716 | 0.014 | 33 (8, 51) | 35 (25, 45) | 76 (9, 99) | 198 |
| PPV 100% | 62 | 1.839 | 0.839 | 0.001 | 54 (27, 71) | 100 (79,100) | 96 (79, 100) | 34 |
| PPV 90% | 62 | 1.871 | 0.968 | 0.003 | 48 (20, 67) | 90 (77, 98) | 90 (50, 100) | 44 |
| PPV 80% | 70 | 1.829 | 1.029 | 0.006 | 44 (15, 63) | 80 (71, 89) | 86 (33, 100) | 58 |
| PPV 70% | 60 | 1.667 | 0.967 | 0.020 | 42 (8, 63) | 70 (58, 82) | 74 (12, 100) | 72 |
Analyzed sample sets include all subjects in the study and subsets predicted to be positive by the diagnostics test at positive predictive values (PPV) of 100, 90, 80 and 70%. δ represents the percent reduction in event rate in the NIT arm. 95% CIs were calculated using normal approximation except for PPV 100 and 90%, which had zero counts in a cell. The lower bound of CI for the 100 and 90% PPV were calculated using the rule of threes [18].
NIT: New investigational therapy; Prop.: Proportion; PPV: Positive predictive value; SoC: Standard of care; TP: True positive.
| Sample | n | λ (SoC) | λ (NIT) | p-value | δ | Prop. TP (%) | Power | n (80% Power) |
|---|---|---|---|---|---|---|---|---|
| PPV 90% | 114 | 0.632 | 0.579 | 0.718 | 8 | 5 | 6 | 6712 |
| PPV 80% | 106 | 0.566 | 0.509 | 0.691 | 10 | 6 | 7 | 5080 |
| PPV 70% | 116 | 0.759 | 0.586 | 0.259 | 23 | 17 | 24 | 645 |
Analyzed sample sets include all subjects in the study and subsets predicted to be negative by the diagnostics test at positive predictive values of 90, 80 and 70%. δ represents the percent reduction in event rate in the new investigational therapy arm.
NIT: New investigational therapy; PPV: Positive predictive value; SoC: Standard of care; TP: True positive.
| Sample | p-value | n | NIT | SoC | NIT-SoC |
|---|---|---|---|---|---|
| (A) Proportion of study subjects with 0 exacerbation event | |||||
| All | 0.046 | 176 | 0.49 | 0.33 | 0.16 |
| PPV 100% | <0.0001 | 62 | 0.45 | 0.00 | 0.45 |
| PPV 90% | <0.0001 | 62 | 0.42 | 0.00 | 0.42 |
| PPV 80% | 0.003 | 70 | 0.37 | 0.06 | 0.31 |
| PPV 70% | 0.015 | 60 | 0.40 | 0.10 | 0.30 |
| (B) Proportion of study subjects with ≤1 exacerbation event | |||||
| All | 0.208 | 176 | 0.82 | 0.73 | 0.09 |
| PPV 100% | 0.071 | 62 | 0.71 | 0.45 | 0.26 |
| PPV 90% | 0.124 | 62 | 0.68 | 0.45 | 0.23 |
| PPV 80% | 0.092 | 70 | 0.66 | 0.43 | 0.23 |
| PPV 70% | 0.187 | 60 | 0.70 | 0.50 | 0.20 |
Panel (A) denotes a stringent definition of clinically meaningful reduction in exacerbation events for each person requiring 0 exacerbation (as vs the expected ≥ 2 exacerbations). Panel (B) denotes a less stringent definition of clinically meaningful reduction in exacerbation events for each person requiring ≤1 exacerbation (as vs the expected ≥ 2 exacerbations). The difference in proportions (SoC-NIT) is a simple measure of clinical effectiveness. For example, in panel (A) where the difference is 0.31 for the positive predictive value 80% sample, it implies that for every 100 subjects in this patient group who will have 0 exacerbations when treated with SoC, 131 subjects will be expected to have 0 exacerbations if treated with new investigational therapy. The p-values are from the Fisher exact test.
NIT: New investigational therapy; PPV: Positive predictive value; SoC: Standard of care.
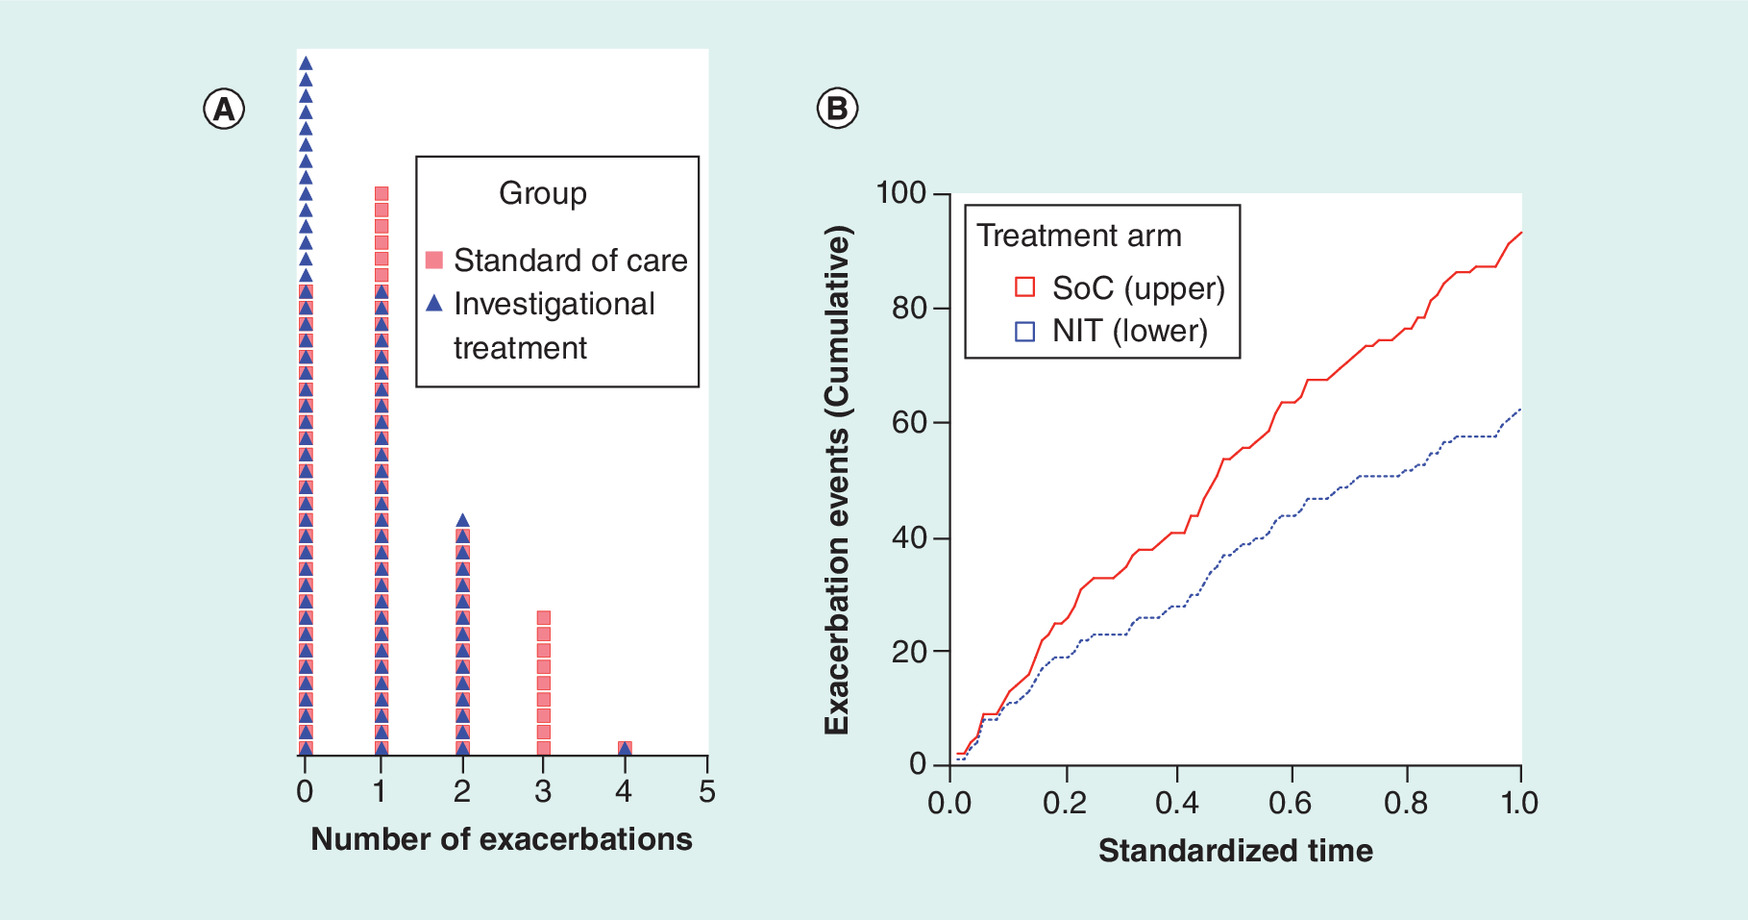
Figure 1. Exacerbation events in the hypothetical study.
(A) Dot density distribution (each cell with a unique symbol represents one study subject). (B) Cumulative events in each treatment arm during the study period (λSoC = 1.07, λNIT = 0.72, p = 0.014, Poisson regression).
NIT: New investigational therapy; SoC: Standard of care.
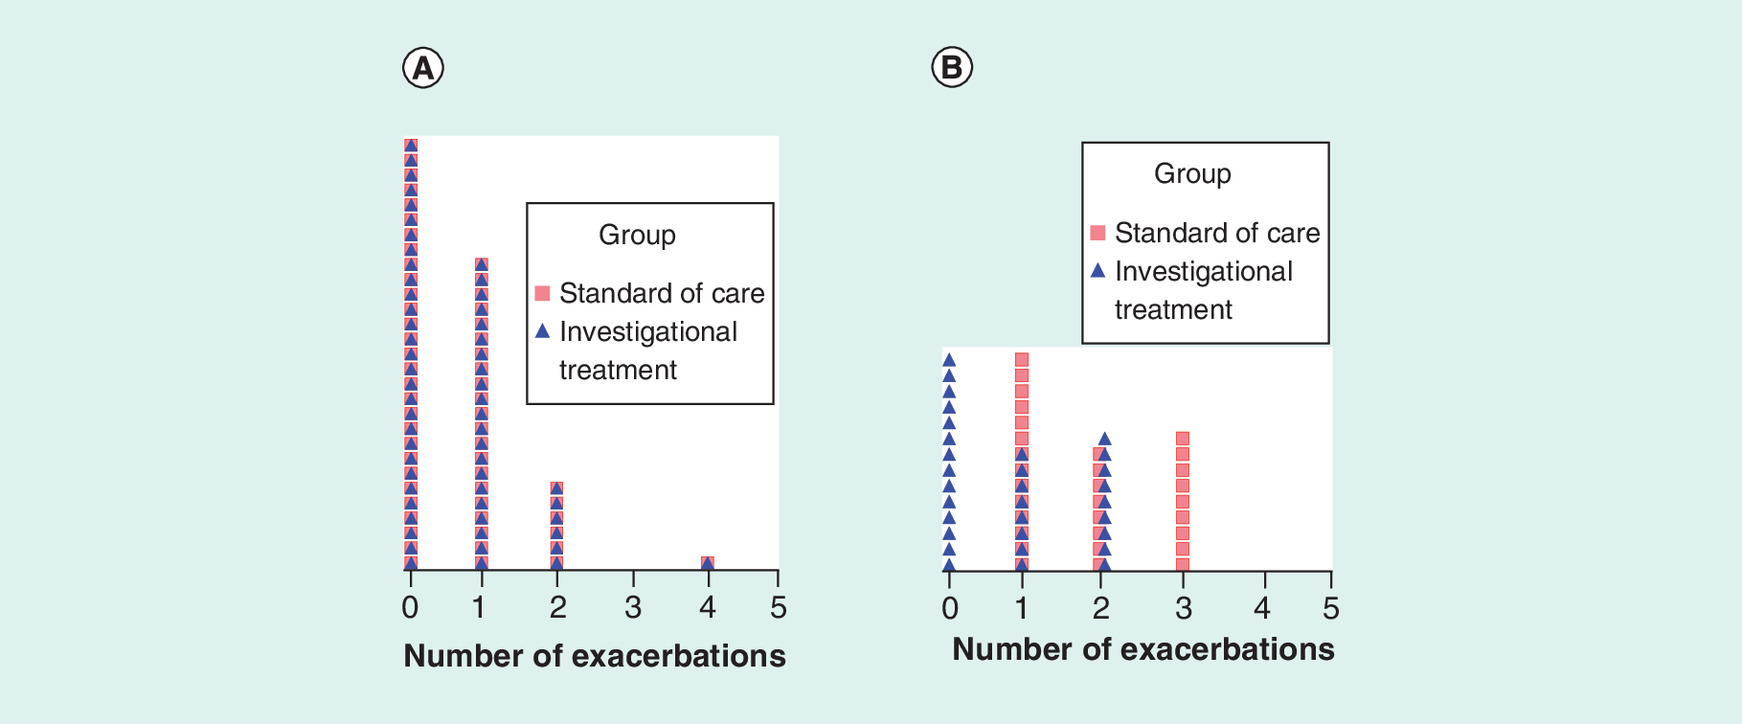
Figure 2. Density distribution of exacerbation events in the hypothetical study in all true negative and all true positive cases when the diagnostics is 100% accurate.
Each cell with a unique symbol represents one study subject. Panel (A) shows the dot density distribution of all true negative subjects with identical exacerbation rate (λ = 0.649) in each treatment arm. Panel (B) shows the dot density distribution of all true positive study subjects corresponding to a 54% reduction in exacerbation rate in the arm treated with the new investigational therapy (λSoC = 1.839 and λNIT = 0.839).
Superimposed density distribution of the hypothetical per patient asthma exacerbations during the study period in the two treatment arms is shown graphically in Figure 1A. The cumulative exacerbation events in the two treatment arms over the study duration are shown in Figure 1B. By design, the mean exacerbation rates of 1.07 in the SoC and 0.72 in the NIT show a 33% reduction of exacerbations in the NIT arm when compared with the SoC, and this difference was statistically significant (p = 0.014; Poisson regression). Thus, there is sufficient evidence of clinical efficacy of the new investigational therapy by both the quantity of mean reduction in exacerbation rate (33%) and statistical significance of the test (p < 0.05). However, this evidence of clinical efficacy, by itself, does not constitute specific evidence of likely benefit to any one patient who may be prescribed the new therapy in the clinic (i.e., clinical effectiveness).
Superimposed density distribution of per patient asthma exacerbations during the study period in the two treatment arms is shown in panels (A) and (B) of Figure 2 for the hypothetical subgroups of CDx -ve and +ve patients, respectively, when diagnostics is perfect (i.e., both negative predictive value and PPV are 100%). Patients who test -ve by the CDx (65% of study subjects) are shown in panel (A). In these true CDx -ve patients, the event distributions are identical and there is no difference in mean exacerbation rates between patients treated with either SoC or NIT, with a mean rate of 0.649 events in each treatment arm. As the distribution of the CDx -ve patients (negative predictive value = 100%) is skewed by many individuals with zero exacerbations, an implication is that less severe patients who are likely not to benefit from the newer (and often more expensive) therapy may have been enrolled in the study. However, in panel (B), which shows all true eosinophilic patients who test +ve by the CDx (PPV = 100%), we observe mean exacerbation rates of 1.839 and 0.839 for treatments with SoC and NIT, respectively. This rate difference corresponds to an average expectation of 54% lower exacerbation events in patients treated with the hypothetical anti-IL5 NIT than in those treated with SoC when the CDx test is positive at 100% PPV. The difference is statistically significant (p < 0.0001; Table 2) and, thus, demonstrates strong evidence of clinical efficacy in this subgroup of patients. Implication of the 100% PPV is that all patients who test +ve by the CDx (corresponding to 35% eosinophilic phenotype prevalence in the population) are expected to individually benefit from the NIT. This assumption will need to be modified to correspond with lower values of the PPV of a CDx. The model coefficients of the Poisson regression and associated z- and -p-values for all comers and subjects selected by CDx with PPVs of 100, 90, 80 and 70%, respectively, are shown in Table 2. All treatment-associated p-values are statistically significant (p < 0.05), indicating that the NIT overall is clinically efficacious (i.e., superior to SoC). Stronger statistical significance is obtained in the PPV 80% or higher population subgroups than in the all-comers trial despite much smaller sample sizes of the CDx-screened populations.
Table 3 contains more clinically useful information than Table 2. In the all-comers trial, treatment with NIT resulted in 33% (95% CI: 8%, 51%) lower mean exacerbation rate than treatment with SoC, as planned in the study. However, although the mean reduction is statistically significant, we know from our design of the study that only 35% of patients (95% CI: 25%, 45%) were expected to benefit from the NIT. Is the statistically significant 33% mean reduction in exacerbation rate in the overall patient population sufficient evidence to make a case for reimbursement of a NIT that may be priced much more expensively than the SoC when 65% of those receiving prescription of NIT do not benefit any more than the SoC? Clearly, without the use of a validated CDx with expected PPV in the study, a likely proportion of individual beneficiaries will be unknown. We can compare the 33% reduction in all comers with the CDx-selected populations at PPVs of 100, 90, 80 and 70%. The mean reduction in exacerbation rate of 33% in the all-comer trial increased to 42, 44, 48 and 54% at PPVs of 70, 80, 90 and 100%, respectively, with correspondingly higher bracketing of the 95% CIs. The 35% potential beneficiaries in the all-comers trial now correspond to 70, 80, 90 and 100% as denoted by the PPVs of 70, 80, 90 and 100%, respectively. There was also increased relative efficiency in clinical trials that used CDx, as indicated by higher study power and lower sample size requirement for fixed study power (e.g., 80%) shown in Table 3. Efficiency gains can be seen increasing monotonically with higher PPV.
Table 4 shows results for the CDx -ve patients at PPVs of 90, 80 and 70%, respectively. For a CDx with 80% PPV, the simulation showed that the CDx -ve patients would exclude only 6% true positive subjects, and that the expected mean exacerbation reduction in the NIT arm would be 10% (likely not large enough to meet minimal clinically meaningful criterion), and also not statistically significant (p = 0.691). To demonstrate statistical significance for a mean rate reduction of 10% in a clinical trial of CDx -ve patients, approximately 90-fold more patients would need to be enrolled than when including only CDx test +ve subjects (e.g., at 80% power and PPV of 80%, n = 5080 for CDx -ve and n = 58 for CDx +ve), which is a prohibitively large sample size requirement.
Evidence of clinical effectiveness that pertains to individual patients is summarized in Table 5 panels (A) and (B). Panel (A) results correspond to the stringent definition of clinically meaningful effect in an individual as defined in the methods section by 0 exacerbation cutoff for the 12-month study. Panel (B) results correspond to the less stringent definition of clinically meaningful effect in patients as defined by ≤ 1 exacerbation cutoff during the 12-month study. While all p-values were statistically significant at the same alpha cutoff in panel (A), none of the p-values were statistically significant at the 5% α level in panel (B). As the sample sizes are matched in both panels, the difference in statistical significance between the two panels clearly arises from the difference in the number of exacerbation used as cutoff to define individual-level minimum clinical effectiveness.
Discussion
A recent analysis of over five decades of data spanning 1950–2008 indicated that although the level of investment in pharmaceutical R&D has increased dramatically, the number of new molecular entities (NMEs) approved annually in the present is no greater than it was 50 years ago [2]. In 2013, the US FDA approved 27 new drugs for marketing [20], which is on par with previous years. Using Monte Carlo simulation and Poisson distribution to model rates of pharmaceutical outputs, Munos calculated that a company's NME output will exceed 2 or 3 per year at only 0.06 and 0.003%, respectively [2]. While the NME output has essentially flat-lined, he observed that NME costs have been growing exponentially at an annual rate of 13.4% since the 1950s. Current development costs are nearing $2 billion for each marketed drug, while success rate has declined from approximately 12 to 7% [21]. ‘Fail fast, fail cheap’, ‘shots on goal’, and changing governance and organizational models have been some of the strategies adopted by industry over the last decade [22]. We underline here that while regulatory approval to market a new therapy will be necessary, regulatory approval by itself may no longer be sufficient for a sponsor to obtain return on investments. We believe that drug developers can gain competitive advantage by providing evidence of differentiation and clinical value to convince major payers to offer reimbursement [23,24]. Both public and private payers in rich and emerging economies are becoming increasingly interested in using evidence to inform healthcare resource allocation decisions and for preferential coverage in health plans [25,26].
One emergent strategy to improve upon the current ‘mediocre’ health outcomes of marketed drugs is to better target new medicines. New drugs with improvement in benefit-to-risk profiles over standard of care can have competitive pricing advantage from a ‘comparative effectiveness’ and ‘product differentiation’ standpoint. Biopharmaceutical companies are increasingly adopting a strategy of ‘precision medicine development’ in today's competitive, often-crowded, drug development landscape. However, ultimate success will depend upon advantageous knowledge of what is needed to make a personalized healthcare approach work. Demonstrable evidence of such knowledge will include generation and organization of satisfactory evidentiary information to present to both regulators and payers. An understanding of the strengths and limitations of measurement types when choosing primary clinical end points, how variables are made operational for statistical analyses, and validating performance characteristics of prognostic and predictive biomarkers used as CDx to reduce patient heterogeneity are all important considerations for success in clinical development, and for the eventual successful marketing of a new therapeutic product.
Recognition of the importance of patient heterogeneity in clinical trials is not novel. Over a quarter of a century ago, Horwitz [27] published an analysis of randomized clinical trials randomized clinical trial (RCT) in the American Journal of Medicine with the title, ‘Complexity and Contradiction in Clinical Trial Research’. The core thesis of his analysis pertained to ‘heterogeneity’, a concept that is highly relevant to today's emerging emphasis on development of precision medicines. Horwitz commented that although “randomized clinical trials (RCTs) are the definitive standard in the scientific evaluation of therapy…there is so much complexity in the design of trials and conduct of clinical practice that heterogeneity has emerged as the dominant aspect of clinical trial research”. Understanding and accounting for heterogeneity of treatment effect on individuals constitutes evidence-based medicine, which is a pre-requisite for successful personalization of healthcare. An excellent discussion of evidence-based medicine can be found in Kravitz et al. [28], who conclude, ‘clinical trials provide good estimates of average effects, but averages do not apply to everyone’. Thus, identifying characteristics that modify treatment effects will be critical to patient-centered, individualized care [29].
Our hypothetical study is a good representation of a real-world clinical trial in COPD. The 35% eosinophilic prevalence in our hypothetical study is similar to the 38% prevalence reported in a real-world study of moderate-to-severe COPD subjects [30]. In order to provide credible evidence of both a new treatment's overall clinical efficacy and its clinical effectiveness in individual patients, selected information from our Tables 2, 3 and 5 must be evaluated concurrently. The p-values associated with the treatment coefficients in Table 2 demonstrate statistical significance of the ‘efficacy’ measure. In addition to these p-values associated with ‘efficacy’, Table 3 also provides information on the average exacerbation rate reductions in the NIT (denoted by δ, bound by 95% CI) and the expected proportion of individual subjects likely to benefit (denoted by proportion of true positive subjects, bound by 95% CI). Table 5 contains an additional layer of important information providing quantitative evidence of clinical effectiveness of the NIT in individual patients. The SoC and NIT columns show proportion of study subjects who failed to meet the definition of minimum clinical importance in exacerbation reduction. Thus, in the stringent criterion in which no exacerbation event was allowed during the 12-month study duration, 49% succeeded (51% failed) in NIT and 33% succeeded (67% failed) in SoC for all-comers. The difference between NIT and SoC of 16% in proportion benefiting (49%–33%) is a simple measure of clinical effectiveness of the new therapy over the standard of care. In layman's terms, the interpretation is that for every 100 patients who have zero exacerbations in a year when treated with the standard of care, 116 patients will have zero exacerbations in a year when treated with the new therapy. This difference was statistically significant (p = 0.046) with the Fisher exact test. The advantage of using a CDx to select potential beneficiaries even at 70% PPV (i.e., with 30% false positive rate) is clearly evident. The difference in proportions benefiting increased to two-times higher than in the all-comer trial, with correspondingly lower p-values despite a nearly 2.5-fold reduction in sample size.
It may be important to also note that when a prespecified goal aims to demonstrate both clinical efficacy and clinical effectiveness in a prospective RCT, there will be two primary end points, one for efficacy and another for effectiveness. Because of multiplicity of end points, the α error rate (p-value for statistical significance) may need to be adjusted, unless a sequential hypothesis testing order is prespecified. One simple way to do this is by using the Bonferroni correction so that a p-value of 0.05 becomes p-values of 0.025 for each of the two primary endpoints. When this level of α-control is utilized, we see from Tables 3 and 5 (panel [A]) that the all-comers trial meets the efficacy significance test (p = 0.014), but fails the clinical effectiveness significance test (p = 0.046). The trials utilizing CDx succeed in significance tests of both efficacy and effectiveness at all tested PPVs down to 70%. In the CDx-ve selected populations, all p-values for tests of both clinical efficacy and clinical effectiveness were >0.025. Panel (B) of Table 5 failed the statistical significance test of clinical effectiveness (p > 0.025) for all tested populations because of a relaxation of the clinically meaningful criterion from 0 to ≤1 exacerbation. Relaxation of the criterion caused a reduction in precision of the measurement, highlighting the need to be judicious in choosing clinically meaningful cutoffs to power studies in clinical trial designs.
Conclusion
Using a simulated COPD study, we have shown how patient population enrichment with companion diagnostics can benefit clinical studies with recurrent event as primary end point in demonstrating both efficacy and effectiveness. The same approach could also be utilized for continuous measurement after dichotomizing on a clinically meaningful cutoff in the end point variable. We interpreted PPV as the probability of benefit to an individual patient who tests positive to the CDx. We demonstrated how optimizing clinical study designs to match therapy to patients selected with a validated CDx can be advantageous to a sponsor. Specifically, we compared outcomes of a traditional all-comer RCT design against enriched clinical trial designs at different false positive rates of CDx and illustrated how comprehensive evidence of a new therapy's efficacy and effectiveness can be generated and presented to obtain regulatory approval, differentiate product for marketing, provide justification for payer reimbursement and increase overall efficiency of studies. Collection and synthesis of information, such as described in this study, can benefit industry sponsors in determining project go/no-go status. Such evidence can also be utilized by clinicians in selecting treatments and payers in making reimbursement decisions. We recommend use of computer simulations, such as illustrated in this paper, which will require educated input of Dx performances, exacerbation rates and clinically meaningful measures to plan for and design pivotal studies of novel therapeutics when the primary endpoint is a recurrent event.
Patients, prescribers and, increasingly, payers want evidence of both a medicine's clinical efficacy over another treatment as well as clinical effectiveness on how likely it is to benefit an individual patient in the clinic.
This duality in evidentiary requirement is the basis for the development of precision medicine and to demonstrate comparative effectiveness among different treatment options for targeted, well-stratified patient populations.
Such evidence generation is especially important in chronic disorders such as severe asthma and chronic obstructive pulmonary disease that utilize recurrent events (such as exacerbations) as primary clinical efficacy end points.
Such end points tend to be infrequent, correlated, have highly skewed distributions and lead to special challenges in study design, data analysis and evidence synthesis.
A simulated chronic obstructive pulmonary disease study that mimics the real world is used to illustrate how clinical studies with enrichment designs can be planned with an aim to generate patient-centric evidence that will simultaneously demonstrate clinical efficacy and clinical effectiveness.
Such simulations are essential tools to evaluate different scenarios for the design of clinical studies that have high probability of success, and they can greatly aid in making risk-minimized decisions.
For the simulations to reflect clinical trial outcomes in the real world, it is essential that inputs into the simulation exercise such as positive predictive value of diagnostics tests, clinical end points and clinically meaningful difference in end points between comparison groups be realistic. Thus, such inputs must be well-researched beforehand.
It is argued that collection and synthesis of information as described in this manuscript can benefit industry sponsors in determining project go/no-go status, drug prescribers in selecting the right treatment for a patient in a clinic, and to policy makers and payers in making reimbursement decisions.
Acknowledgements
The author would like to thank the anonymous reviewers whose helpful comments have significantly improved this manuscript.
Financial & competing interests disclosure
The author is an employee of MedImmune, the biologics unit of AstraZeneca and owns AstraZeneca company stocks. The views expressed in this article are those of the author alone. The author has no other relevant affiliations or financial involvement with any organization or entity with a financial interest in or financial conflict with the subject matter or materials discussed in the manuscript apart from those disclosed.
No writing assistance was utilized in the production of this manuscript.
References
Papers of special note have been highlighted as: • of interest; •• of considerable interest
1.
Munos BH. Pharmaceutical innovation gets a little help. Sci. Transl. Med. 5, 1–2 (2013).
2.
Munos B. Lessons from 60 years of pharmaceutical innovation. Nat. Rev. Drug Discov. 8, 959–968 (2009).
•• A good discussion of inefficiency in drug research and development.
3.
Honig PK. Comparative effectiveness: the fourth hurdle in drug development and a role for clinical pharmacology. Clin. Pharmacol. Ther. 89, 151–156 (2011).
• Discusses the importance of demonstrating comparative effectiveness to obtain reimbursement, without which there will not be sufficient return on investment of sponsors.
4.
O'Reilly T, Steele J, Loukides M, Hill C. How Data Science Is Transforming Health Care. O'Reilly Media, CA, USA (2012).
5.
European Medicines Agency. Note for guidance on clinical investigation of medicinal products for treatment of asthma. CHMP/EWP/2922/01 Rev.1, 18 p http://www.ema.europa.eu/docs/en_GB/document_library/Scientific_guideline/2009/09/WC500003555.pdf.
6.
Food and Drug Administration. Chronic Obstructive Pulmonary Disease: Developing Drugs for Treatment. Guidance for Industry; Draft Guidance, Revision 1 https://www.federalregister.gov/documents/2016/05/20/2016-11855/chronic-obstructive-pulmonary-disease-developing-drugs-for-treatment-draft-guidance-for-industry (2016).
7.
Cook RJ, Lawless JF. Analysis of repeated events. Stat. Methods Med. Res. 11, 141–166 (2002).
• A good discussion paper on how repeated events data should be analyzed.
8.
Busse W, Spector S, Rosen K, Wang Y, Alpan O. High eosinophil count: a potential biomarker for assessing successful omalizumab treatment effects. J. Allergy Clin. Immunol. 132, 485–486.e11 (2013).
9.
Marchetti N, Criner GJ, Albert RK. Preventing acute exacerbations and hospital admissions in COPD. Chest 143, 1444–1454 (2013).
10.
Carolan BJ, Sutherland ER. Clinical phenotypes of chronic obstructive pulmonary disease and asthma: recent advances. J. Allergy Clin. Immunol. 131, 627–634 (2013).
11.
Siva R, Green RH, Brightling CE et al. Eosinophilic airway inflammation and exacerbations of COPD: a randomized controlled trial. Eur. Respir. J. 29, 906–913 (2007).
12.
Tse HN, Raiteri L, Wong KY et al. High-dose N-acetylcysteine in stable COPD. The 1-year, double-blind, randomized, placebo-controlled HIACE study. Chest 144, 106–118 (2013).
13.
Hu K. Sample Size Estimation for Trials of Recurrent Events. Paper SP01-2008, SAS Institute, Inc., NC, USA (2008).
14.
Signorini DF. Sample size for Poisson regression. Biometrika 78, 446–450 (1991).
15.
Khatry DB, Gossage DL, Geba GP et al. Discriminating sputum eosinophilic asthma: accuracy of cutoffs in blood eosinophil measurements versus a composite index, ELEN. J. Allergy Clin. Immunol. 136, 812–822 (2015).
16.
Everitt BS, Hothorn T. A Handbook of Statistical Analyses Using R. Chapman & Hall/CRC, FL, USA, p275 (2006).
17.
Der G, Everitt BS. Applied Medical Statistics Using SAS. Chapman & Hall/CRC, FL, USA, p541 (2013).
18.
van Belle G. Statistical Rules of Thumb. 2nd Edition. John Wiley & Sons, NJ, USA, p272 (2008).
19.
Fleiss JL, Levin B, Myunghee CP. Statistical Methods for Rates and Proportions. 3rd Edition. John Wiley & Sons, NJ, USA, p800 (2003).
•• An excellent statistical reference for researchers working with data on counts, rates and proportions to demonstrate comparative effectiveness of drugs for the practice of precision medicine.
20.
Kocher R, Roberts B. The calculus of cures. N. Engl. J. Med. 370(17), 1473–1475 (2014).
21.
Waldman SA, Terzic A. Pharmacoeconomics in the era of individualized medicine. Clin. Pharmacol. Ther. 84, 179–182 (2008).
22.
Cioffe C. Portfolio selection and management in pharmaceutical research and development: issues and challenges. Clin. Pharmacol. Ther. 89, 300–303 (2011).
• Illustrates why demonstrating comparative effectiveness of drugs is important as drug development costs increase and market approval success rates decline.
23.
Tunis SR, Stryer DB, Clancy CM. Practical clinical trials. Increasing the value of clinical research for decision making in clinical health policy. JAMA 290, 1624–1632 (2003).
24.
Chalkidou K. The (possible) impact of comparative effectiveness research on pharmaceutical industry decision making. Clin. Pharmacol. Ther. 87, 264–266 (2010).
•• Discusses comparative effectiveness demonstration as a way to differentiate from competitors the clinical value of drugs to payers who ultimately make decisions on reimbursement.
25.
Lalonde RL, Wilke RJ. Comparative efficacy and effectiveness: an opportunity for clinical pharmacology. Clin. Pharmacol. Ther. 90, 761–763 (2011).
26.
Scheneeweiss S, Gagne JJ, Glynn RJ et al. Assessing the comparative effectiveness of newly marketed medications: methodological challenges and implications for drug development. Clin. Pharmacol. Ther. 90, 777–790 (2011).
27.
Horwitz RI. Complexity and contradiction in clinical trial research. Am. J. Med. 82, 498–510 (1987).
• A historical discussion of patient heterogeneity in randomized clinical trials that is now recognized as justification for pursuing precision medicine.
28.
Kravitz RL, Duan N, Braslow J. Evidence-based medicine, heterogeneity of treatment effects, and the trouble with averages. Milbank Q. 82, 661–687 (2004).
•• A discussion on why drug efficacy evidence based upon group averages is not adequate for the practice of personalized medicine in making patient-centric decisions.
29.
Dettori JR, Norvell DC, Skelly AC, Chapman J. Heterogeneity of treatment effects: from ‘How to treat’ ‘Whom to treat’. Evid. Based Spine Care J. 2, 7–10 (2011).
30.
Leigh R, Pizzichini MMM, Morris MM et al. Stable COPD: predicting benefit from high-dose inhaled corticosteroid treatment. Eur. Respir. J. 27, 964–971 (2006).
Information & Authors
Information
Published In
Copyright
© 2018 Future Medicine Ltd.
History
Received: 9 February 2018
Accepted: 20 July 2018
Published online: 3 October 2018
Keywords:
Topics
Authors
Metrics & Citations
Metrics
Article Usage
Article usage data only available from February 2023. Historical article usage data, showing the number of article downloads, is available upon request.
Citations
How to Cite
Demonstrating efficacy and effectiveness in clinical studies with recurrent event as primary end point: a chronic obstructive pulmonary disease example. (2018) Journal of Comparative Effectiveness Research. DOI: 10.2217/cer-2018-0013
Export citation
Select the citation format you wish to export for this article or chapter.