Costs associated with nonalcoholic steatohepatitis disease progression in Medicare patients: a retrospective cohort study
Publication: Journal of Comparative Effectiveness Research
Abstract
Aim: Non-alcoholic steatohepatitis (NASH), or metabolic dysfunction-associated steatohepatitis (MASH), is a severe form of non-alcoholic fatty liver disease (NAFLD) or metabolic dysfunction-associated liver disease (MASLD), that may progress to advanced liver disease. Costs associated with progression are not well characterized. This study sought to quantify costs and healthcare resource utilization (HRU) associated with NASH progression. Methods: Patients were included if diagnosed with NASH (ICD-10: K75.81) in 100% Medicare claims data (2015–2021) who were ≥66 years at index (diagnosis), continuously enrolled in Parts A, B and D for ≥12 months prior to and 6 months following index (unless death) and who had no evidence of other causes of liver disease. Patient-time was categorized into five severity states: non-cirrhotic NASH, compensated cirrhosis (CC), decompensated cirrhosis (DCC), hepatocellular carcinoma (HCC) and liver transplant (LT). Annualized HRU and costs were calculated during the study periods overall and stratified by occurrence and timing of progression. Results: In 14,806 unique patients (n = 12,990 non-cirrhotic NASH; 1899 CC; 997 DCC; 209 HCC; 140 LT), mean age and follow-up were 72.2 and 2.8 years, respectively. Average annualized costs increased from baseline following diagnosis, generally scaling with severity: $16,231 to $27,044; $25,122 to $57,705; $40,613 to $181,036; $36,549 to $165,121 and $35,626 to $108,918 in NASH; CC; DCC; HCC; and LT; respectively. Non-cirrhotic NASH and CC patients with progression had higher follow-up spending (1.6x for NASH; 1.7x for CC) than non-progressors (both p < 0.001), 2.8 and 6.1-times higher odds of an inpatient stay and 2.6 and 3.6-times higher odds to be in the top 20% of spenders, respectively, relative to non-progressors (both p < 0.001). Patients progressing within a year had costs 1.4, 1.6, 1.7 and 2.2-times more than year 2, 3, 4 and 5 progressors' costs, respectively, for non-cirrhotic NASH and 1.3, 1.8, 2.0 and 2.2-times more than year 2, 3, 4 and 5 progressors' costs, respectively, for CC. Conclusion: NASH progression is associated with high costs that increase in more severe disease states. Slower progression is associated with lower costs, suggesting a potential benefit of therapies that may delay or prevent progression.
Non-alcoholic steatohepatitis (NASH), also referred to as metabolic dysfunction-associated steatohepatitis (MASH), is a severe form of non-alcoholic fatty liver disease (NAFLD) or metabolic dysfunction-associated steatotic liver disease (MASLD) [1]. It is estimated that 59.1% of patients with NAFLD have NASH [2], and the prevalence of NASH is estimated to range from 1.5 to 6.45% in the general population [2]. In the US, NASH is the fastest-rising indication for liver transplantation (LT) [3] and it is the fastest-rising cause of hepatocellular carcinoma (HCC) globally [4].
NASH is characterized by the presence of ≥5% hepatic steatosis as well as inflammation with hepatocyte injury (i.e., ‘ballooning’), with or without the presence of fibrosis [5]. Patients with NASH may progress to more advanced liver disease states, including compensated cirrhosis (CC), decompensated cirrhosis (DCC; i.e., liver failure) and HCC and may eventually require a LT [6–9]. The risk of disease progression is higher in older patients [10–13], and disease progression has been shown to worsen the quality-of-life burden in patients with NASH [14].
The aim of treatment for NASH relies on slowing progression and reducing mortality [15–17]. Management strategies depend on individual factors; diet (e.g., calorie restriction and decreased alcohol consumption) and lifestyle (e.g., increase in exercise) modifications are recommended for all patients with NASH [15–17]. Until recently, there were no US FDA-approved medications for the treatment of NASH [18]. However, in March 2024, the FDA conditionally approved resmetirom, a liver-directed thyroid hormone receptor (THR)-β agonist that targets underlying causes of NASH, in combination with diet and exercise for the treatment of adults with non-cirrhotic NASH with moderate-to-advanced fibrosis (consistent with F2/F3 fibrosis) [19,20]. An ongoing Phase III trial (MAESTRO-NASH, NCT03900429) recently demonstrated that resmetirom stabilized or halted fibrosis progression in approximately 90% of patients with pre-cirrhotic NASH [21]. There are additional emerging pharmacologic treatments for NASH being evaluated in late-stage clinical trials, with varying mechanisms of action, that could be used in combination with lifestyle modifications to help to delay or stop disease progression [22].
Prior studies have demonstrated a high economic burden of NAFLD/NASH that increases with disease progression [2,7,23–28]; however, utilizing more recent data to evaluate progression rates to cirrhosis and liver failure, as well as the associated costs, with 100% claims for the US Medicare population can provide more comprehensive insights on the current burden of NASH as treatments become available. This study aimed to provide novel evidence on the economic burden of NASH and disease progression in the US Medicare population. The specific objectives were to quantify the direct costs and healthcare resource utilization (HRU) associated with NASH by disease severity state.
Methods
Data source
This study used 100% Medicare claims and enrollment data for beneficiaries aged 65 years and older who were continuously enrolled in Medicare fee-for-service insurance coverage for inpatient hospital, skilled nursing and outpatient facility services (Part A), physician and other professional services (Part B) and outpatient prescription drugs (Part D). The Medicare data used in this study covered the period from 1 October 2015 through 31 December 2021 to reflect the period when International Classification of Diseases, Tenth Revision, Clinical Modification (ICD-10-CM) diagnosis codes were operational.
The enrollment file contains monthly information on individuals' enrollment in each part of Medicare, demographic information, residential location (at the 5-digit ZIP Code level) and date of death. Claims data were available for all medical services covered by the program and were organized into data files based on the nature and source of the claim. The inpatient, outpatient and skilled nursing facility files include institutional claims from hospitals for inpatient and outpatient services and from nursing homes for short stay skilled admissions, respectively. The carrier file includes fee-for-service claims submitted by professional providers. Separate files include claims for durable medical equipment, home health visits and hospice care. Part D pharmacy claims include complete prescription drug information and all standardized prescription-level fields collected on a typical pharmacy claim (e.g., date of fill or refill, drug name and class, strength, quantity and days' supply).
An Institutional Review Board exemption was not required for this study as the data were de-identified and comply with the Health Insurance Portability and Accountability Act regulations. This non-interventional study was conducted according to the best-practices recommended by the Reporting of Studies Conducted Using Observational Routinely Collected Data for Pharmacoepidemiology (RECORD-PE) guidelines [29] as well as the Consolidated Health Economic Evaluation Reporting Standards 2022 (CHEERS 2022) Statement [30].
Study design
This was a retrospective non-interventional cohort study of administrative claims data conducted to quantify total healthcare interactions, costs and resource utilization attributable to progression to severe liver disease among Medicare patients with NASH.
Patient-time was categorized into five severity states: non-cirrhotic NASH, CC, DCC, HCC and LT, where non-cirrhotic NASH refers to the time following an NASH diagnosis without (or prior to) evidence of more advanced disease. The index date was defined as the date associated with each eligible disease severity state: non-cirrhotic NASH, CC, DCC, HCC and LT (Supplemental Figure 1). Disease state cohorts were constructed by assigning patients to each disease state for which they had a qualifying index date (i.e., patients could contribute data to multiple, mutually-exclusive state cohorts and were re-indexed upon progression to a more advanced state). This approach is consistent with previous literature [26]. For patients with observed disease progression during the study period (e.g., transition from non-cirrhotic NASH to CC), the date of diagnosis for the new disease state was considered a new index date. The baseline period was defined as the 12 months prior to the index date. The follow-up period was defined as the interval from the index date for each health state diagnosis to the earliest of death, the end of Medicare coverage, the end of the study period or the index date for the next disease state for patients who progressed.
Study population
Selection criteria
Patients were included in the study if they had a diagnosis for NASH determined by at least one ICD-10 diagnosis code of K75.81 as the primary or secondary diagnosis in an inpatient visit or in two separate outpatient visits occurring on different days; were Medicare-age adults (≥66 years to ensure Medicare coverage for the entirety of the baseline period) on index date; had continuous enrollment in Medicare Parts A, B and D of sufficient duration prior to (i.e., ≥12 months) and following (i.e., ≥6 months unless death) the index date; had no enrollment in Medicare Part C; had no evidence prior to the index date of other causes of liver disease (alcoholism, alcoholic liver disease, toxic liver disease, viral hepatitis, Wilson's disease, autoimmune hepatitis, Gaucher disease, lysosomal acid lipase deficiency, primary biliary cholangitis, hemochromatosis, primary sclerosing cholangitis, exposure to heavy metals), or HIV (Supplemental Table 1). Exclusion of patients with these other causes of liver disease and sources of misclassification of liver disease was done in accordance with an expert panel consensus statement on identifying NASH cohorts in observational research [31]. The exclusion of patients with alcoholism or alcoholic liver disease is especially crucial to ensure a study sample with the same etiology of hepatosteatosis, minimizing confounding factors and enabling a clearer assessment of the specific metabolic effects under investigation in this study. While liver biopsy remains the gold standard for diagnosing NASH [5], it is invasive and not practical for studies of NASH in the general population. Thus, for this study, patients were not required to have biopsy-confirmed NASH, but an ICD-10 diagnosis code for NASH, consistent with expert consensus recommendations [31]. Additionally, recent developments in the nomenclature of NAFLD/NASH have resulted in the use of the terms steatotic liver disease (SLD) with sub-classifications of metabolic dysfunction associated steatotic liver disease (MASLD) and metabolic dysfunction associated steatohepatitis (MASH) [32]. However, for the purposes of this study, the use of the term NASH was kept as the exposure of interest, in order to maintain consistency with previous literature as well as the description of the ICD-10 diagnosis code used to identify patients for inclusion from the data source.
Progression to subsequent disease severity states was defined using diagnoses/procedures for CC, DCC, HCC and LT following NASH diagnosis with patients in any state at risk for progression to any more advanced state or directly to death, an approach that is consistent with previous literature (Supplemental Table 2) [26,28]. While index dates for CC, HCC and LT cohorts were based on the earliest corresponding diagnosis/procedure claim, a previously validated algorithm was used to determine DCC index date. Progression to DCC was defined as a diagnosis/procedure for CC and two separate claims for DCC, the latest of which was the DCC index date [33]. Once progressed to a more severe disease state, patients could not return to a lesser severity state (Supplemental Figure 1). This applied even when the earliest diagnosis/procedure for a lesser severity state occurred after the index date for a more severe state. As such, patients in the HCC cohort could only progress to the LT cohort and patients in the LT cohort could not experience progression.
Study cohorts
Patient cohorts were constructed by stratifying patient populations into each disease state for which they had a qualifying index date (Supplemental Figure 2). A 90-day grace period was used to account for the time between biopsy/imaging procedures and a follow-up visit confirming diagnosis of advanced liver disease, based on clinical advice. As such, patients with a diagnosis code for a more advanced liver disease state within 90 days following an index date (or prior to NASH index date) were considered part of the more advanced disease cohort as of the earlier index date. Within each index disease state cohort, cumulative follow-up period HRU and costs were compared among patients who progressed to another disease state (‘progressors’) and patients who did not progress to another disease state (‘non-progressors’) during the study period (i.e., outcomes were stratified by whether the patient progressed at any time in the follow-up period so there was no double counting of HRU and costs across cohorts). In sensitivity analyses, patients with a CC diagnosis before NASH, during the 90-day grace period and after the 90-day grace period were compared with assess whether these patients were meaningfully different. To prevent patient re-identification, outputs from CMS-provided data sources were aggregated across at least 11 patients. Any outputs where n <11 were redacted, and medians were not presented for any populations where n <50 [34].
Outcomes
Patient demographic (age, sex, race, census region, index year, coverage type) and clinical (nursing home category, Charlson Comorbidity Index [CCI], Elixhauser Comorbidity Index and Diabetes Complications Severity Index [DCSI] and comorbidities) characteristics as well as HRU and costs were evaluated during the baseline period. Progression was evaluated based on claims with a diagnosis code for more severe liver disease states. HRU and direct medical costs were evaluated during the follow-up period, overall and separately for medical and pharmacy claims, based on the dates of service and Medicare paid amounts reported. Medical claims were further stratified by place of service using information reported on the claims, including inpatient hospital, outpatient hospital, emergency department, skilled nursing facility, physician office, durable medical equipment, home health and hospice). Note that while emergency department visits can be identified using codes available on medical claims, costs specific to services provided in the emergency department cannot and are thus omitted to avoid double counting with inpatient or outpatient hospital costs. Further, HRU and costs specific to gastroenterology were quantified based on the provider specialty reported on carrier claims.
Statistical analysis
Descriptive statistics of covariates were assessed for the overall sample of patients meeting the inclusion criteria stratified by cohort. Baseline covariates were measured as of the index date. For continuous variables, means, standard deviations (SD), medians and interquartile ranges (IQR) were calculated. Means were compared between cohorts with t-tests and medians with nonparametric tests of equality. For dichotomous and categorical variables, counts and percentages were calculated for each category. Percentage distributions were compared between cohorts with χ2 tests. In all comparisons, a two-sided alpha error level of 0.05 was used to indicate statistical significance. Follow-up healthcare cost and HRU measures were summarized descriptively on an annualized basis. Overall and out-of-pocket costs were reported in total and by setting of care for all-cause and disease-related claims. Outcomes were compared across disease severity states. All variables denominated in dollars were inflated to 2021 USD using the Gross Domestic Product Price Index [35].
Multivariate models were used to estimate the impact of progression on outcomes, controlling for baseline covariates. Such models took the following form: f(Y) = α + βG + γX + ε, where Y was the outcome of interest (e.g., medical costs), f(Y) was a transformation that depends on the nature of Y (e.g., log-link with a gamma distribution) [36], G was an indicator for future disease progression, X was a vector of patient covariates derived from the data and ε was an independent and identically distributed (IID) error term. Identification of the effect of progression on outcomes, as quantified by the coefficient β, came from cross-sectional comparison of patients within each cohort. To attenuate concerns about bias from adverse selection, observable patient characteristics were adjusted for in X. Such models were used to estimate the change in overall spending associated with progression along with the relative odds of any inpatient admission, exceeding the threshold of ‘super-utilizers’ (≥3 annualized inpatient admissions) and having annualized costs in the top 20% of per-patient spending [37]. Among patients with progression, similarly adjusted models were used to estimate the average marginal effect of delaying progression 1 year on annualized overall spending.
Analyses were conducted using SAS 9.4 software (SAS Institute Inc, NC, USA).
Results
Demographic & clinical characteristics
In total, 14,806 unique patients were included in the overall study sample, consisting of 12,990 patients observed with non-cirrhotic NASH and 1816 unique patients entering the study with more advanced liver disease (Figure 1). As patients were included in each disease state for which they had a qualifying index date, cohort counts were 12,990 patients with non-cirrhotic NASH, 1899 patients with CC, 997 patients with DCC, 209 patients with HCC and 140 patients with LT. Demographic and clinical characteristics are reported in Table 1. The mean (SD) length of follow-up was 33.8 (17.5) months, 33.2 (17.4) months, 24.5 (17.1) months, 14.8 (14.2) months, 14.3 (13.9) months and 33.9 (19.2) months for the overall sample, non-cirrhotic NASH, CC, DCC, HCC and LT cohorts, respectively. The mean (SD) age of patients in the overall sample was 72.2 (5.5) years, 63% were female and 84% were White. The mean (SD) CCI in the overall sample was 2.7 (2.6) and the mean (SD) DCSI was 1.8 (1.9) for the overall study population. Progressors represented 8% (n = 999) of patients with non-cirrhotic NASH, 20% (n = 376) of patients with CC and 5% (n = 50) of patients with DCC.

Figure 1. Cohort selection diagram.
aExclusionary liver diseases include alcoholism, cholangitis, cirrhosis, Gaucher's disease, hemochromatosis, hepatitis, HIV, lysosomal acid lipase deficiency, necrosis, toxic liver disease, Wilson's disease and exposure to heavy metals.
bPatients with an CC/DCC/HCC/LT diagnosis prior to or within 90 days following their index date are considered to have CC/DCC/HCC/LT at baseline.
cCohorts are not mutually exclusive. Progression to disease severity states is evaluated using the earliest diagnosis/procedures for CC, DCC, LT and HCC following NASH diagnosis.
CC: Compensated cirrhosis; DCC: Decompensated cirrhosis; HCC: Hepatocellular carcinoma; LT: Liver transplant; NASH: Nonalcoholic steatohepatitis; OR: Odds ratio.
| NASH | ||||||
|---|---|---|---|---|---|---|
| Overall sample (n = 14,806) | Non-cirrhotic NASH (n = 12,990) | CC (n = 1899) | DCC (n = 997) | HCC (n = 209) | LT (n = 140) | |
| Follow-up months, mean (SD) [median] | 33.8 (17.5) [33.5] | 33.2 (17.4) [32.5] | 24.5 (17.1) [21.8] | 14.8 (14.2) [10.4] | 14.3 (13.9) [9.9] | 33.9 (19.2) [34.7] |
| Demographic characteristics | ||||||
| Age, mean (SD) [median] | 72.2 (5.5) [71.0] | 72.1 (5.4) [71.0] | 72.9 (5.4) [72.0] | 74.7 (6.1) [74.0] | 74.3 (5.8) [74.0] | 70.5 (3.6) [70.0] |
| Age group, n (%) | ||||||
| 65–74 | 10,657 (72) | 9475 (73) | 1273 (67) | 555 (56) | 109 (52) | 117 (84) |
| 75–84 | 3597 (24) | 3060 (24) | 556 (29) | 364 (37) | 88 (42) | 23 (16) |
| 85+ | 552 (4) | 455 (4) | 70 (4) | 78 (8) | 12 (6) | 0 (0) |
| Sex, n (%) | ||||||
| Female | 9312 (63) | 8201 (63) | 1234 (65) | 620 (62) | 107 (51) | 66 (47) |
| Race, n (%) | ||||||
| White | 12,418 (84) | 10,824 (83) | 1627 (86) | 892 (89) | 185 (89) | 122 (87) |
| Black | 496 (3) | 458 (4) | 31 (2) | 24 (2) | [redacted] | [redacted] |
| Hispanic | 912 (6) | 799 (6) | 140 (7) | 48 (5) | 18 (9) | 11 (8) |
| Asian | 513 (3) | 486 (4) | 40 (2) | [redacted] | [redacted] | 0 (0) |
| Other | 467 (3) | 423 (3) | 61 (3) | [redacted] | [redacted] | [redacted] |
| Region, n (%) | ||||||
| Northeast | 2559 (17) | 2292 (18) | 270 (14) | 155 (16) | 46 (22) | [redacted] |
| Midwest | 3190 (22) | 2687 (21) | 478 (25) | 265 (27) | 44 (21) | 46 (33) |
| South | 6351 (43) | 5565 (43) | 829 (44) | 448 (45) | 77 (37) | 60 (43) |
| West | 2693 (18) | 2434 (19) | [redacted] | 129 (13) | 41 (20) | 24 (17) |
| Missing | 13 (0) | 12 (0) | [redacted] | 0 (0) | [redacted] | [redacted] |
| Year of index date, n (%) | ||||||
| 2016 | 1218 (8) | 1057 (8) | 98 (5) | 39 (4) | [redacted] | 17 (12) |
| 2017 | 3836 (26) | 3387 (26) | 360 (19) | 138 (14) | [redacted] | 32 (23) |
| 2018 | 3253 (22) | 2850 (22) | 391 (21) | 181 (18) | 42 (20) | 32 (23) |
| 2019 | 2960 (20) | 2613 (20) | 400 (21) | 246 (25) | 31 (15) | 23 (16) |
| 2020 | 2376 (16) | 2078 (16) | 358 (19) | 214 (21) | 48 (23) | 20 (14) |
| 2021 | 1163 (8) | 1005 (8) | 292 (15) | 179 (18) | 44 (21) | 16 (11) |
| Dual enrollment in Medicaid, n (%) | ||||||
| Yes | 1899 (13) | 1561 (12) | 301 (16) | 201 (20) | 34 (16) | 15 (11) |
| Baseline nursing home use, n (%) | ||||||
| Long-term | 107 (1) | 70 (1) | 19 (1) | 34 (3) | [redacted] | [redacted] |
| Short-term | 366 (2) | 246 (2) | 70 (4) | 117 (12) | [redacted] | [redacted] |
| None | 14,333 (97) | 12,674 (98) | 1810 (95) | 846 (85) | 193 (92) | 132 (94) |
| Clinical characteristics | ||||||
| CCI, mean (SD) [median] | 2.7 (2.6) [2.0] | 2.5 (2.5) [2.0] | 4.0 (2.9) [4.0] | 6.2 (3.7) [6.0] | 6.1 (4.0) [6.0] | 6.1 (3.1) [6.0] |
| DCSI, mean (SD) [median] | 1.8 (1.9) [1.0] | 1.6 (1.8) [1.0] | 2.3 (2.1) [2.0] | 3.2 (2.4) [3.0] | 2.5 (2.1) [2.0] | 3.0 (2.2) [3.0] |
| Elixhauser comorbidity Index, mean (SD) [median] | 4.7 (3.2) [4.0] | 4.4 (3.0) [4.0] | 6.5 (3.5) [6.0] | 8.9 (4.3) [9.0] | 7.5 (4.0) [7.0] | 7.9 (3.6) [7.5] |
| All-cause healthcare resource use (per beneficiary per year) | ||||||
| Baseline spending, mean (SD) [median] | ||||||
| Total spending | $17,748 (29,410) [8348] | $16,231 (26,949) [7702] | $25,122 (36,791) [13,104] | $40,613 (47,926) [25,114] | $36,549 (48,500) [22,696] | $35,626 (40,323) [20,666] |
| Out-of-pocket | $2797 (3797) [1704] | $2607 (3441) [1608] | $3729 (5084) [2432] | $5520 (5683) [3914] | $4827 (6799) [3425] | $5122 (4524) [3853] |
| Pharmacy, mean (SD) [median] | ||||||
| Count of unique drugs (per beneficiary per year) | 10.5 (6.2) [10.0] | 10.2 (6.0) [9.0] | 12.5 (6.5) [12.0] | 13.9 (7.2) [13.0] | 13.0 (7.2) [12.0] | 13.4 (6.6) [13.0] |
| Total spending | $4819 (12,861) [1319] | $4539 (12,761) [1216] | $6556 (12,003) [2405] | $6427 (12,116) [3221] | $9133 (16,834) [3203] | $7348 (14,132) [4293] |
| Out-of-pocket spending | $702 (1027) [349] | $678 (1000) [338] | $839 (1095) [435] | $850 (1142) [463] | $888 (1244) [469] | $1225 (1388) [834] |
| Medical spending, mean (SD) [median] | ||||||
| Total Spending | $12,928 (25,015) [4892] | $11,692 (22,250) [4565] | $18,566 (33,425) [7470] | $34,186 (45,656) [17,438] | $27,416 (43,179) [12,509] | $28,278 (36,600) [11,451] |
| Out-of-pocket spending | $2095 (3531) [1026] | $1929 (3166) [959] | $2890 (4825) [1515] | $4670 (5547) [2920] | $3939 (6585) [2388] | $3897 (4267) [2294] |
| Inpatient hospitalizations | ||||||
| Any, n (%) | 2248 (15) | 1727 (13) | 436 (23) | 494 (50) | 65 (31) | 53 (38) |
| Count of visits, mean (SD) | 0.24 (0.70) | 0.20 (0.63) | 0.39 (0.93) | 0.97 (1.38) | 0.65 (1.37) | 0.79 (1.51) |
Some cells are redacted due to the Medicare data-use agreement, which prevents reporting of cells where n <11 and medians where n <50. Baseline characteristics for the overall sample are evaluated as of each patient's earliest index date. The baseline period was defined as the 12 months prior to the index date. Follow-up months is based on the patient's total time in the study period. Dollars amounts are inflated to 2021 USD using the Gross Domestic Product Price Index.
CC: Compensated cirrhosis; CCI: Charlson Comorbidity Index; DCC: Decompensated cirrhosis; DCSI: Diabetes Complication Severity Index; HCC: Hepatocellular carcinoma; LT: Liver transplantation; NASH: Nonalcoholic steatohepatitis; SD: Standard deviation; USD: United States Dollar.
Healthcare resource utilization & costs
Mean (SD) [median] annualized costs increased from baseline following diagnosis, scaling with severity, from $16,231 (26,949) [7702] to $27,044 (79,275) [11,941] in patients with non-cirrhotic NASH, $25,122 (36,791) [13,104] to $57,705 (240,014) [23,106] in patients with CC, $40,613 (47,926) [25,114] to $181,036 (278,929) [86,856] in patients with DCC, $36,549 (48,500) [22,696] to $165,121 (240,308) [98,389] in patients with HCC and $35,626 (40,323) [20,666] to $108,918 (241,401) [47,329] in patients with LT (Tables 1 & 2). Mean (SD) annual inpatient hospitalizations also increased from baseline following diagnosis, scaling with severity, from 0.20 (0.63) to 0.48 (3.20) per patient with non-cirrhotic NASH, 0.39 (0.93) to 1.31 (5.54) per patient with CC, 0.97 (1.38) to 7.45 (17.69) per patient with DCC, 0.65 (1.37) to 5.50 (13.29) per patient with HCC and 0.79 (1.51) to 2.19 (5.90) per patient with LT (Tables 1 & 2).
| Non-cirrhotic NASH (n = 12,990) | CC (n = 1899) | DCC (n = 977) | HCC (n = 209) | LT (n = 140) | |
|---|---|---|---|---|---|
| Follow-up months after diagnosis, mean (SD) [median] | 33.2 (17.4) [32.6] | 24.6 (17.1) [21.9] | 14.8 (14.2) [10.4] | 14.3 (13.9) [10.0] | 33.9 (19.2) [34.8] |
| Total overall spending, mean (SD) [median] | $27,044 (79,275) [11,941] | $57,705 (240,014) [23,106] | $181,036 (278,929) [86,856] | $165,121 (240,308) [98,389] | $108,918 (241,401) [47,329] |
| Total pharmacy spending, mean (SD) [median] | $5422 (13,726) [1491] | $7503 (14,559) [2712] | $7875 (14,352) [2727] | $8876 (15,950) [2654] | $9008 (15,082) [5164] |
| Total medical spending, mean (SD) [median] | $21,621 (77,448) [7804] | $50,202 (239,695) [15,552] | $173,162 (280,596) [76,475] | $156,245 (240,847) [79,972] | $99,910 (242,158) [35,544] |
| Inpatient hospitalizations | |||||
| Any, n (%) | 4483 (35) | 948 (50) | 811 (81) | 146 (70) | 95 (68) |
| Count of visits, mean (SD) | 0.48 (3.20) | 1.31 (5.54) | 7.45 (17.69) | 5.50 (13.29) | 2.19 (5.90) |
| Total spending, mean (SD) [median] | $8279 (64,272) [0] | $26,590 (217,625) [0] | $105,346 (231,022) [27,168] | $86,190 (208,139) [21,880] | $63,576 (198,598) [9666] |
| Outpatient visits | |||||
| Any, n (%) | 11,914 (92) | 1767 (93) | 865 (87) | 190 (91) | 137 (98) |
| Total spending, mean (SD) [median] | $4040 (10,778) [1468] | $6561 (13,840) [2760] | $11,153 (19,221) [4682] | $25,489 (33,179) [13,093] | $10,634 (23,240) [4419] |
| Emergency department | |||||
| Any, n (%) | 6810 (52) | 1175 (62) | 848 (85) | 151 (72) | 105 (75) |
| Skilled nursing facilities | |||||
| Any, n (%) | 999 (8) | 256 (13) | 344 (35) | 41 (20) | 30 (21) |
| Total spending, mean (SD) [median] | $1260 (9019) [0] | $3429 (16,996) [0] | $13,284 (32,380) [0] | $7073 (24,478) [0] | $1966 (5777) [0] |
| Physician office | |||||
| Any, n (%) | 12,987 (100) | 1897 (100) | 996 (100) | 208 (100) | 140 (100) |
| Total spending, mean (SD) [median] | $6623 (12,643) [3807] | $10,955 (23,777) [5447] | $33,040 (57,579) [13,505] | $27,328 (37,150) [15,202] | $19,133 (46,152) [8506] |
| Durable medical equipment | |||||
| Any, n (%) | 7471 (58) | 1219 (64) | 566 (57) | 112 (54) | 110 (79) |
| Total spending, mean (SD) [median] | $467 (2535) [25] | $717 (3748) [66] | $694 (3232) [29] | $473 (1891) [9] | $2293 (4158) [791] |
| Home health | |||||
| Any, n (%) | 2513 (19) | 486 (26) | 437 (44) | 80 (38) | 63 (45) |
| Total spending, mean (SD) [median] | $634 (2297) [0] | $1225 (3394) [0] | $3158 (5452) [0] | $2,756 (5324) [0] | $1804 (3473) [0] |
| Hospice | |||||
| Any, n (%) | 421 (3) | 101 (5) | 315 (32) | 85 (41) | 15 (11) |
| Total spending, mean (SD) [median] | $318 (3684) [0] | $723 (4956) [0] | $6488 (20,234) [0] | $6935 (16,046) [0] | $505 (1941) [0] |
Dollar amounts are inflated to 2021 USD using the Gross Domestic Product Price Index. The follow-up period was defined as the interval from the index date for each health state diagnosis to the earliest of death, the end of Medicare coverage, the end of the study period, or the index date for the next disease state for patients who progressed.
CC: Compensated cirrhosis; DCC: Decompensated cirrhosis; HCC: Hepatocellular carcinoma; LT: Liver transplantation; NASH: Nonalcoholic steatohepatitis; SD: Standard deviation.
Adjusting for demographics, comorbidities and baseline HRU, patients with non-cirrhotic NASH with subsequent progression to a more severe disease state had significantly higher follow-up spending (1.6-times) than non-progressors (p < 0.001; Table 3). Controlling for baseline characteristics among patients progressing from non-cirrhotic NASH, there was an average annualized cost savings of $6401 (95% confidence interval: -$8435, -$4366; p < 0.001) per year of delayed progression. However, as costs and progression were measured simultaneously, the effect is not causal. Similarly, patients with CC with subsequent progression to a more severe disease state had significantly higher follow-up spending (1.7-times) than non-progressors (p < 0.001; Table 3). Additionally, non-cirrhotic NASH progressors had 2.8-times higher odds of experiencing any inpatient hospitalization, 2.6-times higher odds of being in the top 20% of spenders based on annualized spending and 2.4-times higher odds of being a super-utilizer (≥3 annual inpatient hospitalizations) relative to the odds of non-cirrhotic NASH non-progressors (all p < 0.001; Table 3). Similarly, CC progressors had 6.1-times higher odds of experiencing any inpatient hospitalization, 3.6-times higher odds of being in the top 20% of spenders based on annualized spending and 3.1-times higher odds of being a super-utilizer relative to the odds of CC non-progressors (all p < 0.001; Table 3).
| Non-cirrhotic NASH (n = 12,990) | CC (n = 1899) | DCC (n = 997) | HCC (n = 209) | |||||||||
|---|---|---|---|---|---|---|---|---|---|---|---|---|
| Non-progressors (n = 11,991) | Progressors (n = 999) | p-value | Non-progressors (n = 1523) | Progressors (n = 376) | p-value | Non-progressors (n = 947) | Progressors (n = 50) | p-value | Non-progressors | Progressors | p-value | |
| Overall spending | $27,179 | $42,157 | <0.001 | $54,257 | $92,108 | <0.001 | $185,304 | $139,147 | 0.0658 | [redacted]§ | ||
| AME [95% CI] | p-value | AME [95% CI] | p-value | AME [95% CI] | p-value | AME [95% CI] | p-value | |||||
| Among progressors, effect of 1 year of delayed progression | -$6401 [-8435 to -4366] | <0.001 | -$14,331[-18,554 to -10,107] | <0.001 | -$36,098 [-40,521 to -31,675] | <0.001 | [redacted]§ | |||||
| OR [95% CI] | p-value | OR [95% CI] | p-value | OR [95% CI] | p-value | OR [95% CI] | p-value | |||||
| Any inpatient hospitalization | 2.79 [2.41–3.23] | <0.001 | 6.13 [4.42–8.50] | <0.001 | 2.29 [0.84–6.27] | 0.106 | [redacted]§ | |||||
| Super-utilizer (≥3 annualized inpatient admissions) | 2.43 [1.80–3.28] | <0.001 | 3.07 [2.10–4.48] | <0.001 | 0.89 [0.47–1.66] | 0.707 | ||||||
| Top 20% spending | 2.64 [2.25–3.11] | <0.001 | 3.56 [2.58–4.92] | <0.001 | 0.24 [0.06–1.06] | 0.059 | ||||||
†
A log-linked gamma distribution GLM was used to estimate the annual follow-up costs of progressors and non-progressors, adjusting for differences at baseline.
‡
A multivariate logistic regression model was used to estimate the odds ratios of various outcomes for progressors vs non-progressors, adjusting for differences at baseline.
§
Some cells are redacted due to the Medicare data-use agreement, which prevents reporting of cells where n <11 and medians where n <50.
AME: Average marginal effect; CC: Compensated cirrhosis; CI: Confidence interval; DCC: Decompensated cirrhosis; GLM: Generalized linear model; HCC: Hepatocellular carcinoma; NASH: Nonalcoholic steatohepatitis; OR: Odds ratio.
Follow-up costs correlated with the time of progression. Within the non-cirrhotic NASH cohort, costs increased for earlier progression; year 1 progressors' costs ($50,382) were 1.4, 1.6, 1.7 and 2.2-times more than patients who progressed to more severe disease states following their pre-cirrhotic NASH diagnosis later, when comparing to years 2, 3, 4 and 5 progressors' costs, respectively (Figure 2). In the CC cohort, year 1 progressors' costs ($75,599) were 1.3, 1.8, 2.0 and 2.2-times more than patients who progressed to more severe disease states following their CC diagnosis later, when comparing to years 2, 3, 4 and 5 progressors' costs, respectively (Figure 2).
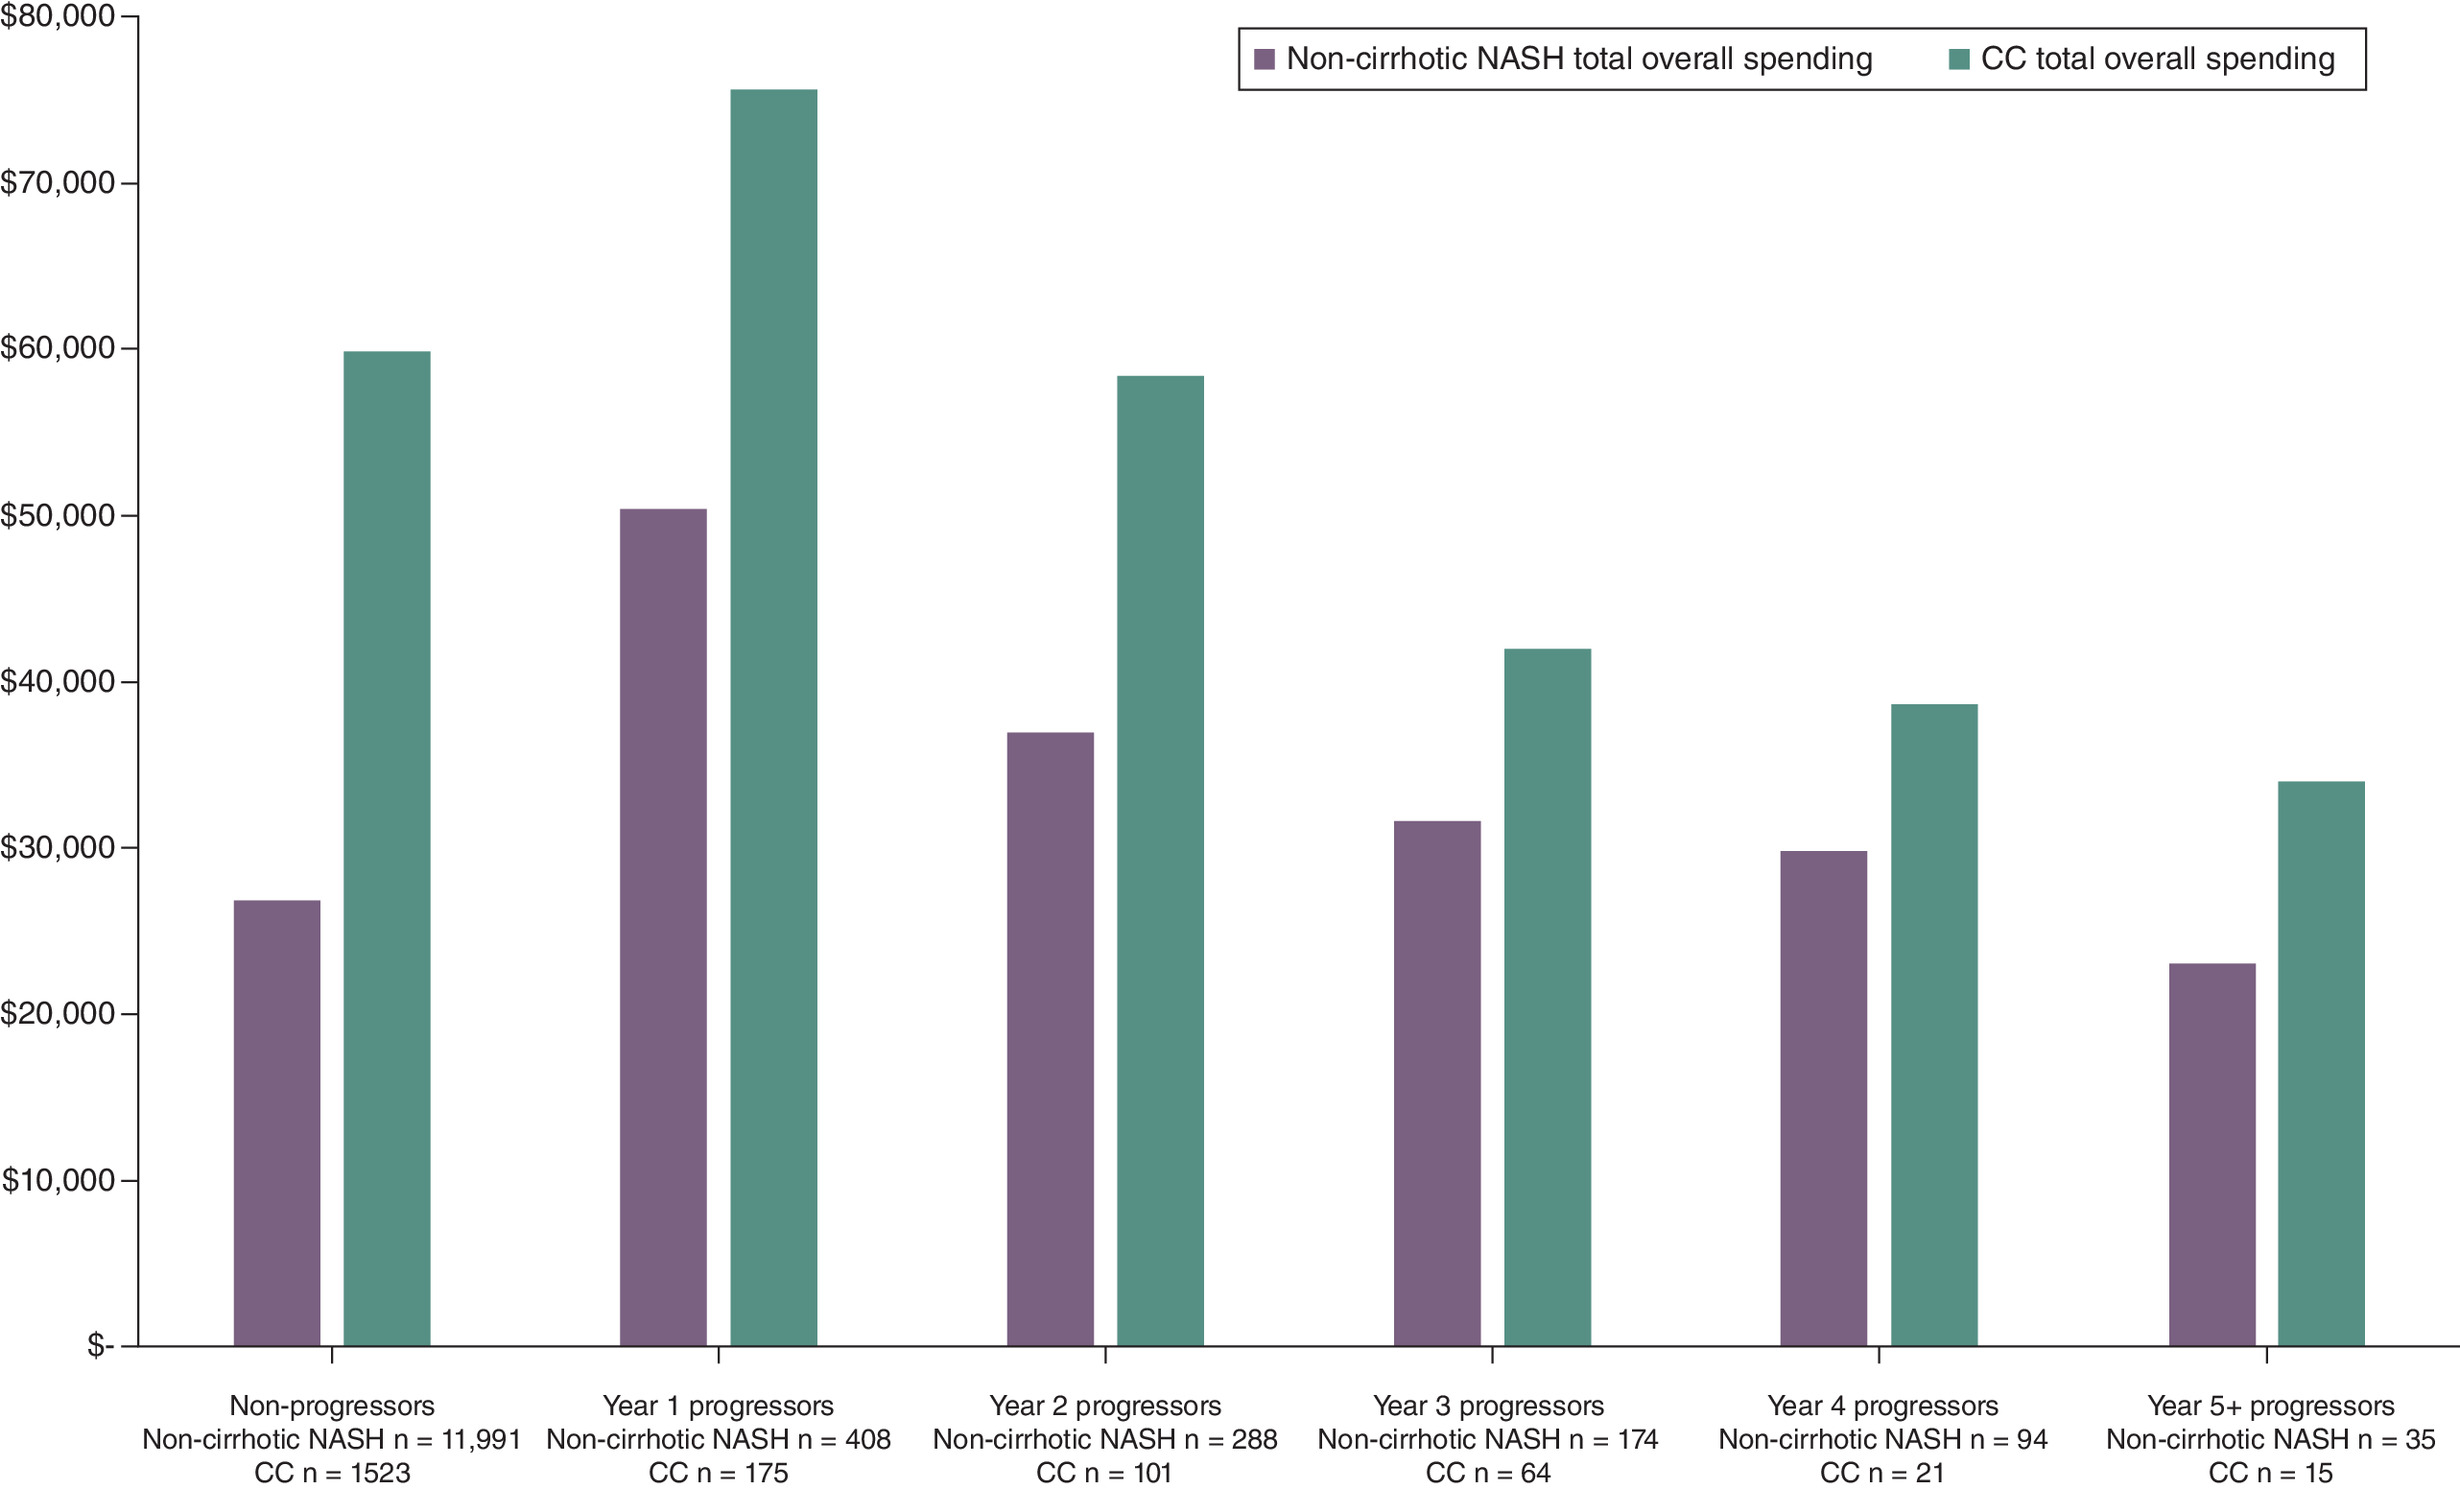
Figure 2. Increased costs by year of progression.
Progression to disease severity states is evaluated using the earliest diagnosis/procedures for CC, decompensated cirrhosis, liver transplant and hepatocellular carcinoma following NASH diagnosis. Annualized per-patient costs during the follow-up period are shown for patients without observed progression and by year of progression from NASH/CC onset.
CC: Compensated cirrhosis; NASH: Nonalcoholic steatohepatitis.
Outpatient resource use in the form of follow-up visits to gastroenterology specialists were also common among the study population. Just over half (51%) of patients in the NASH cohort had a physician office claim for a gastroenterologist over the follow-up period. This percentage increased for the more advanced disease cohorts. Additionally, 76, 70 and 83% of CC, HCC and LT patients, respectively, visited a gastroenterologist during the follow-up period. However, the most visits were observed for patients with DCC; 84% of the DCC cohort had a gastroenterologist visit during the follow-up, with an average of 16 gastroenterology visits per year.
In sensitivity analyses comparing CC subgroups with diagnosis before NASH, during the 90-day grace period and after the 90-day grace period, no meaningful differences were found. The three subgroups had nearly identical survival during the follow-up period and similar distributions of overall costs, suggesting no inherent differences across patients identified during each of these periods.
Results of these descriptive analyses indicate that HRU and spending scale drastically with more severe NASH disease states. Additionally, they show that progression – even within less severe states – is associated with substantial increases in HRU and spending and provide evidence that delaying progression could lead to lower HRU burden and cost savings.
Discussion
In this retrospective, non-interventional real-world cohort study of US Medicare patients with NASH, we found that NASH progression was associated with high healthcare costs that increased in more severe disease states. Additionally, healthcare costs correlated with the rate of progression, with patients who progressed earlier incurring higher costs than patients who progressed in later years.
This study adds to the small body of literature evaluating the economic burden of NASH, particularly within the US Medicare population, who are representative of the older adult population. The findings are consistent with other US-based claims analyses of patients with NAFLD/NASH and provide a more up-to-date view of the topic by evaluating patient data through 2021 [7,26,28]. As was observed in this study, a previous observational cohort study of Medicare 20% sample data (2007–2015) found that total mean annual healthcare costs substantially increased from the pre-diagnosis to the post-diagnosis period across all disease severity states [26]. Additionally, patients with NASH/NAFLD without disease progression incurred significantly lower mean annual healthcare costs than patients with more advanced disease [26]. A recent commercial claims study found that progression from non-cirrhotic to cirrhotic NASH was associated with a significant increase in healthcare costs similar in magnitude to that estimated in this Medicare analysis [38]. A separate study that used MarketScan Commercial claims (2006–2016) found that annual all-cause healthcare costs were 1.22, 5.64, 8.27 and 4.09-times higher (all p < 0.0001) for patients with CC, DCC, LT and HCC compared with patients with NAFLD/NASH without advanced liver disease [28]. Observational studies of NAFLD/NASH patients in Germany, Spain, France and Italy also reported substantial increases in HRU and costs for more advanced liver disease [39–42], further supporting the finding that patients who progress to more severe disease states incur higher healthcare costs.
Management of NASH requires care coordination between primary care providers and medical specialists, including endocrinologists, hepatologists and gastroenterologists [43]. A recent survey of patients with NASH reported that just over half of patients received their initial NASH treatment from a gastroenterologist or hepatologist [44]. In the same survey, 79% of specialists (gastroenterologists and hepatologists) reported initiating NASH treatment for their patients and 22% reported monitoring or adjusting NASH treatment initiated by other healthcare providers, highlighting the key role specialists play in the management of NASH [44]. In the current study, 51% of patients with NASH had a follow-up visit with a gastroenterologist and this percentage increased in more severe disease states, with 84% of patients with DCC having a follow-up visit with a gastroenterologist and an average of 16 visits per year, highlighting the increasing resource needs placed on healthcare specialists for patients with more advanced disease states.
Taken together, these findings underscore substantial financial and resource allocations linked not only to NASH, but also to progression of more advanced stages of more severe liver disease. The recent FDA approval of resmetirom [19], the first pharmacologic specifically approved for the treatment of adult patients with NASH with moderate to severe fibrosis, provides patients with a crucial new pharmacologic treatment option that has the potential to achieve NASH resolution or improve the state of liver scarring [20]. Moreover, it paves the way for new research avenues, including from the perspective of evaluating the economic burden associated with NASH. Exploring whether halting or slowing progression of NASH to more severe disease states could alleviate the economic burden that disease progression imposes on healthcare systems is an intriguing area for future research, particularly given the financial and social strain of NASH progression in conditions like DCC and HCC, which often necessitate liver transplantation [3,4]. Future research should examine transitions between specific disease states and the associated changes in healthcare spending to further inform the value of preventing NASH progression.
Strengths of this study lie in the utilization of data from a census of individuals enrolled in Original Medicare and diagnosed with NASH, which enhances the generalizability of study findings to a very large portion of all patients with NASH. Notably, few studies have evaluated the economic impacts of NASH within this demographic [27]. Medicare data afford access to metrics not commonly found in commercial databases, such as beneficiary mortality and ethnicity. Additionally, the dataset's span from 2005 allows for a comprehensive understanding of liver disease, including ample opportunity to identify liver disease occurrences, mortality and practice trends up to 2021.
Findings from this study are subject to limitations. First, small sample sizes for some analyses limited the statistical power to detect differences in outcomes across stratification levels. Additionally, outputs from CMS-provided data sources were aggregated across at least 11 patients and any outputs where n <11 were redacted and medians were not presented for any populations where n <50 in order to prevent patient re-identification. Second, use of administrative claims data relies on accurate diagnosis codes and lacks potentially relevant clinical information on patients prior to their entry into the database. We were also unable to identify fibrosis staging or confirm disease states due to lack of lab and biopsy results in the data. As such, once patients had evidence of a more advanced disease state they were not permitted to revert to a less severe state even though patients with CC in particular may have improved to a non-CC condition, but likely remained at increased risk of progression. Similarly, NASH recurrence following LT and DCC recompensation were not examined due to small sample size and inability to accurately assess recurrence in claims data. Third, consistent with an expert panel consensus statement on defining NASH in observational research [31] and prior claims-based studies on NASH costs [24,28,38], patients with evidence of other causes of liver disease prior to their index NASH diagnosis were excluded from this study, which may have introduced selection bias. While this exclusion is recommended when trying to evaluate the burden of NASH alone [31], it potentially makes the results of this study conservative in that patients with other concurrent liver diseases or misclassification of liver disease may have more resource consumption. Examination of this more complex NASH patient population should be a topic of further research. Fourth, there is limited generalizability of the results outside of the Original Medicare population or to populations later than the study period. Fifth, patients in the study were censored at death, which was not considered to be disease progression in this study. Finally, as the results are from descriptive analyses, the study was not designed to establish a causal relationship between progression, or timing of progression and changes in outcomes.
Conclusion
NASH progression is associated with higher costs that increase in more severe disease states among older adults in a US Medicare population. Conversely, a slower progression impact includes reduced costs, indicating a potential advantage of therapies or interventions aimed at delaying or preventing the progression for individuals with NASH or CC.
Summary points
•
Non-alcoholic steatohepatitis (NASH) is a severe form of non-alcoholic fatty liver disease (NAFLD).
•
Patients with NASH may progress to more advanced liver disease states, including compensated cirrhosis (CC), decompensated cirrhosis (DCC) and hepatocellular carcinoma (HCC) and may eventually require a liver transplant (LT).
•
There are few studies evaluating the economic burden of NASH, particularly within the US Medicare population.
•
This retrospective study aimed to quantify the direct costs and healthcare resource utilization associated with NASH by disease severity state using 100% Medicare claims (2015–2021) from 14,806 unique patients (n = 12,990 NASH; 1899 CC; 997 DCC; 209 HCC; 140 LT).
•
Average annualized costs increased from baseline following diagnosis, generally scaling with severity.
•
Patients with non-cirrhotic NASH and CC with subsequent progression to a more severe disease state had significantly higher adjusted follow-up spending than patients who did not progress with same baseline disease severity.
•
Non-cirrhotic NASH and CC progressors had 2.8 and 6.1-times higher odds to experience inpatient hospitalization and 2.6 and 3.6-times higher odds to be in the top 20% of spenders, respectively, relative to the odds of non-progressors.
•
For patients with non-cirrhotic NASH, costs increased for earlier progression; year 1 progressors' costs were 1.4, 1.6, 1.7 and 2.2-times more than year 2, 3, 4 and 5 progressors' costs, respectively.
•
Non-cirrhotic NASH and CC progression is associated with high costs that increase in more severe disease states, suggesting a potential benefit of therapies that may delay or prevent progression for patients with non-cirrhotic NASH or CC.
Author contributions
All authors were responsible for study conception, design, interpretation of results and drafting and revision of the manuscript. Matthew Davis and Dominic Nunag were responsible for data acquisition and analysis.
Acknowledgments
The authors gratefully acknowledge the contribution of Jesse Fishman, PharmD, MSc, formerly of Madrigal Pharmaceuticals, in providing helpful discussions and advice on study design.
Financial disclosure
Madrigal Pharmaceuticals, Inc provided funding for this research. Y Kim and J Medicis are employees of Madrigal Pharmaceuticals, Inc. M Davis and D Nunag are employees of Medicus Economics, LLC, which received funding from Madrigal Pharmaceuticals, Inc., to participate in this research. R Gish has performed as consultant and/or advisor to (in the last 2 years): Abacus, Abbott, AbbVie, Albireo, Aligos, Altimunne, Arrowhead, AstraZeneca, Audentes Therapeutics, Corcept, Dynavax, Effectus, Eiger, Eisai, Genentech, Genlantis, Gerson Lehrman Group, Gilead Sciences, GlaxoSmithKline, Helios, HepaTX, HepQuant, Intercept, Janssen, JBS Science, Kinnate Bio, Madrigal, Merck, Precision BioSciences, Pfizer, Seres Therapeutics, Topography Health, Tune Therapeutics, Venatorx, Virion. The authors have no other relevant affiliations or financial involvement with any organization or entity with a financial interest in or financial conflict with the subject matter or materials discussed in the manuscript apart from those disclosed.
Competing interests disclosure
The authors have no competing interests or relevant affiliations with any organization or entity with the subject matter or materials discussed in the manuscript. This includes employment, consultancies, honoraria, stock ownership or options, expert testimony, grants or patents received or pending, or royalties.
Writing disclosure
Medical writing assistance was provided by Cody Patton, BSc, an independent contractor working on behalf of Medicus Economics, LLC.
Ethical conduct of research
This article does not contain any studies with human participants or animals performed by any of the authors. Because deidentification was conducted before providing claims data to researchers, and no identifiable protected health information was included in the data used, Institutional Review Board approval was not required for this study. All analyses were conducted in compliance with RECORD-PE guidance and in accordance with the ethical standards in the 1964 Declaration of Helsinki and its subsequent amendments.
Data sharing statement
Database permission was provided by CMS; however, the database is otherwise not publicly available.
Open access
This work is licensed under the Attribution-NonCommercial-NoDerivatives 4.0 Unported License. To view a copy of this license, visit https://creativecommons.org/licenses/by-nc-nd/4.0/
Supplementary Material
File (supplementary materials.docx)
- Download
- 79.44 KB
References
Papers of special note have been highlighted as: • of interest; •• of considerable interest
1.
Pouwels S, Sakran N, Graham Y et al. Non-alcoholic fatty liver disease (NAFLD): a review of pathophysiology, clinical management and effects of weight loss. BMC Endocr. Disord. 22(1), 63 (2022).
2.
Younossi Z, Koenig A, Abdelatif D, Fazel Y, Henry L, Wymer M. Global epidemiology of nonalcoholic fatty liver disease-meta-analytic assessment of prevalence, incidence, and outcomes. Hepatology 64(1), 73–84 (2016).
3.
Younossi Z, Stepanova M, Ong J et al. Nonalcoholic steatohepatitis is the most rapidly increasing indication for liver transplantation in the United States. Clin Gastroenterol Hepatol. 19(3), 580–589.e5 (2021).
4.
Huang DQ, Singal AG, Kono Y, Tan DJH, El-Serag HB, Loomba R. Changing global epidemiology of liver cancer from 2010 to 2019: NASH is the fastest growing cause of liver cancer. Cell Metab. 34(7), 969–977.e2 (2022).
5.
Chalasani N, Younossi Z, Lavine JE et al. The diagnosis and management of nonalcoholic fatty liver disease: practice guidance from the American Association for the Study of Liver Diseases. Hepatology 67(1), 328–357 (2018).
6.
Loomba R, Adams LA. The 20% Rule of NASH Progression: the natural history of advanced fibrosis and cirrhosis caused by NASH. Hepatology 70(6), 1885–1888 (2019).
7.
Loomba R, Wong R, Fraysse J et al. Nonalcoholic fatty liver disease progression rates to cirrhosis and progression of cirrhosis to decompensation and mortality: a real world analysis of Medicare data. Aliment. Pharmacol. Ther. 51(11), 1149–1159 (2020).
• Provided novel real-world evidence on progression rates of non-alcoholic fatty liver disease (NAFLD) among a 20% Medicare representative sample of adult patients.
8.
Sanyal AJ, Harrison SA, Ratziu V et al. The natural history of advanced fibrosis due to nonalcoholic steatohepatitis: data from the simtuzumab trials. Hepatology 70(6), 1913–1927 (2019).
9.
Sheka AC, Adeyi O, Thompson J, Hameed B, Crawford PA, Ikramuddin S. Nonalcoholic steatohepatitis: a review. JAMA 323(12), 1175–1183 (2020).
10.
Alqahtani SA, Schattenberg JM. NAFLD in the elderly. Clin. Interv. Aging. 16, 1633–1649 (2021).
11.
Chen TP, Lai M, Lin WY, Huang KC, Yang KC. Metabolic profiles and fibrosis of nonalcoholic fatty liver disease in the elderly: a community-based study. J Gastroenterol Hepatology. 35(9), 1636–1643 (2020).
12.
Miyaaki H, Ichikawa T, Nakao K et al. Clinicopathological study of nonalcoholic fatty liver disease in Japan: the risk factors for fibrosis. Liver Int. 28(4), 519–524 (2008).
13.
Pais R, Charlotte F, Fedchuk L et al. A systematic review of follow-up biopsies reveals disease progression in patients with non-alcoholic fatty liver. J. Hepatol. 59(3), 550–556 (2013).
14.
Younossi Z, Aggarwal P, Shrestha I et al. The burden of non-alcoholic steatohepatitis: a systematic review of health-related quality of life and patient-reported outcomes. JHEP Rep. 4(9), 100525 (2022).
• This systematic review provided evidence of the substantial health-related quality of life burden associated with non-alcoholic steatohepatitis (NASH) that increases with disease progression.
15.
European Association for the Study of the Liver (EASL), European Association for the Study of Diabetes (EASD), European Association for the Study of Obesity (EASO). EASL-EASD-EASO Clinical Practice Guidelines for the Management of Non-Alcoholic Fatty Liver Disease. Obes. Facts. 9(2), 65–90 (2016).
16.
Cusi K, Isaacs S, Barb D et al. American Association of Clinical Endocrinology clinical practice guideline for the diagnosis and management of nonalcoholic fatty liver disease in primary care and endocrinology clinical settings: co-sponsored by the American Association for the Study of Liver Diseases (AASLD). Endocr. Prac. 28(5), 528–562 (2022).
17.
Leoni S, Tovoli F, Napoli L, Serio I, Ferri S, Bolondi L. Current guidelines for the management of non-alcoholic fatty liver disease: a systematic review with comparative analysis. World J. Gastroenterol. 24(30), 3361–3373 (2018).
18.
Vuppalanchi R, Noureddin M, Alkhouri N, Sanyal AJ. Therapeutic pipeline in nonalcoholic steatohepatitis. Nat. Rev. Gastroenterol. Hepatol. 18(6), 373–392 (2021).
19.
US Food & Drug Administration. FDA approves first treatment for patients with liver scarring due to fatty liver disease. (2024) (Accessed: 28 March 2024). https://www.fda.gov/news-events/press-announcements/fda-approves-first-treatment-patients-liver-scarring-due-fatty-liver-disease#:∼:text=Today%2C%20the%20U.S.%20Food%20and,along%20with%20diet%20and%20exercise
20.
Harrison SA, Bedossa P, Guy CD et al. A Phase III, randomized, controlled trial of resmetirom in NASH with liver fibrosis. N. Engl. J. Med. 390(6), 497–509 (2024).
•• This trial provided evidence on the efficacy and safety of resmetrion for treatment of patients with biopsy-confirmed NASH and fiborsis stage F1B, F2 or F3.
21.
Madrigal Pharmaceuticals. Madrigal Pharmaceuticals announces new data from the Phase III MAESTRO-NASH study of Rezdiffra™ (resmetirom) presented at the EASL Congress. (2024) (Accessed: 19 July 2024). https://ir.madrigalpharma.com/news-releases/news-release-details/madrigal-pharmaceuticals-announces-new-data-phase-3-maestro-nash
22.
Sinakos E, Liava C, Loomba R. Emerging advances in the pharmacologic treatment of nonalcoholic steatohepatitis and related cirrhosis. Ann. Gastroenterol. 35(3), 213–225 (2022).
23.
Allen AM, Van Houten HK, Sangaralingham LR, Talwalkar JA, McCoy RG. Healthcare cost and utilization in nonalcoholic fatty liver disease: real-world data from a large U.S. claims database. Hepatology 68(6), 2230–2238 (2018).
• This real-world claims study demonstrated the substantial economic burden (total healthcare costs and resource utilization) assocaited with NAFLD in the United States.
24.
Gordon SC, Kachru N, Parker E, Korrer S, Ozbay AB, Wong RJ. Health care use and costs among patients with nonalcoholic steatohepatitis with advanced fibrosis using the fibrosis-4 score. Hepatol. Commun. 4(7), 998–1011 (2020).
• Provided evidence that patients with NAFLD/NASH with advanced fibrosis incur significant healthcare costs and healthcare resource utilization. Additionally, healthcare costs and healthcare resource utilization increased with liver fibrosis severity.
25.
Javanbakht M, Fishman J, Moloney E, Rydqvist P, Ansaripour A. Early cost-effectiveness and price threshold analyses of resmetirom: an investigational treatment for management of nonalcoholic steatohepatitis. Pharmacoecon. Open. 7(1), 93–110 (2023).
26.
Gordon SC, Fraysse J, Li S, Ozbay AB, Wong RJ. Disease severity is associated with higher healthcare utilization in nonalcoholic steatohepatitis Medicare patients. Am. J. Gastroenterol. 115(4), 562–574 (2020).
27.
Witkowski M, Moreno SI, Fernandes J, Johansen P, Augusto M, Nair S. The economic burden of non-alcoholic steatohepatitis: a systematic review. Pharmacoeconomics 40(8), 751–776 (2022).
28.
Wong RJ, Kachru N, Martinez DJ, Moynihan M, Ozbay AB, Gordon SC. Real-world comorbidity burden, health care utilization, and costs of nonalcoholic steatohepatitis patients with advanced liver diseases. J. Clin. Gastroenterol. 55(10), 891–902 (2021).
• This study of patients with NASH demonstrated that healthcare costs and healthcare resource utilization increase in more severe disease states.
29.
Langan SM, Schmidt SA, Wing K et al. The reporting of studies conducted using observational routinely collected health data statement for pharmacoepidemiology (RECORD-PE). BMJ. 363, k3532 (2018).
30.
Husereau D, Drummond M, Augustovski F et al. CHEERS 2022 ISPOR Good Research Practices Task Force. Consolidated Health Economic Evaluation Reporting Standards 2022 (CHEERS 2022) Statement: Updated Reporting Guidance for Health Economic Evaluations. (2022) (Accessed: 2 May 2024). https://www.equator-network.org/reporting-guidelines/cheers/
31.
Hagström H, Adams LA, Allen AM et al. Administrative coding in electronic health care record-based research of NAFLD: an expert panel consensus statement. Hepatology 74(1), 474–482 (2021).
32.
Rinella ME, Lazarus JV, Ratziu V et al. A multisociety Delphi consensus statement on new fatty liver disease nomenclature. Hepatology 78(6), 1966–1986 (2023).
33.
Goldberg D, Lewis J, Halpern S, Weiner M, Lo Re V 3rd. Validation of three coding algorithms to identify patients with end-stage liver disease in an administrative database. Pharmacoepidemiol. Drug Saf. 21(7), 765–969 (2012).
34.
Chronic Conditions Warehouse Virtual Research Data Center. Data Output Review Process Version 2.3 (2023) (Accessed: 2 May 2024). https://www2.ccwdata.org/
35.
Dunn A, Grosse SD, Zuvekas SH. Adjusting health expenditures for inflation: a review of measures for health services research in the United States. Health Serv. Res. 53(1), 175–196 (2018).
36.
Johnson ML, Crown W, Martin BC, Dormuth CR, Siebert U. Good research practices for comparative effectiveness research: analytic methods to improve causal inference from nonrandomized studies of treatment effects using secondary data sources: The ISPOR Good Research Practices for Retrospective Database Analysis Task Force Report–Part III. Value Health. 12(8), 1062–1073 (2009).
37.
Rayabandla S. A review of the characteristics of super-utilizers and evidence based approaches to reduce healthcare utilization. Capstone Experience., 154. (2020) (Accessed: 31 May 2024). https://digitalcommons.unmc.edu/coph_slce/154
38.
Fishman JC, Qian C, Kim Y et al. Cost burden of cirrhosis and liver disease progression in metabolic dysfunction-associated steatohepatitis: A US cohort study. J. Manag. Care Spec. Pharm. 30(9), 929–941 (2024).
• Provides recent evidence on the economic burden of NASH. It demonstrated that healthcare costs and healthcare resource utilization are higher among patients with NASH with cirrhosis and disease progression than without.
39.
Canbay A, Kachru N, Haas JS, Meise D, Ozbay AB, Sowa JP. Healthcare resource utilization and costs among nonalcoholic fatty liver disease patients in Germany. Ann. Transl. Med. 9(8), 615 (2021).
40.
Romero-Gomez M, Kachru N, Zamorano MA, Darba J, Shreay S. Disease severity predicts higher healthcare costs among hospitalized nonalcoholic fatty liver disease/nonalcoholic steatohepatitis (NAFLD/NASH) patients in Spain. Medicine 99(50), e23506 (2020).
41.
Boursier J, Shreay S, Fabron C, Torreton E, Fraysse J. Hospitalization costs and risk of mortality in adults with nonalcoholic steatohepatitis: analysis of a French national hospital database. EClinicalMedicine. 25, 100445 (2020).
42.
Petta S, Ting J, Saragoni S et al. Healthcare resource utilization and costs of nonalcoholic steatohepatitis patients with advanced liver disease in Italy. Nutr. Metab. Cardiovasc. Dis. 30(6), 1014–1022 (2020).
43.
Porayko MK, Articolo A, Cerenzia W, Coleman B, Patel D, Stacy S. Differences in NAFLD/NASH management by provider specialty: opportunities for optimizing multidisciplinary care. J Multidiscip Healthc. 15, 1533–1545 (2020).
44.
Rinella M, Cryer DR, Articolo A, Fisher T, Schneider J, Nadolsky K. Nonalcoholic steatohepatitis medical patient journey from the perspective of hepatologists, gastroenterologists and patients: a cross-sectional survey. BMC Gastroenterol. 22(1), 335 (2022).
Information & Authors
Information
Published In
Copyright
© 2024 Madrigal Pharmaceuticals, Inc. This work is licensed under the Attribution-NonCommercial-NoDerivatives 4.0 Unported License
History
Received: 26 July 2024
Accepted: 27 October 2024
Published online: 22 November 2024
Keywords:
Topics
Authors
Metrics & Citations
Metrics
Article Usage
Article usage data only available from February 2023. Historical article usage data, showing the number of article downloads, is available upon request.
Citations
How to Cite
Costs associated with nonalcoholic steatohepatitis disease progression in Medicare patients: a retrospective cohort study. (2024) Journal of Comparative Effectiveness Research. DOI: 10.57264/cer-2024-0096
Export citation
Select the citation format you wish to export for this article or chapter.
Citing Literature
- Windson Hebert Araújo Soares, Guilherme Grossi Lopes Cançado, André Soares Motta-Santos, Cost-Effectiveness of Resmetirom for Metabolic Dysfunction-Associated Steatohepatitis in Brazil, Value in Health Regional Issues, 10.1016/j.vhri.2025.101526, 53, (101526), (2026).
- Husam Albarmawi, Anran Tan, Abdalla Aly, Anthony Hoovler, Caichen Zhong, Jamieson Vaccaro, Joanna Harton, Parvez Mantry, The healthcare resource utilization and costs associated with metabolic dysfunction-associated steatohepatitis among Medicare beneficiaries: a retrospective cohort study, Journal of Medical Economics, 10.1080/13696998.2026.2630601, 29, 1, (498-515), (2026).
- Zahra Sarkoohi, Mohammad-Mahdi Bastan, Mohammad Amin Khajuei Gharaei, Mahsa Iranmanesh, Arya Adinepour, Reyhane Khajezade, Faegheh Bahri, Fatemeh Akhlaghi, Azin Kadkhodamanesh, Hossein Pourghadamyari, Hamid Sharifi, Omid Eslami, Seyed Aria Nejadghaderi, Epidemiological trends and burden of metabolic dysfunction-associated steatotic liver disease in the Middle East and North Africa region: a 32-year analysis of health impact, Journal of Health, Population and Nutrition, 10.1186/s41043-025-00973-5, 44, 1, (2025).