Understanding economic analysis and cost–effectiveness of CT scan-guided, 3-dimensional, robotic-arm assisted lower extremity arthroplasty: a systematic review
This article has been corrected.
VIEW CORRECTIONPublication: Journal of Comparative Effectiveness Research
Abstract
Aim: The overall goal of this review was to examine the cost-utility of robotic-arm assisted surgery versus manual surgery. Methods: We performed a systematic review of all health economic studies that compared CT-based robotic-arm assisted unicompartmental knee arthroplasty, total knee arthroplasty and total hip arthroplasty with manual techniques. The papers selected focused on various cost-utility measures. In addition, where appropriate, secondary aims encompassed various clinical outcomes (e.g., readmissions, discharges to subacute care, etc.). Only articles directly comparing CT-based robotic-arm assisted joint arthroplasty with manual joint arthroplasty were included, for a resulting total of 21 reports. Results: Almost all twenty-one studies demonstrated a positive effect of CT scan-guided robotic-assisted joint arthroplasty on health economic outcomes. For studies reporting on 90-day episodes of costs, 10 out of 12 found lower costs in the robotic-arm assisted groups. Conclusion: Robotic-arm assisted joint arthroplasty patients had shorter lengths of stay and cost savings based on their 90-day episodes of care, among other metrics. Payors would likely benefit from encouraging the use of this CT-based robotic technology.
Tweetable abstract
A systematic review finds that robotic-arm assisted joint arthroplasty patients compared with manual techniques had shorter lengths of stay and cost savings based on their 90-day episodes of care, among other metrics.
Plain language summary
What is this article about?
We reviewed all health economic studies that examined partial and total knee replacements as well as hip replacements that were performed with the robotic-arm assistance and a preoperative computerized tomography scan compared with traditional techniques for performing these procedures. This led to an evaluation of 21 studies.
What were the results?
We found that the robotic-arm assisted joint replacement patients had shorter lengths of stay and cost savings. Almost every study in this review found economic advantages to using this new technology.
What do the results of the study mean?
Payors would likely benefit from encouraging the use of CT-based robotic technology.
Total hip arthroplasty (THA), as well as unicompartmental (UKA) and total knee arthroplasty (TKA), have each been shown to markedly improve a patient's quality of life, however, there remains a small subset of patients who are dissatisfied following the procedure [1–4]. In recent years, computed tomography (CT) scan-guided, 3-dimensional (3D), robotic-arm assisted joint arthroplasty (rJA) has been increasingly applied and has shown improved surgical precision, such as increased ability to position the acetabular component in the ‘safe zone’ [5] and improved alignment in UKA and TKAs [6–8]. There have been several studies published regarding the potential advantages of these advanced technologies, with many demonstrating improved patient outcomes and others evaluating their cost effectiveness [9–11].
Some of the reported clinical benefits of CT scan-guided 3D-rJA include, decreased pain scores, improved patient reported outcome measures (PROMs), and improved survivorship when compared with manual joint arthroplasty (mJA) [12–15]. Some of the differences in post-operative pain have been linked to soft-tissue protection from the robotic-system's haptic boundaries or from fewer soft-tissue releases needed in order to obtain optimal balance and alignment [16,17]. Marchand et al. compared data on one-year PROMs between robotic-arm assisted TKA (rTKA) and conventional TKA and found significant improvement in Western Ontario and McMaster Universities Osteoarthritis (WOMAC) scores as well as lower pain scores in the rTKA cohort [13]. Onggo et al. performed a large meta-analysis of rTKA and found component positions were more precise with fewer outliers in the rTKA cohort [14]. Ng et al. performed a large meta-analysis and found that a significantly higher proportion of acetabular components were placed in the safe zone in the robotic-arm assisted THA (rTHA) group, and significantly higher Harris Hip Scores in the short- and medium-term as well [15].
Computed tomography scan-guided, 3D, rJAs are associated with costs including initial system purchase, maintenance, and ongoing disposables utilized intra-operatively, as well as a pre-operative CT scan. Prior studies have evaluated the economics of CT scan-guided 3D-rJA, with some mixed results. In particular, some studies found higher index costs of surgery associated with the robotic system's added expenses [18–22], while other studies found lower index costs of surgery largely associated with decreased lengths of stay. Studies examining global episodes of care found that, on average, lower costs of care for patients undergoing CT scan-guided 3D-rJA were related to lower utilization of post-discharge services, including decreased proportions of patients going to a rehabilitation or a skilled nursing facility (SNF), as well as lower utilization of emergency department (ED) services and reduced rates of readmission [23–27].
The overall goal of this review was to examine the cost-utility of robotic-arm assisted surgery vs manual surgery. The papers selected focused on various cost and utility measures. In addition, where appropriate, secondary aims encompassed various clinical outcomes (e.g., readmissions, discharges to subacute care, etc.).
Methods
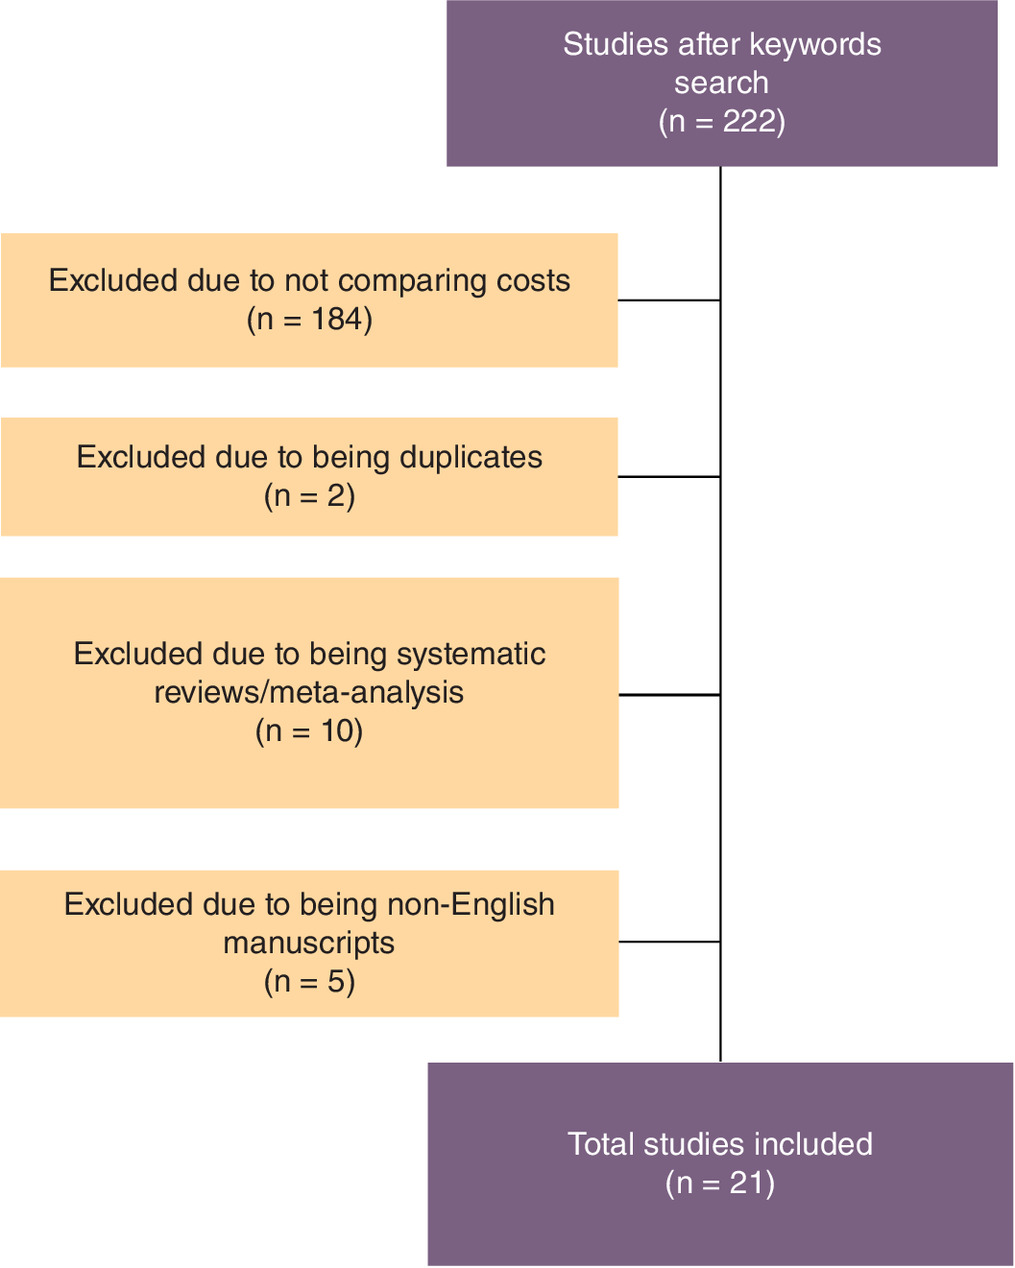
Searches of PubMed, EMBASE, Cochrane Library, and Google Scholar were performed on 1 September 2022. Search keywords included “robotic total joint arthroplasty”, OR “robotic-assisted total joint arthroplasty”, OR “robotic-arm assisted total joint arthroplasty”, OR “robotic total hip arthroplasty”, OR “robotic-assisted total hip arthroplasty”, OR “robotic-arm assisted total hip arthroplasty”, OR “robotic total knee arthroplasty”, OR “robotic-assisted total knee arthroplasty”, OR “robotic-arm assisted total knee arthroplasty”, OR “economic utility”, OR “cost utility”, OR “economic analysis”, OR “cost analysis”, OR “cost utilization”, OR “episode of care”. Forward referencing was applied. This resulted in a total of 222 results. Inclusion criteria included: all studies comparing the cost of joint arthroplasty with or without a robotic system up to 1 September 2022. Exclusion criteria included: duplicates; systematic reviews; meta-analyses and articles in languages other than English (Figure 1).
Only articles directly comparing CT-based rJA with manual JA were included, for a resulting total of 19 reports (2 UKA, 11 TKA, and 6 THA). There were two of the THA studies that were from an overlapping database of patients; therefore, we described both, but treated them as one study. There were two other studies that compared rUKA to manual TKA and one that combined UKA and TKA results that were also included to make a total of 21 studies tabulated. All studies were independently evaluated by two reviewers, and the data was extracted and maintained in a separate database. If there was disagreement between the authors, a neutral party would make the final decision.
Some of the data points that were present in many of the studies included: lengths of stay (LOS); 90-day episodes of care (EOC) costs; index costs; and post-discharge costs, including emergency department (ED) visits and re-admissions, as well as home health and discharge dispositions. Of note is that all data points reported in the studies were recorded. Data for UKA, TKA, and THA were then subcategorized, and data points were included and reported in the tables.
A quality assessment of the studies was conducted using the Modified Coleman Methodology Score (MCMS), scaled from 0 to 100. The MCMS provides an objective methodological assessment by factoring in sample sizes, follow-up times, and clinical effect measurements (Table 1). Scores were specifically categorized as “excellent” (85 to 100), “good” (70 to 84), “fair” (55 to 69) and “poor” (<55), as reported by Cowan et al. [28]. Of note is that all studies had a minimum MCMS of 71 points with “good” methodology ratings.
| Study (year) | Coleman score | Ref. |
|---|---|---|
| Cool et al. (2019) | 76 | [26] |
| Clement et al. (2019) | 71 | [29] |
| Cotter et al. (2020) | 75 | [24] |
| Mont et al. (2021) | 75 | [23] |
| Pierce et al. (2020) | 72 | [30] |
| Tompkins et al. (2022) | 72 | [18] |
| Fang et al. (2022) | 77 | [31] |
| Rajan et al. (2022) | 77 | [32] |
| Ong et al. (2022) | 76 | [27] |
| Gregory et al. (2022) | 72 | [35] |
| Grosso et al. (2022) | 76 | [33] |
| Hua et al. (2022) | 72 | [10] |
| Emara et al. (2021) | 77 | [20] |
| Kirchner et al. (2021) | 72 | [21] |
| Barsoum et al. (2022) | 72 | [36] |
| Maldonado et al. (2021) | 74 | [34] |
| Kolessar et al. (2022) | 72 | [19] |
| Varughese et al. (2022) | 77 | [11] |
Results
When comparing manual UKA, TKA, and THA with CT scan-guided, 3D, robotic-arm assisted procedures, results were generally favorable toward robotic-arm assisted surgery and similar across groups, with few exceptions. Of note, most of the studies analyzed performed propensity score matching in order to minimize confounding factors between study cohorts and accounted for age, sex, race, geographic region and high-cost comorbidities. We present the UKA, TKA and THA results separately below.
CT scan-guided, 3-dimensional, robotic-arm assisted unicompartmental knee arthroplasty
There were two papers focusing specifically on unicompartmental knee arthroplasty. These included one commercial payor database study and one modeling study based on registry data (Table 1).
A 2019 study by Cool et al. [28] retrospectively evaluated nearly 750 patients utilizing the OptumInsight Inc. database and evaluated the cost and outcomes of robotic-arm assisted UKA (rUKA) compared with manual UKA (mUKA) in both the primary and revision settings from 2013 to 2015. For index UKAs, they found a shorter LOS (1.8 vs 2 days, p = 0.0047), lower index costs ($25,786 vs $26,307, p > 0.05), and a decreased 2-year rate of revision (0.81 vs 5.28%, p = 0.002) for rUKA compared with mUKA. This also led to lower overall index and post-index inpatient costs for rUKA vs mUKA over the 2-year period.
In a 2019 article, Clement et al. [29] utilized a Markov model to evaluate the cost–effectiveness of rUKA relative to mUKA and mTKA using national joint registry data from England and Wales for revision and mortality rates. They included the cost of disposables, robotic-system lease and maintenance, as well as the preoperative CT scan associated with the use of the system. They found that using the model with a case volume of 100 patients and a mean age of 65 years, the overall health gain per patient was 13.59 quality-adjusted life-years (QALYs) after rUKA, 11.80 QALYs after TKA, and 12.20 QALYs after manual UKA. This gave an overall cost per QALY of £1395 and £1170 for rUKA compared with TKA and manual UKA, respectively, which were below the lowest threshold of acceptable costs of £20,000 per QALY. Therefore, rUKA is a cost-effective procedure for patients who have isolated medial compartment OA and meet the criteria for UKA. They also found that the cost per QALY of rUKA decreased with reducing length of hospital stay and with increasing case volume, compared with TKA and UKA, helping to improve the cost per QALY in rUKA as compared with TKA and UKA.
In summary, in two studies, CT scan-guided, 3D, rUKA patients had shorter LOS, lower revision rates and decreased utilizations of post-discharge services when compared with mUKA (Table 1).
CT scan-guided, 3-dimensional, robotic-arm assisted total knee arthroplasty
There were 11 papers that specifically focused on CT scan-guided, 3D, robotic-arm assisted total knee arthroplasty (rTKA). These included three studies from US-based individual institutions, three private payor analyses, two Medicare analyses, one mixed payor analysis, and two modeling studies based on registries and reimbursement schedules.
A 2020 paper by Cotter et al. [24] retrospectively evaluated a series of patients from their institution undergoing either manual or robotic-arm assisted TKA, assessing intraoperative costs, 90-day EOC costs, LOS, complications, post-operative pain measures and readmissions. They found a decreased LOS in the rTKA cohort (1.2 vs 1.6 days, p < 0.0001) and overall lower index costs during the hospitalization ($14,189 vs $15,586, p < 0.001) when compared with mTKA despite slightly higher intra-operative costs ($10,295 vs $9999, p < 0.001). They found lower post-discharge costs for rTKA vs mTKA ($1441 vs $2134, p = 0.019) and a lower 90-day EOC ($15,630 vs $17,721, p < 0.001). Fewer patients in the rTKA cohort were discharged to a subacute nursing facility (SNF) (4.1 vs 8.6%, p = 0.113), and there were fewer readmissions in the rTKA cohort within 90 days (2.7 vs 4.3%, p = 0.532) when compared with mTKA. They also found fewer post-discharge phone calls in the rTKA group (4.3 vs 8.9, p < 0.001) and a lower morphine milligram equivalent (MME) prescribed (984 vs 2240, p < 0.001) vs mTKA (Table 3).
A retrospective review of institutional TKA cases from 2017 to 2019 published in 2022 by Tompkins et al. [18] evaluated differences in inpatient costs between rTKA and mTKAs. They included six surgeons in each cohort, with case volumes ranging from 359 to 938 during the study period, and included direct costs associated with the robotic system in their analysis. They found a similar LOS between the groups. Unlike some of the previous studies, they found higher index costs in the rTKA cohort versus the mTKA cohort ($11,615 vs $8674, p < 0.0001) and similar rates of discharge to SNF (5% in both groups). Readmissions were lower for rTKA vs mTKA (1.2 vs 4.9%, p < 0.0001). They did not analyze the 90-day EOC cost or any post-discharge costs.
Fang et al. [31] published a 2022 article in which they performed a time-driven activity-based costing study reporting on a series of rTKA and mTKA cases from their institution between 2020 and 2021. They evaluated inpatient costs and did not report on 90-day EOC costs or post-discharge utilization. They found a lower LOS for rTKA compared with mTKA (1.8 vs 2.1 days, p < 0.0001) and 10% higher index costs, mainly due to intra-operative increased labor and supply costs. Fewer patients in the rTKA cohort were discharged to SNF or acute rehabilitation (1.1 vs 5.7%, p < 0.017).
A 2022 paper by Grosso et al. [33] retrospectively reviewed 920 matched TKA cases performed at one of their hospitals between 2016 and 2018, including details on 90-day EOC costs for a subset of cases as well as outcomes up to two years post-operatively. They found a shorter LOS in the rTKA cohort compared with mTKA (1.5 vs 1.6 days, p < 0.001), similar index costs, lower 90-day EOC costs ($17,777 vs $20,608), lower post-discharge costs ($4066 vs $6983), and fewer patients discharged to a SNF (5.9 vs 12.2%). Readmission rates and ED utilizations were similar between groups.
A 2021 paper by Mont et al. [23] utilized data from the Medicare Standard Analytic Files from 2016 to 2017 to evaluate differences in rTKA vs mTKA groups with regards to total episode payments, health care utilization, and readmissions, at 30-, 60- and 90-day time points. When compared with mTKA, they found a lower total episode payments in the rTKA cohort at 30 days, $17,768 versus $19,899 (p < 0.0001) at 60 days, $18,174 versus $20,492 (p < 0.0001) and at 90 days $18,568 versus $20,960 (p < 0.0001). At 30 days, 47% fewer rTKA patients utilized skilled nursing facility (SNF) services (13.5 vs 25.4%; p < 0.0001) and had lower SNF costs at 30 days ($6416 vs $7732; p = 0.0040), 60 days ($6678 vs $7901, p = 0.0072), and 90 days ($7201 vs $7947, p = 0.0230). rTKA patients also utilized fewer home health visits and costs at each time point (p < 0.05). Additionally, 31.3% fewer rTKA patients utilized emergency room services at 30 days postoperatively and had 90-day readmissions (5.20 vs 7.75%; p = 0.0423).
A 2020 report by Pierce et al. [30] utilized the OptumInsight Inc. database to compare claims data from commercial payors in rTKA vs mTKA patients under 65 years of age from 2016 to 2017 and evaluated 90-day EOC utilization and cost. They found shorter LOS in the rTKA cohort (1.8 vs 2.7 days, p = 0.0001), decreased index costs ($21,347 vs $24,069, p = 0.0002), lower percentages of patients discharged to SNF (1.7 vs 6.1%, p = 0.0001), lower post-discharge costs ($6857 vs $8189, p = 0.0001), and lower 90-day EOC costs ($28,204 vs $32,253, p = 0.0001) when compared with mTKA. The rTKA cohort also had fewer days of home health utilization (5.3 days vs 6.4 days, p = 0.0037). Readmissions were lower in the rTKA cohort compared to the mTKA cohort (2.2 vs 3.9%, p = 0.1323) and cost less on average per patient during the readmission ($13,328 vs $24,874, p = 0.4223), although these results were not statistically significant.
In a 2019 article by Cool et al. [26], 90-day EOC costs were compared between rTKA and mTKA groups using data from the Medicare Standard Analytic Files from 2016 to 2017. They found a lower LOS in the rTKA cohort (1.8 vs 2.5 days, p < 0.0001), lower index costs during hospitalization ($12,384 vs $13,024, p = 0.0001), as well as post-discharge ($5234 vs $6978, p < 0.0001) and lower overall 90-day EOC costs ($18,568 vs $20,960, p < 0.0001) vs mTKA. Fewer patients were discharged to SNF or inpatient rehabilitation (15.2 vs 28.3%, p < 0.0007), and there was less home health utilization (11.9 vs 14.3 visits, p < 0.0001) and decreased home health costs ($3045 vs $3536, p < 0.0001). Fewer patients utilized ED services in the rTKA cohort (11.2 vs 13.3%, p = 0.1726) and fewer patients were readmitted (5.2 vs 7.8% p = 0.0423).
In a 2022 article, Ong et al. [27] utilized a private payor claims database (MarketScan dataset) to evaluate 90-day EOC costs and post-discharge utilizations in TKA patients under the age of 65 years from 2016 to 2018, as well as complications and outcomes up to one year post-operatively. They found a lower LOS in the rTKA cohort vs mTKA (1.6 vs 1.9 days, p < 0.001), lower index inpatient costs ($32,747 vs $34,509, p = 0.003), lower outpatient rehabilitation ($2272 vs $2494, p < 0.0194) and overall lower 90-day EOC costs ($39,260 vs $41,458, p = 0.001). Fewer patients in the rTKA cohort utilized home health services (68.5 vs 72%, p = 0.048) compared with mTKA.
A 2022 article by Gregory et al. [35] utilized a large national payer database (Blue Health Intelligence) to evaluate 90-day EOC costs and utilizations for rTKA and mTKA cases performed between 2017 and 2019. The cost of the CT scan was included in this study as part of index costs. In the rTKA cohort, they found a lower LOS (1.7 vs 2.0 days, p < 0.0001), lower index costs ($29,984 vs $31,280, p < 0.0001), lower post-discharge costs ($7189 vs $7728, p = 0.0307) and lower 90-day EOC costs ($37,174 vs $39,008, p < 0.0001) compared with mTKA. They also report higher utilizations in the mTKA cohort of SNF admissions (26% higher, p = 0.0626) and re-admissions (16% higher, p = 0.0291), with 15% (p = 0.0036) greater home health utilizations in the rTKA cohort.
A 2022 article by Rajan et al. [32] utilized a Markov model to evaluate the cost–effectiveness of rTKA vs mTKA. Their model simulated the lifetime outcomes of TKA for patients at an average age of 60 years. The costs of rTKA included a preoperative CT scan and the acquisition and use of robotic system. They used three institutional case volumes: low (10 cases); mid (100 cases); and high (200 cases) to generate average per-case robotic costs. Systematic reviews were used to determine revision rates. The rTKA produced 13.55 QALYs vs 13.29 QALYs for the mTKA and ICERs for mid- and high-volume institutions were below WTP. The average number needed to treat was >42 for cost–effectiveness at the $50,000/QALY WTP (Table 4).
A 2022 article by Hua et al. [10] also assessed the cost–effectiveness of rTKA vs mTKA using a Markov model. They considered 90-day episode-of-care (EOC) costs from a healthcare sector perspective, including intraoperative, inpatient and postoperative costs. Costs were estimated using Medicare Inpatient Prospective Payment data, and robotic system costs were obtained from literature. Systematic reviews were used for revision rates, and the Tufts University cost–effectiveness Analysis Registry from 2006 to 2020 to derive optimal quality of life values for TKA. The rTKA resulted in a total QALY of 6.18, relative to 6.17 under the mTKA. In addition, the rTKA total discounted costs were $32,535 compared with $31,917 from mTKA. However, rTKA was cost-effective at a WTP of $50,000/QALY when hospital volume exceeded 49 procedures per year. In probabilistic sensitivity analysis, rTKA was cost-effective at a $50,000/QALY WTP threshold in 50.4% of 10,000 simulations. The authors concluded that even when considering robotic-system costs, rTKA is likely to be cost-effective relative to mTKA in the Medicare population with knee OA in high-volume hospitals through lowering revision rates and decreasing post-acute care costs. Higher-volume hospitals may deliver higher value in performing in rTKA.
In summary, all 11 studies, showed some benefit in health services utilization and/or cost, with the majority showing benefit for CT scan-based robotic-arm assisted TKA compared with manual in multiple clinical and economic measures. There was an overall decreased in LOS, coupled with decreases in index costs, post-discharge costs and 90-day EOC costs. All studies reporting on 90-day EOC costs, including those that included associated robotic system costs in their analysis, found a lower 90-day EOC cost in the rTKA cohort compared to the mTKA cohort due to reduced post-discharge costs (Table 2). On average, discharge to SNF or rehabilitation was twice as common in the mTKA group (13.7 vs 7.1%, p < 0.001), with slightly increased home health service utilizations as well. Readmission rates and associated costs were higher in the mTKA cohort, with similar rates of 90-day ED utilization between groups. Although inpatient periprosthetic fractures were rare in both groups, they occurred more often in the mTKA cohort.
| Cool et al. (2019) | Clement et al. (2019) | |||
|---|---|---|---|---|
| M | R | M | R | |
| Robotic system cost inclusion | N/A | No | N/A | Yes |
| CT-scan cost inclusion | N/A | No | N/A | Yes |
| Total (n) | 492 | 246 | - | - |
| LOS | 2 days | 1.8 days | ||
| In hospital costs | $26,307 | $25,786 | ||
| Post D/C costs | ||||
| 90-day EOC cost | ||||
| Use of HH services (%) | ||||
| HH visits (n) | ||||
| Cost of home health | ||||
| Outpatient rehab costs | ||||
| Revision (1 year) | 5.3% | 0.8% | 1.1% | 0.5% |
| Increase in QALYs | 1.39 | 1.80 | ||
| $/QALY | $1170 | $1395 | ||
D/C: Discharge; ED: Emergency department; EOC: Episode of care; HH: Home healthcare; ICER: Incremental cost-effectiveness ratio; LOS: Length of stay; M: Manual; QALY: Quality-adjusted life-year; R: Robot; SNF: Skilled nursing facility.
| Cotter et al. (2020) | Mont et al. (2021) | Pierce et al. (2020) | Cool et al. (2019) | Tompkins et al. (2022) | Fang et al. (2022) | |||||||
|---|---|---|---|---|---|---|---|---|---|---|---|---|
| Category | M | R | M | R | M | R | M | R | M | R | M | R |
| Robotic system cost inclusion | N/A | Yes | N/A | No | N/A | No | N/A | No | N/A | Yes | N/A | No |
| CT scan cost inclusion | N/A | No | N/A | No | N/A | No | N/A | No | N/A | No | N/A | No |
| Total (n) | 139 | 147 | 2595 | 519 | 1785 | 357 | 2595 | 519 | 2392 | 2392 | 1795 | 263 |
| LOS | 1.6 | 1.2 | 2.5 | 1.8 | 2.7 | 1.8 | 2.5 | 1.8 | 1.84 | 1.76 | 2.1 | 1.8 |
| In-hospital costs | $15,586 | $14,189 | $13,024 | $12,384 | $24,069 | $21,347 | $13,024 | $12,384 | $16,330 | $21,006 | X | 1.1X |
| Post D/C costs | $2134 | $1441 | $6978 | $5234 | $8189 | $6857 | $6978 | $5234 | ||||
| 90-day EOC cost | $17,721 | $15,630 | $20,960 | $18,568 | $32,253 | $28,204 | $20,960 | $18,568 | ||||
| Discharge to SNF/rehab | 8.6% | 4.1% | 28.3% | 15.22% | 6.1% | 1.7% | 28.2% | 15.2% | 5.0% | 5.0% | 6.3% | 1.5% |
| Cost of SNF | $7947 | $7201 | $7849 | $6269 | ||||||||
| Use of HH services | 62.7% | 61.3% | 69.2% | 67.0% | 29.0% | 38.0% | ||||||
| HH visits (n) | 14 | 11.7 | 6.4 | 5.3 | 14.3 | 11.9 | ||||||
| Cost of home health | $3536 | $3045 | $2038 | $2009 | $3536 | $3045 | ||||||
| Outpatient rehab costs | $746 | $802 | $2494 | $2272 | ||||||||
| Readmission within 90 days | 4.3% | 2.7% | 7.8% | 5.2% | 3.9% | 2.2% | 7.8% | 5.2% | 4.9% | 1.2% | ||
| Average readmission costs | $305 | $73.37 | $24,289 | $13,328 | $9696 | $10,570 | ||||||
| Utilizing emergency department (ED) in 90 days post D/C | 7.9% | 8.8% | 13.3% | 11.2% | 9.0% | 9.0% | 13.3% | 11.20% | ||||
| ED costs in 90 days post D/C | $147 | $57 | $736 | $614 | $4179 | $7033 | $736 | $614 | ||||
| In-hospital periprosthetic fracture | 0.7% | 0.0% | ||||||||||
D/C: Discharge; ED: Emergency department; EOC: Episode of care; HH: Home healthcare; ICER: Incremental cost-effectiveness ratio; LOS: Length of stay; M: Manual; PPFx: Periprosthetic fracture; QALY: Quality-adjusted life-year; R: Robot; SNF: Skilled nursing facility.
| Rajan et al. (2022) | Ong et al. (2022) | Gregory et al. (2022) | Grosso et al. (2022) | Hua et al. (2022) | ||||||
|---|---|---|---|---|---|---|---|---|---|---|
| Category | M | R | M | R | M | R | M | R | M | R |
| Robotic system cost inclusion | N/A | Yes | N/A | No | N/A | No | N/A | Yes | N/A | Yes |
| CT scan cost inclusion | N/A | Yes | N/A | No | N/A | Yes | N/A | No | N/A | No |
| Total (n) | 3710 | 742 | 4135 | 4135 | 460 | 460 | ||||
| LOS | 1.91 | 1.56 | 1.98 | 1.74 | 1.6 | 1.5 | ||||
| In-hospital costs | $34,509 | $32,747 | $31,280 | $29,984 | $28,737 | $33,581 | ||||
| Post D/C costs | $6949 | $6513 | $7728 | $7189 | $6983 | $4066 | $2397 | $1618 | ||
| 90-day EOC cost | $41,458 | $39,260 | $39,008 | $37,174 | $20,608 | $17,777 | $31,134 | $32,018 | ||
| Discharge to SNF/rehab (%) | 12.2 | 5.9 | ||||||||
| Cost of SNF | $135 | $91 | ||||||||
| Use of HH services | 72% | 68.5% | ||||||||
| HH visits (n) | ||||||||||
| Cost of home health | $1394 | $1354 | $374 | $404 | ||||||
| Outpatient rehab costs | $3151 | $1865 | ||||||||
| Readmission within 90 days | 15% | 14.8% | 2.39% | 2.83% | ||||||
| Average readmission costs | $2137 | $1781 | ||||||||
| Total discounted cost | $31,917 | $32,535 | ||||||||
| Revision (1 year) | 0.8% | 0.3% | 0.7% | 0.3% | ||||||
| In-hospital PPFx | 0.03% | 0.0% | ||||||||
| Increase in QALYs | 13.29 | 13.55 | 6.17 | 6.18 | ||||||
| ICER - R ($/QALY) | $15,685 | $41,331 | ||||||||
D/C: Discharge; ED: Emergency department; EOC: Episode of care; HH: Home healthcare; ICER: Incremental cost-effectiveness ratio; LOS: Length of stay; M: Manual; PPFx: Periprosthetic fracture; QALY: Quality-adjusted life-year; R: Robot; SNF: Skilled nursing facility.
CT scan-guided, 3-dimensional, robotic-arm assisted total hip arthroplasty
There were a total of six studies evaluating the cost–effectiveness of CT scan-guided 3D-rTHA. There were two studies from an overlapping database, so we will comment on both studies, but for overall tabulation, they were treated as one study group. There were two studies from a large database; one study from Medicare (US), one was from a private payer (US) and two were modeling studies (one US, one UK) based on institutional data.
A 2021 study by Emara et al. [20] utilized the National Inpatient Sample (NIS), a large database with cost data related to inpatient care only, and therefore did not report on any post-discharge data. The NIS comprises a 20% nationally representative sample of all inpatient discharges from community hospitals in the US and is also the largest nationwide all-payor hospital inpatient care database. This study reported on a subset of patients undergoing primary THA from 2008 to 2018. The inpatient cost of care was higher for the rTHA cohort ($18,416 vs, $17,266, p = 0.001), and fewer patients were discharged to SNF (17.4 vs 18.5%, p = 0.205) compared with mTHA. Lengths of stay were lower in the rTHA cohort vs the mTHA (2.2 vs 2.3 days, p < 0.001). Of note, this study also found lower rates of THA dislocation (0.1 vs 0.8, p < 0.001), minor perioperative complications (12.8 vs 21.6%, p = 0.004) and implant related mechanical complications (0.5 vs 3.1%, p < 0.001) for rTHA compared to mTHA. A 2021 Kirchner et al. study [21] utilized the same database as the Emara et al. study (which evaluated patients from 2010 to 2014). They also found a higher inpatient cost of care for rTHA vs mTHA during this time period ($20,046 vs $18,258, p < 0.001), but did not report on discharge dispositions. Lengths of stay were again lower in the rTHA cohort (2.7 vs 2.8 days, p < 0.001). This study also evaluated in-hospital post-operative complications and found no significant difference in the odds of experiencing either a major or a minor complication.
In 2021, Pierce et al. [25] evaluated post-discharge utilizations of services as well as 90-day EOC costs, using payments made by the Center for Medicare and Medicaid Services (CMS) from 2015 to 2018. They found a higher, but not statistically significant, index cost for rTHA compared with mTHA ($12,827 vs $12,665, p = 0.487), but lower 90-day EOC costs ($19,734 vs $20,519, p < 0.0095). Compared with mTHA, LOS was lower in the rTHA cohort (2.3 vs 2.5 days, p = 0.0137), and fewer patients in the rTHA cohort were admitted to a SNF (20.8 vs 25.0%). In addition, rTHA patients spent fewer days at a SNF (18 vs 19.6 days), which amounted to a $1224 average cost savings compared with mTHA. Total overall costs of home health services were lower in the rTHA cohort ($3352 vs $3496).
A 2022 paper by Barsoum et al. [36] utilized data from Blue Health Intelligence on a series of patients who underwent CT scan-guided, 3D, robotic-arm assisted THA or manual total hip arthroplasty between 2018 and 2019 and analyzed differences in 90-day EOC costs and utilization. They found a decreased LOS in the rTHA cohort (1.5 vs 1.7 days) and decreased 90-day EOC costs ($35,436 vs $37,009, p < 0.0001) compared with mTHA. The rTHA group also had lower overall post-discharge costs ($3929 vs $4205, p < 0.1086) vs mTHA. They found a lower index cost for the rTHA cohort, which also included the cost of the necessary preoperative CT scan ($31,507 vs $32,804, p < 0.0001), and an overall lower rate of inpatient utilization (2.3% in the rTHA cohort and 3.4% in the mTHA cohort, p < 0.0203).
A 2021 paper by Maldonado et al. [34] utilized a Markov model to evaluate the cost–effectiveness of rTHA vs mTHA. They utilized the Inpatient Medicare 100% Standard Analytic File for payor costs and a combination of outcomes from their institution for probabilities of infection, dislocation, and revision for rTHA and literature for mTHA. Cumulative costs were assessed using a cycle length of 1 year over a time horizon of 5 years. The authors found lower cumulative costs for rTHAs compared with mTHAs, for both Medicare ($14,410 ± 40 vs $15,355 ± 115) and private payor scenarios ($15,212 ± 82 vs $17,022 ± 204). They also found that rTHA delivered higher QALYs compared with mTHA (2.96 vs 2.92). Overall, they concluded that rTHA was less costly and more effective compared with mTHA.
In 2022, Clement et al. [22] evaluated patient reported outcome measures (PROMs) to calculate cost–effectiveness using QALYs, utilizing data from their own institutions for rTHA and mTHA patients. They found a 0.091 (p = 0.029) greater improvement in the EuroQol 5-dimensional 3-level (EQ-5D) compared with mTHA and a cost per QALY of approximately £3000 for a center undertaking 50 rTHAs per year, which decreased to £1000 for a center undertaking 200 rTHAs per year. The authors concluded that rTHA was a cost-effective intervention relative to mTHA at both 10-year follow-up and for a lifetime horizon and was under the threshold of £20,000 per QALY gained.
In summary, all hip papers reported some positive benefits for CT scan-guided, 3D, robotic-arm assisted THA. For THA, we found that robotic-arm assisted surgery resulted in a decreased LOS across all studies, decreased 90-day EOC costs, a lower likelihood of discharges to SNF or acute rehabilitation, lower post-discharge costs, lower associated home health costs and an increase in QALYs. Some studies reported increased index costs for rTHA, however, those that tracked post discharge costs reported savings for rTHA compared with mTHA at 90 days. There were three papers that analyzed inpatient data only (Emara et al., Kirchner et al. and Clement et al.) and found improvements in early hospital outcomes (complications, dislocations) as well as PROMs (Table 5).
| Emara et al. (2021) | Kirchner et al. (2021) | Pierce et al. (2021) | Clement et al. (2022) | Barsoum et al. (2022) | ||||||
|---|---|---|---|---|---|---|---|---|---|---|
| Category | M | R | M | R | M | R | M | R | M | R |
| Robotic system cost inclusion | N/A | No | N/A | No | N/A | No | N/A | Yes | N/A | No |
| CT scan cost inclusion | N/A | No | N/A | No | N/A | No | N/A | Yes | N/A | Yes |
| Total (n) | 128,356 | 32,092 | 758 | 758 | 4670 | 938 | 512 | 48 | 8660 | 1732 |
| LOS | 2.3 | 2.2 | 2.8 | 2.7 | 2.5 | 2.3 | 1.7 | 1.5 | ||
| In-hospital costs | $17,266 | $18,416 | $18,258 | $20,046 | $12,665 | $12,827 | $32,804 | $31,507 | ||
| Post D/C costs | $7854 | $6907 | $4205 | $3929 | ||||||
| 90-day EOC cost | $20,519 | $19,734 | $37,009 | $35,436 | ||||||
| Discharge to SNF/rehab | 18.5% | 17.4% | 27.7% | 20.8% | ||||||
| Use of HH services | 64.9% | 72.9% | ||||||||
| Cost of home health | $3496 | $3352 | ||||||||
| Utilizing ED in 90 days post D/C | 13.5% | 13.6% | ||||||||
| ED costs in 90 days post D/C | $786 | $715 | ||||||||
| Revision (1 year) | 0.40% | 0.40% | ||||||||
| In-hospital PPFx | 0.5% | 0.2% | ||||||||
| Increase in QALYs | 1.06 | |||||||||
| ICER - R ($/QALY) | £1432 | |||||||||
D/C: Discharge; ED: Emergency department; EOC: Episode of care; HH: Home healthcare; ICER: Incremental cost-effectiveness ratio; LOS: Length of stay; M: Manual; PPFx: Periprosthetic fracture; QALY: Quality-adjusted life-year; R: Robot; SNF: Skilled nursing facility.
Other comparison studies
Combined UKA & TKA
In a 2022 retrospective study, Kolessar et al. [19] evaluated a series of 178 patients (6 mUKAs, 29 rUKAs, 58 mTKAs, and 85 rTKAs) performed at their home institution in 2018 and 2019. They reported on 90-day EOC costs and included the cost of disposables as well as the preoperative CT scans associated with the use of the robotic system, but did not include associated maintenance or purchase costs. For the UKA groups, LOS was lower in the robotic-arm assisted cohort (1.4 vs 1.6 days, p = 0.51), index costs were higher ($4025 vs $3287, p = 0.0001), post-discharge costs were lower ($1051 vs $1239, p = 0.75), and 90-day EOC costs were also higher ($5076 vs $4526) (Table 6). Only 14% of patients in the robotic-arm assisted cohort utilized home health services, compared with 83% in the conventional cohort. Overall, the robotic-arm assisted index procedure cost more, but there was a shorter LOS and fewer patients utilized home health services in the robotic-arm assistance group.
For the TKA groups, LOS was similar, with more patients in the robotic-arm assisted cohort discharged earlier, but with several outliers staying multiple extra days in the robotic-arm assisted cohort. Index costs were higher in the robotic-arm assisted cohort ($4668 vs $4087, p = 0.0001), post-discharge costs were lower ($1196 vs $1602, p = 0.10), and 90-day EOC costs were similar ($5864 for robotic TKA vs $5689 for conventional TKA). Only 6% of robotic-arm assisted TKA patients utilized home health services, vs 28% in the conventional cohort.
Comparison of robotic-arm assisted UKA to manual TKA
A 2022 retrospective study by Varughese et al. [11] evaluated the potential cost savings of using robotic arm-assisted UKA vs manual TKA at a single center by four high-volume orthopaedic surgeons. There were 240 patients reviewed (120 rUKA and 120 mTKA) and assessed through medical records for the overall cost to their hospital of the index procedure and the costs of each component. The results demonstrated significantly lower costs for rUKA when compared with mTKA, with an average saving of $7179 AU (Australian dollars) per case. Robotic-arm assisted UKA patients had increased operating times (86 vs 75.9 min, p = 0.004), but a lower length of stay (1.8 vs 4.5 days, p < 0.001). In addition, the use of opioids after the procedure was significantly less in the rUKA group compared with the mTKA group (125 vs 522.1 MME, p < 0.001) (Table 6).
| Kolessar et al. (2022) | Varughese et al. (2022) | |||||
|---|---|---|---|---|---|---|
| Category | UKA (M) | UKA (R) | TKA (M) | TKA (R) | UKA (R) | TKA (M) |
| Robotic system cost inclusion | N/A | No | N/A | No | No | N/A |
| CT-scan cost inclusion | N/A | Yes | N/A | Yes | Yes | N/A |
| Total (n) | 6 | 19 | 58 | 85 | 120 | 120 |
| LOS | 1.6 | 1.4 | 1.8 | 1.8 | ||
| In-hospital costs | $3287 | $4025 | $4087 | $4668 | $12,020 | $19,199 |
| 90-day EOC cost | $1239 | $1051 | $1602 | $1196 | ||
| Use of HH services | 83.0% | 17.0% | 29.0% | 6.0% | ||
| HH visits (n) | 5 | 5 | 17 | 5 | ||
| Cost of home health | $609 | $241 | ||||
| Outpatient rehab costs | $482 | $137 | ||||
| Opioids - R UKA (ME) | 125 | |||||
| Opioids - M TKA (ME) | 522.1 | |||||
D/C: Discharge; ED: Emergency department; EOC: Episode of care; HH: Home healthcare; ICER: Incremental cost-effectiveness ratio; LOS: Length of stay; M: Manual; ME: Morphine equivalents; PPFx: Periprosthetic fracture; QALY: Quality-adjusted life-year; R: Robot; SNF: Skilled nursing facility; TKA: Total knee arthroplasty; UKA: Unicompartmental knee arthroplasty.
Discussion
Almost all 20 studies demonstrated a positive effect of CT scan-guided 3D-rJA on health economic outcomes. For studies reporting on 90-day EOC costs, 10 out of 12 found lower costs in the rJA groups. In particular, the TKA cohort, which was also the largest group at 11 studies, was overwhelmingly positive, with average data points favoring rTKA in every aspect. Cost–effectiveness was shown across the board in all three arthroplasty cohorts.
A number of studies utilized large databases in order to compile and analyze data. For those studies utilizing inpatient-only databases (e.g., the NIS database), some found a higher index cost for rTHA (e.g., Emara et al. [20] and Kirchner et al. [21]), but did not capture the 90-day EOC cost of care. We can possibly extrapolate post-discharge costs on the basis of discharge dispositions. Emara et al. found that fewer rTHA patients were discharged to SNFs or rehabilitation units, which may have led to lower post-discharge costs and an overall lower 90-day EOC cost. In addition, it is possible that some older data may not accurately represent today's inpatient environment. For example, the 2022 American Joint Replacement Registry (AJRR) report found that the mean LOS for elective primary THA was 1.4 days in 2021, down from 3.0 days in 2012. However, both the Emara et al. and the Kirchner et al. studies reported an average LOS between 2.2 and 2.8 days, depending on the group, which may suggest that the cost information may not accurately reflect today's costs with a lower LOS.
Some studies found higher index costs for rTKA (e.g., Fang et al. [31], Tompkins et al. [18]), but did not evaluate 90-day EOC costs. Fang et al. found higher costs related to supplies (e.g., disposables) and intraoperative care related to longer operative time. It is unclear whether any of the 24 surgeons included in their analysis were within their learning curve or performed a low volume of rTKA, but both factors would affect these findings. Tompkins et al. also included the associated costs of the robotic system in their index costs, which helps account for the higher index costs, and found an equal rate of non-home discharge in both groups. However, the readmission rate was nearly four-times higher in their manual TKA cohort, which may have led to a lower 90-day EOC cost for the rTKA cohort had the costs for these events been included. Tompkins et al. excluded data from the first 20 cases for each of the 12 surgeons included in their analysis and only included surgeons performing at least 75 TKAs annually, which helps account for the significantly lower operating room time when compared with Fang et al.
In addition to reduced LOS, a greater likelihood of a home discharge and lower post-discharge utilization of services, there were other cost savings provided by rTJA. Cotter et al. [24] found that every rTKA used two fewer trays, with sterile processing costs of $250 per tray. Per their calculation, each rTKA costs an additional $803 to account for system maintenance, depreciation, and disposables. The $500 savings for the reduced number of surgical trays largely offset the robotic-associated costs and helped contribute to a $2091 average savings of rTKA over conventional TKA.
When reading and analyzing publications on economic costs, it is critically important that both the reader and the author(s) are clear in both utilizing consistent data in comparisons and, clearly defining to whom the economic impact is being attributed. For example, it is not appropriate to combine claims data which outlines the costs to payers and patients, with data related to certain hospital-paid expenses. If a claims data study is looking at the costs over a 90-day period to the payor, then the cost of capital and disposables are both irrelevant and improper to include. If the study is intended to define the cost or savings driven by a new technology for the entire healthcare system, then all costs must be included. For example, if the costs of hardware or disposables for a new technology are included, then there must be any cost impacts due to a reduction or extension in lengths of stay, decreased or increased medication usages, decreased or increased resources used under the hospital's global payment due to changes in complications, movement in market shares, or changes in throughput due to the technology, etc.
There were twelve studies in this evaluation that were from the perspective of the payor (five private payors, three Medicare payors and four mixed payors) all from US data sources. In all instances where post-discharge care was included, savings were shown over the episode of care, including 90 days, 12 months and 24 months. Overall, rJA appears to be favorable from a payor perspective. In private payor analyses, 90-day EOC savings ranged from $1834 to $4049 for rTKA and $1766 for rTHA. Medicare analyses reported 90-day EOC savings at $2391 for rTKA and $785 for rTHA. Even with the cost of the pre-operative CT scan included, savings were still shown over the EOC. This has the potential for substantial payor savings over the volume of covered lives, even when considering costs for pre-operative CT scans.
There were four studies that were Markov or cost–effectiveness models, two from the UK and two from the US. In all instances, robotic-arm assisted total joint arthroplasty showed improvement in QALY gain compared with mTKA and met the threshold for acceptable cost–effectiveness.
There were four studies that were from the hospital cost perspective; 3 were from the US and one was from Australia. There were two studies that showed reduced costs for rJA and two that showed increased costs. Of note, those that stated increased costs did not include post-discharge costs. It is also important to note that the reporting of these costs can be highly variable depending on hospital accounting practices. One study attempted to include both the hospital and the payer perspective and showed mixed results. Hospitals adopting robotic-arm assisted technology may benefit from streamlining their processes. Cotter and colleagues showed they were able to offset their robotics costs by reducing trays and the costs of sterilization, as well as reducing the length of hospital stays [37,38]. Studies on the learning curve of rJA have shown that surgeons can become time-neutral in 7 to 20 cases, depending on the application, which can neutralize operating room time costs [37–42]. Additionally, bundled payment arrangements may be favorable. Shah et al. evaluated calculated risk-adjusted, price-standardized payments for the surgical episode from admission through 90-days post-discharge, comparing manual and rTKAs. They found that risk-adjusted 90-day episode spending was lower among patients who had rTKA vs mTKA ($13,676 vs $14,263). Patients who underwent rTKA had a shorter length of stay compared with mTKA (1.9 vs 2.3 days) as well as a lower incidence of complications (mTKA: 3.3 vs rTKA: 2.7%). Additionally, patients who underwent rTKA were less often discharged to a post-acute care facility than patients who underwent mTKA (mTKA: 32.4 vs rTKA: 16.8%). Both Bundled Payment for Care Improvement and non-Bundled Payment for Care Improvement hospitals with greater than 50% rTKA utilization had lower spending per episode of care vs spending at hospitals with less than 50% rTKA utilization. They concluded that hospitals participating in the Bundled Payment for Care Improvement may experience cost-savings with increased utilization of rTKA [43].
It should be noted that a 2020 study by Sherman et al. [9] reported that 246 of 727 (33.8%) AAHKS members use robotic-arm assistance for TJA. Of the users, 242 (98.4%) report using the technology for TKA, and 120 (48.7%) report using it for THA. This report demonstrated that advanced technologies are becoming more widely accepted and practiced. Therefore, knowledge about the economic utility of robotics is important as we enter a time where healthcare costs continue to grow, and our findings support the economic benefit of rTJA [35,44–46].
It is encouraging that almost every study in this review found economic advantages to using this technology. Studies that showed mixed results actually included costs to the hospital and mixed hospital costs with payor costs without a complete and rigorous analysis of overall costs and savings. It is important that authors do not pick and choose only certain costs or benefits to stakeholders when doing an economic analysis, and it is critical that the author clearly state from which stakeholder's perspective the costs are being analyzed. Additionally, using appropriately powered studies with accepted normalization and a review of comparator and experimental groups is critical.
We have conducted a thorough evaluation of cost-utility outcomes ranging from intra-hospital costs to 90-day episode of care costs to costs up to 1 year. This paper did not focus on longer-term outcomes such as revisions, which would typically occur after the 1-year time point. Although Cool et al. demonstrated cost savings for reduced revisions in rUKA compared to mUKA at 24 months, [28]. Revision rates deserve future attention, as there may be additional value in improving long-term outcomes. Still, it is still important to understand the shorter-term healthcare utility measures such as lengths of hospital stay, readmissions, episodes of care costs, etc. that were performed in this study, as these also contribute to the overall cost of care for total joint arthroplasty patients.
Clinical studies of patient outcomes of CT-based 3D-planned total joint arthroplasty have shown reduced post-operative pain and opioid use, which have been linked to soft-tissue protection resulting from the robotic system's haptic boundaries or from fewer soft-tissue releases needed in order to obtain the surgeon's planned balance and alignment [17]. A prospective randomized control trial also showed reduced inflammatory pain markers when comparing RATKA to MTKA [16]. Early discharge may be linked to reduced early post-operative pain. The data suggests that the episode of care costs of robotic-arm assisted surgery are lower when compared to manual procedures. Reduced costs are driven by reduced LOS, reduced utilization of costly post-discharge care such as SNFs and HHAs, as well as reduced readmissions. Clinical studies have also shown significant reductions in post-operative events such as MUAs, dislocations and revisions [30,32–46]. These findings may be of particular interest to stakeholders specifically responsible for the cost of post-operative care, such as payors, providers and/or healthcare systems involved in payment scenarios that include post-operative care.
For stakeholders purchasing the robot (in most cases, the hospital) the cost of robotic system acquisition should be considered. Cotter et al. demonstrated that in their analysis of hospital costs, the cost of the robotic system was outweighed by the post-operative savings attributed to reduced LOS, reduced instrument sterilization costs, as well as less costly discharge locations [30,32–46]. While some studies state that surgery time can be longer, there are several published learning curve studies that demonstrate that surgeons can return to similar or faster operative times in approximately 20 cases [30,32–46]. These studies also demonstrate improved accuracy and no difference in complications, even through the learning curve.
Further studies on the cost utility of robotic-arm assisted UKA, TKA, and THA are likely warranted to determine if there are any specific aspects of the episode of care that can be identified as areas to focus our efforts on with regards to cost utility, particularly post-discharge utilization of services. In general, this systematic review found that rJA patients had shorter LOS and cost savings based on their 90-day episodes of care, among other metrics. Payors would likely benefit from encouraging the use of this CT-based robotic technology.
Summary points
•
Robotic-arm assisted lower extremity arthroplasty using computed tomography (CT)-based 3-dimensional (3D) planning has been increasingly applied to unicompartmental and total knee arthroplasty as well as total hip arthroplasty (UKA, TKA and, THA).
•
Many studies and several systematic reviews have described improved clinical and radiographic outcomes from the use of this technology.
•
The authors performed a systematic review of all health economic studies that compared CT-based robotic-arm assisted UKA, TKA, and THA with manual techniques, which included 20 articles.
•
In general, this systematic review found that robotic-arm assisted joint arthroplasty (rJA) patients had shorter lengths of stay (LOS) and cost savings based on their 90-day episodes of care, among other metrics.
•
Nearly all 20 studies found economic advantages for CT scan-guided robotic-assisted joint arthroplasty when compared with manual techniques.
•
In all instances where post-discharge care was included, savings were shown over the episode of care, including 90 days, 12 months, and 24 months.
•
Payors would likely benefit from encouraging the use of this CT-based robotic technology.
Financial disclosure
The authors have no financial involvement with any organization or entity with a financial interest in or financial conflict with the subject matter or materials discussed in the manuscript. This includes employment, consultancies, honoraria, stock ownership or options, expert testimony, grants or patents received or pending, or royalties.
Competing interests disclosure
MA Mont: 3M: paid consultant; American Association of Hip and Knee Surgeons: board or committee member; Centrexion: paid consultant; CERAS Health: stock or stock options; CyMedica Orthopedics: research support; Hip Society: board or committee member; Johnson & Johnson: paid consultant, research support; Journal of Arthroplasty: editorial or governing board; Journal of Knee Surgery: editorial or governing board; Knee Society: board or committee member; Kolon TissueGene: paid consultant; Medicus Works LLC: publishing royalties, financial or material support; MirrorAR: Stock or stock options; National Institutes of Health (NIAMS & NICHD): research support; Next Science: paid consultant; Organogenesis: research support; Orthopedics: editorial or governing board; Pacira: paid consultant; Patient-Centered Outcomes Research Institute (PCORI): research support; Peerwell: stock or stock options; Pfizer: paid consultant; RegenLab: research support; Smith & Nephew: paid consultant; Stryker: IP royalties, paid consultant, research support; Surgical Techniques International: editorial or governing board; Up-to Date: publishing royalties, financial or material support; USMI: stock or stock options; Wolters Kluwer Health – Lippincott Williams & Wilkins: publishing royalties, financial or material support. DJ Jacofsky: Biomet: research support; Johnson & Johnson: research support; Journal of Hip Surgery: editorial or governing board; SLACK Incorporated: publishing royalties, financial or material support; Smith & Nephew: research support; Stryker: IP royalties, paid consultant; research support. AB Coppolecchia: Stryker: employee, stock or stock options. The authors have no other competing interests or relevant affiliations with any organization or entity with the subject matter or materials discussed in the manuscript apart from those disclosed.
Writing disclosure
No writing assistance was utilized in the production of this manuscript.
Open access
This work is licensed under the Attribution-NonCommercial-NoDerivatives 4.0 Unported License. To view a copy of this license, visit https://creativecommons.org/licenses/by-nc-nd/4.0/
References
Papers of special note have been highlighted as: • of interest; •• of considerable interest
1.
Halawi MJ, Jongbloed W, Baron S, Savoy L, Williams VJ, Cote MP. Patient dissatisfaction after primary total joint arthroplasty: the patient perspective. J. Arthroplasty 34(6), 1093–1096 (2019).
2.
Elmallah RK, Chughtai M, Adib F, Bozic KJ, Kurtz SM, Mont MA. Determining health-related quality-of-life outcomes using the SF-6D following total hip arthroplasty. J. Bone Joint Surg. Am. 99(6), 494–498 (2017).
3.
Elmallah RK, Cherian JJ, Jauregui JJ, Bhowmik-Stoker M, Beaver WB, Mont MA. Determining health-related quality-of-life outcomes using the SF-6D preference-based measure in patients following total knee arthroplasty. J. Arthroplasty 30(7), 1150–1153 (2015).
4.
Mont MA, Banerjee S, Jauregui JJ, Cherian JJ, Kapadia BH. What outcome metrics do the various knee rating systems for assessment of outcomes following total knee arthroplasty measure? A systematic review of literature. Surg. Technol. Int. 26, 269–274 (2015).
5.
Domb BG, El Bitar YF, Sadik AY, Stake CE, Botser IB. Comparison of robotic-assisted and conventional acetabular cup placement in THA: a matched-pair controlled study. Clin. Orthop. Relat. Res. 472(1), 329–336 (2014).
6.
Samuel LT, Karnuta JM, Banerjee A et al. Robotic arm-assisted versus manual total knee arthroplasty: a propensity score-matched analysis. J. Knee Surg. 36(1), 105–114 (2023).
7.
Marchand KB, Moody R, Scholl LY et al. Results of robotic-assisted versus manual total knee arthroplasty at 2-year follow-up. J. Knee Surg. 36(2), 159–166 (2023).
• Comparison of 80 MTKAs and 80 RATKAs showing significantly better r-WOMAC pain, physical function and total scores for RATKA compared to MTKA.
8.
Marchand RC, Sodhi N, Bhowmik-Stoker M et al. Does the robotic arm and preoperative CT planning help with 3D intraoperative total knee arthroplasty planning? J. Knee Surg. 32(8), 742–749 (2019).
9.
Sherman WF, Wu VJ. Robotic surgery in total joint arthroplasty: a survey of the AAHKS membership to understand the utilization, motivations, and perceptions of total joint surgeons. J. Arthroplasty 35(12), 3474–348 (2020).
10.
Hua Y, Salcedo J. cost–effectiveness analysis of robotic-arm assisted total knee arthroplasty. PLOS ONE 17(11), e0277980 (2022).
11.
Varughese I, Whitehouse SL, Donnelly WJ, Crawford R. The cost effectiveness of unicompartmental versus total knee arthroplasty. J. Knee Surg. (2022) (Online ahead of print).
12.
Mahoney O, Kinsey T, Sodhi N et al. Improved component placement accuracy with robotic-arm assisted total knee arthroplasty. J. Knee Surg. 35(3), 337–344 (2022).
13.
Marchand RC, Sodhi N, Anis HK et al. One-year patient outcomes for robotic-arm assisted versus manual total knee arthroplasty. J. Knee Surg. 32(11), 1063–1068 (2019).
14.
Onggo JR, Onggo JD, De Steiger R, Hau R. Robotic-assisted total knee arthroplasty is comparable to conventional total knee arthroplasty: a meta-analysis and systematic review. Arch. Orthop. Trauma Surg. 140(10), 1533–1549 (2020).
15.
Ng N, Gaston P, Simpson PM, Macpherson GJ, Patton JT, Clement ND. Robotic arm-assisted versus manual total hip arthroplasty: a systematic review and meta-analysis. Bone Joint J. 103-B(6), 1009–1020 (2021).
16.
Kayani B, Konan S, Pietrzak JRT, Haddad FS. Iatrogenic bone and soft tissue trauma in robotic-arm assisted total knee arthroplasty compared with conventional jig-based total knee arthroplasty: a prospective cohort study and validation of a new classification system. J. Arthroplasty 33(8), 2496–2501 (2018).
17.
Hampp EL, Scholl L, Faizan A, Sodhi N, Mont MA, Westrich G. Comparison of iatrogenic soft tissue trauma in robotic-assisted versus manual partial knee arthroplasty. Surg. Technol. Int. 39, 419–426 (2021).
18.
Tompkins GS, Sypher KS, Li HF, Griffin TM, Duwelius PJ. Robotic versus manual total knee arthroplasty in high volume surgeons: a comparison of cost and quality metrics. J. Arthroplasty 37(8S), S782–S789 (2022).
19.
Kolessar DJ, Hayes DS, Harding JL, Rudraraju RT, Graham JH. Robotic-arm assisted technology's impact on knee arthroplasty and associated healthcare costs. J. Health Econ. Outcomes Res. 9(2), 57–66 (2022).
20.
Emara AK, Zhou G, Klika AK et al. Is there increased value in robotic arm-assisted total hip arthroplasty?: a nationwide outcomes, trends, and projections analysis of 4,699,894 cases. Bone Joint J. 103-B(9), 1488–1496 (2021).
21.
Kirchner GJ, Lieber AM, Haislup B, Kerbel YE, Moretti VM. The cost of robot-assisted total hip arthroplasty: comparing safety and hospital charges to conventional total hip arthroplasty. J. Am. Acad. Orthop. Surg. 29(14), 609–615 (2021).
22.
Clement ND, Gaston P, Hamilton DF et al. A cost-utility analysis of robotic arm-assisted total hip arthroplasty: using robotic data from the private sector and manual data from the national health service. Adv. Orthop. 2022, 5962260 (2022).
23.
Mont MA, Cool C, Gregory D, Coppolecchia A, Sodhi N, Jacofsky DJ. Health care utilization and payer cost analysis of robotic arm assisted total knee arthroplasty at 30, 60, and 90 days. J. Knee Surg. 34(3), 328–337 (2021).
24.
Cotter EJ, Wang J, Illgen RL. Comparative cost analysis of robotic-assisted and jig-based manual primary total knee arthroplasty. J. Knee Surg. 35(2), 176–184 (2022).
25.
Pierce J, Needham K, Adams C, Coppolecchia A, Lavernia C. Robotic-assisted total hip arthroplasty: an economic analysis. J. Comp. Eff. Res. 10(16), 1225–1234 (2021).
26.
Cool CL, Jacofsky DJ, Seeger KA, Sodhi N, Mont MA. A 90-day episode-of-care cost analysis of robotic-arm assisted total knee arthroplasty. J. Comp. Eff. Res. 8(5), 327–336 (2019).
27.
Ong KL, Coppolecchia A, Chen Z, Watson HN, Jacofsky D, Mont MA. Robotic-arm assisted total knee arthroplasty: cost savings demonstrated at one year. Clinicoecon. Outcomes Res. 14, 309–318 (2022).
28.
Cool CL, Needham KA, Khlopas A, Mont MA. Revision analysis of robotic arm-assisted and manual unicompartmental knee arthroplasty. J. Arthroplasty 34(5), 926–931 (2019).
29.
Clement ND, Deehan DJ, Patton JT. Robot-assisted unicompartmental knee arthroplasty for patients with isolated medial compartment osteoarthritis is cost-effective: a Markov decision analysis. Bone Joint J. 101-B(9), 1063–1070 (2019).
•• Markov decision analysis demonstrated that rUKA is a cost-effective alternative to manual TKA and UKA for the patients who have isolated medial compartment OA of the knee.
30.
Pierce J, Needham K, Adams C, Coppolecchia A, Lavernia C. Robotic arm-assisted knee surgery: an economic analysis. Am. J. Manag. Care 26(7), e205–e210 (2020).
31.
Fang CJ, Mazzocco JC, Sun DC et al. Total knee arthroplasty hospital costs by time-driven activity-based costing: robotic versus conventional. Arthroplast. Today 13, 43–47 (2022).
32.
Rajan PV, Khlopas A, Klika A, Molloy R, Krebs V, Piuzzi NS. The cost–effectiveness of robotic-assisted versus manual total knee arthroplasty: a Markov model-based evaluation. J. Am. Acad. Orthop. Surg. 30(4), 168–176 (2022).
•• Markov model demonstrated lower annualized revision rates and higher postoperative quality of life, with robotic-assisted TKAs potentially offering improved health outcomes.
33.
Grosso MJ, Li WT, Hozack WJ, Sherman M, Parvizi J, Courtney PM. Short-term outcomes are comparable between robotic-arm assisted and traditional total knee arthroplasty. J. Knee Surg. 35(7), 798–803 (2022).
34.
Maldonado DR, Go CC, Kyin C et al. Robotic arm-assisted total hip arthroplasty is more cost-effective than manual total hip arthroplasty: a Markov model analysis. J. Am. Acad. Orthop. Surg. 29(4), e168–e177 (2021).
35.
Gregory DA, Coppolecchia A, Scotti DJ, Chen Z, Mont MA, Jacofsky D. A 90-day episode-of-care analysis including computed tomography scans of robotic-arm assisted versus manual total knee arthroplasty. J. Knee Surg. 36(10), 1077–1086 (2023).
•• Analysis of commercial claims data showing reduced 90-day EOC cost for RATKA compared to MTKA including pre-operative CT cost. This longer-term perspective allows for a more thorough assessment of the impact of the surgical approach on patient outcomes and healthcare resource utilization.
36.
Barsoum W, Gregory D, Needham K et al. Advantages of robotic-arm assisted total hip arthroplasty: a 90-day episode-of-care cost and clinical utility analysis. 12(5), e220208 (2023).
• Analysis of commercial claims data showing reduced 90-day EOC cost for RATHA compared to MTHA including pre-operative CT cost.
37.
Marchand KB, Ehiorobo J, Mathew KK, Marchand RC, Mont MA. Learning curve of robotic-assisted total knee arthroplasty for a high-volume surgeon. J. Knee Surg. 35(04), 409–415 (2022).
38.
Sodhi N, Khlopas A, Piuzzi N et al. The learning curve associated with robotic total knee arthroplasty. J. Knee Surg. 31(01), 017–021 (2018).
39.
Kayani B, Konan S, Huq SS, Ibrahim MS, Ayuob A, Haddad FS. The learning curve of robotic-arm assisted acetabular cup positioning during total hip arthroplasty. Hip Int. 31(3), 311–319 (2021).
40.
Redmond JM, Gupta A, Hammarstedt JE, Petrakos AE, Finch NA, Domb BG. The learning curve associated with robotic-assisted total hip arthroplasty. J. Arthroplasty 30(1), 50–54 (2015).
41.
Chen Z, Bhowmik-Stoker M, Palmer M et al. Time-based learning curve for robotic-assisted total knee arthroplasty: a multicenter study. J. Knee Surg. 36(8), 873–877 (2023).
42.
Kayani B, Konan S, Huq SS, Tahmassebi J, Haddad FS. Robotic-arm assisted total knee arthroplasty has a learning curve of seven cases for integration into the surgical workflow but no learning curve effect for accuracy of implant positioning. Knee Surg. Sports Traumatol. Arthrosc. 27(4), 1132–1141 (2019).
43.
Shah R, Diaz A, Phieffer L et al. Robotic total knee arthroplasty: a missed opportunity for cost savings in Bundled Payment for Care Improvement initiatives? Surgery 170(1), 134–139 (2021).
•• Analysis of raTKA in bundled payment scenarios shows hospitals participating in the Bundled Payment for Care Improvement may experience cost-saving with increased utilization of robotic total knee arthroplasty.
44.
Khlopas A, Sodhi N, Sultan AA, Chughtai M, Molloy RM, Mont MA. Robotic arm-assisted total knee arthroplasty. J. Arthroplasty 33(7), 2002–2006 (2018).
45.
Marchand KB, Ehiorobo J, Mathew KK, Marchand RC, Mont MA. Learning curve of robotic-assisted total knee arthroplasty for a high-volume surgeon. J. Knee Surg. 35(4), 409–415 (2022).
46.
Siddiqi A, Mont MA, Krebs VE, Piuzzi NS. Not all robotic-assisted total knee arthroplasty are the same. J. Am. Acad. Orthop. Surg. 29(2), 45–59 (2021).
Information & Authors
Information
Published In
Copyright
© 2024 The authors. This work is licensed under the Attribution-NonCommercial-NoDerivatives 4.0 Unported License
History
Received: 24 March 2023
Accepted: 21 December 2023
Published online: 15 March 2024
Keywords:
Topics
Authors
Metrics & Citations
Metrics
Article Usage
Article usage data only available from February 2023. Historical article usage data, showing the number of article downloads, is available upon request.
Citations
How to Cite
Understanding economic analysis and cost–effectiveness of CT scan-guided, 3-dimensional, robotic-arm assisted lower extremity arthroplasty: a systematic review. (2024) Journal of Comparative Effectiveness Research. DOI: 10.57264/cer-2023-0040
Export citation
Select the citation format you wish to export for this article or chapter.
Citing Literature
- Warran Wignadasan, Andreas Fontalis, Abdulellah Alsheddi, Jenni Tahmassebi, Nishma Patel, Elena Pizzo, Fares S. Haddad, Cost-utility analysis of robotic and conventional total knee arthroplasty: A 200-patient micro-costing study in a public sector institution, Journal of Robotic Surgery, 10.1007/s11701-026-03658-1, 20, 1, (2026).
- Lars‐Rene Tuecking, Marco Ezechieli, Christoph Barkhausen, Christian Hendrich, Lea Charlotte Wienholt, Christoph Pross, Rüdiger von Eisenhart‐Rothe, Henning Windhagen, Reduced length of stay and improved perioperative outcomes in robotic‐arm‐assisted TKA: A real‐world evidence study of 63,931 cases from German hospitals, Knee Surgery, Sports Traumatology, Arthroscopy, 10.1002/ksa.70437, (2026).
- Tatsuroh Suzuki, Norio Yamamoto, Takanori Miura, Yuto Otaira, Shuji Fujiwara, Takeshi Yamashita, Takayuki Nakajima, Acetabular component placement accuracy and short-term outcomes in total hip arthroplasty, Bone & Joint Open, 10.1302/2633-1462.72.BJO-2025-0352.R1, 7, 2, (203-215), (2026).
- Jaime Villalobos Medelez, Iván Moguel Sarlat, Alicia Villalobos Rodríguez, Jonathan Rubén Hernández Molina, Diferencia en el tiempo quirúrgico entre artroplastia total de rodilla convencional y asistida por robot en pacientes con gonartrosis primaria, Acta Médica Grupo Ángeles, 10.35366/123142, 24, 3, (237-242), (2026).
- Yajing Gao, Yi Yang, Zhuofu Li, Bai Zang, Chengfengyi Yang, Feifei Zhou, Qiaoqin Wan, Systematic review of health economic evaluation of robot-assisted hip and knee arthroplasty, Health Economics Review, 10.1186/s13561-025-00701-z, 16, 1, (2025).
- Perry L. Lim, Kevin Y. Wang, Nicholas Sauder, Arun R. Kumar, Hany S. Bedair, Christopher M. Melnic, Recovery Time and Success: A Comparative Study of Robotic and Manual Total Hip Arthroplasty Outcomes, The Journal of Arthroplasty, 10.1016/j.arth.2025.01.031, 40, 8, (2084-2091), (2025).
- H Shafeeq Ahmed, Sneha Reddy Pulkurthi, Akhil Fravis Dias, Bethineedi Lakshmi Deepak, Prekshitha Mohan R, Bar Dislocation after Pectus Excavatum Repair: A Systematic Review of Risk Factors, Stabilization Techniques, and Management Strategies, Journal of Chest Surgery, 10.5090/jcs.24.118, 58, 3, (85-98), (2025).
- Rahmat Ibrahim, Ediati Ediati, Tri Wijayanti, Comparative analysis of EQ-5D-L and SF-6D instruments to measure quality of life of osteoarthritis outpatient patients at Dr. Efram Harsana Air Force Hospital, Madiun, International journal of health sciences, 10.53730/ijhs.v9nS1.15108, 9, S1, (88-105), (2025).
- Haotian Zhu, Jiayi Wu, Kai Cheng, Han Yan, Junjun Liang, Yunjin Long, Shaoxing Fan, Yadi Zhang, Huanwen Ding, Clinical Study on the Effects of Total Hip Arthroplasty Assisted by Virtual Planning Combined With Intraoperative Navigation Templates, Orthopaedic Surgery, 10.1111/os.14335, 17, 3, (831-840), (2024).
- Gabrielle N. Swartz, Reza Katanbaf, Sandeep S. Bains, Ronald E. Delanois, Michael A. Mont, Robotic Technique, The Cruciate Ligaments in Total Knee Arthroplasty, 10.1007/978-3-031-75992-5_12, (153-161), (2024).
- See more