Switch rates and total cost associated with apremilast and biologics in biologic-naive patients with psoriatic arthritis
Publication: Journal of Comparative Effectiveness Research
Abstract
Aim: Real-world treatment data for psoriatic arthritis are limited. We evaluated switch rates, adherence, and costs for patients initiating apremilast versus tumor necrosis factor inhibitor (TNFi) and interleukin inhibitor (ILi) among biologic-naive psoriatic arthritis patients. Materials & methods: This retrospective analysis used IBM MarketScan claims data to assess treatment switches, adherence and costs. Results: Twelve-month switch rates were significantly lower for apremilast versus TNFi (15.5% vs 26.6%; p < 0.0001) and similar to ILi (15.5% vs 14.0%; p = 0.71). Apremilast initiators had lower total costs versus TNFi and ILi (US$39,854 vs US$57,243 and US$65,687; p < 0.05) and adherence was slightly lower versus TNFi and higher versus ILi. Conclusion: Biologic-naive apremilast initiators had lower switch rates versus TNFi initiators and lower total costs versus TNFi or ILi initiators.
Background
Psoriatic arthritis (PsA) is a chronic, systemic inflammatory disease that occurs in patients with psoriasis and may lead to permanent joint damage, which can limit physical function and reduce quality of life [1,2]. Although up to 1.0% of the general population is affected by PsA, its prevalence is approximately 20% among the psoriasis population in North America, with estimated rates of 25% among patients with moderate-to-severe psoriasis [2,3]. The incidence of PsA ranges from 0.27 to 2.7 per 100 person-years in patients with psoriasis [3]. Patients with PsA may have many comorbidities, including diabetes, obesity, other autoimmune diseases, Crohn’s disease, ulcerative colitis, ophthalmic disease, depression, anxiety and cardiovascular conditions [1,4]. PsA and its associated comorbidities can negatively affect patient-reported quality of life, and patients with more active disease experience joint degeneration and increased mortality [5,6].
The goals of PsA treatment include controlling disease symptoms and reducing progression to structural joint damage to achieve remission or minimum disease activity [7]. Nonsteroidal anti-inflammatory drugs are generally recommended to manage musculoskeletal symptoms for patients with PsA, particularly for those with mild joint disease [7]. More severe disease generally requires systemic treatment, including conventional synthetic disease-modifying anti-rheumatic drugs (DMARDs) such as sulfasalazine or methotrexate, targeted synthetic DMARDs such as a phosphodiesterase-4 inhibitor or Janus kinase inhibitor, and biologic DMARDs (bDMARDs) such as tumor necrosis factor inhibitors (TNFi) or interleukin inhibitors (ILi) [7,8]. However, use of bDMARDs may not be recommended for some patients; for example, treatment with a TNFi is contraindicated in patients with frequent serious infections [6].
Apremilast, an oral phosphodiesterase-4 inhibitor, was approved in 2014 by the US FDA for the treatment of adult patients with active PsA [9]. The 2018 American College of Rheumatology/National Psoriasis Foundation guidelines recommend apremilast as a treatment option for patients with active PsA, particularly those who have recurring infections or who prefer an oral therapy [6]. Clinical trials have demonstrated the efficacy and safety of apremilast for the treatment of active PsA [10–12]. Unlike certain bDMARDs, apremilast use in a clinical trial setting has not been associated with an increased risk of serious infections or malignancies [10,12].
Because PsA is a chronic condition, treatment costs are often high [6,13]. Several real-world studies have reported that treatment switching is common among patients with PsA [8,14–17]. Reasons for switching include lack of treatment efficacy, safety and tolerability issues, progression of disease, inadequate pain control and failure to achieve or maintain remission [8,16,18]. Analyzing patterns of treatment switching can provide useful insights into the treatment experience of patients with PsA, providing a claims-based proxy of the real-world effectiveness and tolerability of the different treatments for PsA [14]. In addition, payers may be interested in an analysis of PsA treatment switch rates as they relate to the potential for increased associated costs [19]. In this real-world study, our objective was to examine treatment switching, adherence and healthcare costs among biologic-naive patients with PsA who initiated treatment with apremilast or a bDMARD (TNFi or ILi).
Materials & methods
Study design & data source
We conducted a retrospective analysis using the IBM MarketScan® Commercial and Medicare Supplemental databases (IBM Watson Health, MA, USA) to identify two cohorts of biologic-naive patients with PsA: patients who initiated apremilast and patients who initiated a biologic agent for the treatment of PsA between 1 January 2015 and 31 December 2016. A similar retrospective study was carried out for patients with psoriasis but without PsA who received treatment [20].
Study population
Adult patients, ≥18 years of age on the index date (defined as the date of the first claim for the treatment of interest), were eligible for inclusion if they initiated a new treatment with apremilast or a biologic agent (i.e., adalimumab, certolizumab, etanercept, golimumab, infliximab, ixekizumab, secukinumab or ustekinumab) for treatment of PsA with or without psoriasis between 1 January 2015 and 31 December 2016. Patients were required to have at least two International Classification of Diseases, Ninth or Tenth Revision, Clinical Modification (ICD-9-CM/ICD-10-CM) diagnosis codes for PsA with or without a claim for psoriasis during the 12 months before the index date. For PsA, the ICD-9-CM code was 696.0 and the ICD-10-CM codes included L40.50, L40.51, L40.52, L40.53, L40.54 and L40.59. For psoriasis, the ICD-9-CM code was 696.1 and the ICD-10-CM codes included L40.0, L40.1, L40.2, L40.3, L40.4, L40.8 and L40.9. The start date of a new treatment episode was considered to be the index date. A minimum 12-month baseline period that was free of any index agent was required to identify the baseline patient demographics and clinical characteristics, as was a minimum follow-up period of 12 months continuous enrollment to assess switch rates and costs. Patients were included if they did not have a history of biologic use in the pre-index period; however, pre-index conventional synthetic DMARDs or other agents used in PsA were permitted. All available data from the entire pre-index period were used to identify previous biologic- and psoriasis-related therapy exposure. Key exclusion criteria included other biologic-indicated autoimmune conditions (e.g., ulcerative colitis, Crohn’s disease, rheumatoid arthritis and other inflammatory polyarthropathies, ankylosing spondylitis or juvenile idiopathic arthritis), or cancer at any time during the pre-index or postindex period.
Study outcomes & statistical analysis
Switch rate was defined as the proportion of patients who switched to or added a new systemic treatment, either apremilast or biologic therapy (categorized into either TNFi or ILi regimens) after the initiation of the index treatment. Time to switch was defined as the time from the date of initiation of the index treatment to the date of initiation of a new treatment for those patients who did switch within the 12-month follow-up period. Adherence to index treatment was calculated utilizing the medication possession ratio (MPR) and the proportion days covered (PDC). MPR is a ratio of the number of drug doses taken to the number of doses prescribed over a certain time period, whereas PDC is the proportion of days that are covered by prescriptions [21]. Healthcare costs, which comprised both inpatient (i.e., hospital room and bed, medical professional care and procedures/tests conducted during the hospital stay) and outpatient costs (i.e., emergency room admissions, office visits, laboratory tests, diagnostics, infusions, other outpatient and outpatient pharmacy, including psoriasis/PsA-related treatments – both office-administered and outpatient pharmacy prescriptions for apremilast and biologics – and concomitant psoriasis and PsA-related medications), were based on the paid amounts of adjudicated claims, including insurer and health plan payments, as well as patient cost sharing in the form of co-payment, deductible and co-insurance. Healthcare costs reflect actual paid costs based on patient adherence to treatment and treatment switching. Total healthcare costs were defined as the total sum of healthcare costs from the initiation of treatment. Per-patient per-month (PPPM) total healthcare costs were defined as the average total monthly healthcare costs while patients remained on the index treatment and were reported for the 12-month post-index period in subgroups that switched and did not switch, and in the pre-switch and postswitch periods among the subgroup that switched.
Baseline patient demographics and clinical characteristics between the apremilast and biologic cohorts were compared using a t-test for continuous variables and a chi-square test for categorical variables. A 1:2 propensity score matching was used to adjust for possible selection bias and to maximize the number of patients available for analysis. Logistic regression was used to estimate the propensity score for individual patients in the 12-month pre-index period with the following variables: age, gender, region, payer, plan type, index year, pre-index days, Charlson Comorbidity Index score, pre-index cost and a limited number of clinical characteristics, including number of prior systemic agents, previous usage of nonsteroidal anti-inflammatory drugs or COX-2 inhibitors, previous use of corticosteroids or phototherapy, and total healthcare cost in the 12 months prior to the index period. To examine the quality of the propensity score match, standardized mean differences in matching factors between patients receiving apremilast and patients receiving other psoriasis/PsA-related biologic treatments were calculated before and after matching. A p-value ≤0.05 was considered statistically significant. The Wilcoxon rank-sum test was used to assess the cost differences between patients initiating apremilast and a biologic.
Results
Patients
Between 1 January 2015 and 31 December 2016, a total of 88,025 patients in the IBM database initiated treatment with apremilast or a biologic agent. After the inclusion and exclusion criteria and propensity score matching were applied, 471 biologic-naive patients were included in the apremilast group and 890 biologic-naive patients were included in the biologic group; the biologic group was further divided into patients treated with a TNFi (n = 804) or an ILi (n = 86; Figure 1). With the exception of gender, the baseline characteristics were well balanced between the cohorts after propensity score matching. The mean age was similar across the three cohorts (apremilast: 50.2 years; TNFi: 50.0 years; and ILi: 50.4 years). The duration of available pre-index data was also similar across the three cohorts (apremilast: 1360 days; TNFi: 1345 days; and ILi: 1325 days). The mean Charlson Comorbidity Index scores were also similar for the three treatment cohorts (apremilast: 0.58; TNFi: 0.55; and ILi: 0.56). After propensity score matching, the ILi cohort had a lower proportion of females (41.9%; p = 0.02) compared with the apremilast cohort (55.0%) and the TNFi cohort (54.6%; Table 1). Most patients treated with a TNFi had an index treatment with either adalimumab (64.4%) or etanercept (29.0%), whereas nearly all patients treated with an ILi had an index treatment of either ustekinumab (77.9%) or secukinumab (20.9%).
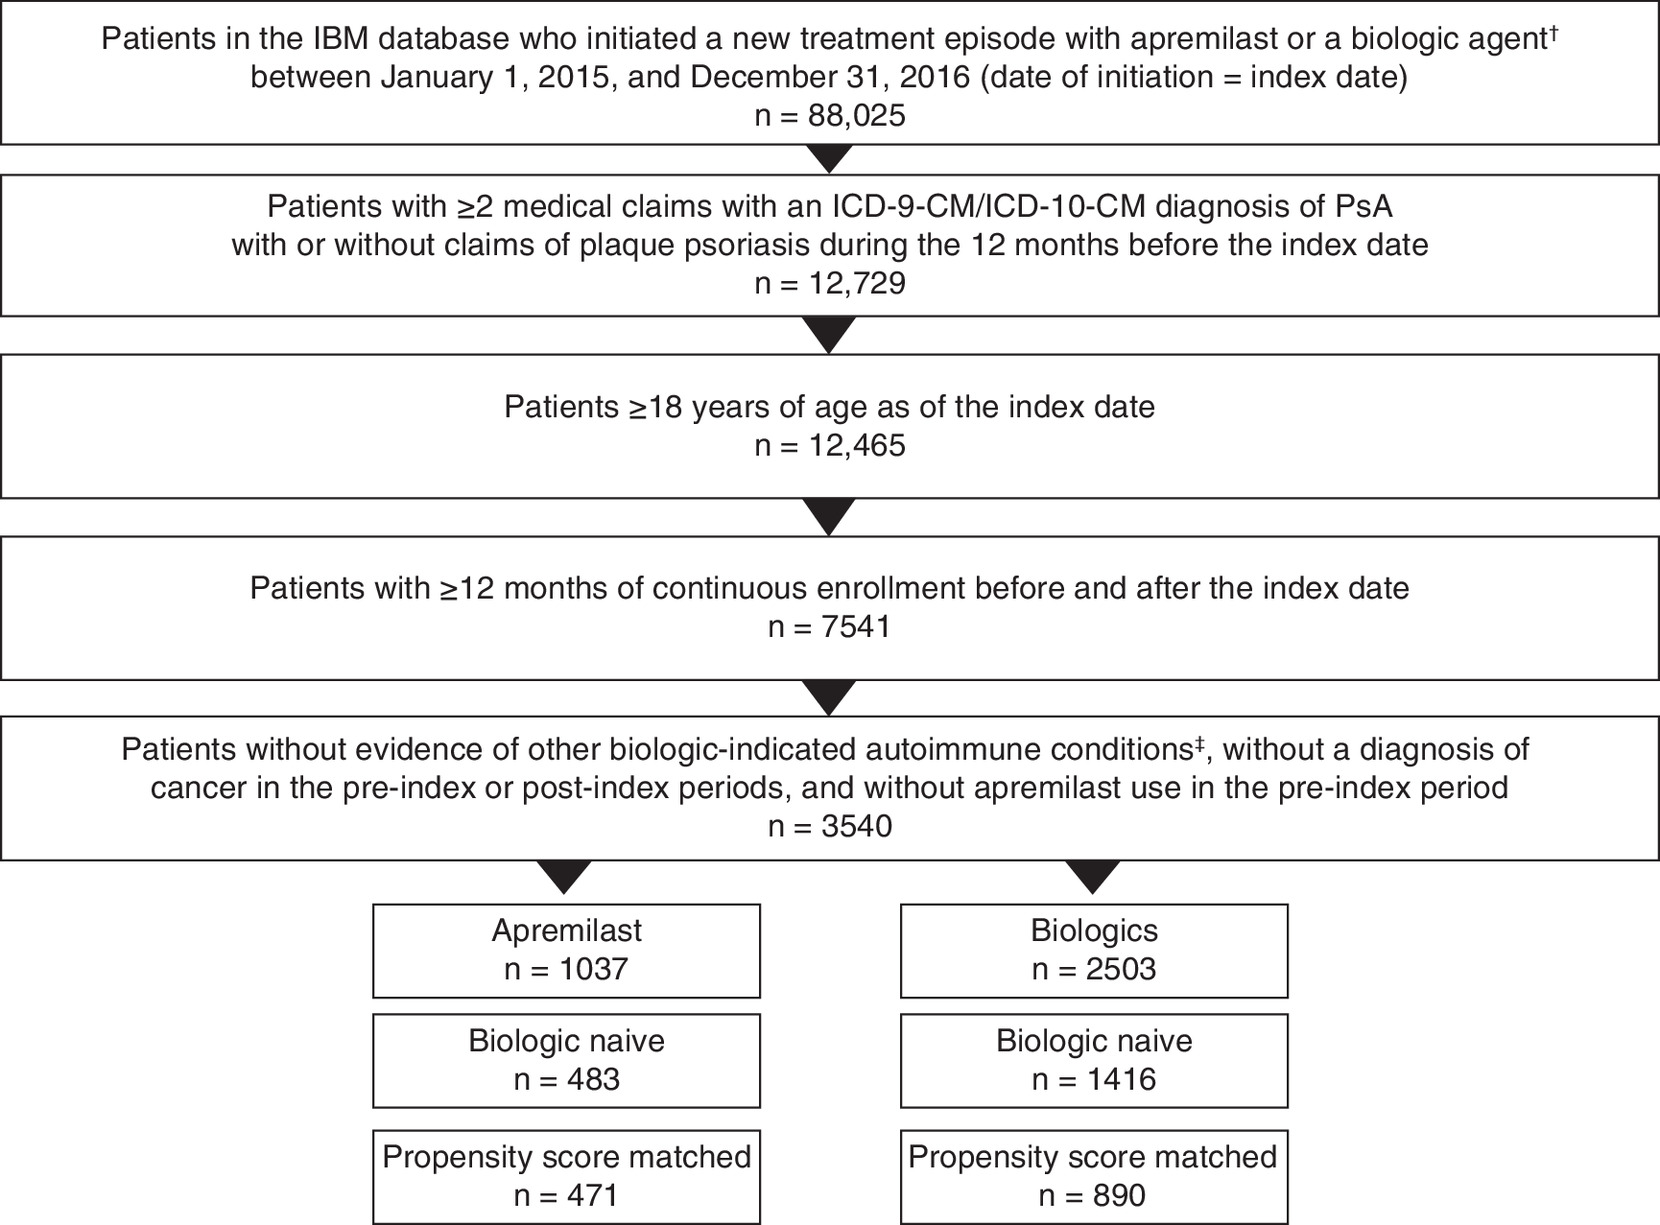
Figure 1. Patient disposition.
†TNFi included adalimumab, certolizumab, etanercept, golimumab, and infliximab, and ILi included ixekizumab, secukinumab and ustekinumab.
‡Ulcerative colitis, Crohn’s disease, rheumatoid arthritis and other inflammatory polyarthropathies (including Felty’s syndrome), ankylosing spondylitis and juvenile idiopathic arthritis.
ICD-9-CM: International Classification of Diseases, Ninth Revision, Clinical Modification; ICD-10-CM: International Classification of Diseases, Tenth Revision, Clinical Modification; ILi: Interleukin inhibitor; PsA: Psoriatic arthritis; TNFi: Tumor necrosis factor inhibitor.
| Demographics and characteristics | Apremilast n = 471 | TNFi† | ILi‡ | ||
|---|---|---|---|---|---|
| n = 804 | p-value | n = 86 | p-value | ||
| Age, mean (SD), years | 50.2 (11.7) | 50.0 (10.6) | 0.7433 | 50.4 (10.3) | 0.9107 |
| Female, n (%) | 259 (55.0) | 439 (54.6) | 0.8933 | 36 (41.9) | 0.0249 |
| Psoriasis, n (%) | 423 (89.8) | 705 (87.7) | 0.2521 | 82 (95.3) | 0.1044 |
| Charlson Comorbidity Index score, mean (SD) | 0.58 (0.95) | 0.55 (0.97) | 0.3826 | 0.56 (0.89) | 0.9584 |
| Baseline healthcare cost per month, mean (SD) | US$1065 (US$1828) | US$1092 (US$1635) | 0.2506 | US$1201 (US$1772) | 0.9402 |
| Number of prior systemic agents, n (%) | |||||
| – 0 | 276 (58.6) | 443 (55.1) | 0.6718 | 68 (79.1) | 0.0046 |
| – 1 | 155 (32.9) | 290 (36.1) | 14 (16.3) | ||
| – 2 | 33 (7.0) | 58 (7.2) | 3 (3.5) | ||
| – 3+ | 7 (1.5) | 13 (1.6) | 1 (1.2) | ||
| Primary payer, n (%) | |||||
| – Commercial | 441 (93.6) | 765 (95.1) | 0.2474 | 80 (93.0) | 0.8332 |
| – Medicare | 30 (6.4) | 39 (4.9) | 6 (7.0) | ||
| Index year, n (%) | |||||
| – 2015 | 229 (48.6) | 402 (50.0) | 0.6343 | 40 (46.5) | 0.7190 |
| – 2016 | 242 (51.4) | 402 (50.0) | 46 (53.5) | ||
| Index medication, n (%) | |||||
| – Apremilast | 471 (100.0) | – | – | ||
| – Adalimumab | – | 518 (64.4) | – | ||
| – Certolizumab | – | 12 (1.5) | – | ||
| – Etanercept | – | 233 (29.0) | – | ||
| – Golimumab | – | 6 (0.8) | – | ||
| – Infliximab | – | 35 (4.4) | – | ||
| – Ixekizumab | – | – | 1 (1.2) | ||
| – Secukinumab | – | – | 18 (20.9) | ||
| – Ustekinumab | – | – | 67 (77.9) | ||
| Psoriasis-and PsA-related therapies, n (%) | |||||
| – Systemic agents | 195 (41.4) | 361 (44.9) | 0.2240 | 18 (20.9) | 0.0003 |
| – NSAID/COX-2 | 322 (68.4) | 561 (69.8) | 0.5982 | 50 (58.1) | 0.0641 |
| – IV corticosteroids | 263 (55.8) | 433 (53.9) | 0.4925 | 38 (44.2) | 0.0462 |
| – Oral corticosteroids | 264 (56.1) | 481 (59.8) | 0.1868 | 43 (50.0) | 0.2995 |
| – Topical corticosteroids | 393 (83.4) | 645 (80.2) | 0.1543 | 73 (84.9) | 0.7390 |
| – Phototherapy | 54 (11.5) | 65 (8.1) | 0.0452 | 17 (19.8) | 0.0338 |
†
TNFi included adalimumab, certolizumab, etanercept, golimumab and infliximab.
‡
ILi included ixekizumab, secukinumab and ustekinumab.
ILi: Interleukin inhibitor; IV: Intravenous; NSAID: Nonsteroidal anti-inflammatory drug; PsA: Psoriatic arthritis; SD: Standard deviation.
Switch rates
Biologic-naive patients receiving apremilast had significantly lower switch rates at 12 months compared with biologic-naive patients receiving a TNFi (15.5% vs 26.6%; p < 0.0001); no significant differences were observed in the 12-month switch rates between the apremilast and ILi cohorts (15.5% vs 14.0%; p = 0.71; Figure 2). For patients who switched by month 12, those initially treated with apremilast most often switched to adalimumab (49.1%) or ustekinumab (19.3%). Patients treated with a TNFi most often switched to apremilast (23.8%), followed by etanercept (19.3%). Patients treated with an ILi most often switched to adalimumab (30.0%), followed by apremilast (20.0%; Supplementary Table 1). No significant differences were observed between treatment cohorts in days to switch at 12 months.

Figure 2. Switch rates over 24 months.
*p ≤ 0.01 vs apremilast.
ILi: Interleukin inhibitor; TNFi: Tumor necrosis factor inhibitor.
The mean (standard deviation) 12-month adherence rates while on the index treatment for apremilast initiators was 0.81 (0.20), compared with 0.85 (0.16) for TNFi initiators (p = 0.0176) and 0.76 (0.20) for ILi initiators (p = 0.0083) as measured by PDC. Using the MPR, the mean (standard deviation) 12-month adherence rates while on the index treatment for apremilast initiators was 0.84 (0.20), compared with 0.88 (0.16) for TNFi initiators (p = 0.0008) and 0.78 (0.20) for ILi initiators (p = 0.0074).
Switch rates were also calculated for patients with data at 24 months postindex; rates increased over time in all treatment groups and were significantly higher at all time points for patients receiving TNFi compared with patients receiving apremilast (Figure 2).
Healthcare costs
Total 12-month healthcare costs were significantly lower for biologic-naive patients initiating apremilast treatment (US$39,854) compared with a TNFi and an ILi (US$57,243 and US$65,867, respectively; both p < 0.001 vs apremilast; Table 2). The majority of total healthcare costs across all treatment groups were due to outpatient pharmacy costs, although the pharmacy costs were significantly lower for patients treated with apremilast (US$29,130) compared with TNFi and ILi (US$48,540 and US$57,038, respectively; both p < 0.0001 vs apremilast). No differences were observed in outpatient costs across the three treatment groups. Among those who did switch treatment by month 12, total healthcare costs throughout the postindex period were higher for patients receiving apremilast or a TNFi as their index treatment compared with the overall cohort (switchers plus nonswitchers) but were lower for those initiating an ILi (Figure 3). Mean total healthcare costs at 12 months among patients who switched from their index treatment were lowest for patients initiating apremilast (US$48,160) compared with a TNFi (US$65,096; p < 0.0001) or an ILi (US$60,825; p = 0.0202). Patients who did not switch at 12 months had lower total healthcare costs with apremilast (US$38,330) compared with a TNFi and an ILi (US$54,395 and US$66,685, respectively; both p < 0.0001 vs apremilast; Figure 3).
| Costs | Apremilast n = 471 | TNFi n = 804 | ILi n = 86 |
|---|---|---|---|
| Total healthcare costs, mean | US$39,854 | US$57,243† | US$65,867† |
| – Inpatient | US$4114 | US$2018 | US$2662 |
| – Outpatient | US$6610 | US$6684 | US$6167 |
| – Outpatient pharmacy | US$29,130 | US$48,540† | US$57,038† |
| PPPM healthcare costs, mean | US$3319 | US$4768† | US$5486† |
| – Inpatient | US$343 | US$168 | US$222 |
| – Outpatient | US$551 | US$557 | US$514 |
| – Outpatient pharmacy | US$2426 | US$4043† | US$4751† |
†
p < 0.0001 vs apremilast.
ILi: Interleukin inhibitor; PPPM: Per patient per month; TNFi: Tumor necrosis factor inhibitor.
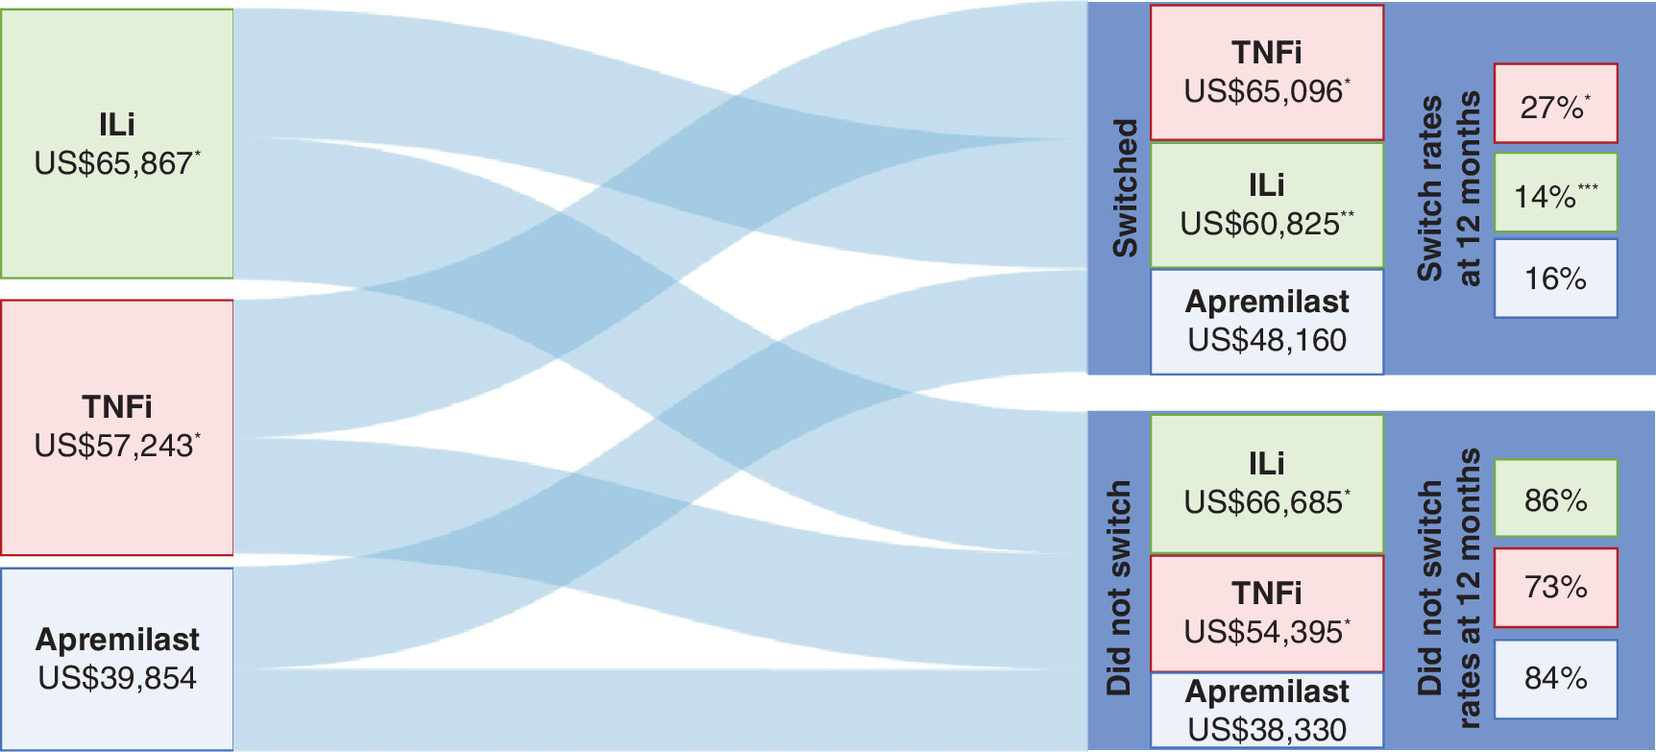
Figure 3. Mean total healthcare costs over 12-month follow-up.
*p < 0.01 vs apremilast.
**p = 0.02 vs apremilast.
***p = 0.71 vs apremilast.
ILi: Interleukin inhibitor; TNFi: Tumor necrosis factor inhibitor.
PPPM healthcare costs were significantly lower over the 12-month follow-up period for patients initiating apremilast (US$3319) versus a TNFi and an ILi (US$4768 and US$5486, respectively; both p < 0.0001 vs apremilast), and outpatient pharmacy costs were the largest driver of these differences. Patients who did not switch index treatments had significantly lower PPPM healthcare costs at 12 months when they were treated with apremilast (US$3192) compared with a TNFi and an ILi (US$4530 and US$5554, respectively; both p < 0.0001 vs apremilast). Mean PPPM healthcare costs in patients who switched treatments at 12 months were also lower with apremilast (US$4011) compared with a TNFi (US$5422; p < 0.0001) and an ILi (US$5066; p = 0.0202). Before switching treatments, patients treated with apremilast had significantly lower PPPM healthcare costs (US$2562) compared with patients treated with a TNFi and an ILi (US$4999 and US$5272, respectively; both p ≤ 0.0001 vs apremilast). However, after switching, no significant differences were observed between treatment groups in mean total PPPM healthcare costs with apremilast (US$7140) compared with a TNFi (US$9183; p = 0.8497) and an ILi (US$5782; p = 0.5873). Among patients who switched treatments, PPPM costs increased after switching for patients with apremilast or a TNFi as their index treatment, while PPPM costs were relatively unchanged for patients with an ILi as their index treatment (Supplementary Figure 1).
Discussion
In this study, we examined real-world treatment switch rates and associated healthcare costs for biologic-naive patients with PsA initiating apremilast, TNFi or ILi. Biologic-naive patients who initiated treatment with apremilast had significantly lower rates of switching compared with patients who initiated a TNFi and similar rates compared with patients who initiated an ILi. Biologic-naive patients who initiated treatment with apremilast also had lower PPPM healthcare costs and total healthcare costs compared with patients who initiated a TNFi or an ILi, primarily due to lower pharmacy costs with apremilast.
In the absence of direct head-to-head clinical trial data, analyzing switch rates using claims data may provide a proxy by comparing the real-world response rates, effectiveness and tolerability of different treatment options for PsA. Previous studies examining discontinuations have limited interpretability since patients may discontinue due to symptom resolution and discontinuations do not account for treatment restarts; treatment switches may not encounter these limitations. The results of our study demonstrate significant differences in switch rates between patients initiating treatment with apremilast and TNFi, suggesting a potential difference in treatments with respect to patient satisfaction, access/formulary status, response and/or tolerability. Our findings are in contrast to a previous analysis using a different US claims database, in which no significant differences were observed in the proportion of patients who switched treatment at 12 months [14]. In the study by Wu et al., switch rates for biologic-naive patients initiating apremilast or a biologic were similar (29.6% vs 26.5%; p = 0.63) [14]. A key difference between our study and the one by Wu et al. is that we categorized patients treated with a biologic into two treatment groups (TNFi and ILi), thereby differentiating treatments by their mechanism of action. This may explain the different results of Wu et al., since combining TNFi and ILi into one biologic treatment group may mask differences between these groups. Another explanation for the different results could be the data source we used. The IBM MarketScan Commercial and Medicare Supplemental database is a payer heterogenous data source that may provide results less influenced by the medical policies of one large Pharmacy Benefit Manager such as may be the case with the Optum Clinformatics™ database (used by Wu et al. [14]), which obtains its data from the UnitedHealth Group.
Total and PPPM healthcare costs over 12 months were lower for biologic-naive patients who initiated treatment with apremilast for PsA in a real-world setting compared with biologic-naive patients who initiated treatment with a TNFi or an ILi. Our findings are consistent with real-world results from Wu et al., who found that the total and average PPPM healthcare costs for patients receiving apremilast were significantly lower than for patients receiving a biologic up to 12 months after the index date [14]. Both our study and the one by Wu et al. demonstrated that patients receiving apremilast had significantly lower pharmacy costs, the key driver of the overall cost differences at 12 months between apremilast and the biologic treatment groups [14]. Our findings are also consistent with a study of real-world costs among biologic-naive PsA patients conducted by Feldman et al., which showed that apremilast initiators had lower healthcare costs compared with patients treated with biologics, primarily due to lower outpatient pharmacy costs [15]. The higher pharmacy costs observed with biologics in our study may also be due to off-label dosing; in a study of anti-TNF therapy for PsA by Schwartzman et al., off-label dosing was associated with significantly higher healthcare costs [22].
We are unclear as to why there was a lower rate of switching in the ILi group compared with the TNFi group; however, it is important to note that the ILi group was much smaller than the TNFi group in our study. For this reason, we cannot make any broad statements comparing the two groups. In addition, we did not statistically compare TNFi versus ILi; however, we did compare them both with apremilast and there was no statistical difference observed for ILi versus apremilast. We did observe more comorbid psoriasis in the ILi group versus the TNFi group (95.4% vs 87.7%; p = 0.0348) but not versus the apremilast group (95.4% vs 89.8%; p = 0.1044), but we are uncertain of the implications of this with regard to treatment switching. We believe this will be an interesting and important topic for future research considering that newer ILi agents have been approved for PsA.
Limitations
Several important limitations need to be noted, including those inherent to retrospective claims data analyses such as data coding limitations, data entry error and lack of clinical detail. Although our study used a large claims data source in the USA, findings are only generalizable to individuals with commercial or private Medicare supplemental health coverage. Because the study relied on administrative claims data, clinical details that may impact treatment patterns such as disease activity/severity, location of psoriatic disease or specific PsA subtype were not available for analysis, and these unknown differences between the treatment groups may have influenced the results observed in this study. This is not a limitation unique to MarketScan; information regarding disease activity/severity is unlikely to exist in any claims database. We attempted to mitigate the lack of data on disease activity/severity by matching the cohorts based on proxies for potential disease activity/severity, including the Charlson Comorbidity Index (i.e., studies have shown more comorbidity burden is associated with higher disease activity and worse disability/function [23,24]), pre-index cost, prior treatment experience (nonsteroidal anti-inflammatory drugs, steroids, phototherapy) and presence of psoriasis. Residual confounding after the propensity score matching cannot be ruled out; we could only match apremilast-treated patients with biologic-treated patients and could not match apremilast-treated patients with TNFi-treated patients and with ILi-treated patients separately because the sample size for the latter group was too small. In addition, treatment switching and adherence measures based on claims for filled prescriptions may not accurately reflect whether patients actually took the medication as prescribed. Since this database compiles claims from various different health plans, a limitation for using switch rates as a proxy for treatment success is the possibility that heterogeneity among medical policies and cost sharing may influence switch rates. These possible reasons for switches are independent of treatment effectiveness and patient satisfaction and may distort data interpretation. However, reasons for treatment switches could not be determined in this claims analysis. Finally, we could not identify prescriber specialty, unfortunately, because prescription claims in MarketScan do not provide such information.
Conclusion
In this retrospective analysis of biologic-naive patients with PsA, we examined rates of switching and costs for patients initiating treatment with apremilast compared with those initiating a TNFi or an ILi. Our study showed that the apremilast treatment group had significantly lower switch rates over a 12-month follow-up period than the TNFi group, whereas rates were similar to patients initiating an ILi. Patients initiating apremilast had significantly lower total healthcare and PPPM costs in the first year compared with patients initiating biologics, and total healthcare costs were primarily driven by pharmacy costs for all treatment groups. The current analysis builds on previous real-world studies that have evaluated treatment patterns for biologic therapies as a whole and demonstrates the importance of considering a treatment’s mechanism of action in real-world studies of treatment adherence, patterns and costs. Data from studies such as ours provide payers with real-world evidence that helps inform formulary decision-making in order to optimize PsA therapy while managing healthcare costs and providing robust treatment options for patients [15]. Future analyses should continue to evaluate treatment switching, reasons for switches and associated costs of PsA as new treatments for PsA are approved.
•
Treatment switching in general is common among patients with psoriatic arthritis.
•
Comparative information is relatively limited regarding specific treatment regimens in terms of switching and its impact on total healthcare costs.
•
In patients with psoriatic arthritis, apremilast initiators had lower switch rates compared with tumor necrosis factor inhibitor initiators and similar switch rates compared with interleukin inhibitor initiators.
•
Apremilast initiators also had significantly lower total healthcare costs compared with tumor necrosis factor inhibitor and interleukin inhibitor initiators.
•
The results of this analysis were largely driven by lower outpatient pharmacy costs for apremilast initiators and by the fact that patients who switched treatments had higher healthcare costs versus nonswitchers.
Author contributions
All authors were involved in the design and conduction of the study in addition to drafting the report or revising it critically for intellectual content. All authors had access to the data and interpreted the data.
Financial & competing interests of disclosure
This study was funded by Celgene. Amgen acquired the worldwide rights to Otezla® (apremilast) on 21 November 2019. DL Kaplan has served as a consultant for Celgene and as a speaker for AbbVie, Celgene, Dermira and Pfizer. BL Ung is an employee of Bristol-Myers Squibb and was an employee of Celgene at the time of study conduct. C Pelletier is an employee of Bristol-Myers Squibb and was an employee of Celgene at the time of study conduct. C Udeze is an employee of Vertex and was an employee of Celgene at the time of study conduct. I Khilfeh is an employee of Amgen Inc. and was an employee of Celgene at the time of study conduct. M Tian is an employee of Bristol-Myers Squibb and was an employee of Celgene at the time of study conduct. The authors have no other relevant affiliations or financial involvement with any organization or entity with a financial interest in or financial conflict with the subject matter or materials discussed in the manuscript apart from those disclosed.
Medical writing support was funded by Celgene and Amgen Inc. and provided by L Radican, PhD, MPH, of Peloton Advantage, LLC, an OPEN Health company.
Ethical conduct of research
The authors state that institutional review board approval to conduct this study was not required because the analysis uses only de-identified patient records and does not involve the collection, use or transmittal of individually identifiable data.
Open access
This work is licensed under the Attribution-NonCommercial-NoDerivatives 4.0 Unported License. To view a copy of this license, visit http://creativecommons.org/licenses/by-nc-nd/4.0/
Supplementary Material
References
Papers of special note have been highlighted as: • of interest; •• of considerable interest
1.
Ogdie A, Weiss P. The epidemiology of psoriatic arthritis. Rheum. Dis. Clin. North Am. 41(4), 545–568 (2015).
2.
Gladman DD, Antoni C, Mease P et al. Psoriatic arthritis: epidemiology, clinical features, course, and outcome. Ann. Rheum. Dis. 64(Suppl. 2), ii14–ii17 (2005).
3.
Alinaghi F, Calov M, Kristensen LE et al. Prevalence of psoriatic arthritis in patients with psoriasis: a systematic review and meta-analysis of observational and clinical studies. J. Am. Acad. Dermatol. 80(1), 251–265.e219 (2019).
4.
Kaine J, Song X, Kim G et al. Higher incidence rates of comorbidities in patients with psoriatic arthritis compared with the general population using U.S. administrative claims data. J. Manag. Care Spec. Pharm. 25(1), 122–132 (2019).
• This large retrospective cohort study using US claims data found that patients with psoriatic arthritis (PsA) had a high comorbidity burden, including cardiovascular disease, autoimmune disorders and other PsA-related comorbidities.
5.
Husted JA, Thavaneswaran A, Chandran V et al. Incremental effects of comorbidity on quality of life in patients with psoriatic arthritis. J. Rheumatol. 40(8), 1349–1356 (2013).
6.
Singh JA, Guyatt G, Ogdie A et al. 2018 American College of Rheumatology/National Psoriasis Foundation guideline for the treatment of psoriatic arthritis. Arthritis Rheumatol. 71(1), 5–32 (2019).
7.
Gossec L, Smolen JS, Ramiro S et al. European League Against Rheumatism (EULAR) recommendations for the management of psoriatic arthritis with pharmacological therapies: 2015 update. Ann. Rheum. Dis. 75(3), 499–510 (2016).
8.
Alten R, Conaghan PG, Strand V et al. Unmet needs in psoriatic arthritis patients receiving immunomodulatory therapy: results from a large multinational real-world study. Clin. Rheumatol. 38(6), 1615–1626 (2019).
• This large multicountry survey study found that poor treatment response in patients with PsA is associated with decreased health-related quality of life and work productivity and when primary treatment failure occurs, timely switching is important.
9.
Otezla (apremilast) [package insert]. Amgen Inc., CA, USA (2020). www.pi.amgen.com/~/media/amgen/repositorysites/pi-amgen-com/otezla/otezla_pi_english.ashx
10.
Kavanaugh A, Mease PJ, Gomez-Reino JJ et al. Treatment of psoriatic arthritis in a Phase III randomized, placebo-controlled trial with apremilast, an oral phosphodiesterase 4 inhibitor. Ann. Rheum. Dis. 73(6), 1020–1026 (2014).
11.
Kavanaugh A, Mease PJ, Gomez-Reino JJ et al. Longterm (52-week) results of a Phase III randomized, controlled trial of apremilast in patients with psoriatic arthritis. J. Rheumatol. 42(3), 479–488 (2015).
12.
Edwards CJ, Blanco FJ, Crowley J et al. Apremilast, an oral phosphodiesterase 4 inhibitor, in patients with psoriatic arthritis and current skin involvement: a Phase III, randomised, controlled trial (PALACE 3). Ann. Rheum. Dis. 75(6), 1065–1073 (2016).
13.
Chastek B, White J, Van Voorhis D et al. A retrospective cohort study comparing utilization and costs of biologic therapies and JAK inhibitor therapy across four common inflammatory indications in adult US managed care patients. Adv. Ther. 33(4), 626–642 (2016).
14.
Wu JJ, Pelletier C, Ung B et al. Treatment patterns and healthcare costs among biologic-naive patients initiating apremilast or biologics for the treatment of psoriatic arthritis: results from a US claims analysis. Curr. Med. Res. Opin. 1–8 (2019).
•• In this large retrospective cohort study using US claims data, patients initiating treatment with apremilast had significantly lower healthcare costs than patients initiating treatment with a biologic, even when they switched to a biologic.
15.
Feldman SR, Pelletier CL, Wilson KL et al. Treatment patterns and costs among biologic-naive patients initiating apremilast or biologics for psoriatic arthritis. J. Comp. Eff. Res. 8(9), 699–709 (2019).
•• This large US claims database study found that patients with PsA initiating treatment with apremilast had adherence similar to patients initiating treatment with a biologic, but lower total healthcare costs.
16.
Mease PJ, Karki C, Liu M et al. Discontinuation and switching patterns of tumour necrosis factor inhibitors (TNFis) in TNFi-naive and TNFi-experienced patients with psoriatic arthritis: an observational study from the US-based Corrona registry. RMD Open 5(1), e000880 (2019).
•• The large US registry study found that TNF inhibitor-experienced patients had a shorter time to discontinuation and were more likely to discontinue or switch treatments compared with TNF inhibitor-naive patients.
17.
Lee MP, Lii J, Jin Y et al. Patterns of systemic treatment for psoriatic arthritis in the US: 2004–2015. Arthritis Care Res. (Hoboken) 70(5), 791–796 (2018).
18.
Lebwohl MG, Bachelez H, Barker J et al. Patient perspectives in the management of psoriasis: results from the population-based Multinational Assessment of Psoriasis and Psoriatic Arthritis Survey. J. Am. Acad. Dermatol. 70(5), 871–881 (2014).
19.
Palmer JB, Li Y, Herrera V et al. Treatment patterns and costs for anti-TNFalpha biologic therapy in patients with psoriatic arthritis. BMC Musculoskelet. Disord. 17, 261 (2016).
20.
Kaplan DL, Ung BL, Pelletier C et al. Switch rates and total cost of care associated with apremilast and biologic therapies in biologic-naive patients with plaque psoriasis. ClinicoEcon. Outcomes Res. 12369–12377 (2020).
•• This large retrospective cohort study using US claims data found that biologic-naive psoriasis patients initiating apremilast had lower switching rates compared with patients initiating TNF inhibitors, similar switching rates as patients initiating IL inhibitors, and lower costs compared with both treatments, primarily due to lower pharmacy costs.
21.
Burnier M. Is there a threshold for medication adherence? Lessons learnt from electronic monitoring of drug adherence. Front. Pharmacol. 9, 1540 (2018).
22.
Schwartzman S, Li Y, Zhou H et al. Economic impact of biologic utilization patterns in patients with psoriatic arthritis. Clin. Rheumatol. 36(7), 1579–1588 (2017).
23.
Edson-Heredia E, Zhu B, Lefevre C et al. Prevalence and incidence rates of cardiovascular, autoimmune, and other diseases in patients with psoriatic or psoriatic arthritis: a retrospective study using Clinical Practice Research Datalink. J. Eur. Acad. Dermatol. Venereol. 29(5), 955–963 (2015).
24.
Fernández-Carballido C, Martín-Martínez MA, García-Gómez C et al. Impact of comorbidity on physical function in patients with ankylosing spondylitis and psoriatic arthritis attending rheumatology clinics: results from a cross-sectional study. Arthritis Care Res. (Hoboken) 72(6), 822–828 (2020).
Information & Authors
Information
Published In
Pages: 989 - 998
PubMed: 34187202
Copyright
© 2021 David L Kaplan and co-authors. This work is licensed under the Attribution-NonCommercial-NoDerivatives 4.0 Unported License
History
Received: 16 December 2020
Accepted: 28 May 2021
Published online: 30 June 2021
Keywords:
Topics
Authors
Funding Information
Metrics & Citations
Metrics
Article Usage
Article usage data only available from February 2023. Historical article usage data, showing the number of article downloads, is available upon request.
Citations
How to Cite
Switch rates and total cost associated with apremilast and biologics in biologic-naive patients with psoriatic arthritis. (2021) Journal of Comparative Effectiveness Research. DOI: 10.2217/cer-2020-0285
Export citation
Select the citation format you wish to export for this article or chapter.