Validity of comorbidity adjustment scores in estimating in-hospital mortality in individual subgroups of race/ethnicity
Publication: Journal of Comparative Effectiveness Research
Abstract
Aim: To examine the validity of race/ethnicity-specific comorbidity adjustment scores in estimating in-hospital mortality. Materials & methods: Using 2007–2014 data from the State Inpatient Databases (SID), we compared the performance of derived race/ethnicity-specific composite scores to the existing scores and binary Elixhauser comorbidity measures at estimating in-hospital mortality. Results: In the overall validation sample (N = 9,564,277), our index (c = 0.80; 95% CI: 0.79–0.80) discriminated better than the van Walraven score (c = 0.79; 95% CI: 0.79–0.79), SID 29 (c = 0.78; 95% CI: 0.78–0.79) and SID 30 (c = 0.78; 95% CI: 0.78–0.78), but was not superior to the binary indicators (c = 0.80; 95% CI: 0.80–0.80). Similar findings were observed in individual populations of White and Black patients. All models showed weak calibration. Conclusion: Race/ethnicity-specific indexes discriminated slightly better than existing composite measures at modeling in-hospital mortality in individual subgroups of race/ethnicity.
Weighted composite comorbidity indexes are commonly used to adjust for patient comorbidities and consequently reduce bias in large-scale outcomes research using administrative healthcare databases. Two regularly used comorbidity measures are the van Walraven (VW) score [1], a weighted composite of the binary Elixhauser comorbidities [1], and the Charlson co-morbidity index [2], a weighted composite score consisting of 17 comorbidity measures. Previous studies have found that the Elixhauser comorbidity adjustment provides superior predictions of various health outcomes in comparison with the Charlson model [3–7].
More recently, Thompson et al. [8] externally validated the VW score in predicting in-hospital mortality using 2009 Maryland data from the State Inpatient Databases (SID). The authors found that the summary scores which they created using 29 and 30 Elixhauser comorbidity measures (named the SID 29 and SID 30, respectively) performed slightly better than the existing VW score but were not superior to the binary Elixhauser indicators at predicting in-hospital mortality.
In spite of their widespread use, composite comorbidity measures were created for an overall population, without explicitly accounting for variations in the prevalence of comorbidities within individual demographic categories such as race and ethnicity. We believe that is imperative to account for this heterogeneity in order to accurately characterize risk within subgroups.
In this study, we validated existing comorbidity scores for the outcome of in-hospital mortality and estimated our own comorbidity scores in individual racial/ethnic subgroups using 2007–2014 SID data from five geographically diverse states. We hypothesized that there are differences by race/ethnicity in the validity of comorbidity adjustment scores, and that race/ethnicity-specific comorbidity indices will perform better than overall composite measures when analyzed in racial/ethnic subpopulations.
Materials & methods
Using data from the SID, Healthcare Cost and Utilization Project, Agency for Healthcare Quality and Research for the states of CA (2007–2011), FL, NY, MD and KY (2007–2014). We derived and tested composite scores of the Elixhauser comorbidities by individual categories of race/ethnicity: White, Black, Hispanic, other (which includes: Asian or Pacific Islander, Native American or other). The SID is a census of more than 95% of all hospital discharges in the USA and includes a range of patient- and hospital-level information, including patient race/ethnicity and data on diagnoses and procedures, with present-on-admission indicators for each diagnosis to distinguish comorbidities from in-hospital complications [9]. Each record in the SID represents an individual hospital admission [9].
For comparability to van Walraven et al.’s methods, we excluded from our analysis sample population same-day surgeries and obstetric, pediatric and interhospital transfer admissions [1]. We randomly divided our sample population into derivation (66.7%) and validation (33.3%) samples. Using the derivation sample, we re-derived Elixhauser comorbidity summary measures by categories of race/ethnicity using the methods similar to those from van Walraven et al. [1] and Thompson et al. [8]. For each population, we created logistic regression models predicting in-hospital mortality, including as covariates only the 29 Elixhauser comorbidities. Through backwards stepwise elimination, we retained variables in subsequent logistic regression models with a p-value of <0.05, until we arrived at a model containing only co-efficients that met this threshold. For modeling the outcome in the validation dataset, the comorbidities that were not retained received a comorbidity weight of 0; retained covariates were assigned weights by taking the covariate’s co-efficient divided by the absolute value of the smallest co-efficient in the final model. To create a summary comorbidity measure, each co-efficient was multiplied by its weight.
In models stratified by category of race/ethnicity, we modeled our category-specific comorbidity measures on the outcome of in-hospital mortality in our validation sample. We also modeled the data with binary indicators of all 29 comorbidities, the VW score and Thompson’s SID 29 and SID 30 (without cardiac arrhythmia) for each category. Model calibration was assessed graphically and with a likelihood ratio test, and discrimination was assessed with the concordance (C) statistic with a 95% CI. Analyses were performed in Stata 16 SE (TX, USA). Discrimination and calibration were assessed using the roccomp and calibrationbelt packages, respectively [10]. All study-related activities were approved by the Institutional Review Board at Weill Cornell Medical College.
Results
Prevalence of individual comorbidities and their respective weights used in analyses are found in Table 1. In our overall validation sample (N = 9,564,277), our index (c = 0.80; 95% CI: 0.79–0.80) discriminated better than the VW score (c = 0.79; 95% CI: 0.79–0.79), SID 29 (c = 0.78; 95% CI: 0.78–0.79) and SID 30 (c = 0.78; 95% CI: 0.78–0.78), but was not superior to the binary indicators (c = 0.80; 95% CI: 0.80–0.80).
| Comorbidities | Prevalence (%) | Weights applied to validation sample | ||||||||||||||
|---|---|---|---|---|---|---|---|---|---|---|---|---|---|---|---|---|
| Elixhauser | VW | MD 2009 | Our overall derivation sample (n = 18,570,106) | White (n = 11,394,409) | Black (n = 3,032,791) | Hispanic (n = 2,604,739) | Other race/ethnicity (n = 1,254,751) | VW | SID 29 | SID 30 without cardiac arrhythmia | Overall | White | Black | Hispanic | Other race | |
| AIDS/HIV | 0.4 | 0.5 | 0.7 | 1.0 | 0.3 | 2.7 | 1.0 | 0.8 | 0 | 0 | 0 | 8 | 20 | 7 | 15 | 7 |
| Alcohol abuse | 2.9 | 3.1 | 6.7 | 7.4 | 7.0 | 9.1 | 7.5 | 6.2 | 0 | -2 | 0 | -6 | -18 | -5 | -4 | -8 |
| Blood loss anemia | 1.6 | 1.1 | 1.6 | 1.3 | 1.1 | 2.0 | 1.5 | 1.4 | -2 | -2 | -3 | -5 | -14 | -4 | -5 | -3 |
| Cardiac arrhythmia | 6.8 | 11.2 | 13.7 | NA | NA | NA | NA | NA | NA | NA | NA | NA | NA | NA | NA | NA |
| Chronic pulmonary disease | 9.9 | 8.8 | 20.7 | 22.0 | 23.9 | 21.5 | 17.5 | 16.6 | 3 | 3 | 3 | 4 | 14 | 0 | 6 | 3 |
| Coagulopathy | 1.5 | 4.2 | 5.2 | 3.9 | 4.0 | 3.5 | 4.1 | 4.1 | 3 | 9 | 12 | 23 | 59 | 19 | 31 | 18 |
| Congestive heart failure | 4.0 | 9.6 | 9.3 | 12.3 | 12.5 | 13.9 | 10.3 | 11.0 | 7 | 9 | 9 | 25 | 77 | 12 | 32 | 17 |
| Deficiency anemia | 7.3 | 1.8 | 22.7 | 16.3 | 14.8 | 21.8 | 16.9 | 16.3 | -2 | 0 | 0 | -1 | -2 | -2 | -1 | -1 |
| Depression | 1.5 | 5.1 | 13.4 | 10.3 | 12.3 | 6.8 | 7.7 | 6.8 | -3 | -4 | -5 | -8 | -25 | -6 | -11 | -6 |
| Diabetes, complicated | 7.8 | 9.5 | 20.8 | 5.4 | 4.5 | 7.4 | 6.8 | 5.8 | 0 | -1 | 0 | -7 | -21 | -3 | -10 | -6 |
| Diabetes, uncomplicated | 4.1 | 6.1 | 5.5 | 20.4 | 18.6 | 23.6 | 23.8 | 22.9 | 0 | 0 | 1 | 0 | -1 | 2 | 1 | 0 |
| Drug abuse | 1.5 | 2.1 | 7.4 | 7.1 | 6.1 | 12.0 | 6.5 | 5.4 | -7 | -8 | -11 | -19 | -59 | -11 | -16 | -12 |
| Fluid/electrolyte disorders | 13.3 | 12.4 | 27.2 | 19.7 | 19.8 | 21.5 | 17.7 | 18.6 | 5 | 9 | 11 | 23 | 67 | 14 | 28 | 17 |
| Hypertension | 17.9 | 20.2 | 57.2 | NA | NA | NA | NA | NA | 0 | -1 | -2 | -7 | -18 | -6 | -7 | -4 |
| Hypothyroidism | 2.7 | 2.3 | 11.3 | 10.4 | 12.9 | 4.8 | 7.9 | 7.7 | 0 | 0 | 0 | 2 | 1 | 2 | 2 | 0 |
| Liver disease | 1.3 | 2.3 | 3.3 | 4.2 | 3.9 | 3.8 | 5.9 | 4.6 | 11 | 5 | 7 | 13 | 36 | 10 | 19 | 9 |
| Lymphoma | 0.5 | 2.0 | 0.8 | 1.3 | 1.3 | 1.1 | 1.2 | 1.4 | 9 | 6 | 8 | 17 | 45 | 13 | 26 | 12 |
| Metastatic cancer | 2.4 | 7.4 | 2.4 | 3.7 | 3.9 | 3.0 | 3.0 | 4.2 | 12 | 13 | 17 | 26 | 72 | 19 | 35 | 20 |
| Obesity | 2.3 | 1.3 | 17.4 | 12.6 | 12.4 | 15.5 | 12.2 | 8.0 | -4 | -4 | -5 | -12 | -37 | -6 | -14 | -11 |
| Other neurological disorders | 2.7 | 4.6 | 8.9 | 7.1 | 7.1 | 7.6 | 6.7 | 6.2 | 6 | 4 | 5 | 19 | 52 | 13 | 28 | 16 |
| Paralysis | 1.8 | 2.2 | 2.6 | 1.1 | 1.1 | 1.4 | 1.1 | 1.1 | 7 | 3 | 4 | 31 | 97 | 17 | 36 | 22 |
| Peptic ulcer disease | 0.8 | 0.7 | 0.1 | 0.1 | 0.1 | 0.1 | 0.1 | 0.1 | 0 | 0 | 0 | 0 | 0 | 0 | 0 | 0 |
| Peripheral vascular disease | 2.6 | 4.7 | 7.8 | 6.1 | 7.0 | 4.8 | 4.7 | 4.6 | 2 | 6 | 4 | 10 | 23 | 9 | 15 | 7 |
| Psychoses | 1.4 | 2.8 | 5.7 | 9.1 | 8.7 | 11.4 | 8.5 | 7.2 | 0 | -4 | -6 | -15 | -42 | -10 | -18 | -12 |
| Pulmonary circulation disorder | 0.3 | 1.9 | 3.7 | 3.0 | 3.0 | 3.8 | 2.2 | 2.5 | 4 | 5 | 5 | 7 | 21 | 5 | 7 | 5 |
| Renal failure | 3.3 | 7.5 | 13.8 | 12.7 | 11.5 | 17.6 | 12.1 | 13.0 | 5 | 0 | 0 | 17 | 48 | 12 | 20 | 11 |
| Rheumatoid arthritis | 1.2 | 2.0 | 2.8 | 2.7 | 2.8 | 2.8 | 2.3 | 2.1 | 0 | 0 | 0 | -1 | -2 | -1 | 0 | -1 |
| Solid tumor without metastasis | 6.0 | 11.7 | 2.1 | 7.2 | 7.7 | 5.7 | 6.1 | 8.7 | 4 | 8 | 10 | 14 | 37 | 11 | 19 | 9 |
| Valvular disease | 1.8 | 3.0 | 7.2 | 5.4 | 6.3 | 4.2 | 3.6 | 4.4 | -1 | 0 | 0 | 2 | 5 | 0 | 5 | 0 |
| Weight loss | 1.1 | 1.6 | 4.8 | 3.2 | 3.2 | 3.3 | 2.6 | 3.5 | 6 | 8 | 10 | 26 | 77 | 16 | 31 | 17 |
| Hypertension, uncomplicated | NA | NA | NA | 41.9 | 43.3 | 41.5 | 38.0 | 39.5 | NA | NA | NA | -3 | -9 | -3 | -2 | -2 |
| Hypertension, complicated | NA | NA | NA | 12.9 | 11.4 | 18.9 | 12.5 | 13.1 | NA | NA | NA | -7 | -18 | -6 | -7 | -4 |
MD: Maryland; NA: Not applicable; SID: State Inpatient Databases; VW: Van Walraven.
In populations of White patients (N = 5,867,762), our index (c = 0.80, 0.80–0.80) performed slightly better than the VW score (c = 0.78; 95% CI: 0.78–0.78), SID 29 (c = 0.78; 95% CI: 0.78–0.78) and SID 30 (c = 0.77; 95% CI: 0.77–0.78), but had no difference in discriminatory power with the binary indicators (c = 0.80; 95% CI: 0.79–0.80; Figure 1).
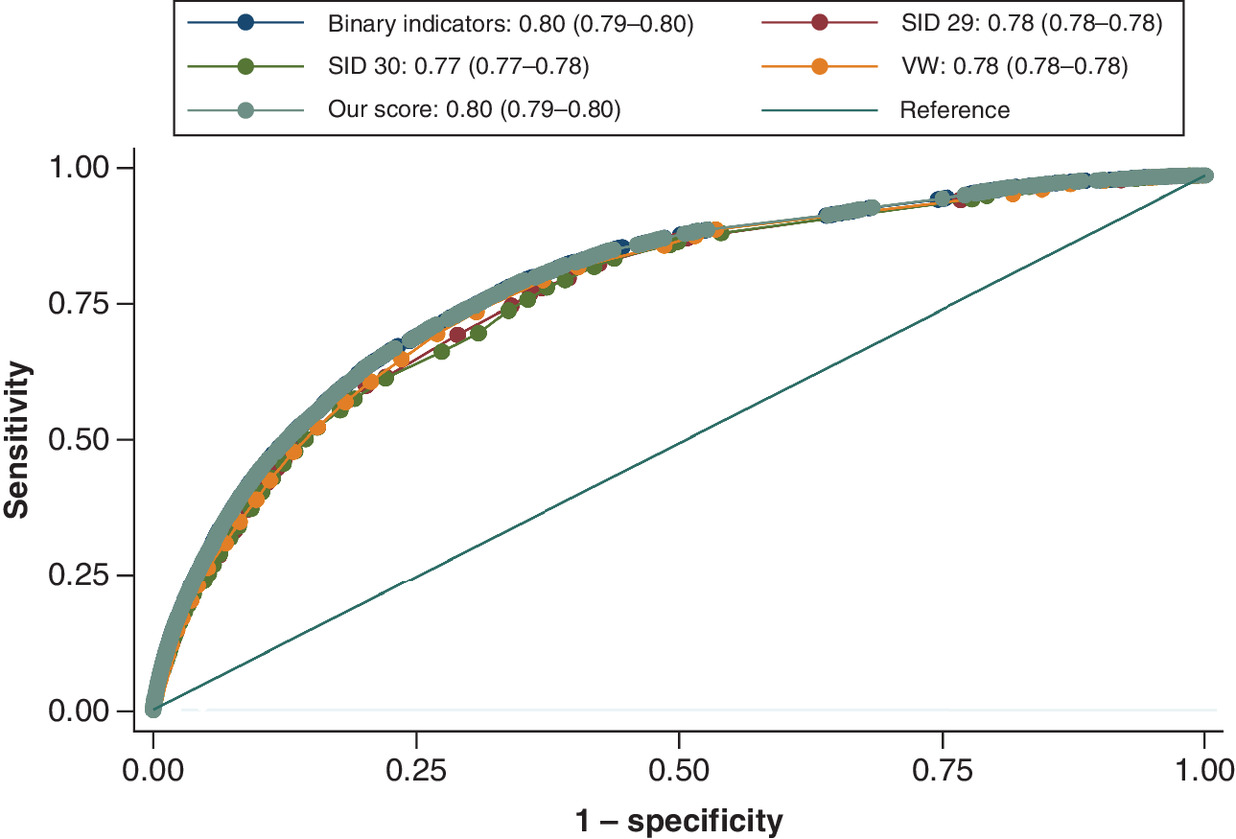
Figure 1. Area under the receiver operating characteristic curve in a sample of White patients only.
AUC, 95% CI.
AUC: Area under the curve; SID: State Inpatient Databases; VW: Van Walraven.
Among Black patients (N = 1,563,454), our index (c = 0.82; 95% CI: 0.82–0.82) again performed slightly better than the VW score (c = 0.80; 95% CI: 0.80–0.81), SID 29 (c = 0.80; 95% CI: 0.80–0.80) and SID 30 (c = 0.80; 95% CI: 0.80–0.80), but was not different than the binary indicators (c = 0.82; 95% CI: 0.82–0.82; Figure 2). Our index also performed well in Hispanic patients (N = 1,341,827): c = 0.81; 95% CI: 0.80–0.81 and in patients of other races/ethnicities (N = 644,927): c = 0.81; 95% CI: 0.80–0.81.
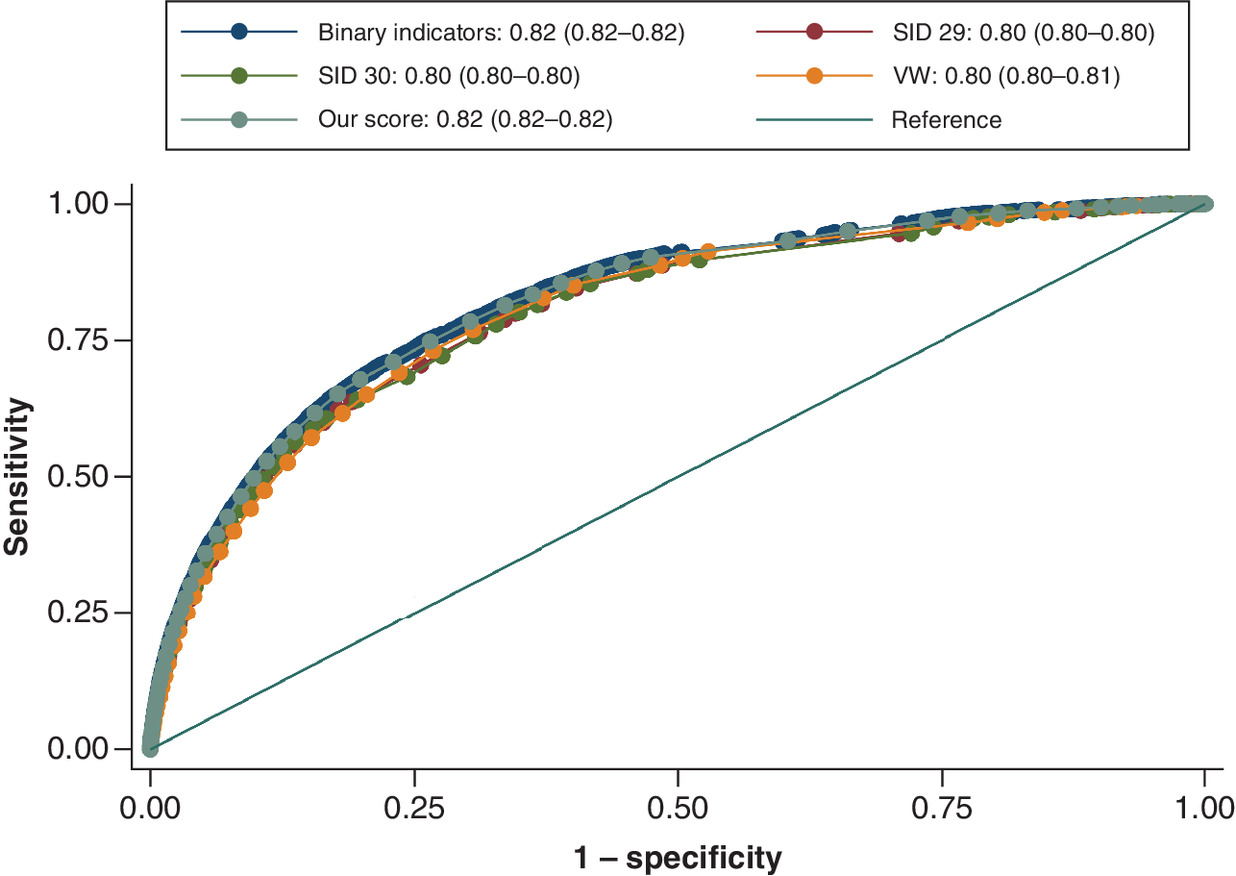
Figure 2. Area under the receiver operating characteristic curve in a sample of Black patients only.
AUC, 95% CI.
AUC: Area under the curve; SID: State Inpatient Databases; VW: Van Walraven.
All models displayed weak calibration in each category of race/ethnicity, notably at high predicted probabilities with few observations; in each model, the hypothesis of good calibration is rejected (p < 0.01 for all.) Figure 3 shows calibration belts for all validated models of in-hospital mortality for White and Black patients separately.
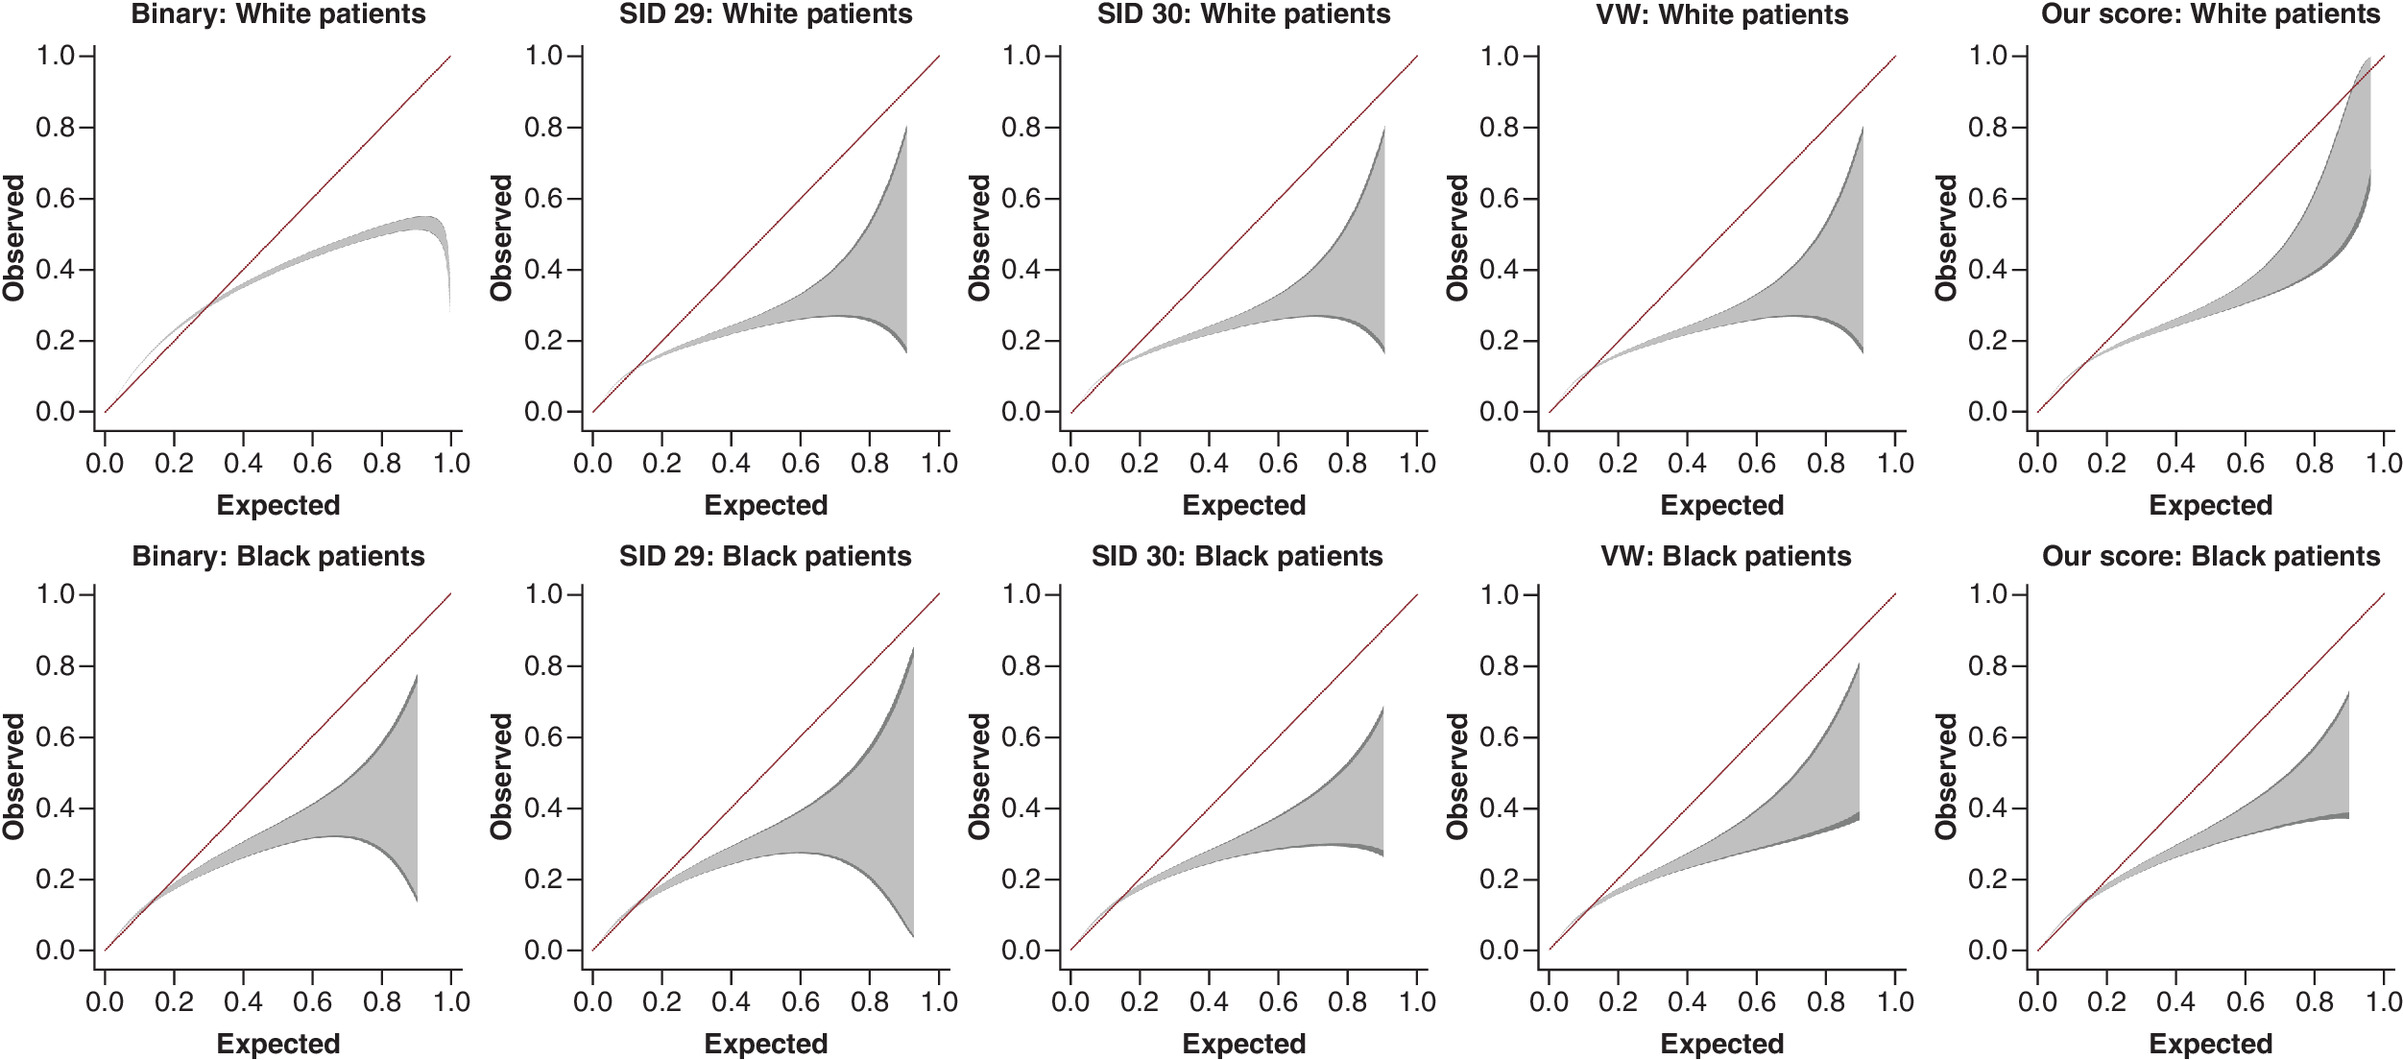
Figure 3. Calibration belts for each model of in-hospital mortality in groups of White and Black patients, separately.
Dark grey shaded area represents 95% confidence bands; light grey is 80%.
SID: State Inpatient Databases; VW: Van Walraven.
Discussion
Using SID data from CA, FL, NY, MD and KY over a span of 8 years, we derived composite scores of the Elixhauser comorbidities by individual categories of race/ethnicity and found that race/ethnicity-specific indexes performed slightly better than the overall VW score, SID 29 and SID 30 at discriminating in-hospital mortality. However, our index did not have superior discriminatory power to the binary Elixhauser measures.
To our knowledge, this is the first study to examine the validity and performance of composite comorbidity indexes in estimating in-hospital mortality in individual subgroups of race/ethnicity. As with any study using administrative data, the prevalence of comorbidities in our sample population may not be completely captured due to variations in coding practices. However, SID data are validated by quality control measured established by Healthcare Cost and Utilization Project to ensure the accuracy and internal consistency of data [9].
In sum, we found only modest differences by race/ethnicity in the discriminative validity of comorbidity adjustment scores, and no model was well calibrated. Existing measures remain valid and useful tools for researchers to adjust for patient risk factors among racial/ethnic subgroups in population-based health outcomes studies, but our race/ethnicity-specific index could provide a useful tool for parsimonious comorbidity risk adjustment in racial and ethnic health disparities research. However, our score and others suffered from poor calibration, notably at high probabilities. For this reason, we recommend that future research explore recalibrating race/ethnicity-specific scores, pointing to the better calibration observed in Thompson’s study, whose baseline model included additional covariates [8]. We also recommend the development of comorbidity indexes specific to other categories of social determinants of health, such as insurance payer and household income level.
•
Weighted composite comorbidity indexes are commonly used in administrative database research.
•
Using the State Inpatient Databases from CA, FL, NY, MD and KY over a span of 8 years, we derived composite scores of the Elixhauser comorbidities by individual categories of race/ethnicity to predict in-hospital mortality.
•
We validated our scores, existing scores and the binary Elixhauser measures on a random sample of State Inpatient Databases data.
•
Race/ethnicity-specific indexes performed slightly better than existing comorbidity scores at discriminating in-hospital mortality in external validation, but were not superior to the binary Elixhauser indicators.
•
All models, including race/ethnicity-specific models, showed weak calibration.
•
Our race/ethnicity-specific scores could provide a useful tool for parsimonious comorbidity risk adjustment in research on racial and ethnic health disparities.
•
Future research should focus on improving model calibration.
Financial & competing interests disclosure
The authors have no relevant affiliations or financial involvement with any organization or entity with a financial interest in or financial conflict with the subject matter or materials discussed in the manuscript. This includes employment, consultancies, honoraria, stock ownership or options, expert testimony, grants or patents received or pending, or royalties.
No writing assistance was utilized in the production of this manuscript.
References
1.
Van Walraven C, Austin PC, Jennings A, Quan H, Forster AJ. A modification of the Elixhauser comorbidity measures into a point system for hospital death using administrative data. Med. Care 47(6), 626–633 (2009).
2.
Charlson ME, Pompei P, Ales KL, Mackenzie CR. A new method of classifying prognostic comorbidity in longitudinal studies: development and validation. J. Clin. Epidemiol. 40(5), 373–383 (1987).
3.
Menendez ME, Neuhaus V, Van Dijk CN, Ring D. The Elixhauser comorbidity method outperforms the Charlson index in predicting inpatient death after orthopaedic surgery. Clin. Orthop. Rel. Res. 472(9), 2878–2886 (2014).
4.
Lieffers JR, Baracos VE, Winget M, Fassbender K. A comparison of Charlson and Elixhauser comorbidity measures to predict colorectal cancer survival using administrative health data. Cancer 117(9), 1957–1965 (2011).
5.
Menendez ME, Ring D. A comparison of the Charlson and Elixhauser comorbidity measures to predict inpatient mortality after proximal humerus fracture. J. Orthop. Trauma 29(11), 488–493 (2015).
6.
Chang H-J, Chen P-C, Yang C-C, Su Y-C, Lee C-C. Comparison of Elixhauser and Charlson methods for predicting oral cancer survival. Medicine 95(7), e2861 (2016).
7.
Ondeck NT, Bohl DD, Bovonratwet P, Mclynn RP, Cui JJ, Grauer JN. Discriminative ability of Elixhauser's comorbidity measure is superior to other comorbidity scores for inpatient adverse outcomes after total hip arthroplasty. J. Arthroplasty 33(1), 250–257 (2018).
8.
Thompson NR, Fan Y, Dalton JE et al. A new Elixhauser-based comorbidity summary measure to predict in-hospital mortality. Med. Care 53(4), 374 (2015).
9.
Healthcare Cost Utilization Project. Overview of the state inpatient databases (SID). (2016). www.hcup-us.ahrq.gov/sidoverview.jsp
10.
Nattino G, Lemeshow S, Phillips G, Finazzi S, Bertolini G. Assessing the calibration of dichotomous outcome models with the calibration belt. Stata J. 17(4), 1003–1014 (2017).
Information & Authors
Information
Published In
Pages: 823 - 829
PubMed: 34047194
Copyright
© 2021 Future Medicine Ltd.
History
Received: 13 October 2020
Accepted: 6 April 2021
Published online: 28 May 2021
Keywords:
Topics
Authors
Metrics & Citations
Metrics
Article Usage
Article usage data only available from February 2023. Historical article usage data, showing the number of article downloads, is available upon request.
Citations
How to Cite
Validity of comorbidity adjustment scores in estimating in-hospital mortality in individual subgroups of race/ethnicity. (2021) Journal of Comparative Effectiveness Research. DOI: 10.2217/cer-2020-0222
Export citation
Select the citation format you wish to export for this article or chapter.