Experiences of cancer patients with outpatient care in the USA: a population-based study
Publication: Journal of Comparative Effectiveness Research
Abstract
Aim: To evaluate the patterns of cancer patients-assessed quality of outpatient care in the USA. Materials & methods: Medical Expenditure Panel Survey datasets for the years 2011, 2013, 2015 and 2017 were accessed and adult participants with a history of cancer diagnosis were reviewed. Participants’ assessments of different quality indicators of healthcare providers were reviewed. Multivariable logistic regression analysis for factors associated with a better overall rating of healthcare was then conducted. Results: A total of 8050 participants with a history of cancer were included. Within multivariable logistic regression analysis, factors associated with the better rating of healthcare included; older age (odds ratio [OR]: 1.017; 95% CI: 1.010–1.025), higher income OR (OR: 2.385; 95% CI: 1.735–3.277) and better self-reported health status (OR: 6.691; 95% CI: 3.928–11.396). Conclusion: Cancer patients with older age, higher income and better health status were more likely to be satisfied with the outpatient care they received. The biggest area for potential improvement of patient satisfaction seems to be related to the time spent with healthcare providers.
While many studies have evaluated the quality of healthcare provided to cancer patients through performance characteristics and objective system-wide end points [1–3]; few studies have focused on the patient’s version of the events [4]. Despite its importance and relevance, little is known about cancer patients’ impressions about healthcare quality and performance; and in the era of patient-centered care, that should have been one of our research priorities [5,6].
To provide a better assessment of patient experiences, there is a need to access a nationally representative sample of cancer patients in the USA and to collect their experiences regarding different performance aspects of the healthcare system and to stratify their responses according to their socioeconomic and insurance statuses. Medical Expenditure Panel Survey (MEPS) seems to be an appropriate tool to reflect cancer patients' experiences in the USA. MEPS is a set of large-scale surveys of individuals, their employers and their medical providers within the USA. It is focused on collecting data on the utilization of health services as well as its costs. Its sampling approach is based on a subsample of households that were reviewed in the past year’s National Health Interview Survey; and thus, it is considered as a nationally representative sample [7].
Previously published studies based on the same dataset (MEPS) have provided a comprehensive picture regarding patient-reported quality rating and patient experience with outpatient care in the USA [8,9]. Assessment of the different patients' characteristics on their experience with outpatient care was provided as well. However, these studies were not focused on cancer patients’ population; but rather encompassed all-comers. That is why, the current study is valuable in the new context it does provide to enhance our understanding of the specific subgroup of patients with history of cancer.
Aim
To evaluate the patterns of cancer patients-assessed quality of outpatient care in the USA.
Materials & methods
Cohort definition
As included participants within the MEPS were followed up for 2 years; and to avoid data duplication, the current study is based on MEPS datasets of the years 2011, 2013, 2015 and 2017 (intervening years of 2012, 2014 and 2016 were excluded). It should be noted that this study is based on cross-sectional data analysis with no available longitudinal follow-up data for outpatient care quality rating. All the analyses done in this study are based on cross-sectional data with no longitudinal follow-up. Adult participants (>20 years old), within the above-designated years of MEPS and with a history of cancer.
Data collection
The following baseline data were collected (where available) from each of the included participants; including:
•
Age at survey completion, sex, race, marital status, relationship to the poverty level (reported as high income, middle income, low income, near poor and poor), insurance status and type, total healthcare expenditure and total out-of-pocket expenditure, geographic region, self-reported health status, patient health questionnaire, primary cancer site and year of survey completion.
Regarding interactions with healthcare system, the following variables were collected:
•
Whether participants sought urgent care from an emergency department or doctor’s office in the past year, whether participants have got an appointment with a doctor for healthcare in the past year and whether participants received an outpatient care in the past year.
•
For participants who answered yes to the last question, their assessment of the quality of healthcare was evaluated through the following questions: what is the overall rate of healthcare you have received, how often health providers listened carefully to you, how often health providers explained things in a way that was easy to understand, how often providers showed respect for what you had to say, how often health providers spent enough time with you and whether doctors or other health providers gave instructions about what to do about a specific illness or health condition. The overall rate for healthcare quality was provided as a numerical scale (0–10; where 0 is the worst possible healthcare and 10 is the best possible healthcare). Other quality indicators were provided as a scale of four (never, sometimes, usually and always).
Statistical analyses
Descriptive analyses were initially used to describe the frequencies of different baseline characteristics within the study cohort. Temporal trends of different patient-assessed quality indicators were then provided. Further stratification of participant-assessed quality of healthcare was provided by race, sex, insurance coverage, primary tumor site, self-reported health status, poverty level and out-of-pocket healthcare expenditure. Out-of-pocket expenditure has been classified into four quartiles (<US$199; 199–605, 605–1450, >1450). Analysis of variance (ANOVA) testing was used to compare overall rating of outpatient care across different years as well as across different patient strata.
Multivariable logistic regression analysis for factors associated with a better overall rating of healthcare (rate >5 on the numerical scale). The following variables were included in this model: age, sex, race, relationship to the poverty level, insurance coverage and self-reported health status. These variables were included because of prior studies suggesting their impact on patient experiences in the noncancer population [8,9]. Because small numbers of participants were included in each tumor site and because primary tumor site is not mutually exclusive (i.e., a participant can have more than one primary site of tumor), it was not possible to include the primary tumor site as a variable in this model. Likewise, because type of insurance coverage is not mutually exclusive (i.e., a participant can have more than one mode of insurance coverage), it was not possible to include type of insurance in this model.
Although multivariable logistic regression analysis provides the most robust data, addition of descriptive figures does supplement the findings through providing summary figures for the overall analyses; that is why both models of analysis were employed. All statistical analyses were conducted through SPSS version 26.0 (IBM, NY, USA).
Results
Patients’ characteristics
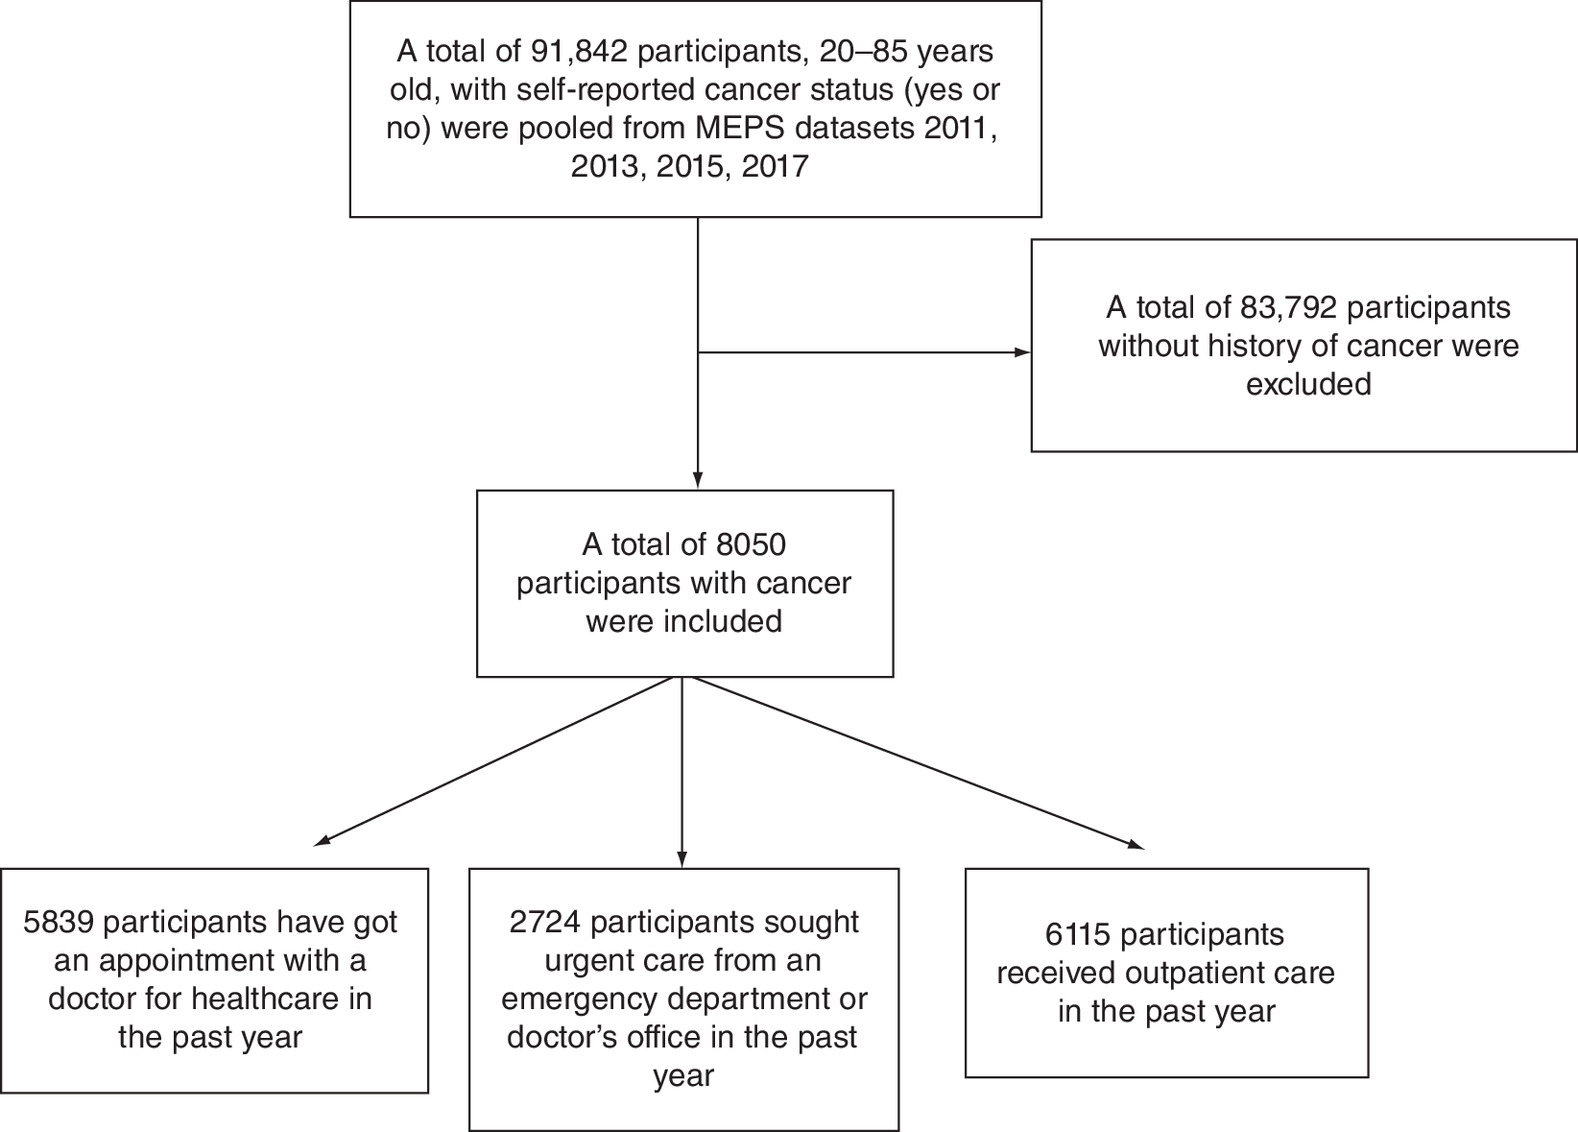
Figure 1 summarized the participants’ selection process. Out of 91842 participants who were pooled from MEPS datasets (2011, 2013, 2015 and 2017), a total of 8050 participants with a history of cancer were included. These include 5839 participants who have got an appointment with a doctor for healthcare in the past year, 2724 participants who sought urgent care from an emergency department or doctor’s office in the past year and 6115 participants who received outpatient care in the past year. Within participants who got at least one appointment with a doctor in the past year, 60.3% reported that they got an appointment for healthcare as soon as he or she thought it was needed; within participants who sought urgent care at least one-time in the past year, 66.7% reported that they got care right away; and within participants who have outpatient care at least once in the past year, 34.6% described it as the best healthcare possible.
Within the overall study cohort, mean age was 63.72 (standard deviation [SD]: 14.71), white race comprised 82.3% of participants, men comprised 41.7% of participants and 36.8% was reported as having a high income. More than half of participants have private insurance (55.6%) and 15.5% of participants have excellent self-reported health status (Table 1).
| Parameters | N (%) |
|---|---|
| Age (mean; SD) | 63.72; 14.71 |
| Race – White – Black – Asian – American Indian/Alaska native – Multiple races | 6622 (82.3%) 1007 (12.5%) 222 (2.8%) 57 (0.7%) 142 (1.8%) |
| Sex – Male – Female | 3353 (41.7%) 4697 (58.3%) |
| Marital status – Married – Unmarried | 4360 (54.2%) 3690 (45.8%) |
| Relationship to poverty line – High income – Middle income – Low income – Near poor – Poor | 2959 (36.8%) 2231 (27.7%) 1196 (14.9%) 454 (5.6%) 1210 (15%) |
| Lack of insurance in the past 12 months – Yes – No | 400 (5%) 7650 (95%) |
| Insurance coverage† – Private – Medicare – Medicaid – Tricare | 4479 (55.6%) 4609 (57.3%) 1326 (16.5%) 460 (5.7%) |
| Total healthcare expenditure (mean; SD) | 12502.14; 26680.88 |
| Total out of pocket expenditure (mean; SD) | 1180.73; 2784.62 |
| Region – Northeast – Midwest – South – West | 1313 (16.3%) 1782 (22.1%) 3072 (38.2%) 1883 (23.4%) |
| Self-reported health status – Excellent – Very good – Good – Fair – Poor – Unknown | 1244 (15.5%) 2163 (26.9%) 2451 (30.4%) 1424 (17.7%) 674 (8.4%) 94 (1.2%) |
| PHQ-2 – 0 – 1 – 2 – 3 – 4 – 5 – 6 – Missing | 4526 (56.2%) 812 (10.1%) 973 (12.1%) 262 (3.3%) 287 (3.6%) 102 (1.3%) 184 (2.3%) 904 (11.2%) |
| Primary cancer site‡ – Lung cancer – Breast cancer – Prostate cancer – Colon cancer – Lymphoma – Melanoma – Bladder cancer – Cervical cancer | 211 (2.6%) 1347 (16.7%) 935 (11.6%) 465 (5.8%) 191 (2.4%) 518 (6.4%) 168 (2.1%) 545 (6.8%) |
†
Some participants have more than one source of insurance.
‡
Not all primary cancer sites were reported in the MEPS datasets.
MEPS: Medical Expenditure Panel Survey; PHQ-2: Patient health questionnaire; SD: Standard deviation.
Patterns of patient-assessed quality of care
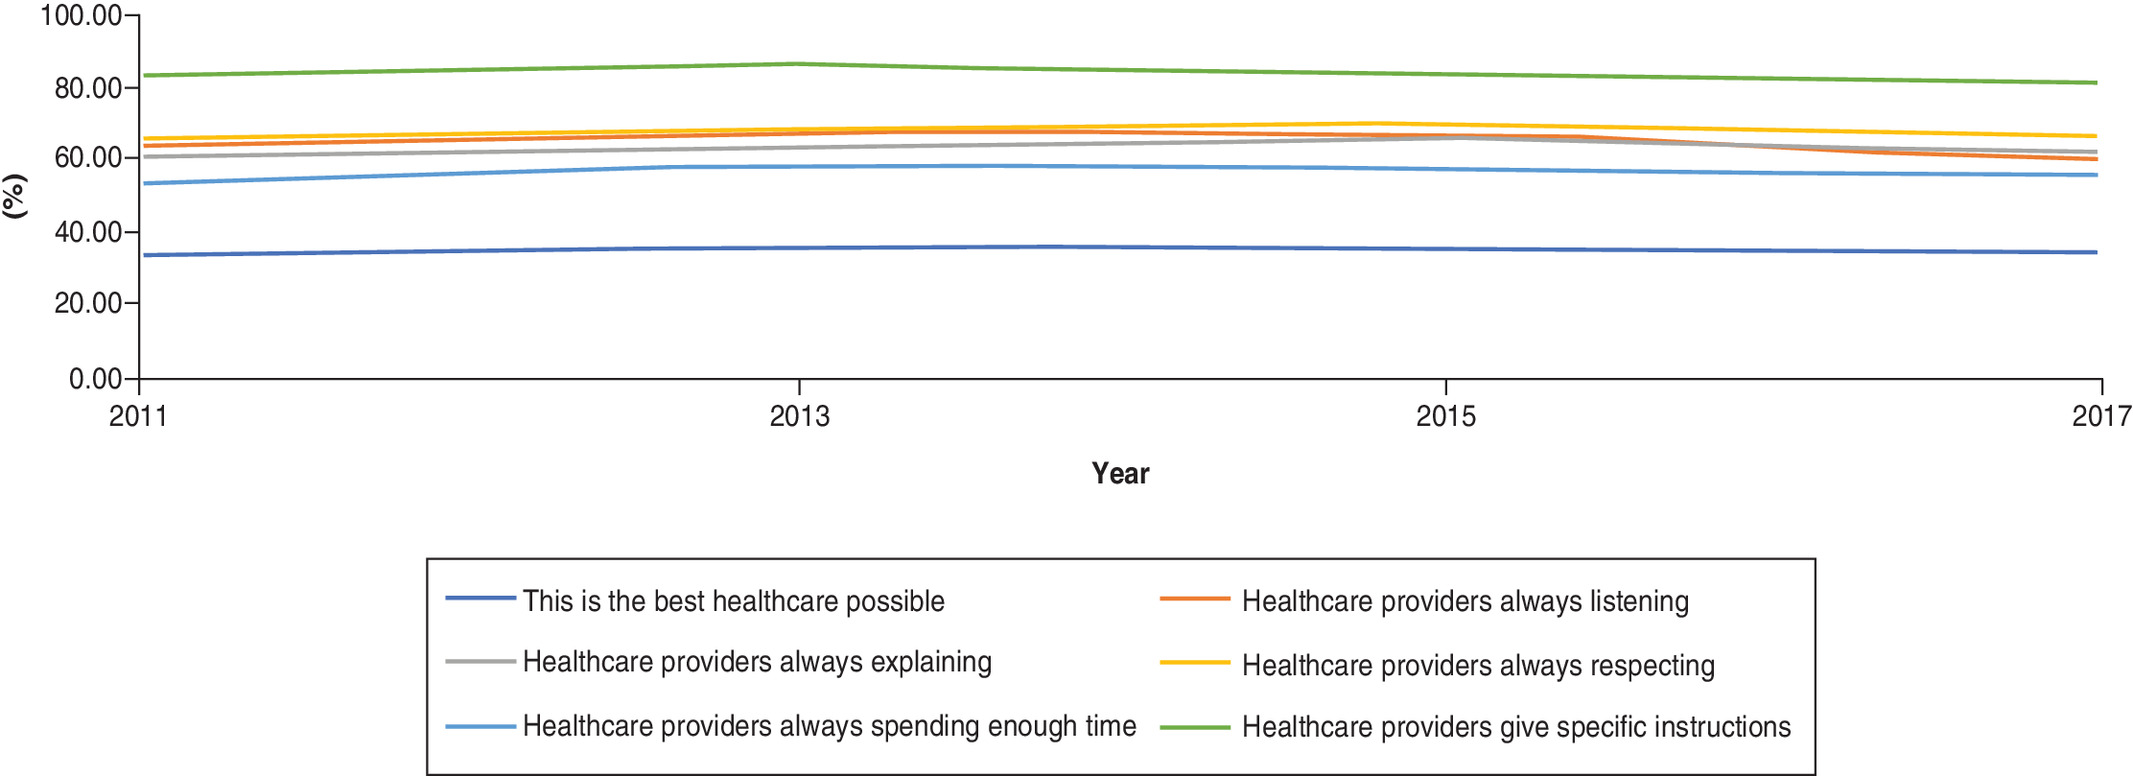
Figure 2 summarizes temporal trends in different aspects of patient-assessed quality of care (2011–2017). Overall, there does not appear to be a significant change in overall rating or individual dimensions of the quality of care during the study period. The highest-rated dimension has been healthcare providers giving specific instructions (83.2% in 2011 vs 81.3% in 2017); and the lowest-rated element has been whether healthcare providers are always spending enough time with patients (53.4% in 2011 vs 55.4% in 2017). Using ANOVA testing, p-value for the overall rating of outpatient care across different years was 0.264.
The following patients’ strata were more likely to be satisfied with care and they better rated overall quality of care; those with higher income (p = 0.001; Figure 3A); those with better self-reported health status (p < 0.001; Figure 3B) as well as those with higher out-of-pocket healthcare expenditure (p < 0.001; Figure 3C). Although overall rating of care quality was not significantly different according to race (p = 0.488); patients with American Indian ancestry seem to be numerically unhappier with many aspects of their care compared with other racial groups (Figure 3D). There was no difference in quality rating according to sex (p = 0.127; Figure 3E). Stratification according primary tumor site is shown in Figure 1F; and those with a history of bladder cancer and melanoma seem to have higher rating (although this could not be statistically shown because of the non mutually exclusive nature of primary tumor site; i.e., a patient can have more than one primary site of tumor). Likewise, statistical comparison of the quality rating according to type of insurance could not be done because of the nonmutually exclusive nature of the type of insurance; in other words, a patient can have more than one source of insurance (Figure 1G).
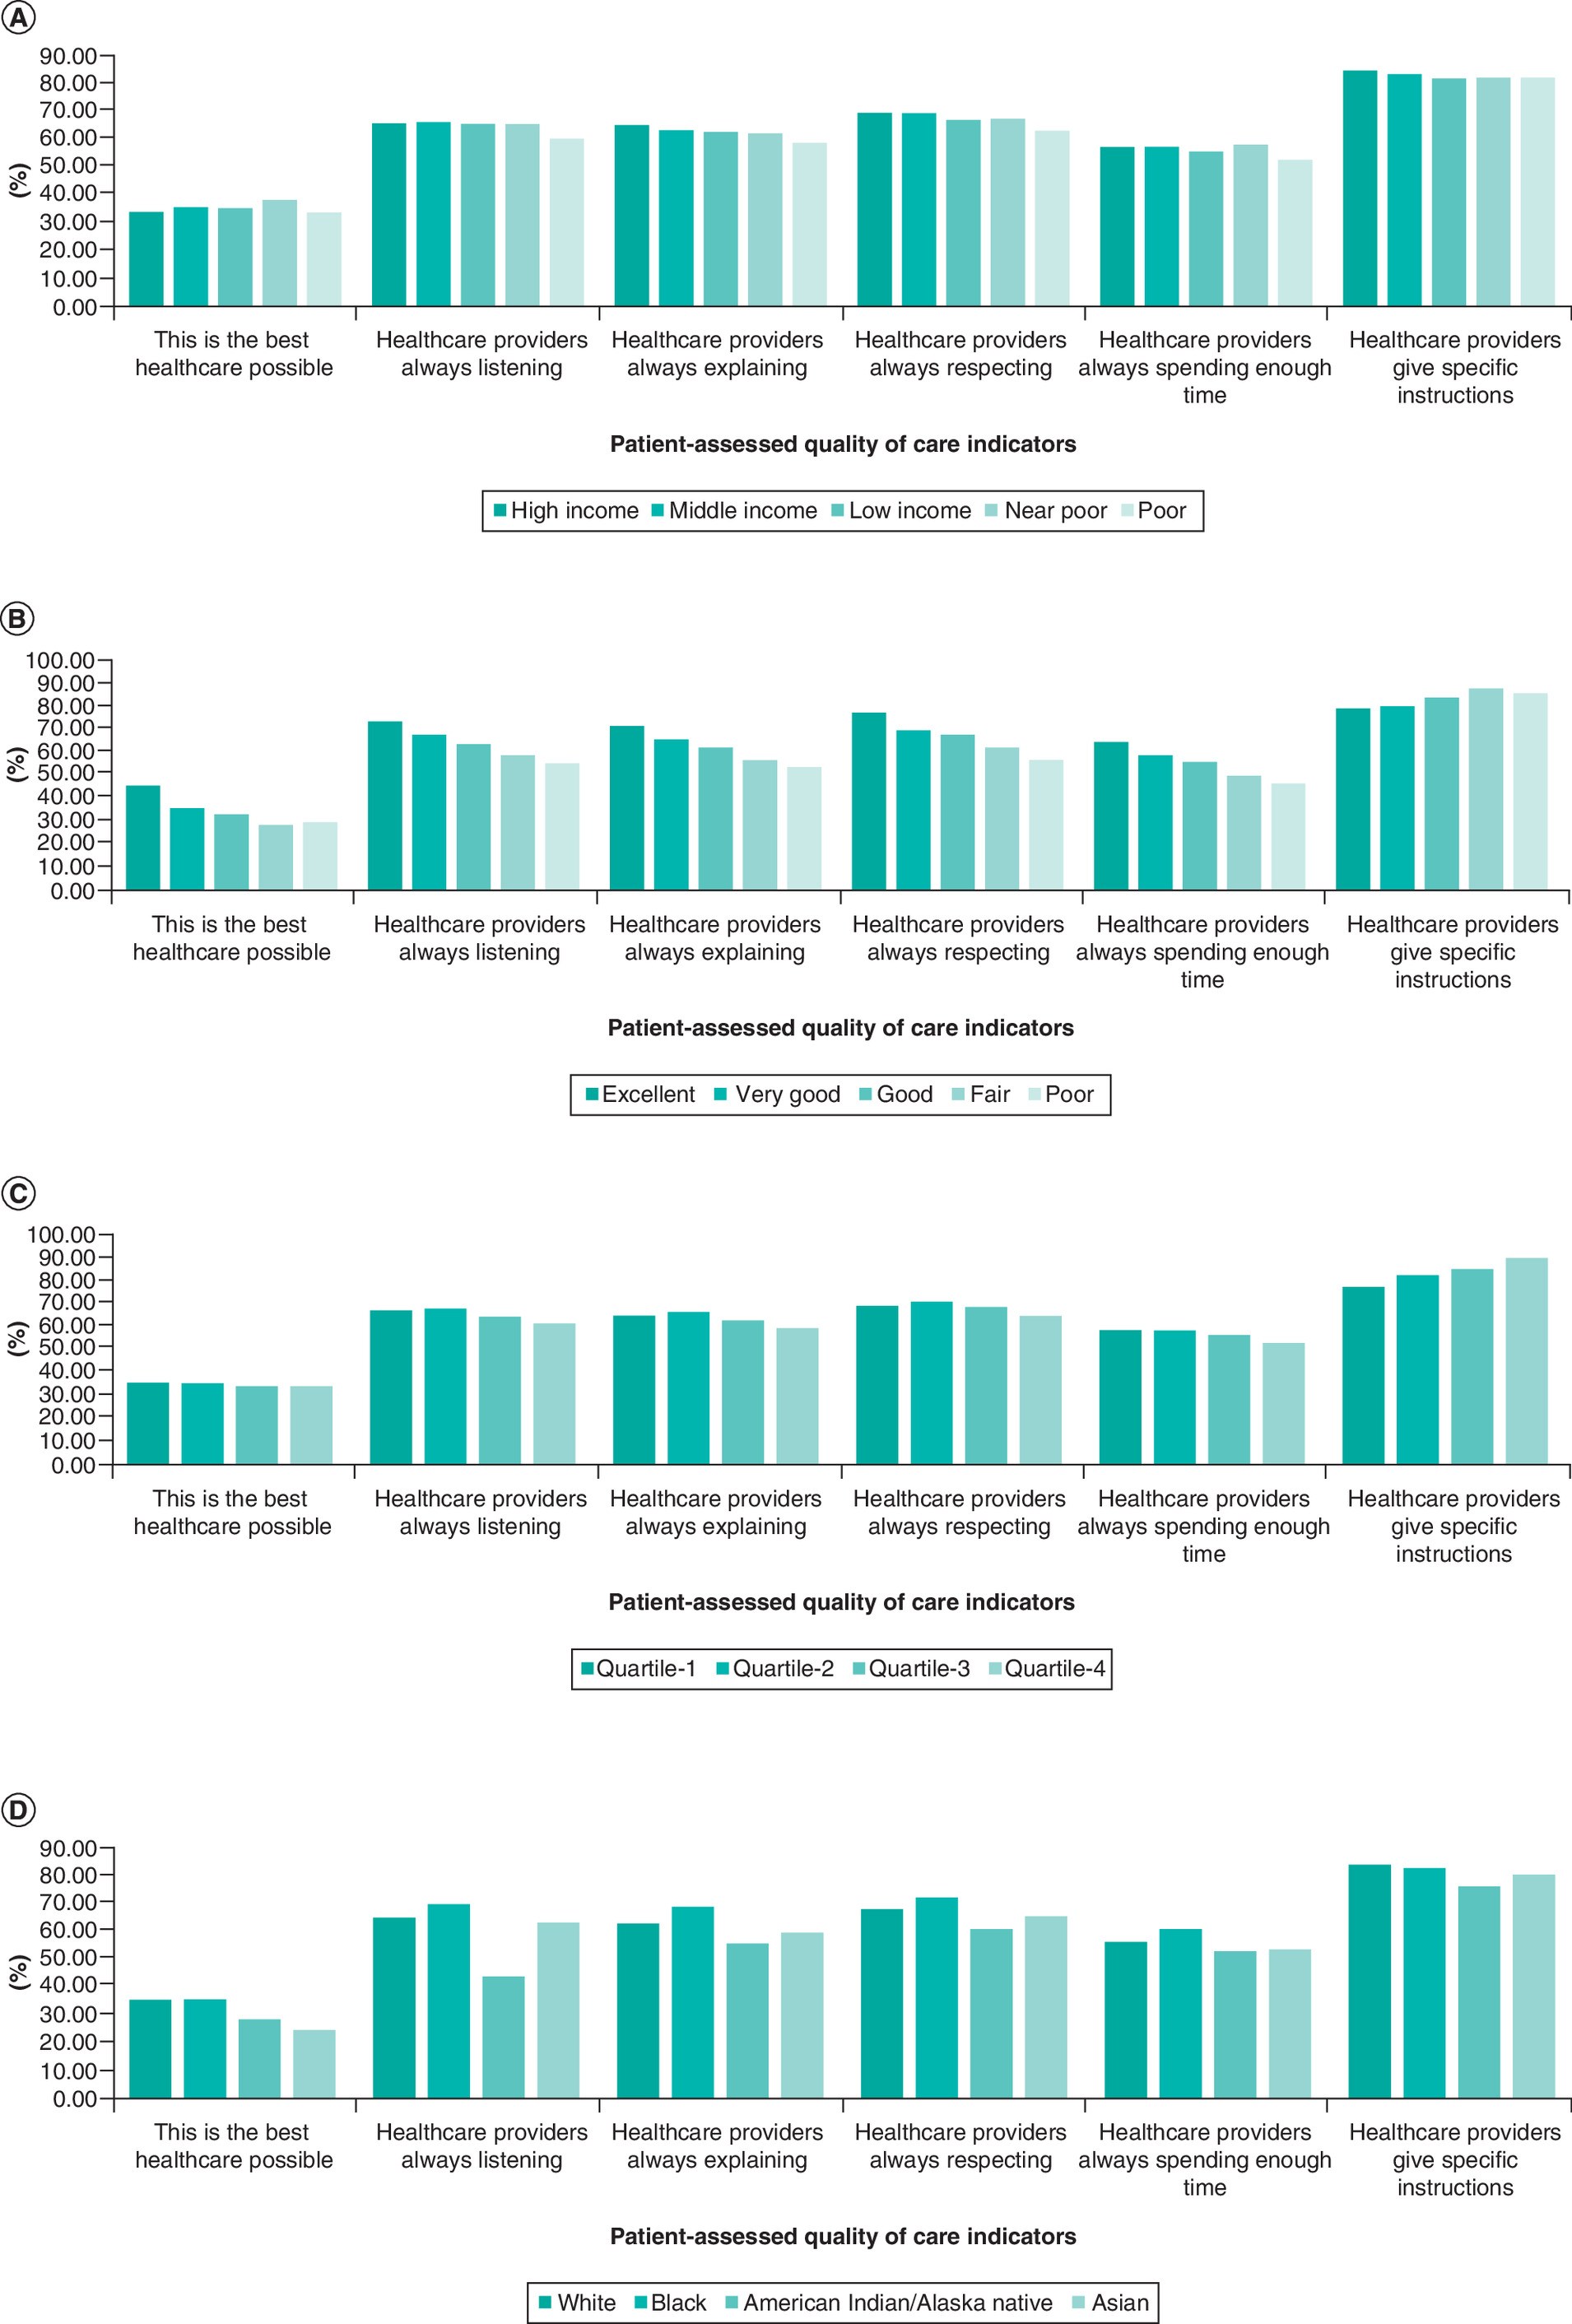
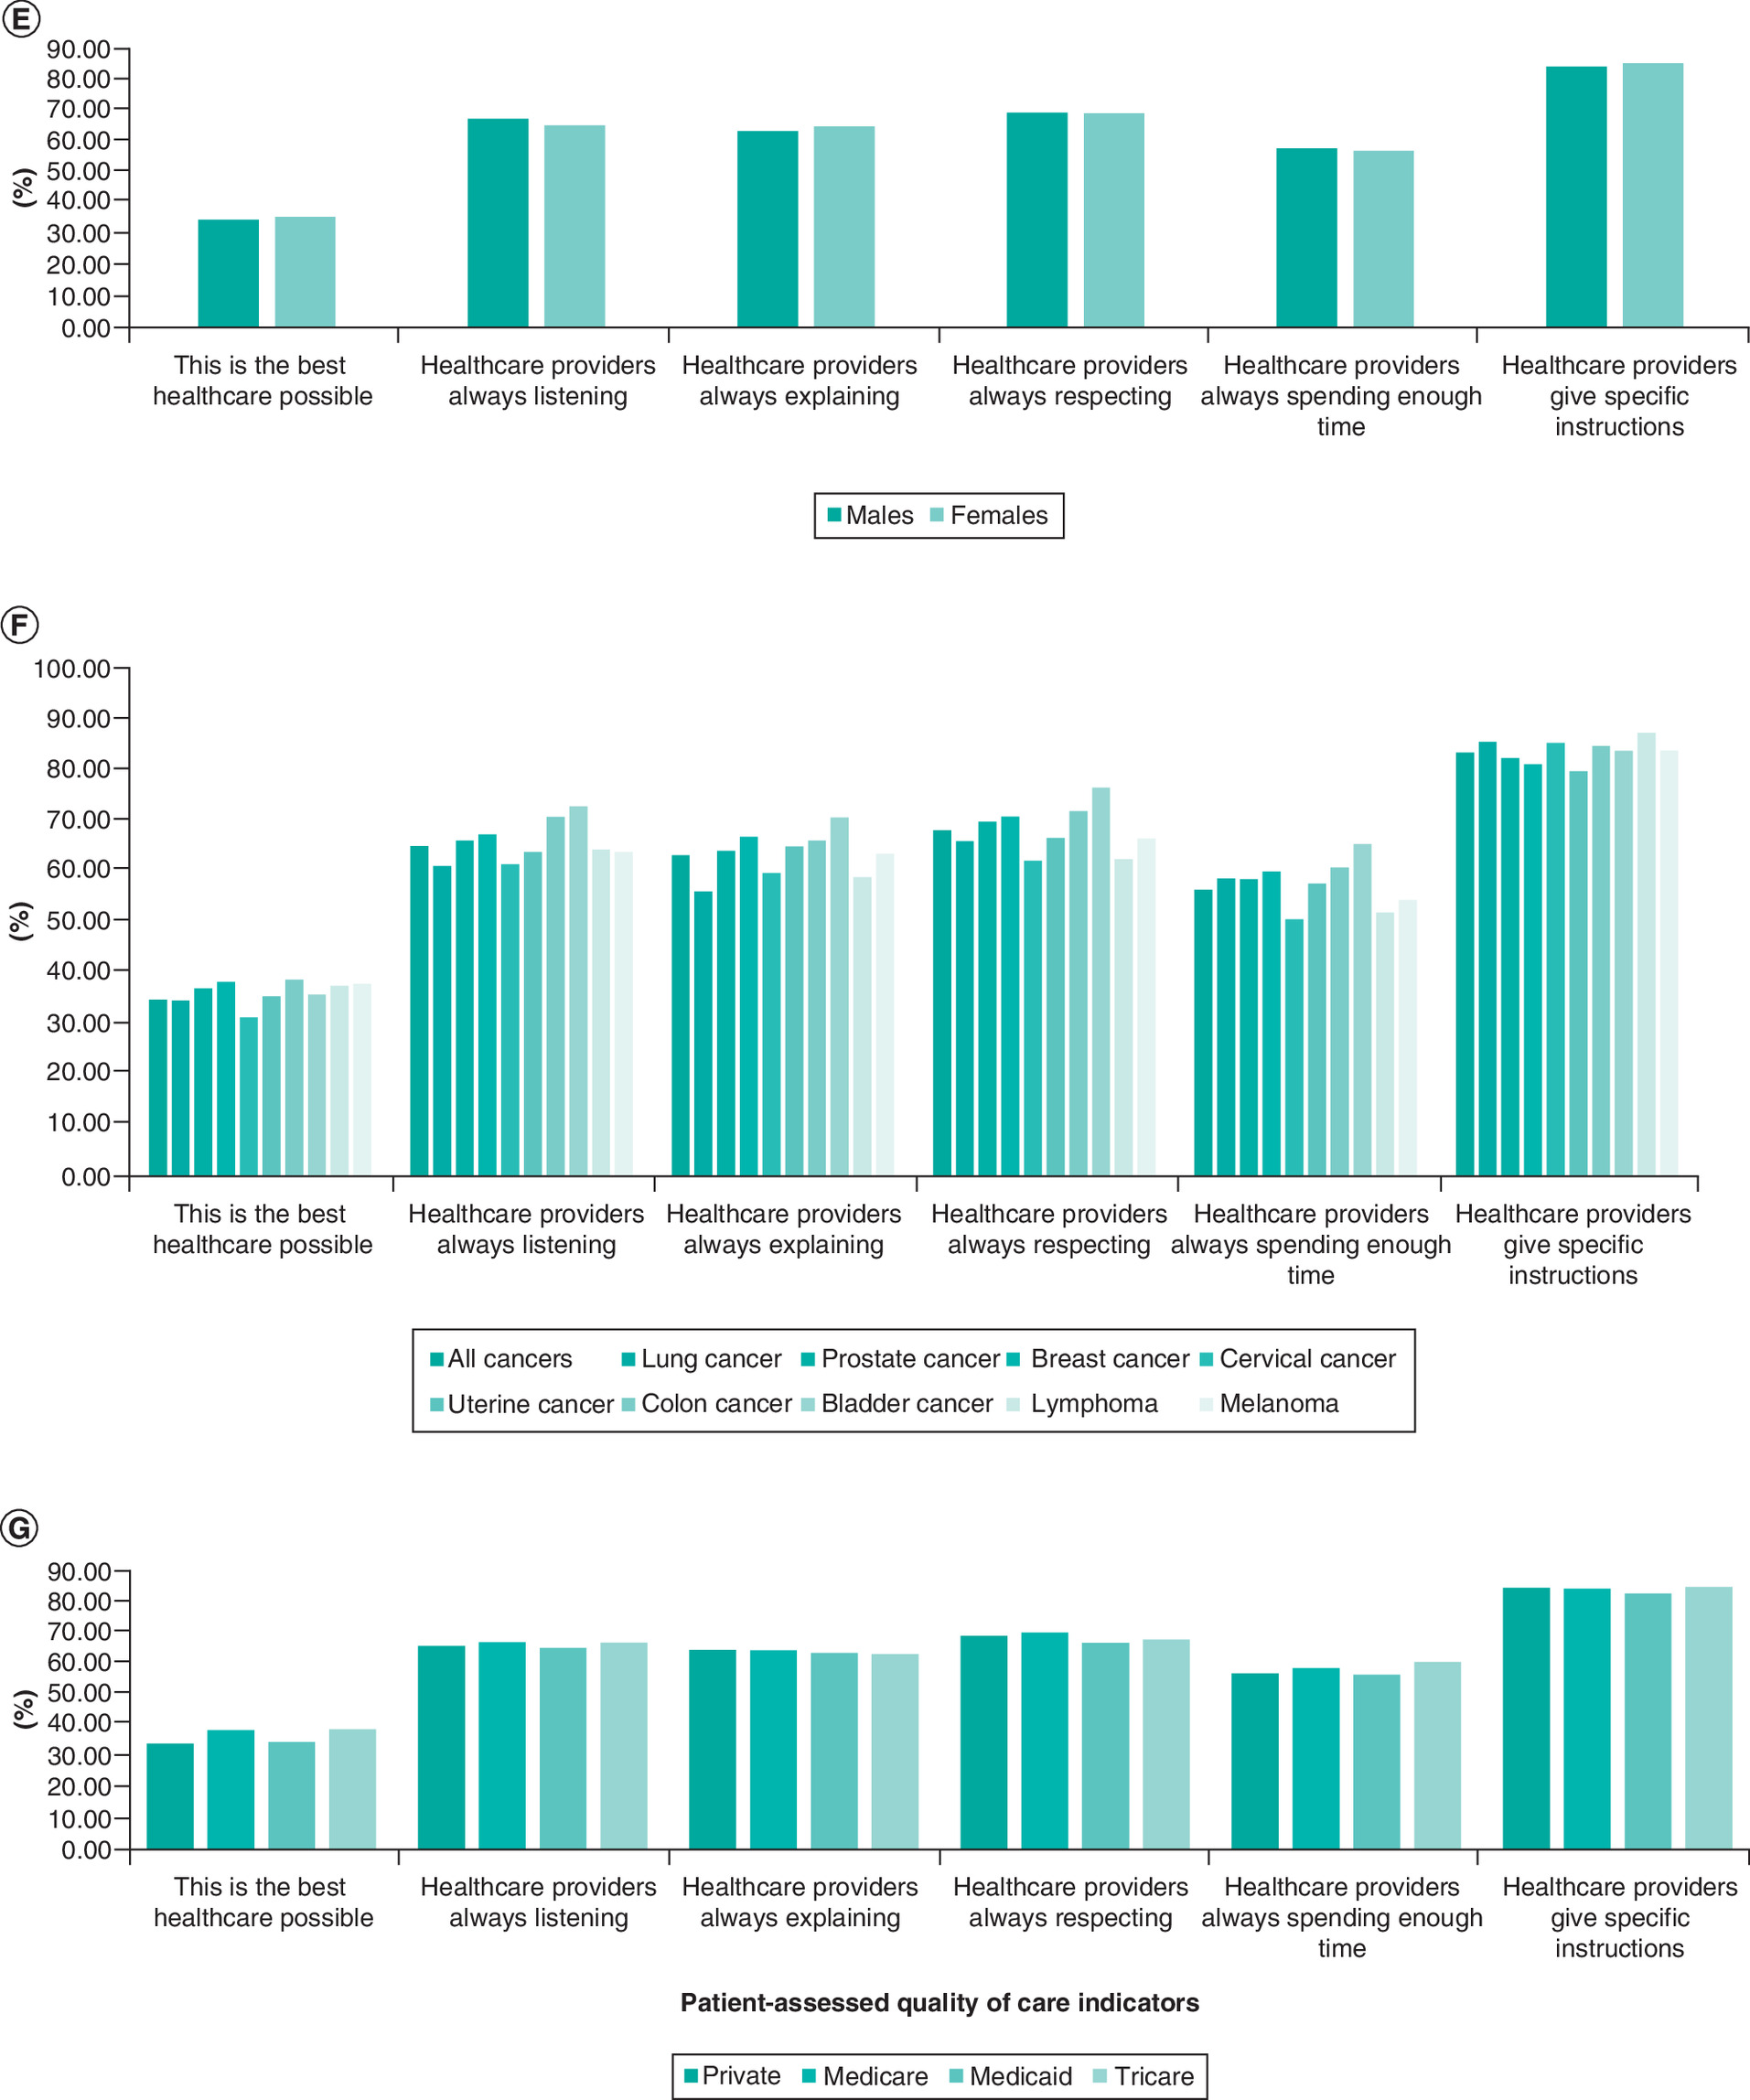
Figure 3. Participant-assessed quality of care.
Participant-assessed quality of care indicators according to (A) relationship to poverty level; (B) self-reported health status; (C) out-of-pocket healthcare expenditure; (D) race; (E) sex; (F) primary tumor site; (G) type of insurance.
Factors associated with better rating of healthcare
Within multivariable logistic regression analysis, the following factors were associated with better rating of healthcare; older age (OR: 1.017; 95% CI: 1.010–1.025), higher income (OR: 2.385; 95% CI: 1.735–3.277) and better self-reported health status (OR: 6.691; 95% CI: 3.928–11.396; Table 2).
| Parameters | OR (95% CI) | p-value |
|---|---|---|
| Age (continuous) | 1.017 (1.010–1.025) | <0.001 |
| Race – White – Black – Asian – American Indian/Alaska native – Multiple races | Reference 0.807 (0.615–1.059) 0.679 (0.389–1.187) 0.532 (0.223–1.272) 0.631 (0.339–1.176) | 0.122 0.175 0.156 0.147 |
| Sex – Female – Male | Reference 1.131 (0.915–1.397) | 0.256 |
| Relationship to poverty line – Poor – High income – Middle income – Low income – Near poor | Reference 2.385 (1.735–3.277) 1.513 (1.134–2.019) 1.045 (0.769–1.420) 0.978 (0.658–1.455) | <0.001 0.005 0.778 0.914 |
| Insurance coverage in the past 12 months – Yes – No | Reference 0.729 (0.479–1.110) | 0.140 |
| Self-reported health status – Poor – Excellent – Very good – Good – Fair | Reference 6.691 (3.928–11.396) 3.174 (2.242–4.495) 2.136 (1.579–2.890) 1.275 (0.946–1.718) | <0.001 <0.001 <0.001 0.110 |
OR: Odds ratio.
Discussion
The current study evaluates the patterns and trends of patient-assessed quality of outpatient care among cancer patients in the USA (2011–2017). It suggested that cancer patients with older age, higher income and better health status were more likely to be satisfied with the care they received. Additionally, there was no evidence of a temporal change in overall rating of care across the period of the study. The biggest area for potential improvement of patient satisfaction seems to be related to the time spent with healthcare providers. The results of the current study should guide quality improvement initiatives for the care provided to cancer patients and it should help tailor these improvements into patient-centered improvements.
The observed association between better self-reported health and better rating of the healthcare system is in line with a previously reported Cancer Care Outcomes Research and Surveillance (CanCORS) study, where cancer patients with inaccurate beliefs about the nature of the treatment they are receiving (thinking they are receiving curative chemotherapy while they are receiving palliative chemotherapy) were more likely to favorably rate the communication of their healthcare provider [10]. Although differences in design and end points between CanCORS study and this study cannot be underestimated, both support the same notion that patients’ perceptions about their health and prognosis shape, to a great extent, their satisfaction with healthcare providers. Similarly, observed income-based inequality in patients’ experiences in the current analysis is not surprising given the previously shown relationship between lower socioeconomic status and poor cancer outcomes across a variety of solid tumors and presentations [11–13]. Higher-income has also been previously reported to predict better satisfaction with cancer care [14].
The current study has several limitations and strengths that need to be discussed. First, cancer diagnosis as well as other sociodemographic factors are based on self-reporting by patients. Thus, there is a recognized risk of bias when interpreting the results of the current analysis. Second, although information about the primary tumor site was available, details about histology, staging and treatment of cancer were not reported within the MEPS datasets. Moreover, timing of cancer treatment and whether patients can be considered as active cancer patients versus cancer survivors is unclear in the current study dataset. These are important aspects that have not been properly addressed inn the current study. Third, MEPS datasets did not clarify whether the received care has been for cancer or other medical problems. Thus, although the results of the current analysis can speak about cancer patients’ experiences with care in general, we cannot claim that it did represent specifically their experiences with cancer-related care. Taken together, these limitations highlight the fact that the current analysis indicates association rather than causation and further studies are needed to confirm the results of the current analysis. On the other hand, these limitations should be weighed against the strengths of the current study; specifically, the contemporaneous nature of data collection and the rigorous data collection processes within MEPS.
It is interesting also to note that individuals with primary bladder cancer and melanoma have numerically higher rating of care quality and supposedly better patient experience. A possible reason might be related to the fact that many of those participants self-reporting a history of bladder cancer have noninvasive bladder cancer which has been treated with simple cystoscopic intervention and those individuals would be more likely to have better health status (at least from a cancer perspective) leading to a better patient experience. Likewise, many of those reporting a prior diagnosis of melanoma might have been diagnosed with very early-stage melanoma that has been treated with resection only. Similarly, the observed lack of satisfaction among participants with higher out-of-pocket healthcare expenditure might be related to the fact that those with higher expenditures are more likely to have worse health status. These two examples clarify the impact of potential interaction between different independent variables in shaping our understanding of the results of this study.
Further work needs to be done to improve the experience of cancer patients with healthcare. From the current analysis, it seems that insufficient time spent with patients seems to be one of their biggest concerns. This concern has been highlighted in prior quality studies of cancer care as well and it should represent the biggest opportunity for improvement of patient experiences [15].
Conclusion
Cancer patients with older age, higher income and better health status were more likely to be satisfied with the care they received. Additionally, there was no evidence of a temporal change in overall rating of care across the period of the study. The biggest area for potential improvement of patient satisfaction seems to be related to the time spent with healthcare providers.
•
Medical Expenditure Panel Survey datasets for the years 2011, 2013, 2015 and 2017 were accessed.
•
Adult participants with a history of cancer diagnosis were reviewed.
•
Participants’ assessments of different quality indicators of healthcare providers were reviewed.
•
Multivariable logistic regression analysis for factors associated with a better overall rating of healthcare was then conducted.
•
A total of 8050 participants with a history of cancer were included.
•
Within multivariable logistic regression analysis, factors associated with the better rating of healthcare included; older age (odds ratio [OR]: 1.017; 95% CI: 1.010–1.025), higher income (OR: 2.385; 95% CI: 1.735–3.277) and better self-reported health status (OR: 6.691; 95% CI: 3.928–11.396).
•
Cancer patients with older age, higher income and better health status were more likely to be satisfied with the outpatient care they received.
•
The biggest area for potential improvement of patient satisfaction seems to be related to the time spent with healthcare providers.
Acknowledgments
This study was based on MEPS datasets for the years 2011, 2013, 2015 and 2017.
Financial & competing interests disclosure
The author has no relevant affiliations or financial involvement with any organization or entity with a financial interest in or financial conflict with the subject matter or materials discussed in the manuscript. This includes employment, consultancies, honoraria, stock ownership or options, expert testimony, grants or patents received or pending, or royalties.
No writing assistance was utilized in the production of this manuscript.
References
Papers of special note have been highlighted as: • of interest
1.
Vardy J, Tannock IF. Quality of cancer care. Ann. Oncol. 15(7), 1001–1006 (2004).
2.
Hess LM, Pohl G. Perspectives of quality care in cancer treatment: a review of the literature. Am. Health Drug Benefits 6(6), 321–329 (2013).
3.
Colosia AD, Peltz G, Pohl G et al. A review and characterization of the various perceptions of quality cancer care. Cancer 117(5), 884–896 (2011).
4.
Kim P. Cost of cancer care: the patient perspective. J. Clin. Oncol. 25(2), 228–232 (2007).
5.
Bridge E, Conn LG, Dhanju S, Singh S, Moody L. The patient experience of ambulatory cancer treatment: a descriptive study. Curr. Oncol. 26(4), e482–e493 (2019).
6.
Roydhouse JK, Gutman R, Keating NL, Mor V, Wilson IB. Differences between proxy and patient assessments of cancer care experiences and quality ratings. Health Serv. Res. 53(2), 919–943 (2018).
7.
Agency for Healthcare Research and Quality. Medical expenditure panel survey (2020). https://meps.ahrq.gov/mepsweb/about_meps/survey_back.jsp
8.
Levine DM, Landon BE, Linder JA. Quality and experience of outpatient care in the United States for adults with or without primary care. JAMA Intern. Med. 179(3), 363–372 (2019).
• Reviews the impact of primary care on patient experience.
9.
Levine DM, Linder JA, Landon BE. The quality of outpatient care delivered to adults in the United States, 2002 to 2013. JAMA Intern. Med. 176(12), 1778–1790 (2016).
• Reviews quality of outpatient care in the USA.
10.
Weeks JC, Catalano PJ, Cronin A et al. Patients' expectations about effects of chemotherapy for advanced cancer. N. Engl. J. Med. 367(17), 1616–1625 (2012).
11.
Abdel-Rahman O. Socioeconomic predictors of suicide risk among cancer patients in the United States: a population-based study. Cancer Epidemiol. 63, 101601 (2019).
12.
Abdel-Rahman O. Outcomes of non-metastatic colon cancer patients in relationship to socioeconomic status: an analysis of SEER census tract-level socioeconomic database. Int. J. Clin. Oncol. 24(12), 1582–1587 (2019).
13.
Abdel-Rahman O. Impact of NCI Socioeconomic Index on the outcomes of nonmetastatic breast cancer patients: analysis of SEER Census Tract-Level Socioeconomic Database. Clin. Breast Cancer 19(6), e717–e722 (2019).
14.
Lis CG, Rodeghier M, Gupta D. Distribution and determinants of patient satisfaction in oncology: a review of the literature. Patient Prefer. Adherence 3, 287–304 (2009).
15.
Sandoval GA, Brown AD, Sullivan T, Green E. Factors that influence cancer patients' overall perceptions of the quality of care. Int. J. Qual. Health Care 18(4), 266–274 (2006).
Information & Authors
Information
Published In
Pages: 959 - 967
PubMed: 32965140
Copyright
© 2020 Future Medicine Ltd.
History
Received: 23 June 2020
Accepted: 3 August 2020
Published online: 23 September 2020
Keywords:
Topics
Authors
Metrics & Citations
Metrics
Article Usage
Article usage data only available from February 2023. Historical article usage data, showing the number of article downloads, is available upon request.
Citations
How to Cite
Experiences of cancer patients with outpatient care in the USA: a population-based study. (2020) Journal of Comparative Effectiveness Research. DOI: 10.2217/cer-2020-0124
Export citation
Select the citation format you wish to export for this article or chapter.