Impact of socioeconomic status on presentation, treatment and outcomes of patients with pancreatic cancer
Publication: Journal of Comparative Effectiveness Research
Abstract
Objective: To assess the impact of socioeconomic status (SES) on the patterns of care and outcomes of patients with pancreatic cancer. Materials & methods: Surveillance, Epidemiology and End Results specialized SES registry has been accessed and patients with pancreatic cancer diagnosed (2000–2015) were evaluated. The following SES variables were included: employment percentage, percent of people above the poverty line, percent of people identified as working-class, educational level, median rent, median household value and median household income. Within this SES registry, patients were classified according to their census-tract SES into three groups (where group-1 represents the lowest SES category and group-3 represents the highest SES category). Multivariable logistic regression analysis was used to assess the impact of SES on access to surgical resection and multivariable Cox regression analysis was used to assess the impact of SES on pancreatic cancer-specific survival. Kaplan–Meier survival estimates were also used to compare overall survival (OS) outcomes according to SES. Results: A total of 83,902 pancreatic cancer patients were included in the current analysis. Within multivariable logistic regression analysis among patients with a localized/regional disease, patients with lower SES were less likely to undergo surgical resection for pancreatic cancer (odds ratio: 0.719; 95% CI: 0.673–0.767; p < 0.001). Among patients with a localized/regional disease who underwent surgical resection, patients with higher SES have better OS (median OS for group-3: 20.0 vs 17.0 months for group-1; p < 0.001). Moreover, patients with lower SES have worse pancreatic cancer-specific survival compared with patients with higher SES: (hazard ratio for group-1 vs group-3: 1.212; 95% CI: 1.135–1.295; p < 0.001). Conclusion: Poor neighborhood SES is associated with more advanced disease at presentation, less probability of surgical resection and even poorer outcomes after surgical resection.
Socioeconomic status (SES) has been shown to play an important role in health and disease [1,2]. This is particularly relevant among cancer patients where personal and area-based socioeconomic factors have been shown to alter the outcomes of this disease [3,4].
Pancreatic cancer represents one of the most aggressive solid tumors with unfortunately very minimal improvement in survival outcomes over the past three decades [5]. Many studies have evaluated the impact of SES on the outcomes of pancreatic cancer patients; however, there was generally a lack of standardized assessment of SES within these studies, with many of them focusing only on personal characteristics like race and marital status without proper attention to other socioeconomic factors like employment, income and educational status [6,7]. Additionally, the impact of neighborhood-based socioeconomic factors was generally under-evaluated in many of these studies.
In order to address the challenge resulting from lack of dedicated SES registries for cancer patients as well as lack of a standardized comprehensive tool to assess SES, Surveillance, Epidemiology and End Results (SEER) database developed a dedicated registry incorporating baseline clinicopathological information about cancer patients as well as census tract-based socioeconomic information about their neighborhoods. This registry should provide an excellent opportunity to study the interaction between neighborhood SES and outcomes of pancreatic cancer patients.
Results of this analysis should inform healthcare policy decisions; particularly with regards to ensuring equitable access to cancer care among socioeconomically disadvantaged and vulnerable groups of cancer patients.
Objective
To assess the impact of SES on the patterns of care and outcomes of patients with pancreatic cancer.
Materials & methods
SEER census-tract socioeconomic database
In an effort to standardize the way neighborhood SES is reported within the SEER database, a specialized registry has been developed [8]. Based on several parameters, a composite score was produced in this registry to indicate SES. These parameters are employment percentage, percent of people above the poverty line, percent of people identified as working-class, educational level, median rent, median household value and median household income. This scoring system was developed and validated by Yost et al. and Yu et al. [9,10]. Educational level was provided as per the work of Liu et al. [11]. Additional information about data linkage for this registry was detailed elsewhere [12]. As an output of this scoring system, patients will be categorized into three SES categories according to this score (where group 3 represents the highest SES category and group 1 represents the lowest SES category). The SES indices are calculated for 2000–2015 using data from the 2000 US Decennial Census long form survey and a series of American Community Survey 5-year estimates from 2006 to 2016. The indices are then linked to cancer cases at the census tract level by matching the survey year with the cancer diagnosis year. It has to be noted that SES is an aggregate, neighborhood-based measure that is predictive but may not actually represent the patient’s true SES.
Cohort selection
The following eligibility criteria were used to select patients for the current study: patients were included in the SES specialized SEER database; patients have microscopically confirmed pancreatic adenocarcinoma diagnosis; patients were diagnosed (2000–2015); complete information about SES group for each patient. For patients with more than one primary pancreatic carcinoma, first tumor was only included.
Data collection
The following data were extracted from each included patient where available: age at diagnosis, race/ethnicity, sex, stage at diagnosis (using SEER summary stages: localized, regional and distant), location within the pancreas, treatment with surgery, chemotherapy and/or radiation therapy and SES group. For the sake of the current study, any reference in the current study to surgical resection would mean oncologic resection rather than limited resection or ablation. SEER staging system was used to avoid possible confusion from the changes in the TNM staging system across the duration of the study (2000–2015).
End points of the current study included overall survival (OS) and pancreatic cancer-specific survival. OS was defined as the time from pancreatic cancer diagnosis till death (of any cause) and pancreatic cancer-specific survival was defined as the time from pancreatic cancer diagnosis till death due to pancreatic cancer. Follow-up for included patients continued until the cutoff of this database (December 2015).
Statistical analysis
Chi-squared testing was initially used to compare the distribution of baseline and treatment characteristics according to the SES group. Multivariable logistic regression analysis was then used to evaluate factors potentially predicting the use of surgery. This analysis was restricted for patients with a localized/regional disease only and it was adjusted for all the available baseline characteristics including age at diagnosis, sex and race, location of the primary tumor, SES group and stage.
Kaplan–Meier analysis was then used to compare OS outcomes of patients with a localized/regional disease who underwent surgical resection according to the SES group. Multivariable Cox regression analysis was then used to assess the impact of SES group on pancreatic cancer-specific survival among the same subgroup of patients (patients with localized/regional disease who underwent surgical resection). This multivariable analysis was adjusted for all baseline characteristics as above. Chemotherapy and radiotherapy were not included in this multivariable analysis because of uncertainty surrounding the reporting of chemotherapy and radiotherapy in SEER database as well as the absence of technical details (e.g., dose and schedule) for both modalities.
The reason for restricting survival analyses to surgically resected patients only is to partially mitigate the impact of the absence of comorbidity information on the survival analyses (patients with significant comorbidities/poor performance status are less likely to be offered a surgical for pancreatic cancer). All the above statistical analyses were conducted by SPSS software (version 20.0, IBM, NY, USA).
Results
Patients’ characteristics
A total of 83,902 patients fulfilled the eligibility criteria and were included in the current analysis. Comparing the three SES groups together, patients with group 3 SES (highest group) were more likely to have older age (p < 0.001), male sex (p < 0.001), white race (p < 0.001) and less distant disease (p < 0.001). They were also more likely to be treated with surgery (p < 0.001), chemotherapy (p < 0.001) and/or radiation therapy (p < 0.001) (Table 1).
| Parameter | Group 1 (23,941 patients) | Group 2 (28,380 patients) | Group 3 (31,581 patients) | p-value |
|---|---|---|---|---|
| Age – <40 years – 40–69 years – ≥70 years | 237 (1%) 12,962 (54.1%) 10,743 (44.9%) | 215 (0.8%) 14,011 (49.4%) 14,157 (49.9%) | 189 (0.6%) 15,023 (47.6%) 16,373 (51.8%) | <0.001 |
| Sex – Male – Female | 12,150 (50.7%) 11,791 (49.3%) | 14,434 (50.9%) 13,946 (49.1%) | 16,667 (52.8%) 14,914 (47.2%) | <0.001 |
| Race – White non-Hispanic – Black non-Hispanic – Hispanic – Asian-Pacific Islander – American Indian – Unknown | 13,585 (56.8%) 5399 (22.6%) 3752 (15.7%) 1005 (4.2%) 171 (0.7%) 29 (0.1%) | 20,965 (73.9%) 2546 (9%) 2837 (10%) 1885 (6.6%) 108 (0.4%) 39 (0.1%) | 25,490 (80.7%) 1307 (4.1%) 1897 (6%) 2774 (8.8%) 74 (0.2%) 39 (0.1%) | <0.001 |
| Location – Head – Body – Tail – Other specified parts – Overlapping lesions – Pancreas, NOS | 12,173 (50.8%) 2730 (11.4%) 2884 (12%) 450 (2%) 1663 (6.9%) 4041 (16.9%) | 14,483 (51%) 3326 (11.7%) 3400 (12%) 534 (1.9%) 2152 (7.6%) 4485 (15.8%) | 15,535 (49.2%) 4089 (12.9%) 4019 (12.7%) 695 (2.2%) 2470 (7.8%) 4773 (15.1%) | <0.001 |
| Stage – Localized – Regional – Distant – Unknown | 1870 (7.8%) 7020 (29.3%) 13,998 (58.5%) 1053 (4.4%) | 1982 (7%) 8796 (31%) 16,404 (57.8%) 1198 (4.2%) | 2030 (6.4%) 10,043 (31.8%) 18,283 (57.9%) 1225 (3.9%) | <0.001 |
| Surgery – None – Limited destruction/excision – Oncological resection – Unknown | 20,813 (86.9%) 56 (0.2%) 2723 (11.4%) 349 (1.5%) | 24,457 (86.2%) 73 (0.3%) 3616 (12.7%) 234 (0.8%) | 26,742 (84.7%) 79 (0.3%) 4500 (14.3%) 260 (0.8%) | <0.001 |
| Chemotherapy – Yes – No/unknown | 11,203 (46.8%) 12,738 (53.1%) | 14,553 (51.3%) 13,827 (48.7%) | 17,935 (56.8%) 13,646 (43.2%) | <0.001 |
| Radiotherapy – Yes – No/unknown | 3786 (15.8%) 20155 (84.2%) | 4829 (17%) 23551 (83%) | 5509 (17.4%) 26072 (82.6%) | <0.001 |
†
The following SES variables were included: employment percentage, percent of people above the poverty line, percent of people identified as working-class, educational level, median rent, median household value and median household income.
SES: Socioeconomic status.
Mean follow-up for the entire study cohort is 8.9 months (standard deviation [SD]: 15.10) and for the sub-cohort of patients with a localized/regional disease who underwent resection is 25.74 months (SD: 29.39).
Predictors of surgical resection among patients with localized/regional disease
Multivariable logistic regression analysis was conducted to further elaborate on the impact of SES on referral to surgical resection among patients with localized/regional pancreatic cancer. Within this multivariable analysis, patients with lower SES were less likely to undergo surgical resection for pancreatic cancer (odds ratio: 0.719; 95% CI: 0.673–0.767; p < 0.001; Table 2).
| Parameter | OR (95% CI) | p-value |
|---|---|---|
| Socioeconomic group – Group 3 – Group 1 – Group 2 | Reference 0.719 (0.673–0.767) 0.835 (0.788–0.886) | <0.001 <0.001 |
| Sex – Female – Male | Reference 1.001 (0.952–1.052) | 0.973 |
| Race/ethnicity‡ – White non-Hispanic – Black non-Hispanic – Hispanic | Reference 0.768 (0.702–0.839) 0.808 (0.740–0.883) | <0.001 <0.001 |
| Location‡ – Head – Body – Tail | Reference 0.400 (0.362–0.442) 2.418 (2.159–2.156) | <0.001 <0.001 |
| Stage – Regional – Localized | Reference 0.576 (0.536–0.618) | <0.001 |
| Age – 40–69 years – <40 years – ≥70 years | Reference 1.811 (1.339–2.448) 0.490 (0.466–0.516) | <0.001 <0.001 |
†
This was adjusted for age at diagnosis, sex, and race, location of the primary tumor, SES group and stage.
‡
All racial and location subgroups were included in the analysis but only the three biggest subgroups were reported here.
OR: Odds ratio; SES: Socioeconomic status.
Survival analyses among patients with localized/regional disease treated with surgical resection
Kaplan–Meier survival analysis was conducted to compare OS outcomes among surgically treated localized/regional pancreatic cancer patients. Patients with higher SES have better OS (median OS for group-3: 20.0 months vs 17.0 months for group-1; p < 0.001; Figure 1).
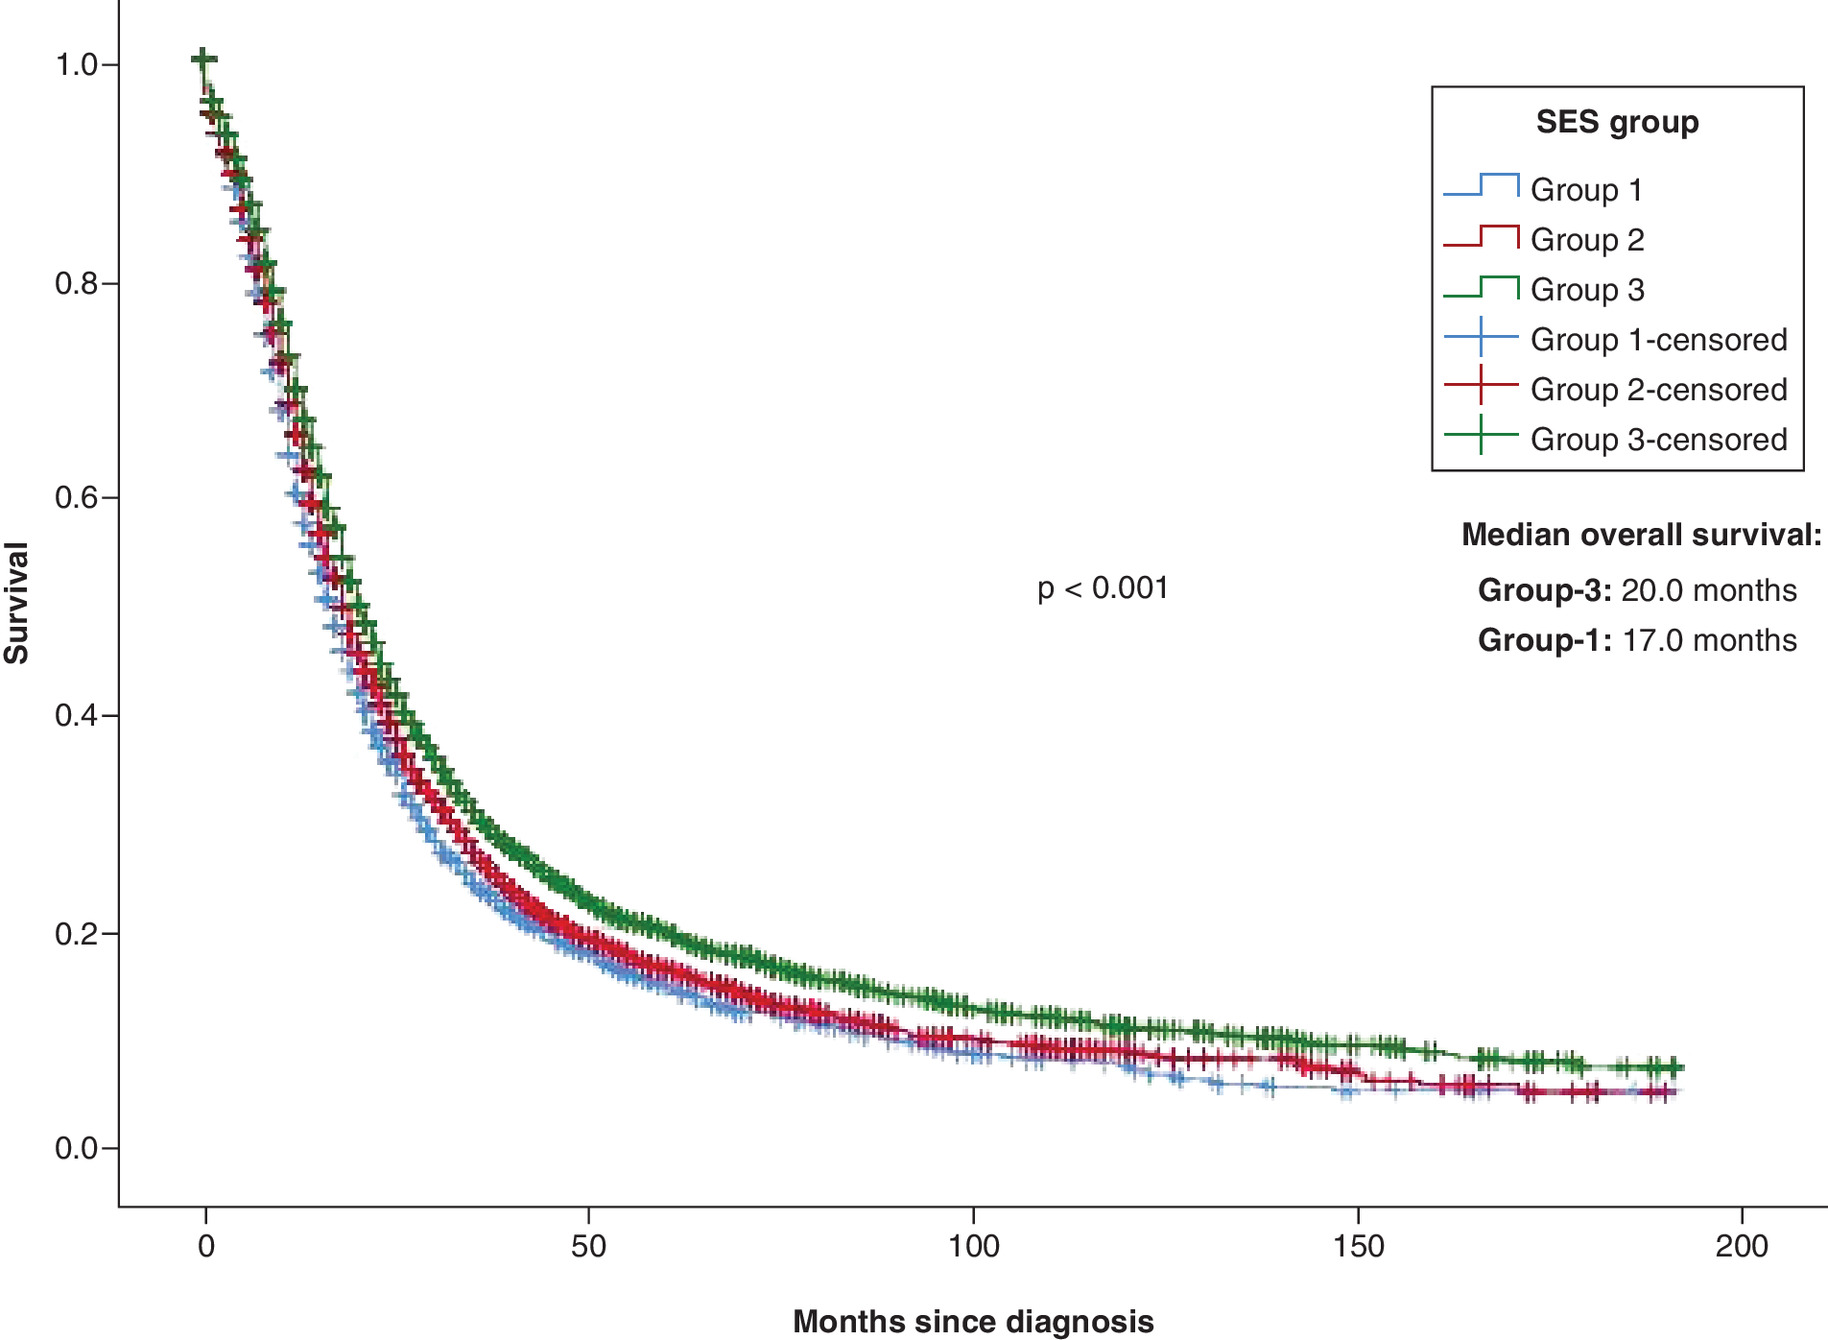
Figure 1. Kaplan-Meier survival estimates according to socioeconomic status.
SES: Socioeconomic status.
Multivariable Cox regression analysis was then used to evaluate the impact of SES on pancreatic cancer-specific survival among patients with a localized/regional disease treated with surgical resection. Patients with lower SES have worse pancreatic cancer-specific survival compared with patients with higher SES: (hazard ratio for group-1 vs group-3: 1.212; 95% CI: 1.135–1.295; p < 0.001; Table 3).
| Parameter | HR (95% CI) | p-value |
|---|---|---|
| Socioeconomic group – Group 3 – Group 1 – Group 2 | Reference 1.212 (1.135–1.295) 1.130 (1.066–1.197) | <0.001 <0.001 |
| Sex – Female – Male | Reference 0.962 (0.915–1.012) | 0.132 |
| Race/ethnicity‡ – White non-Hispanic – Black non-Hispanic – Hispanic | Reference 1.017 (0.928–1.115) 1.018 (0.927–1.117) | 0.712 0.715 |
| Location‡ – Head – Body – Tail | Reference 0.877 (0.779–0.988) 0.892 (0.805–0.988) | 0.030 0.029 |
| Stage – Regional – Localized | Reference 0.505 (0.463–0.551) | <0.001 |
| Age – 40–69 years – <40 years – ≥70 years | Reference 0.691 (0.522–0.913) 1.240 (1.178–1.305) | 0.009 <0.001 |
†
This was adjusted for age at diagnosis, sex, and race, location of the primary tumor, SES group and stage.
‡
All racial and location subgroups were included in the analysis but only the three biggest subgroups were reported here.
HR: Hazard ratio; SES: Socioeconomic status.
Pancreatic cancer-specific survival analyses among clinically defined subgroups of localized/regional disease patients treated with surgical resection
Multivariable Cox regression analyses were further conducted among clinically defined patients' subgroups according to race and stage. When stratified by race/ethnicity, SES was most powerful in predicting the outcomes of non-Hispanic white patients (hazard ratio for group-1 vs group-3: 1.207; 95% CI: 1.118–1.302; p < 0.001); while it played no role in the prediction of outcomes of Hispanic patients (hazard ratio for group-1 vs group-3: 1.055; 95% CI: 0.844–1.317; p = 0.640; Table 4). When the analyses were stratified by stage, the impact of SES was clear among both localized and regional disease patients. Hazard ratio for group-1 versus group-3 among localized disease patients was 1.283; 95% CI: 1.040–1.583; p = 0.020; while hazard ratio for group-1 versus group-3 among regional disease patients was 1.208; 95% CI: 1.127–1.295; p < 0.001 (Table 5; Figure 2).
| Race | Socioeconomic group† | HR (95% CI) | p-value |
|---|---|---|---|
| White non-Hispanic | Group 3 Group 1 Group 2 | Reference 1.207 (1.118–1.302) 1.133 (1.062–1.208) | <0.001 <0.001 |
| Black non-Hispanic | Group 3 Group 1 Group 2 | Reference 1.415 (1.102–1.817) 1.333 (1.018–1.746) | 0.006 0.037 |
| Hispanic | Group 3 Group 1 Group 2 | Reference 1.055 (0.844–1.317) 0.957 (0.765–1.198) | 0.640 0.703 |
†
Multivariate Cox regression analysis adjusted for age, stage, sex and location.
HR: Hazard ratio.
| Race | Socioeconomic group† | HR (95% CI) | p-value |
|---|---|---|---|
| Localized disease | Group 3 Group 1 Group 2 | Reference 1.283 (1.040–1.583) 1.329 (1.095–1.614) | 0.020 0.004 |
| Regional disease | Group 3 Group 1 Group 2 | Reference 1.208 (1.127–1.295) 1.113 (1.048–1.183) | <0.001 0.001 |
†
Multivariate Cox regression analysis adjusted for age, race, sex and location.
HR: Hazard ratio.
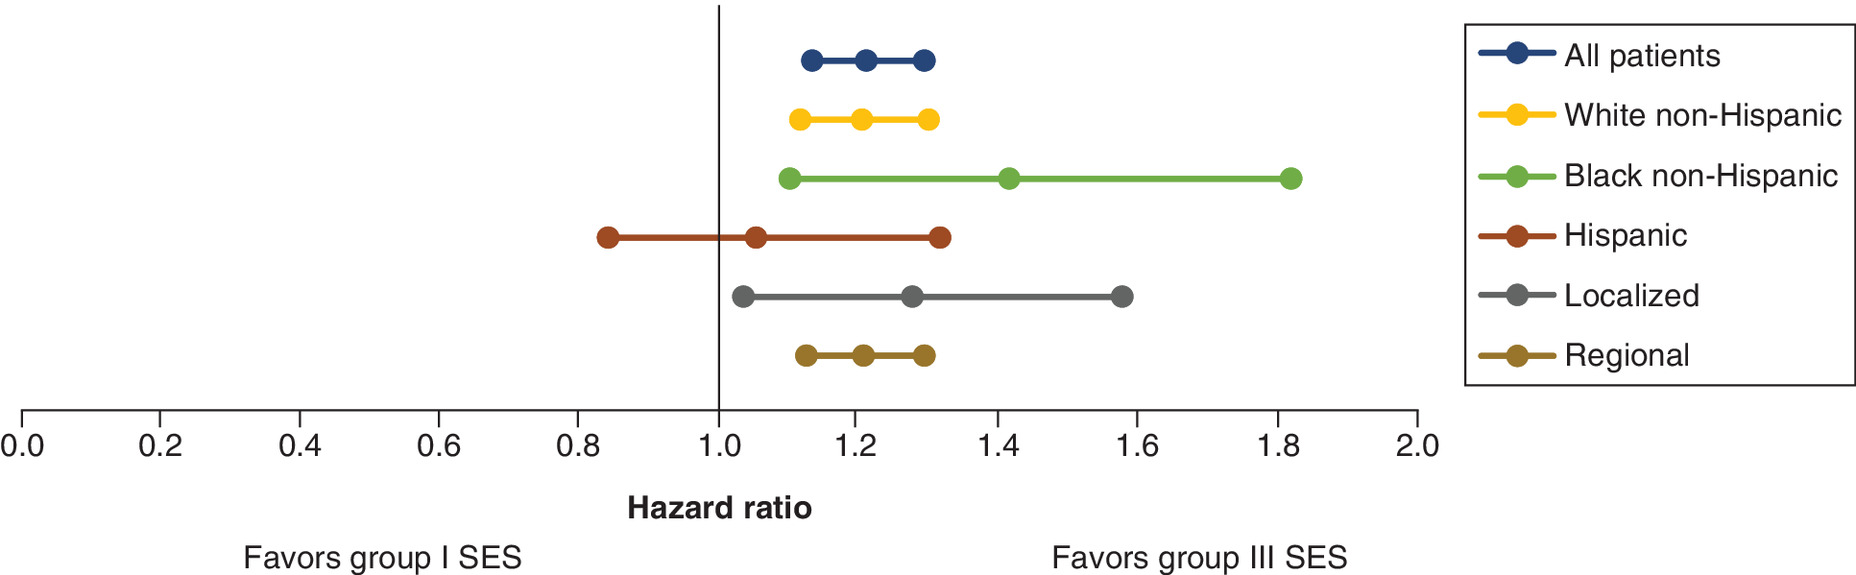
Figure 2. Impact of socioeconomic status (group 1 versus group III) on pancreatic cancer-specific survival.
Three dots in each line represent hazard ratio with 95% CIs.
SES: Socioeconomic status.
Discussion
The current study evaluates the impact of SES on the presentation of patients with pancreatic adenocarcinoma using a validated census-tract SES database. It shows that poor neighborhood SES is associated with more advanced disease at presentation, less probability of surgical resection, chemotherapy and radiation therapy; and even poorer outcomes after surgical resection.
It is interesting to note that although patients with higher SES were more likely to have older age at diagnosis, they were also more likely to be offered surgical resection. Although this might be partially explained by yet unknown comorbidity differences between different SES groups, this also might indicate a potential disparity in the access to surgical resection based on SES. It is also notable that regional disease patients were more likely to have surgical resection in the multivariable logistic regression analysis (as compared with localized disease patients). Possible reasons for this observation might include the fact that staging of patients included in the current study was based on pathological grounds in surgically treated patients (versus clinical grounds in nonsurgically treated patients). Thus, there was a possibility of upstaging among surgically treated patients. It is interesting also to note that Black race (compared with White race) was associated with lower likelihood of undergoing surgical resection. Moreover, race was not associated with a difference in survival outcomes when adjusted for SES.
Several previously published population-based studies have evaluated the impact of SES on the outcomes of pancreatic cancer patients, most of them focused on personal socioeconomic factors (like race, marital status or insurance status) [13,14]. A couple of previous studies evaluated neighborhood SES parameters using state-specific cancer registries in the US [15,16]. The current study provides a national overview (through the SEER database) of the impact of neighborhood SES parameters as a surrogate marker to the social determinants of health in individual patients and this has been done through a validated tool.
The current study has several limitations that need to be recognized; foremost, the absence of comorbidity and performance score information which might have affected treatment selection and outcomes. It should be noted also that prior studies have suggested a higher rate of noncancer comorbidities among patients with low SES [17]. To neutralize this confounding effect, survival analyses were limited to patients who have undergone surgical resection (to ensure patients with significant noncancer morbidity are not included in the survival analyses). Moreover, both overall and pancreatic cancer-specific survivals were evaluated in the current study. While OS may be affected by non-cancer mortality, cancer-specific survival is less likely to be affected by noncancer mortality. Second, the absence of detailed information about perioperative systemic or local treatments the patients might have received is another confounder in the current analysis. Third, it has also to be remembered that the results of the current study are most applicable to patients treated in the US. Whether these results can be applied to other healthcare settings/countries is unknown. Prior studies from a number of European countries have suggested similar impact of SES on outcomes of pancreatic cancer patients [18,19]. That being said, comparing studies conducted in Western European countries (where all residents will receive the same level of care regardless of SES) with studies conducted in the US (where healthcare access depends largely on SES) might be tricky. Fourth, the study is based on group SES assessment (neighborhood); applying the results to individual SES assessments might be associated with the risk of ecological fallacy (this fallacy happen when inferences about individuals are derived from inferences about their groups) [20]. This should be taken into consideration when interpreting the results of the current analysis.
These limitations need to be viewed in light of the clear strengths of the current study; most notably, the reliance on a well-designed, dedicated database for SES which follows the rigorous quality control procedures of the SEER database.
The difference in median survival between patients with low versus patients with high SES in the current study is remarkable. This is in line with prior studies showing significant impact for SES on the survival of other solid tumors [21–23]. Together, these studies call for an action to minimize disparities in cancer care. Health policymakers should prioritize strategies which address cancer care among the underserved and vulnerable populations in the society. That being said, structural problems within the healthcare insurance system within the US needs to be corrected in order for these strategies to work.
Conclusion
Poor neighborhood SES is associated with more advanced disease at presentation, less probability of surgical resection and even poorer outcomes after surgical resection.
•
Surveillance, Epidemiology and End Results specialized socioeconomic status (SES) registry has been accessed and patients with pancreatic cancer diagnosed (2000–2015) were evaluated.
•
The following SES variables were included: employment percentage, percent of people above the poverty line, percent of people identified as working-class, educational level, median rent, median household value and median household income.
•
Within this SES registry, patients were classified according to their census-tract SES into three groups (where group-1 represents the lowest SES category and group-3 represents the highest SES category).
•
Multivariable logistic regression analysis was used to assess the impact of SES on access to surgical resection, and multivariable Cox regression analysis was used to assess the impact of SES on pancreatic cancer-specific survival.
•
Kaplan–Meier survival estimates were also used to compare overall survival (OS) outcomes according to SES.
•
A total of 83,902 pancreatic cancer patients were included in the current analysis.
•
Within multivariable logistic regression analysis among patients with a localized/regional disease, patients with lower SES were less likely to undergo surgical resection for pancreatic cancer (odds ratio: 0.719; 95% CI: 0.673–0.767; p < 0.001).
•
Among patients with a localized/regional disease who underwent surgical resection, patients with higher SES have better OS (median OS for group-3: 20.0 vs 17.0 months for group-1; p < 0.001).
•
Moreover, patients with lower SES have worse pancreatic cancer-specific survival compared with patients with higher SES: (hazard ratio for group-1 vs group-3: 1.212; 95% CI: 1.135–1.295; p < 0.001).
Acknowledgments
This study is based on the novel SEER specialized database for census-tract level SES data.
Financial & competing interests disclosure
The author has no relevant affiliations or financial involvement with any organization or entity with a financial interest in or financial conflict with the subject matter or materials discussed in the manuscript. This includes employment, consultancies, honoraria, stock ownership or options, expert testimony, grants or patents received or pending, or royalties.
No writing assistance was utilized in the production of this manuscript.
Ethical conduct of research
Ethical approval: All procedures performed in studies involving human participants were following the ethical standards of the institutional and/or national research committee and with the 1964 Helsinki declaration and its later amendments or comparable ethical standards. Informed consent: as this study is based on a publicly available database without identifying patient information, informed consent was not needed.
References
Papers of special note have been highlighted as: • of interest
1.
Clegg LX, Reichman ME, Miller BA et al. Impact of socioeconomic status on cancer incidence and stage at diagnosis: selected findings from the surveillance, epidemiology, and end results: National Longitudinal Mortality Study. Cancer Causes Control 20(4), 417–435 (2009).
2.
Link BG, Phelan JC. Understanding sociodemographic differences in health–the role of fundamental social causes. Am. J. Public Health 86(4), 471–473 (1996).
3.
Clegg LX, Reichman ME, Miller BA et al. Impact of socioeconomic status on cancer incidence and stage at diagnosis: selected findings from the surveillance, epidemiology, and end results: National Longitudinal Mortality Study. Cancer Causes Control 20(4), 417–435 (2009).
4.
Abdel-Rahman O. Socioeconomic predictors of suicide risk among cancer patients in the United States: a population-based study. Cancer Epidemiol. 63, 101601 (2019).
5.
Saad AM, Turk T, Al-Husseini MJ, Abdel-Rahman O. Trends in pancreatic adenocarcinoma incidence and mortality in the United States in the last four decades; a SEER-based study. BMC Cancer 18(1), 688–688 (2018).
6.
Shapiro M, Chen Q, Huang Q et al. Associations of socioeconomic variables with resection, stage, and survival in patients with early-stage pancreatic cancer. JAMA Surg. 151(4), 338–345 (2016).
7.
Kagedan DJ, Abraham L, Goyert N et al. Beyond the dollar: influence of sociodemographic marginalization on surgical resection, adjuvant therapy, and survival in patients with pancreatic cancer. Cancer 122(20), 3175–3182 (2016).
8.
Surveillance, Epidemiology, and End Results (SEER) Program. SEER*Stat Database: Incidence - SEER 18 Regs excluding AK (with additional treatment fields), Nov 2017 Sub (2000–2015) <Vintage 2015 Pops by Race/Origin Tract 2000/2010 Mixed Geographies> - Linked To Census Tract Attributes - Time Dependent (2000–2015) – SEER 18 (excl AK) Census 2000/2010 Geographies with Index Field Quantiles, National Cancer Institute, DCCPS, Surveillance Research Program, released June 2018, based on the November 2017 submission (2018). www.seer.cancer.gov
9.
Yost K, Perkins C, Cohen R, Morris C, Wright W. Socioeconomic status and breast cancer incidence in California for different race/ethnic groups. Cancer Causes Control 12(8), 703–711 (2001).
10.
Yu M, Tatalovich Z, Gibson JT, Cronin KA. Using a composite index of socioeconomic status to investigate health disparities while protecting the confidentiality of cancer registry data. Cancer Causes Control 25(1), 81–92 (2014).
11.
Liu L, Deapen D, Bernstein L. Socioeconomic status and cancers of the female breast and reproductive organs: a comparison across racial/ethnic populations in Los Angeles County, California (United States). Cancer Causes Control 9(4), 369–380 (1998).
12.
Census Tract-level SES and Rurality Database (2000–2015) (2019). https://seer.cancer.gov/seerstat/databases/census-tract/index.html
13.
Murphy MM, Simons JP, Hill JS et al. Pancreatic resection: a key component to reducing racial disparities in pancreatic adenocarcinoma. Cancer 115(17), 3979–3990 (2009).
14.
Permuth JB, Clark Daly A, Jeong D et al. Racial and ethnic disparities in a state-wide registry of patients with pancreatic cancer and an exploratory investigation of cancer cachexia as a contributor to observed inequities. Cancer Med. 8(6), 3314–3324 (2019).
15.
Cheung MC, Yang R, Byrne MM, Solorzano CC, Nakeeb A, Koniaris LG. Are patients of low socioeconomic status receiving suboptimal management for pancreatic adenocarcinoma? Cancer 116(3), 723–733 (2010).
16.
Zell JA, Rhee JM, Ziogas A, Lipkin SM, Anton-Culver H. Race, socioeconomic status, treatment, and survival time among pancreatic cancer cases in California. Cancer Epidemiol. Biomarkers Prev. 16(3), 546–552 (2007).
17.
Louwman WJ, Aarts MJ, Houterman S, van Lenthe FJ, Coebergh JW, Janssen-Heijnen ML. A 50% higher prevalence of life-shortening chronic conditions among cancer patients with low socioeconomic status. Br. J. Cancer 103(11), 1742–1748 (2010).
18.
van Roest MH, van der Aa MA, van der Geest LG, de Jong KP. the impact of socioeconomic status, surgical resection and type of hospital on survival in patients with pancreatic cancer. A population-based study in The Netherlands. PLoS ONE 11(11), e0166449 (2016).
19.
Henson KE, Fry A, Lyratzopoulos G, Peake M, Roberts KJ, McPhail S. Sociodemographic variation in the use of chemotherapy and radiotherapy in patients with stage IV lung, oesophageal, stomach and pancreatic cancer: evidence from population-based data in England during 2013–2014. Br. J. Cancer 118(10), 1382–1390 (2018).
20.
Greenland S, Morgenstern H. Ecological bias, confounding, and effect modification. Int. J. Epidemiol. 18(1), 269–274 (1989).
21.
Abdel-Rahman O. Treatment choices and outcomes of non-metastatic hepatocellular carcinoma patients in relationship to neighborhood socioeconomic status: a population-based study. Int. J. Clin. Oncol. 25(5), 861–866 (2020).
22.
Abdel-Rahman O. Outcomes of non-metastatic colon cancer patients in relationship to socioeconomic status: an analysis of SEER census tract-level socioeconomic database. Int. J. Clin. Oncol. 24(12), 1582–1587 (2019).
• Reviews the impact of socioeconomic status on the outcomes of nonmetastatic colon cancer.
23.
Abdel-Rahman O. Impact of NCI Socioeconomic Index on the outcomes of nonmetastatic breast cancer patients: analysis of SEER Census Tract-Level Socioeconomic Database. Clin. Breast Cancer 19(6), e717–e722 (2019).
Information & Authors
Information
Published In
Pages: 1233 - 1241
PubMed: 33275039
Copyright
© 2020 Future Medicine Ltd.
History
Received: 11 May 2020
Accepted: 30 September 2020
Published online: 4 December 2020
Keywords:
Topics
Authors
Metrics & Citations
Metrics
Article Usage
Article usage data only available from February 2023. Historical article usage data, showing the number of article downloads, is available upon request.
Citations
How to Cite
Impact of socioeconomic status on presentation, treatment and outcomes of patients with pancreatic cancer. (2020) Journal of Comparative Effectiveness Research. DOI: 10.2217/cer-2020-0079
Export citation
Select the citation format you wish to export for this article or chapter.
Citing Literature
- Nanske C. Biesma, Lois A. Daamen, Marc G. Besselink, Geert A. Cirkel, Casper van Eijck, Bas Groot Koerkamp, Jan Willem.B. de Groot, Maartje Los, Judith de Vos-Geelen, Johanna W. Wilmink, Izaak Q. Molenaar, Lydia G. van der Geest, Hjalmar C. van Santvoort, The impact of lower household income and distance to hospital on treatment and survival in patients with localized pancreatic adenocarcinoma, European Journal of Cancer, 10.1016/j.ejca.2026.116956, 245, (116956), (2026).
- Omar Abdel-Rahman, Sunita Ghosh, Measuring the improvement in overall survival among patients with advanced gastroenteropancreatic neuroendocrine tumors over the past two decades, Scandinavian Journal of Gastroenterology, 10.1080/00365521.2026.2648052, (1-7), (2026).
- Omar Abdel-Rahman, Sunita Ghosh, Disparities in time to Treatment Initiation Among Patients with Major Types of Cancer in the United States, Journal of Racial and Ethnic Health Disparities, 10.1007/s40615-026-02847-w, (2026).
- Maite N.E. Liem, Mats D. Teeken, Mengyuan Ruan, George Molina, Geospatial variation in the treatment of medicare beneficiary pancreatic cancer patients: A SEER-Medicare cohort study, The American Journal of Surgery, 10.1016/j.amjsurg.2025.116684, 251, (116684), (2026).
- Abdullah Khalid, Ali Anjum Fazal, Manav Shah, Danielle DePeralta, Sepideh Gholami, Elliot Newman, Marcovalerio Melis, Matthew J. Weiss, Survival Disparities in Early‐Onset Pancreatic Cancer (EOPC): The Role of Socioeconomic Status and Healthcare Access, Journal of Surgical Oncology, 10.1002/jso.70148, 133, 3, (349-360), (2025).
- Devanshi D. Patel, Samantha Brashier, Andrew M. Fleming, Evan S. Glazer, Gabriela L. Aitken, Paxton V. Dickson, The Impact of Race and Socioeconomic Status on Management of Potentially Resectable Pancreatic Cancer: Analysis From a Metropolitan Area in the Southeast United States, The American Surgeon™, 10.1177/00031348251399190, 92, 5, (1498-1507), (2025).
- Alireza Hadipour, Sedighe Sadat Tabatabaei Far, Sahar Akrami, Bayati Mohsen, The role of political, economic and social factors on the burden of prevalent cancers in the world: A dynamic panel model, Payesh (Health Monitor) Journal, 10.61882/payesh.24.5.617, 24, 5, (617-625), (2025).
- Yoon Duk Hong, Angela B. Mariotto, Denise R. Lewis, Anne-Michelle Noone, Nadia Howlader, Steve Scoppa, Eric J. Feuer, Compliance With Recommendations of the Surveillance, Epidemiology, and End Results (SEER) Treatment Data Use Agreement, Medical Care, 10.1097/MLR.0000000000002218, 63, 12, (899-906), (2025).
- Shivam Chandra, Vivian Liang, Anthony V Coglianese, Steven R Bonomo, The Impact of Racial Disparities and Social Determinants of Health on Postoperative Outcomes After Pancreaticoduodenectomy (Whipple Procedure), Cureus, 10.7759/cureus.91855, (2025).
- Shreeja N. Patel, Joseph R. Habib, Daniel Brock Hewitt, Michael D. Kluger, Katherine Morgan, Ammar A. Javed, Christopher L. Wolfgang, Greg D. Sacks, The Impact of Social Determinants on Pancreatic Cancer Care in the United States, Cancers, 10.3390/cancers17121898, 17, 12, (1898), (2025).
- See more