Budget impacts associated with improving diagnosis and treatment of atrial fibrillation in high-risk stroke patients
Publication: Journal of Comparative Effectiveness Research
Abstract
Aim: Estimate the 3-year budget impact in England from 2016/17 of improving nonvalvular atrial fibrillation management in high-risk stroke patients. Materials & methods: The Academic Health Science Network’s AF Business Case Model was used to identify detection, protection (risk assessment and treatment initiation) and perfection (optimized treatment) gaps and to project the budget impact of closing these. Results: Closing all gaps over 3 years could prevent 27,550 strokes. Overall, perfection gap savings were £136,650,962 and protection gap savings were £58,146,171. Detection by screening in year one could cost £149,048,676, but with stroke-prevention savings would be £47,081,047 at 3 years. Thus, total potential savings were £194,797,133 and the cost-adjusted budget impact was £147,716,086. Conclusion: The detection and perfection gaps are key areas for investment.
Atrial fibrillation (AF) is the most common sustained cardiac arrhythmia, and incidence increases with advancing age. In England, prevalence is expected to rise as the population ages, making AF a continuing health priority [1]. People with AF are five times more likely than those without AF to have a stroke [2], approximately a third of ischemic strokes are associated with AF [3] and AF-related strokes have worse outcomes in terms of morbidity and mortality than non-AF strokes [4]. Treatment and loss of productivity due to acute stroke are estimated to cost the UK around £9 billion per year, with the current average total care plan cost being £23,000–£25,000 per patient [5]. In patients with AF, this cost is higher, as the adjusted independent increase in cost of having AF is £2173 (95% CI 91–4254; p = 0.041) [6]. Oral anticoagulants (OACs) are an established way to reduce the risk of stroke in patients with nonvalvular AF [7]. Two classes of OACs are available: vitamin K antagonists (VKAs; most commonly warfarin) and direct OACs (DOACs). Both classes are effective at reducing the risk of stroke and are cost-effective [7].
Over the past 10 years there has been a worldwide focus on improving the management of AF. In 2010, international guidelines were changed to encourage the use of OACs over antiplatelets and thresholds for use were lowered by changes to the CHA2DS2-VASc criteria to capture more patients at risk [6]. In 2014, the National Institute for Health and Care Excellence (NICE) updated its clinical guidelines for AF [7], and to underscore the risk of AF-related stroke added two new AF indicators to the Quality Outcomes Framework (QOF): the number of patients with CHA2DS2-VASc scores of 2 or more being treated with anticoagulation drug therapy; and the proportion of patients with AF in whom stroke risk has been stratified by the CHA2DS2-VASc score in the previous 12 months [8]. In the 2016 European guidelines, opportunistic screening by pulse palpation was recommended to improve identification of patients with silent AF [9].
The use of OACs has increased notably over the past 10–12 years, which has been associated with a reduction in AF-related stroke [10,11]. The rise in uptake has been attributed partly to the introduction of DOACs, which were licensed specifically for the prevention of stroke from 2012 onward [12–15]. Nevertheless, 1 year after NICE updated the AF guidelines in 2014, substantial gaps remained in the numbers of eligible patients with known AF being offered, started on, or maintained on appropriate OAC treatment compared with the number of patients with AF [16].
Along with highlighting AF risk, NICE set a goal of preventing an additional 8000 AF-related strokes per year, which was estimated to achieve a potential £95 million annual saving for the NHS [17]. In 2016, Public Health England (PHE) also set a national target to reduce the incidence of avoidable strokes by 5000 over 5 years [18]. The proposed strategy was to increase the proportion of known AF patients offered, started on and remaining on appropriate treatment from 78 to 89%; introduce regular systematic audits in all practices (using tools such as GRASP-AF [19]) to identify at-risk people not receiving an OAC or not optimally anticoagulated; increase opportunistic detection in line with expected prevalence; and strengthen and up-skill clinical leadership on AF.
Given the recognized gaps in care and the pressures facing the NHS, in 2017 Imperial College Health Partners developed the Academic Health Science Network’s (AHSN) AF Business Case Model (https://imperialcollegehealthpartners.com/af-budget-impact-model/), which allows users to perform a budget impact analysis for real-world AF care, from detection to treatment, and identify the most cost-efficient ways to reduce stroke risk at different points of this pathway. The model uses publicly available national (England) and local data on reported and projected prevalence of AF, AF management in primary and secondary care and anticoagulant treatment. It considers gaps in detection of AF, protection against AF by assessing risk and starting patients on recommended coagulation and the perfection of treatment by achieving maximum time in the therapeutic range (TTR). The model can be applied at national level and with increasing granularity through regional (sustainability and transformation partnerships [STPs] and clinical commissioning groups [CCGs]) and local (general practice [GP]) levels. In this paper we explain the model and illustrate how to use it, providing sample inputs and outputs. These may be changed to address the local circumstances of the user.
Methods
The AHSN AF Business Case Model evaluates the budget impact of addressing identified and modeled gaps in diagnosis (the detection gap), identifying patients at risk of stroke and starting OAC treatment (protection gaps 1 and 2) and optimizing OAC treatment to minimize stroke risk (the perfection gap; Panel 1).
•
Diagnosis of atrial fibrillation (detection gap)
•
Identification of patients at high risk of stroke by CHA2DS2-VASc assessment (protection gap 1)
•
High-risk patients started on adequate oral anticoagulation (protection gap 2)
•
Adherence to adequate anticoagulation and optimisation of medical treatment (perfection gap)
The GRASP-AF suite of audit tools [19] provides AF data that underpin key input assumptions made in NICE technology appraisals of OACs [12,13] and the NICE costing template for warfarin [7]. These data provide the default clinical (risks of stroke and bleeding) and cost inputs in the AHSN AF Business Case Model. However, it is possible for users to substitute their own data or those from other sources.
Prescriptions
The proportions of patients taking OACs who are receiving DOACs are identified within each CCG from the NHS Business Services Authority Medicines Optimisation CCG Dashboard, which is based on an analysis of prescribing. For this analysis, data were used for the period April to June 2016. The proportion of patients in each CCG identified as taking a DOAC was applied to the total number of anticoagulated patients, derived from QOF AF007, to calculate the actual numbers taking OACs and those taking DOACs. The difference was assumed to reflect the number of warfarin-treated patients.
Stroke care & outcomes
SSNAP provides real-time data collection, analysis and reporting on the quality and outcomes of stroke care [23].
Clinical outcomes
Clinical and management assumptions covering stroke risk, treatment, effectiveness and other aspects of care are made in the model. The default values are based on those used in the NICE OAC guidelines [7] and the NICE technology appraisals for dabigatran [12] and rivaroxaban [13] but may be changed. The baseline proportions of warfarin and DOACs were based on prescribing information in November 2016, and were 26.4 and 73.6%, respectively. For this analysis, we set the model assumptions to values that would enable us to assess the achievable impact if the detection, protection and perfection gaps were closed completely (Table 1). The key assumptions for clinical outcomes were the effectiveness of treatments. It was assumed that 60% of patients taking warfarin will not achieve their therapeutic goal (>65% of TTR) and 95% of people receiving a DOAC will be adequately controlled, based on anecdotal evidence.
| Model factor | Values used in this analysis |
|---|---|
| Clinical assumptions | |
| – Annual risk of stroke in untreated patients | 5.82% |
| – Annual risk of stroke in warfarin-treated patients | 2.09% |
| – Annual risk of stroke in DOAC-treated patients | 1.52% |
| – Annual risk of a major bleed in untreated patients | 0.49% |
| – Annual risk of a major bleed in warfarin-treated patients | 1.07% |
| – Annual risk of a major bleed in DOAC-treated patients | 1.02% |
| Effectiveness of anticoagulation | |
| – People currently treated with warfarin will not achieve their therapeutic goal (measured as >65% time in therapeutic range) | 60% |
| – People receiving DOACs will have adequately controlled coagulation | 95% |
| Intervention assumptions | |
| – Undiagnosed people with AF will be screened (detection gap) | 100% |
| – Patients diagnosed as having AF currently without a risk assessment will be assessed (protection gap 1) | 100% |
| – Untreated eligible patients will be initiated on anticoagulant therapy (protection gap 2) | 100% |
| – Eligible patients whose AF is currently inadequately controlled with an anticoagulant will have their treatment optimized (perfection gap) | 100% |
| – Inadequately treated patients will receive a DOAC | 90% |
| – Inadequately treated patients will remain on warfarin | 10% |
| – Duration over which interventions will be implemented | 12 months |
| Other assumptions | |
| – Costs of initiating OACs | Consistent with year 1 |
| – Risk of stroke in inadequately treated patients is the same risk as that in untreated patients | 100% |
AF: Atrial fibrillation; DOAC: Direct oral anticoagulant; OACs: Oral anticoagulants.
The number of strokes and bleeding events that would be expected at baseline and the number that might be prevented if the planned management changes were implemented were estimated by applying results from published literature to the simulated populations. The expected baseline stroke rate in the untreated proportion of the population (5.8% per year) was calculated based on results from an analysis of the US AF National Registry [24]. The baseline risk of a major bleed (0.49% per year) was taken from a meta-analysis of published antithrombotic studies in patients with AF [25]. The expected event rate if effective treatment were to be given to these currently untreated patients was then estimated with the relative risk reduction from published clinical studies of warfarin and DOACs, following the assumptions used by NICE in previously published technology assessments [12,13,25]. The difference between these two estimates was used to calculate the number of avoidable strokes and the additional number of bleeds expected.
Cost impact calculations
The model calculates the anticipated net cost impacts over 3 years for each gap, based on the current identified (‘visible’) and predicted (modeled) prevalence and patterns of OAC use (Figure 1). Rather than the model default assumption values of 50, 90, 80 and 80% for the detection gap, protection gap 1, protection gap 2 and perfection gap respectively, we set the assumptions to 100% to assess the impact of completely closing all gaps. The complete clinical inputs and assumptions applied for this analysis are shown in Table 1.
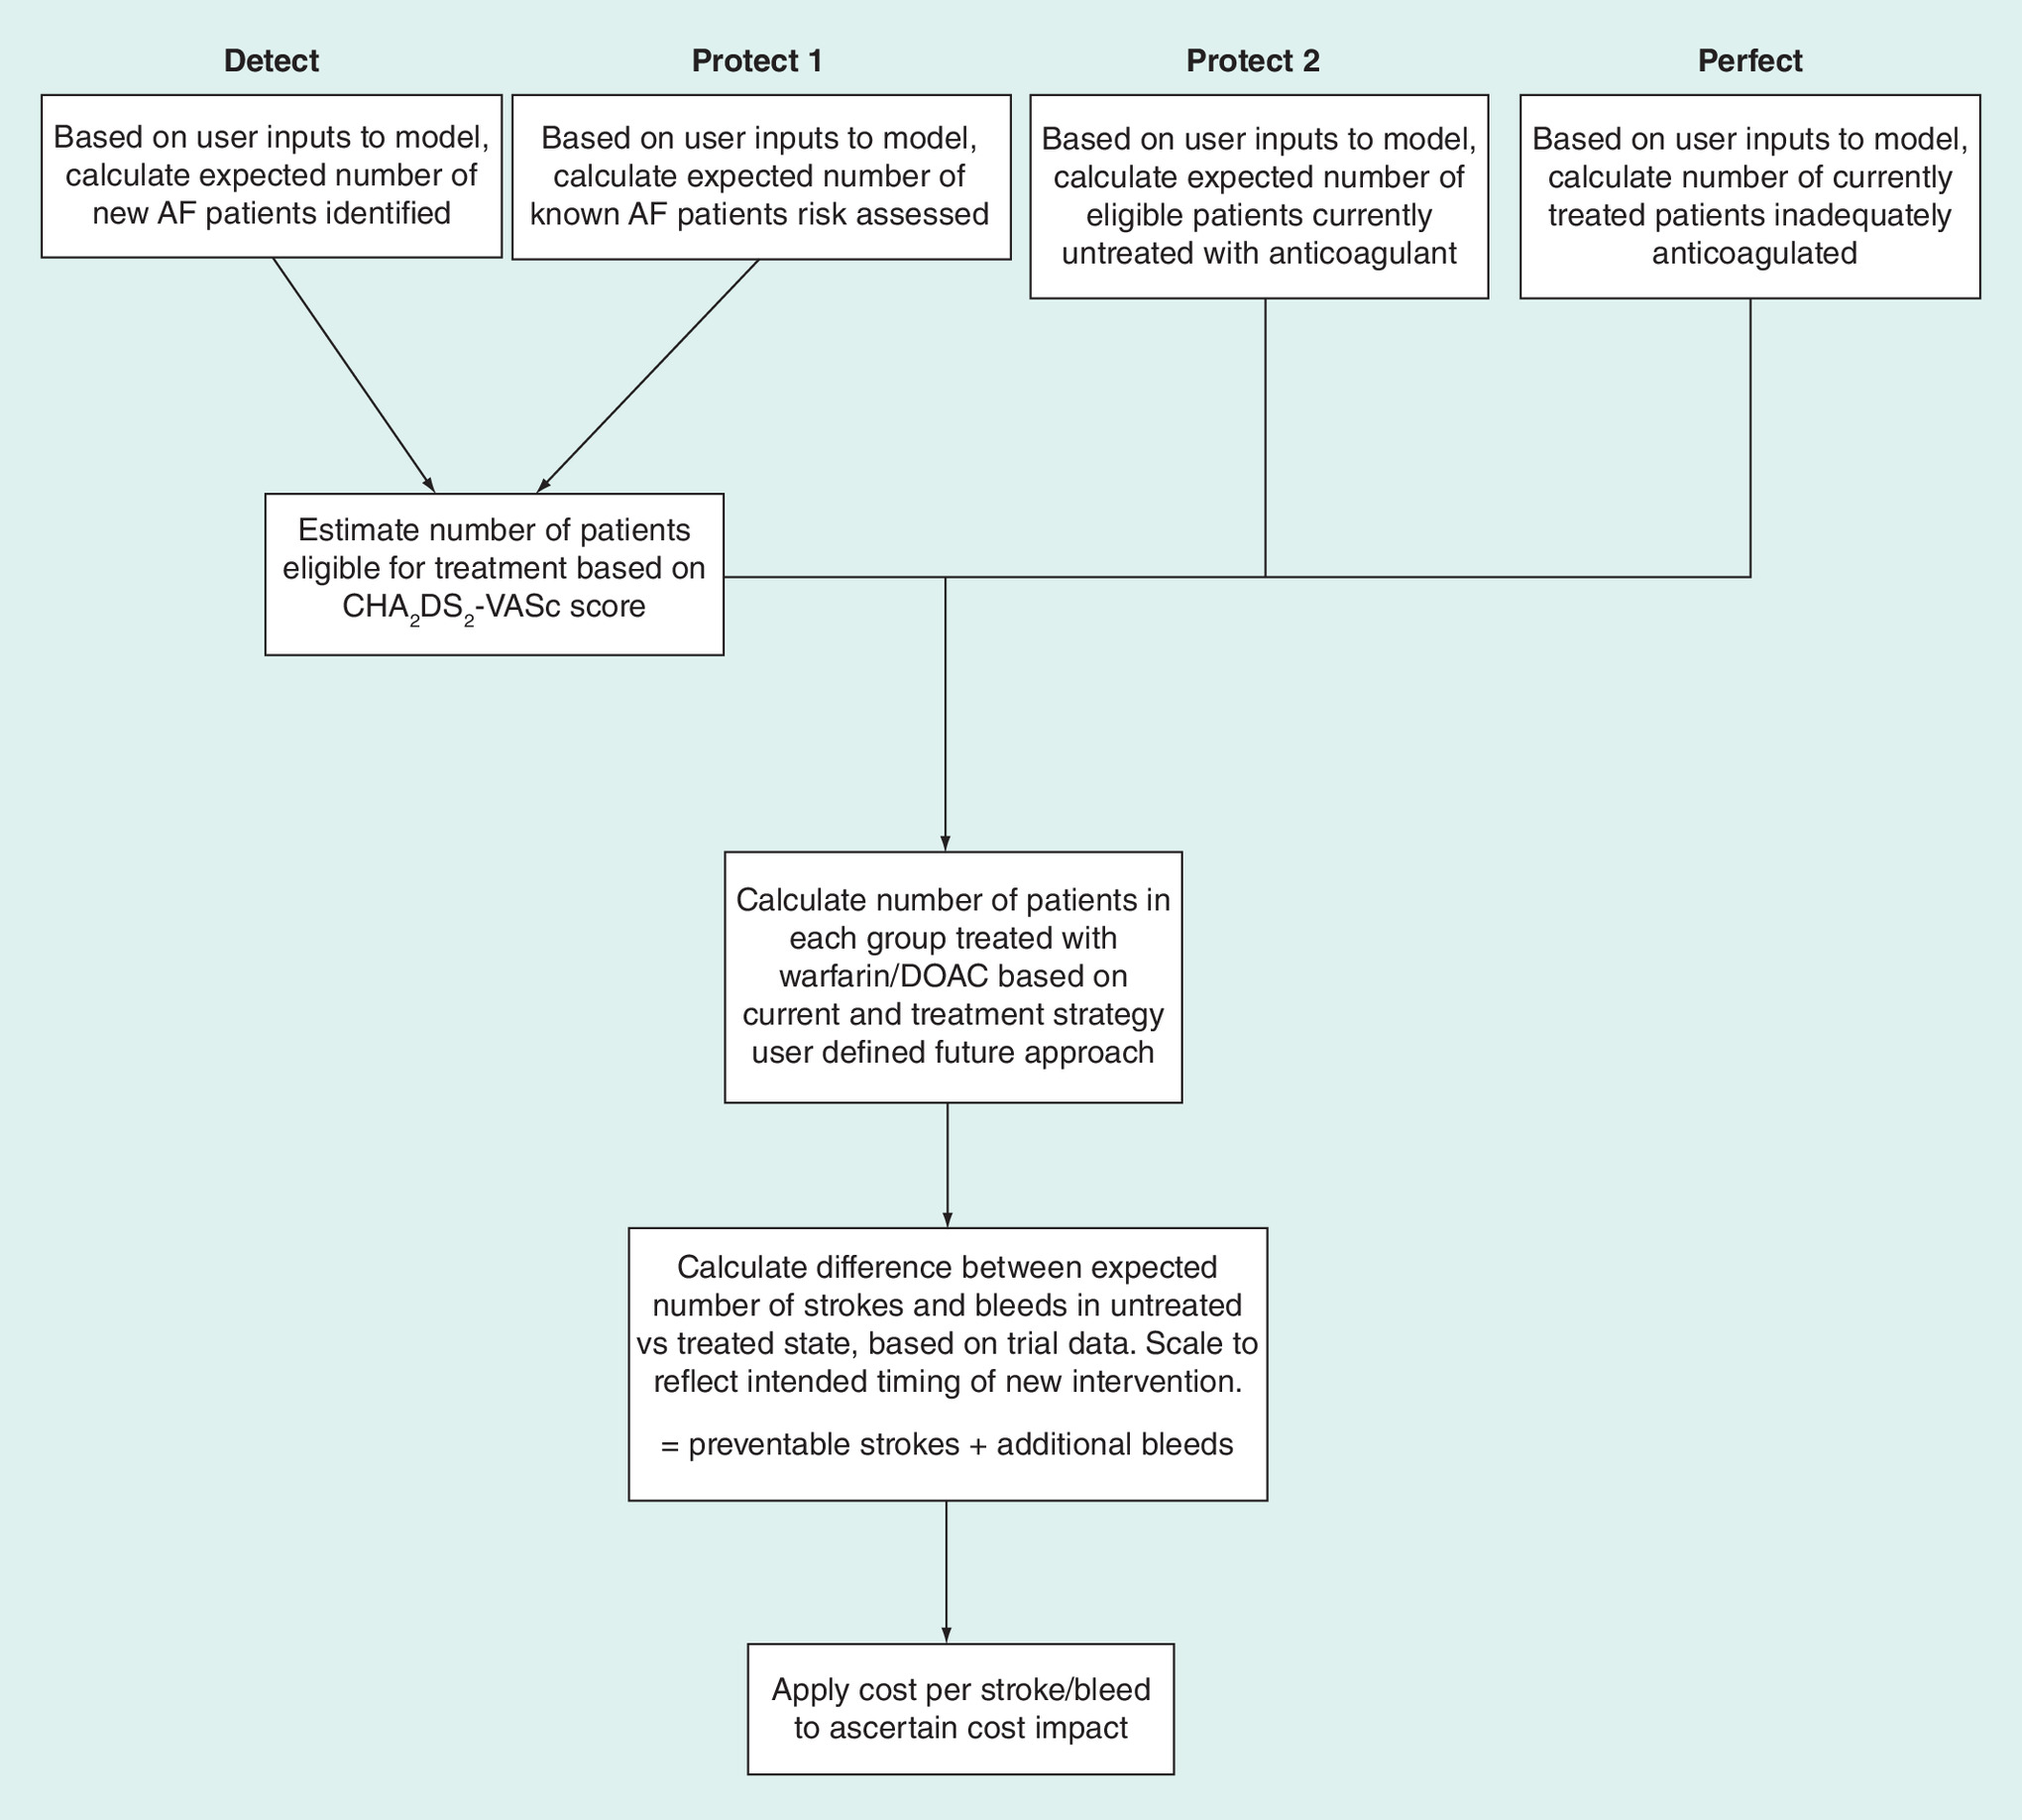
Figure 1. Flow of the Academic Health Science Network Atrial Fibrillation Business Case Model.
AF: Atrial fibrillation; DOAC: Direct oral anticoagulant.
Stroke & bleeding complications
Cost inputs for stroke and bleeding complications, together with associated costs for warfarin treatment were drawn from estimates used in previous NICE guidance [13]. As these figures are unlikely to reflect current costs, a Hospital & Community Health Services inflator, which is a weighted average of the Pay Cost Index and the Health Service Cost Index, was used to calculate 2016/17 prices and provide a default mid value.
Detection costs
Although screening is not currently a recommended detection strategy, we added screening as a cost in year one to investigate how the potentially large outlay might affect 3-year costs and savings. We estimated that half of people older than 65 years without an AF diagnosis would be screened and, given the difference between the NCVIN prevalence and recorded AF cases, that 50% of these people would be identified as having AF. The number of strokes was derived from the epidemiological and treatment evidence considered in the model. Thus, one person per 21 people screened would be identified as having AF and screening would prevent one stroke per 637 people screened per year.
Targeted screening for unidentified AF may be carried out using a variety of approaches, but the key driver of cost is the staff time involved rather than the specific technology employed. In a detailed UK analysis from 2005, Hobbs et al. [26] estimated that opportunistic screening of patients aged 65 years and older with single-lead or limb-lead devices would be £11.68–13.38 per person screened. Inflating these estimates to 2016 prices yields a range of £15.23–17.45 per person screened. The default cost for screening in the model was set at a mid-point cost of £16 per person.
Treatment costs
Warfarin prescription and monitoring (measurement of international normalized ratio in a specialist clinic) costs were based on the approach used by NICE in their AF management guidelines [7] and in the NICE technology appraisal for rivaroxaban [13], updated to 2016/17 prices. The annual prescription cost per patient was £41 and the annual monitoring cost per patient was £242. The cost of DOAC prescribing was based on the individual NHS drug prices for use as stroke prophylaxis and weighted by quantity used in the year to July 2016 (dabigatran 11.7%, rivaroxaban 57.3%, apixaban 31.0%, edoxaban 0.1%), giving an overall annual cost for DOAC prescribing of £664 per patient.
Stroke care costs
The cost of care per stroke was defined as health-provider expenditure in the first year after stroke (transport, scans, thrombolysis, acute care, rehabilitation and daily living assistance). The cost in the model was set as £12,228 per patient based on a Department of Health analysis of expenditure [27] and inflated accordingly. The default per-patient annual cost of stroke beyond year one was set at £2430 based on the same source. The default cost of a major bleed was set at £1173, based on an analysis of NHS activity and tariffs used in the NICE management guidelines [7] and the NICE technology appraisals for dabigatran and rivaroxaban [12,13].
Results
Care gap calculations
In 2016/17, the overall GP list size for all patients across England was 57,544,648. The number of patients registered as having AF was 1,065,569 (1.9%; Table 2). Of the ‘visible’ gaps in care identified through the national (England) QOF datasets (the protection gaps), protection gap 1 was small, with 96.9% of eligible patients having been risk assessed (Table 2). However, protection gap 2 showed that among those identified as being at high risk of stroke, 18.8% had not been started on OACs, whereas treatment should ideally be started immediately (Table 2). Of the more highly modeled gaps, the detection gap indicated that one-quarter of people with AF were not identified in 2016/17 (Table 2). Likewise, a substantial gap was seen for adequacy of treatment (perfection gap; Table 2).
| AF characteristics | Recorded | Model input | Gaps in care | Potential preventable strokes | Potential preventable major bleeds |
|---|---|---|---|---|---|
| Number of patients with AF | 1,065,569 registered in QOF | Predicted population 1,438,218 in NCVIN | Detection gap: difference 372,649. 25.9% | 12,376 | 1757 |
| Prevalence | 1.85% | 2.50% | |||
| Risk assessed | 1,065,569 registered in QOF | 33,592 not assessed | Protection gap 1: 3.1% | 536 | 76 |
| Eligible patients receiving oral anticoagulation | 877,964 eligible | 165,355 not receiving treatment | Protection gap 2: 18.8% | 6522 | 928 |
| Adequacy of treatment | 712,609 adequately treated | 191,298 inadequately treated | Perfection gap: 26.8% | 8116 | 1023 |
AF: Atrial fibrillation; NCVIN: National Cardiovascular Intelligence Network; QOF: Quality Outcomes Framework.
If all four care gaps were completely closed, over 3 years 27,550 strokes and 3784 major bleeds could be prevented (Table 2). The contributions to the total numbers followed the sizes of contribution for the four care gaps.
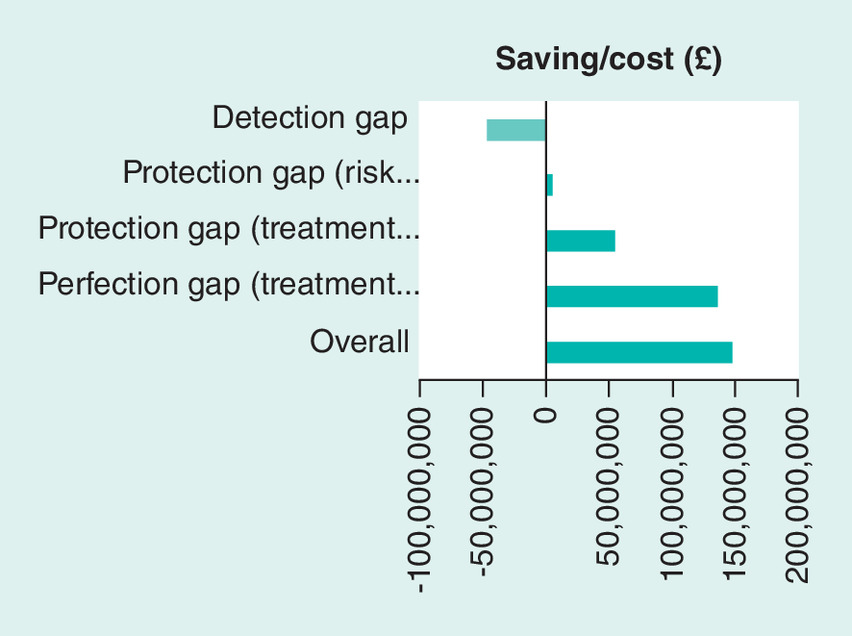
Cost impact calculations
The overall costs and savings per year and after 3 years are shown in Table 3 and overall cost impact is shown in Figure 2. Of the care gaps identified through the national QOF datasets (the ‘visible’ gaps), while risk assessment with CHA2DS2-VASc (protection gap 1) would lead to a modest saving (2.3% of the total gain and 3.0% of the adjusted overall budget impact), starting OACs in patients already diagnosed as having AF and identified as being at high risk of stroke (protection gap 2) could potentially achieve a saving of £53,729,652 (27.6% of the total gain and 32.5% of the adjusted overall budget impact; Table 3).
| Gap | Screening cost† | Additional treatment cost† | Major bleed cost† | Stroke savings | Net saving‡ |
|---|---|---|---|---|---|
| Detection gap – screening | |||||
| – Year 1 | £149,048,676 | £72,477,420 | £1,116,173 | £81,972,073 | -£140,670,196 |
| – Year 2 | 0 | £133,804,468 | £2,060,626 | £167,622,895 | £31,757,801 |
| – Year 3 | 0 | £133,804,468 | £2,060,626 | £197,696,442 | £61,831,348 |
| – Overall | £149,048,676 | £340,086,356 | £5,237,425 | £447,291,410 | -£47,081,047 |
| Protection gap 1 – identification of patients at high risk of stroke by CHA2DS2-VASc testing | |||||
| – Year 1 | N/A | £3,139,595 | £48,466 | £3,550,886 | £362,825 |
| – Year 2 | N/A | £5,796,175 | £89,475 | £7,261,130 | £1,375,480 |
| – Year 3 | N/A | £5,796,175 | £89,475 | £8,563,863 | £2,678,213 |
| – Overall | N/A | £14,731,945 | £227,416 | £19,375,879 | £4,416,519 |
| Protection gap 2 – starting patients at high risk of stroke on adequate oral anticoagulation | |||||
| – Year 1 | N/A | £38,195,091 | £589,616 | £43,198,706 | £4,413,999 |
| – Year 2 | N/A | £70,514,014 | £1,088,521 | £88,336,087 | £16,733,552 |
| – Year 3 | N/A | £70,514,014 | £1,088,521 | £104,184,635 | £32,582,100 |
| – Overall | N/A | £179,223,119 | £2,766,658 | £235,719,428 | £53,729,652 |
| Perfection gap – optimized oral anticoagulation | |||||
| – Year 1 | N/A | £32,743,070 | £650,240 | £53,758,924 | £20,365,614 |
| – Year 2 | N/A | £60,448,745 | £1,200,444 | £109,930,446 | £48,281,257 |
| – Year 3 | N/A | £60,448,745 | £1,200,444 | £129,653,279 | £68,004,090 |
| – Overall | N/A | £153,640,560 | £3,051,128 | £293,342,649 | £136,650,962 |
| Total gain§ | |||||
| – Year 1 | N/A | £74,077, 756 | £1,288,322 | £100,508,516 | £25,142,438 |
| – Year 2 | N/A | £136,758,934 | £2,378,440 | £205,527,663 | £66,390.289 |
| – Year 3 | N/A | £136,758,934 | £2,378,440 | £242,401,777 | £103,264,403 |
| – Overall | N/A | £367,726,162 | £3,644,314 | £548,437,974 | £194,797,133 |
| Adjusted budget impact | |||||
| – Year 1 | £149,048,676 | £146,555,176 | £2,404,495 | £666,310,899 | -£115,527,758 |
| – Year 2 | N/A | £270,563,402 | £4,439,066 | £373,150,558 | £70,232,447 |
| – Year 3 | N/A | £270,563,402 | £4,439,066 | £440,098,219 | £165,095,751 |
| – Overall | £149,048,676 | £687,681,980 | £11,282,627 | £995,729,366 | £147,716,086 |
†
Values in years two and three do not change because the whole cohort of patients started assessment in year one and no new patients were added subsequently; values in year one are lower because the treatment changes were modeled as being implemented over the first 12 months.
‡
Stroke savings minus all costs.
§
Total for protection gap 1, protection gap 2 and perfection gap, and excluding the detection gap.
N/A: Not applicable.
According to the modeled projections, addressing the perfection gap by ensuring adequate anticoagulation has the potential to save nearly £136,650,962, which is by far the largest contributor to the overall 3-year savings. This value would account for 70.2% of the total gain or 92.5% of all savings after adjustment of the budget impact for screening costs calculated by the model (Table 3).
Using screening to close the detection gap was the only strategy that incurred a cost. The greatest expenditure was in year one, decreasing year on year thereafter (Table 3). However, over 3 years, savings made by closing the other care gaps would reduce the overall budget impact of screening to a cost of £47,081,047.
Achieving 100% closure of the protection and perfection gaps, where savings would be achieved, is estimated to provide a total gain of £194,797,133. After adjustment for the cost associated with screening, the overall budget impact is projected to be £147,716,086 over 3 years (Table 3).
Discussion
The AHSN AF Business Case Model provides a picture of the AF detection and care pathway, breaking down diagnosis and AF management into four categories to identify potential gaps in care. Protection gaps 1 and 2, which address OAC prescribing in diagnosed patients with AF, are based on robust real-world national (England) datasets and are, therefore, ‘visible’. By contrast, the detection (represented in this study by screening) and perfection (achieving appropriate and adequate treatment in high-risk patients with AF) gaps required greater modeling and projection. The breakdown enables health providers to identify and assess areas in which changes will achieve the greatest benefits for patients alongside the most manageable investments in money and manpower. We found that making changes from 2016/17 and for the following 3 years to completely close the care gaps in England would have had a substantial positive budget impact.
Protection gaps 1 and 2 together contributed to around a third of the projected costs required to close these gaps completely. With the recording of AF data in QOF, risk assessment and starting treatment are now the most visible parts of the AF care pathway, and yet a considerable number of patients – over 190,000 – appear to have been receiving suboptimum care. ‘Closing’ these two gaps in care was projected to help prevent 7058 strokes. This number alone exceeds the 2016 PHE target of 5000 strokes avoided [18] and almost reaches the target of 8000 set by NHS England [17]. It was projected that closing the perfection gap by ensuring that all patients with AF at high risk of stroke are receiving optimized OAC treatment could potentially add another 8000 avoided strokes to this number.
In terms of cost savings, we found that 97.7% of savings are accounted for by addressing two key gaps – protection gap 2 (starting anticoagulation in line with guidelines) and the perfection gap (optimization of therapy). For this analysis, in the model we assumed that 100% of AF patients at high risk of stroke would have OAC treatment initiated. We also assumed that patients receiving inadequate anticoagulation would have treatment optimized by switching 90% to a DOAC and the remaining 10% continuing to receive warfarin due to some patients being ineligible to swap to DOACs. At the time of developing the model, little information on the actual split was available and, therefore, this proportion was decided as a conservative estimate. Most of the data on groups of patients under-represented in trials, such as the very elderly, are derived from subgroup analyses, although they suggest that more patients might be eligible for treatment with DOACs [28]. The model estimated that 60% of people currently treated with warfarin will not achieve a TTR greater than 65%. This assumed value was based on anecdotal evidence but reflects the findings of published systematic reviews [29,30] and is thought to be considerably higher than the proportion of patients who achieve such a TTR in the real world [31]. Consequently, the opportunity to improve AF care and reduce the risk of stroke may actually be larger than demonstrated by the model.
Factors such as the location of the international normalized ratio monitoring clinic (e.g. hospital versus community clinic) and frequency of testing have been found to affect TTR, with patients assessed in community clinics having lower TTR than those assessed in specialized anticoagulation clinics [29–31]. Individual factors, such as diet, weight and other medications, can also affect effectiveness. In contrast to VKAs, DOACs have faster onset of action, more predictable pharmacokinetics and a wider therapeutic window, meaning that they are given at a fixed dose without monitoring. All four DOACs have been found to be at least noninferior to warfarin [32–35] and could be considered with a view to promoting the greatest AF control, most consistent anticoagulation and greatest adherence.
The greatest gains in stroke prevention seem numerically to be attainable from closing the detection gap, with a potential for avoiding 12,376 strokes. However, this was the only gap in care to incur costs across the 3 years. No country has yet established a cost-effective national screening program for AF. However, the 2016 European Society for Cardiology Guidelines [9] encourage further evaluation of systematic AF screening programs in at-risk populations. The AHSN AF Business Case Model calculated costs of screening with single-lead or limb-lead devices, but other methods might be more cost-effective. Given the opportunities in terms of significantly reducing stroke incidence and costs in this undetected population, further exploration of national screening approaches seems warranted. Welton and colleagues [36] suggest that national-level systematic opportunistic screening in primary care of patients aged 65–80 years by nurse pulse palpation or use of modified blood pressure monitors followed by ECG interpreted by trained GPs for confirmation of suspected AF and referral to a specialist for unclear cases is likely to be the most effective approach and to be a cost-effective use of resources. Screening by emerging technologies might reduce costs further once detection thresholds and reliability are resolved [37]. In the meantime, in localities where the detection gap is large, implementation of specifically targeted screening programs might be a beneficial use of resources.
This study has some limitations. The data that underlie the model were drawn from the most up-to-date available published sources at the time, but these data will not necessarily reflect current practice. Prevalence of diagnosed AF in QOF data continues to rise year on year (e.g. 1.63% in 2014/15 rising to 1.91% in 2017/18). Similarly, the prevalence study used to estimate true background prevalence of AF was several years old and was based on a Scandinavian rather than a UK population. There is, therefore, potential for our detection gap estimates to be inaccurate. Many DOAC studies for treatment of AF treatment exclude patients with severe clinically relevant mitral stenosis and artificial valve replacement, but other patients with valvular AF might be included. Owing to differences in methods between studies and in definitions of valvular AF, it was not possible to exclude these patients completely for the model, and we cannot guarantee that the data underlying the study refer only to patients with nonvalvular AF. However, patients with valvular AF make up a small proportion of the overall patient pool assessed, and we do not believe that recalculating values after exclusion of these patients would substantially alter the outputs.
Usage of DOACs within UK general practice is also changing rapidly. Data from 2015/16 were used in the model, at which time 28.4% of anticoagulant prescriptions in England were DOACs. Data from April 2019 show that this figure has now risen to 56.4% [38]. This change will affect the applicability of the estimates associated with the perfection gap.
Estimates for the impact of treatment on stroke and bleed risk are derived from the clinical trial literature. There are significant uncertainties as to the extent to which these data are translatable to normal clinical practice, particularly with reference to warfarin, where maintenance of anticoagulation within a narrow therapeutic window is critical to achieving the expected results. This factor might impact on our estimates for the protection gap.
Finally, the costs used for interventions and outcomes might be inaccurate. Although we followed the approach used by NICE to ensure maximum comparability, some parameters, such as the cost of a major bleed, warfarin monitoring and AF screening, could only be approximate at best.
Conclusion
Despite a decade of improvements, substantial AF detection, protection and perfection gaps were still found to be present in England using national datasets from 2016/17 and projected standards of care from the literature. The AHSN AF Business Impact Model indicates the size of the gap in care, the number of patients projected to benefit from addressing these gaps and the associated budget impact of doing so. The results can help to define investment priorities for money and resources in existing management pathways that would lead to long-term cost savings, while improving clinical outcomes for patients with nonvalvular AF, at national, regional (STP and CCG) and local (GP practice) levels. Improving the management of high-risk patients with AF through initiating and/or optimizing anticoagulation treatment, in line with guidelines, could yield immediate benefits with little planning or cost impact. The number of strokes that could be avoided would nearly meet or surpass national goals for NHS England and PHE. Closing the detection gaps – although likely to be high impact in terms of strokes avoided – will require further local evaluation, planning and investment, taking into account local and regional resources and services. At the local level, care gaps and numbers of strokes prevented might differ substantially from the national findings due to local factors such as socioeconomic status [39] and, therefore, might require different approaches, changes to practice and investments of time, resources and money from place to place. Ensuring input of appropriate, accurate and up-to-date information into the model will provide the most relevant indicators for potential strategies and investments to take forward.
Data sharing statement
All data underlying this analysis will be available on request.
Financial & competing interests disclosure
A Orlowski has received speaker honoraria from Pfizer and provided consultancy to Daiichi Sankyo. J Belsey has received consultancy payments from Imperial College Health Partners to create the model on which this paper is based. He has also received consultancy payments from pharmaceutical companies with an interest in the field of atrial fibrillation (Bristol-Myers Squibb, Pfizer, Daiichi-Sankyo). The authors have no other relevant affiliations or financial involvement with any organization or entity with a financial interest in or financial conflict with the subject matter or materials discussed in the manuscript apart from those disclosed.
No writing assistance was utilized in the production of this manuscript.
Open access
This work is licensed under the Attribution-NonCommercial-NoDerivatives 4.0 Unported License. To view a copy of this license, visit http://creativecommons.org/licenses/by-nc-nd/4.0/
References
1.
Zoni-Berisso M, Lercari F, Carazza T, Domeniucucci S. Epidemiology of atrial fibrillation: European perspective. Clin. Epidemiol. 6, 213–220 (2014).
2.
Saka O, McGuire A, Wolfe C . Cost of Stroke in the United Kingdom. Age Ageing 38, 27–32 (2009).
3.
Friberg L, Rosenqvist M, Lindgren A, Tere´nt A, Norrving B, Asplund K. High prevalence of atrial fibrillation among patients with ischemic stroke. Stroke 45, 2599–2605 (2014).
4.
Henninger N, Goddeau RP Jr, Karmarkar A, Helenius J, McManus DD. Atrial fibrillation is associated with a worse 90-day outcome than other cardioembolic stroke subtypes. Stroke 47, 1486–1492 (2016).
5.
Ali AN, Howe J, Abdel-Hafiz A. Cost of acute stroke care for patients with atrial fibrillation compared with those in sinus rhythm. Pharmacoeconomics 33, 511–520 (2015).
6.
The Task Force for the Management of Atrial Fibrillation of the European Society of Cardiology (ESC). Guidelines for the management of atrial fibrillation. Eur. Heart J. 6, 240–429 (2011).
7.
National Institute for Health and Care Excellence. Atrial Fibrillation: Management (CG180) (2014). www.nice.org.uk/guidance/cg180
8.
NICE. NICE Quality and Outcomes Framework indicator (2014). www.nice.org.uk/standards-and-indicators/qofindicators?categories=3884&page=1
9.
The Task Force for the management of atrial fibrillation of the European Society of Cardiology (ESC). 2016 ESC Guidelines for the management of atrial fibrillation developed in collaboration with EACTS. Eur. Heart J. 37, 2893–2962 (2016).
10.
Campbell Cowan J, Wu J, Hall M, Orlowski A, West RM, Gale CP. A 10-year study of hospitalized atrial fibrillation-related stroke in England and its association with uptake of oral anticoagulation. Eur. Heart J. 39, 2975–2983 (2018).
11.
Loo SY, Dell’Aniello S, Huiart L, Renoux C. Trends in the prescription of novel oral anticoagulants in UK primary care. Br. J. Clin. Pharmacol. 83, 2096–2106 (2017).
12.
National Institute for Health and Care Excellence. Dabigatran etexilate for the prevention of stroke and systemic embolism in atrial fibrillation. Technology appraisal guidance [TA249] (2012). www.nice.org.uk/guidance/ta249
13.
National Institute for Health and Care Excellence. Rivaroxaban for the prevention of stroke and systemic embolism in atrial fibrillation. Technology appraisal guidance [TA256] (2012). www.nice.org.uk/guidance/ta256
14.
National Institute for Health and Care Excellence. Apixaban for preventing stroke and systemic embolism in people with nonvalvular atrial fibrillation. Technology appraisal guidance [TA275] (2013). www.nice.org.uk/guidance/ta275
15.
National Institute for Health and Care Excellence. Edoxaban for preventing stroke and systemic embolism in people with nonvalvular atrial fibrillation. Technology appraisal guidance [TA355] (2013). www.nice.org.uk/guidance/ta355
16.
ABPI SAFI. One year on – why are patients still having unnecessary AF-related strokes? (2016). www.abpi.org.uk/media/1404/safi_one_year_on.pdf
17.
NICE. New work from NICE could prevent thousands of people from suffering a stroke (2016). www.nice.org.uk/news/article/new-work-from-nice-could-prevent-thousands-of-people-from-suffering-a-stroke
18.
Public Health England. Transforming services: a systems based approach (2016). https://publichealthmatters.blog.gov.uk/2016/07/14/transforming-services-a-systems-based-approach/
19.
PRIMIS. GRASP-AF Quick Guide (2015). www.nottingham.ac.uk/primis/documents/audit-docs/grasp-af-quick-guide.pdf
20.
Public Health England. Technical document for sub-national English atrial fibrillation prevalence estimates: Application of age-sex rates in a Swedish region to the English population (2015). https://assets.publishing.service.gov.uk/government/uploads/system/uploads/attachment_data/file/644868/atrial_fibrillation_AF_prevalence_estimates_technical_document.pdf
21.
Norberg J, Bäckström S, Jansson J-H, Johansson L. Estimating the prevalence of atrial fibrillation in a general population using validated electronic health data. Clin. Epidemiol. 5, 475–481 (2013).
22.
Public Health England. Research and analysis: atrial fibrillation prevalence estimates for local populations (2015). https://www.gov.uk/government/publications/atrial-fibrillation-prevalence-estimates-for-local-populations
23.
King’s College London. Sentinel Stroke National Audit Programme (SSNAP) (2020). www.strokeaudit.org/About-SSNAP.aspx
24.
Gage B, Waterman A, Shannon W et al. Validation of clinical classification schemes for predicting stroke: results from the National Registry of Atrial Fibrillation. JAMA 285, 2864–2870 (2001).
25.
Hart R, Pearce LA, Aguilar MI. Meta-analysis: antithrombotic therapy to prevent stroke in patients who have nonvalvular atrial fibrillation. Ann. Intern. Med. 146, 857–867 (2007).
26.
Hobbs F, Fitzmaurice D, Mant J et al. A randomised controlled trial and cost–effectiveness study of systematic screening (targeted and total population screening) versus routine practice for the detection of atrial fibrillation in people aged 65 and over. The SAFE study. Health Technol. Assess. 9, 1–74 (2005).
27.
Kerr M. Atrial Fibrillation Cost Benefit Analysis. Department of Health, London, UK (2008).
28.
Mitchell A, Watson MC, Welsh T, McGrogan A. Effectiveness and safety of direct oral anticoagulants versus vitamin K antagonists for people aged 75 years and over with atrial fibrillation: a systematic review and meta-analyses of observational studies. J. Clin. Med. 8, E554 (2019).
29.
Van Walraven C, Jennings O, Oake N, Fergusson D, Forster AJ. Effect of study setting on anticoagulation control: a systematic review and metaregression. Chest 129, 1155–1166 (2006).
30.
Dolan G, Smith LA, Collins S, Plumb JM. Effect of setting, monitoring intensity and patient experience on anticoagulation control: a systematic review and meta-analysis of the literature. Curr. Med. Res. Opin. 24, 1459–1472 (2008).
31.
Mearns ES, White CM, Kohn CG et al. Quality of vitamin K antagonist control and outcomes in atrial fibrillation patients: a meta-analysis and meta-regression. Thromb. J. 12, 14 (2014).
32.
Connolly SJ, Ezekowitz MD, Yusuf S et al. Dabigatran versus warfarin in patients with atrial fibrillation. N. Engl. J. Med. 361, 1139–1151 (2009).
33.
Granger CB, Alexander JH, McMurray JJV et al. Apixaban versus warfarin in patients with atrial fibrillation. N. Engl. J. Med. 365, 981–992 (2011).
34.
Patel MR, Mahaffey K, Garg J et al. Rivaroxaban versus warfarin in nonvalvular atrial fibrillation. N. Engl. J. Med. 365, 883–891 (2011).
35.
Giuliano RP, Ruff CT, Braunwald E, Murphy SA, Wiviott SD, Halperin JL. Edoxaban versus warfarin in patients with atrial fibrillation. N. Engl. J. Med. 369, 2093–2104 (2013).
36.
Welton NJ, McAleenan A, Thom HHZ et al. Screening strategies for atrial fibrillation: a systematic review and cost–effectiveness analysis. Health technology assessment 21.29. Health Technol. Assess. 21, 1–235 (2017).
37.
Lowres N, Neubeck L, Redfern J, Freedman SB. Screening to identify unknown atrial fibrillation: a systematic review. Thromb. Haemost. 110, 213–222 (2013).
38.
NHS England. Medicines optimisation dashboard (2020). www.england.nhs.uk/medicines/medicines-optimisation/dashboard/
39.
Bray BD, Paley L, Hoffman A et al. Socioeconomic disparities in first stroke incidence, quality of care, and survival: a nationwide registry-based cohort study of 44 million adults in England. Lancet Public Health 3, PE185–PE193 (2018).
Information & Authors
Information
Published In
Pages: 253 - 262
PubMed: 32100562
Copyright
© 2020 Imperial College Health Partners. This work is licensed under the Attribution-NonCommercial-NoDerivatives 4.0 Unported License
History
Received: 19 August 2019
Accepted: 3 January 2020
Published online: 26 February 2020
Keywords:
Topics
Authors
Metrics & Citations
Metrics
Article Usage
Article usage data only available from February 2023. Historical article usage data, showing the number of article downloads, is available upon request.
Citations
How to Cite
Budget impacts associated with improving diagnosis and treatment of atrial fibrillation in high-risk stroke patients. (2020) Journal of Comparative Effectiveness Research. DOI: 10.2217/cer-2019-0125
Export citation
Select the citation format you wish to export for this article or chapter.
Citing Literature
- Michaela Eklund, Lars Bernfort, Kajsa Appelberg, Daniel Engler, Renate B Schnabel, Carlos Martinez, Christopher Wallenhorst, Giuseppe Boriani, Claire M Buckley, Søren Zöga Diederichsen, Jesper Hastrup Svendsen, Joan Montaner, Tatjana Potpara, Lars-Åke Levin, Johan Lyth, The budget impact of implementing atrial fibrillation-screening in European countries, European Heart Journal Supplements, 10.1093/eurheartjsupp/suae076, 26, Supplement_4, (iv19-iv32), (2024).
- Nathan R. Hill, Lara Groves, Carissa Dickerson, Rebecca Boyce, Sarah Lawton, Michael Hurst, Kevin G. Pollock, Daniel M. Sugrue, Steven Lister, Chris Arden, D. Wyn Davies, Anne-Celine Martin, Belinda Sandler, Jason Gordon, Usman Farooqui, David Clifton, Christian Mallen, Jennifer Rogers, A. John Camm, Alexander T. Cohen, Identification of undiagnosed atrial fibrillation using a machine learning risk prediction algorithm and diagnostic testing (PULsE-AI) in primary care: cost-effectiveness of a screening strategy evaluated in a randomized controlled trial in England, Journal of Medical Economics, 10.1080/13696998.2022.2102355, 25, 1, (974-983), (2022).
- Tomasz Szymanski, Rachel Ashton, Sara Sekelj, Bruno Petrungaro, Kevin G Pollock, Belinda Sandler, Steven Lister, Nathan R Hill, Usman Farooqui, Budget impact analysis of a machine learning algorithm to predict high risk of atrial fibrillation among primary care patients, EP Europace, 10.1093/europace/euac016, 24, 8, (1240-1247), (2022).