CAR-T therapy and historical trends in effectiveness and cost–effectiveness of oncology treatments
Publication: Journal of Comparative Effectiveness Research
Abstract
Aim: This study examines how chimeric antigen receptor T-cell (CAR-T) therapy’s incremental effectiveness and cost–effectiveness profile fits into the recent history of anticancer treatments. Materials & methods: We conducted graphical and multivariable analyses using data from the Cost–Effectiveness Analysis Registry of the Tufts Medical Center and the Institute for Clinical and Economic Review’s analysis of CAR-T therapies. We collected additional information including the US FDA approval years for pharmacologic innovations. Results: CAR-T provided 5.03 (95% CI: 3.88–6.18) more incremental quality-adjusted life-years than the average pharmaceutical intervention and 4.61 (95% CI: 1.67–7.56) more than the average nonpharmaceutical intervention, while retaining similar cost–effectiveness. There was evidence of worsening cost–effectiveness by approval year for pharmaceutical interventions. Limitations: Analysis is limited to anticancer treatments studied in cost–utility analyses, estimated to cover approximately 60% of FDA-approved antineoplastic agents. Conclusion: CAR-T therapy breaks a pattern of stagnant efficacy growth in pharmaceutical innovation and demonstrates significantly greater incremental effectiveness and similar cost–effectiveness to prior innovations.
Chimeric antigen receptor T-cell (CAR-T) therapy is a recently approved innovation that represents a novel approach to cancer treatment. In brief, CAR-T therapy is given as a one-time treatment in which a patient’s own T cells are collected and engineered to express a special type of receptor that promotes their ability to kill cancer cells after they are infused back into the patient. This class of therapies has received regulatory approval for two blood cancers – for pediatric acute lymphoblastic leukemia (pALL), the most common malignancy in children [1], and for diffuse large B-cell lymphoma (DLBCL) – spanning various countries including the USA, Canada, Australia, Switzerland and other countries in Europe, with regulatory approvals pending in additional countries [2–9]. Submissions for additional indications are in process, and further trials are underway for other cancer types, including some solid tumors [10].
When introduced, CAR-T therapy captured headlines for both its novel approach to fighting cancer and its high price tag [11–15]. With approximately US$80.2 billion spent per year in treating cancer in the USA [16] and an estimated US$6.4 billion spent by the National Cancer Institute on cancer R&D [17], the question of adequate innovation in oncology treatment is an important one. Some literature has recently suggested that we have experienced diminishing returns from oncology innovation, with benefits not keeping pace with the increasing costs of newly approved pharmaceuticals [18–22]. Nonetheless, other research, using different methods or focusing on different measures of performance, has argued that the returns to cancer care spending have been substantial [23–25].
From an economics perspective the law of diminishing returns or the related concept of diminishing marginal productivity may be relevant to oncology innovation. In short, it may become increasingly difficult to add incremental health benefits as continued innovation drives up the baseline level of health. In the context of oncology treatments, we can look for negative trends in incremental quality-adjusted life years (QALYs) and increases over time in incremental cost per QALY gained as signs of diminishing returns to the research enterprise.
This paper is not a cost–effectiveness analysis (CEA) in itself, but instead gathers and analyzes a history of CEA results from prior studies. Our goals are: to characterize trends in the incremental effectiveness and cost–effectiveness of cancer therapies over a period of two decades; and to determine whether CAR-T therapy departs from or fits with prior trends. For clarity, we are not studying trends in effectiveness, but in incremental effectiveness relative to standard of care at the time of an innovation’s introduction. As an example, compare a drug launched in 2010 to another launched in 2000. Even if the 2010 drug is strictly better than the 2000 drug, it may not have added the same incremental value to society. Rather, the question is whether the 2010 drug improved upon standard of care in 2010 by as much as the 2000 drug improved upon standard of care in its era.
Materials & methods
Data
The Tufts Medical Center Cost–Effectiveness Analysis Registry maintained by the Center for the Evaluation of Value and Risk in Health of the Tufts Medical Center served as our primary data source [26]. That registry maintains a complete record of CEAs that make use of the incremental cost per QALY gained concept. Such analyses are sometimes described as cost-utility analyses (CUAs). The Tufts data are a complete record of published CUAs and record a variety of information from the studies. The database has been used in a number of prior studies of cost-utility and cost–effectiveness [27–29].
From the registry, we gathered all estimates for interventions for the treatment of malignant neoplasms. We limited to CUAs conducted entirely in a US setting. For pharmacologic treatments, we used all studies conducted in the USA with a publication year of 2007 or later that analyzed an intervention with a US FDA approval year of 1995 or later. That choice of years reflected the desire to study relatively recent history; 2007 onward gave us the most recent decade of studies in the database and, given that cutoff, approvals prior to 1995 were rare. Approval years were identified for the indication specified for each treatment. In the case of combination therapies, we used the approval year of the combination therapy. If that was unavailable, we used the approval year of the most recently approved molecule in the combination. For treatments with multiple approval years for different indications, we assigned the approval year for the indication analyzed in the particular study. Our sample included various pharmaceutical interventions including monoclonal antibodies as well as kinase inhibitors. For CUAs of nonpharmacologic treatments for cancer (surgical, medical procedure or medical device), we pulled all studies with a publication year of 2012 or later – that data window reflects the interplay between two criteria: achieving approximate balance in the number of pharmacologic and nonpharmacologic estimates included, while still relying on the most recent possible years of data. Because they operate in a different regulatory environment, no approval dates were assigned for nonpharmacologic interventions. The nonpharmacologic treatments included are mainly various types of surgical procedures and various types of radiation therapy, although early stem cell transplant for multiple myeloma also appears. The cutoff date for pulling data from the Cost–Effectiveness Registry was 30 June 2018. At that point in time, the registry included analyses published through December 2016 (in the Discussion section, we report on more recent CUAs and how those fit into the findings reported here; they do not alter our conclusions from this analysis).
The two key outcome variables of interest are: the number of incremental QALYs added by an intervention relative to its comparator (hereafter ‘incremental QALYs’), and the incremental cost per QALY gained (hereafter ‘incremental cost/QALY’) of the intervention. We are focused on the incremental contribution that a therapy presented at the time it was evaluated. Both costs and QALYs are discounted in these analyses, except for those dealing with very short timeframes. We converted all estimates to 2017 dollars using the medical care component of the Consumer Price Index published by the Bureau of Labor Statistics. We excluded estimates reported in the Tufts Registry if the identity of the anticancer intervention was unclear.
For data on CAR-T, we used the Chimeric Antigen Receptor T-Cell Therapy for B-Cell Cancers: Effectiveness and Value Final Evidence Report published in 2018 by the Institute for Clinical and Economic Review (ICER) [30,31]. That report was the existing published study on CAR-T cost–effectiveness as of 30 June 2018, the end date of our analysis window. The ICER report included estimates of both incremental QALYs and incremental cost per QALY gained for two different CAR-T interventions for two different indications. In a sensitivity analysis, we include CUAs of CAR-T therapies that have been published since the time of our main analysis. Those results do not alter our principal conclusions.
Assembling the data
One challenge in using the Tufts Registry data is that there may be more than one estimate for the same intervention-indication combination. That may occur because more than one published CUA exists for the given intervention-indication or a given study may have produced more than one estimate, differing by subpopulation or different modeling assumptions. Estimates or studies might use a different fallback therapy or a different comparator.
Given the possibility of multiple data points for a given intervention-indication, we faced the question of how to measure incremental QALYs and incremental cost/QALY for each intervention-indication. We chose one approach as our base case and used two alternative approaches as a sensitivity analysis. For our base case, if more than one estimate existed for a given intervention-indication, then we pooled all estimates that used a common comparator and computed mean incremental QALYs and incremental cost/QALY across these data points. In this case, a given intervention-indication will have as many distinct observations as there are distinct comparators in the data. Because of our multivariable regression analysis described below, we only pooled estimates with common covariate values as well. Thus, if covariates differed, we kept the estimates as different data points – this was rare.
As an alternative approach, used for sensitivity analysis, we treated every existing estimate in the Tufts data as a unique data point. In a third approach, also used for sensitivity analysis, we pooled using the mean values of estimates for a given intervention-indication if those estimates came from studies that used a common fallback therapy in case of treatment failure using the principal intervention (the majority of intervention-indication combinations in the dataset [91%] had only one estimate, so for most cases the alternative approaches did not differ).
A clinical oncologist reviewed the comparators used in the included base case analyses as a check for appropriateness at the time the intervention was being assessed. Moreover, in principle, the included analyses have undergone both peer review and in many cases regulatory review – because many CUAs are built upon clinical trial data – that encourage the use of relevant comparators. The Supplementary data contains a list of the interventions, indications and comparators included in the study, as well as the values of variables that do not appear in the Tufts Registry.
Analysis
We conducted both graphical and regression analyses. The graphical analysis for pharmaceutical interventions produced plots of incremental QALYs and incremental cost/QALY, respectively, versus approval year. We also produced box and whisker plots showing the distributions of incremental QALYs and incremental cost/QALY for the following three categories of intervention: nonpharmaceutical, pharmaceutical (other than CAR-T) and CAR-T (because there were only two data points for CAR-T, we showed the two data points and indicated the mean [median] value). We also identified the percentile ranking of CAR-T within the two broad categories of innovations.
Negative cost/QALY values posed an analytic challenge. Conceptually, when incremental costs and incremental QALYs are both positive, higher cost/QALY values always imply less efficiency at producing additional QALYs. Therefore, cost/QALY ratios under these circumstances represent a well-defined ordinal ranking. This interpretation is muddied when incremental costs or incremental QALYs are negative. For example, a technology might have a highly negative cost/QALY ratio if it involves a tiny gain in health but a large cost-saving. Another technology with an identical negative cost/QALY ratio might involve higher costs and worse health.
To address these issues, we took two steps. First, for (the relatively rare) cases in which incremental QALYs were negative, we dropped the observation. Logically, such a technology has no proven utility, and we proceeded on the assumption that it would rarely be used and thus of little practical relevance. Second, for cases in which incremental costs were negative but QALY gains nonnegative, we recoded cost/QALY to zero. This preserves the rank-ordering of cost/QALYs in a weak sense, since all the ‘zero’ cost/QALY technologies are superior to ones with strictly positive cost/QALY ratios. Moreover, in all these cases, the innovation is effectively free in the sense that it produces additional health at no additional cost.
We used multivariable regression analysis (ordinary least squares) to allow us to estimate the differences between CAR-T and other anticancer innovations while controlling for other factors that could potentially influence the outcome variables of interest – incremental QALYs and incremental cost/QALY. These other factors include technical characteristics of the CUAs, such as discount rate, time horizon and the Tufts assessment of study quality (a 1–7 scale) [32]. We included an indicator variable for indications that are considered to be rare diseases by the Genetic and Rare Diseases Information Center of the National Center for Advancing Translational Sciences under the hypothesis that rare diseases may be less studied and therefore innovation may not have reached the degree of diminishing returns that has been reached for nonrare diseases [33]. For pharmaceutical interventions, we included a linear and quadratic term in the FDA approval year to test the hypothesis that returns to innovation and cost–effectiveness may be declining and whether this trend has changed over time. We also included the difference between the publication year of the CUA and approval year of the intervention in recognition of evidence on dynamics of cost–effectiveness [23,34]. An indicator variable for industry sponsorship was included on the hypothesis that such analyses may be skewed to more favorable results because of conflicts of interest. We ran one set of regressions on only the pharmaceutical interventions because this represents a relatively homogeneous group. We followed this with regression analysis that pooled both types of interventions – pharmaceutical and nonpharmaceutical.
Indicator variables for CAR-T therapy and for nonpharmaceutical interventions, respectively, allowed us to test whether those types of interventions differ systematically from non-CAR-T pharmaceutical interventions (the reference group) after accounting for differences in the other variables included in the regressions. The regressions also produced estimates of the size and confidence intervals of those differences. We conducted formal statistical tests of when and whether the slope of the outcome variables with respect to approval year differed significantly from zero; we also formally tested for differences between CAR-T therapy and nonpharmaceutical interventions. Reported p-values apply to two-sided tests. Goodness of fit was measured by the adjusted R-squared. All analyses were conducted in Stata 15.1 or R 3.5.2.
Results
Pharmaceutical interventions
Figure 1 displays a graph of incremental QALYs versus approval year for anticancer pharmaceutical interventions. Within our study sample from 1995 to 2015, with one exception (imatinib approved in 2001), recently approved pharmaceuticals had incremental QALYs of less than two. CAR-T clearly stands out in terms of incremental QALYs – only that single exception in 2001 provided comparable incremental QALYs to CAR-T.
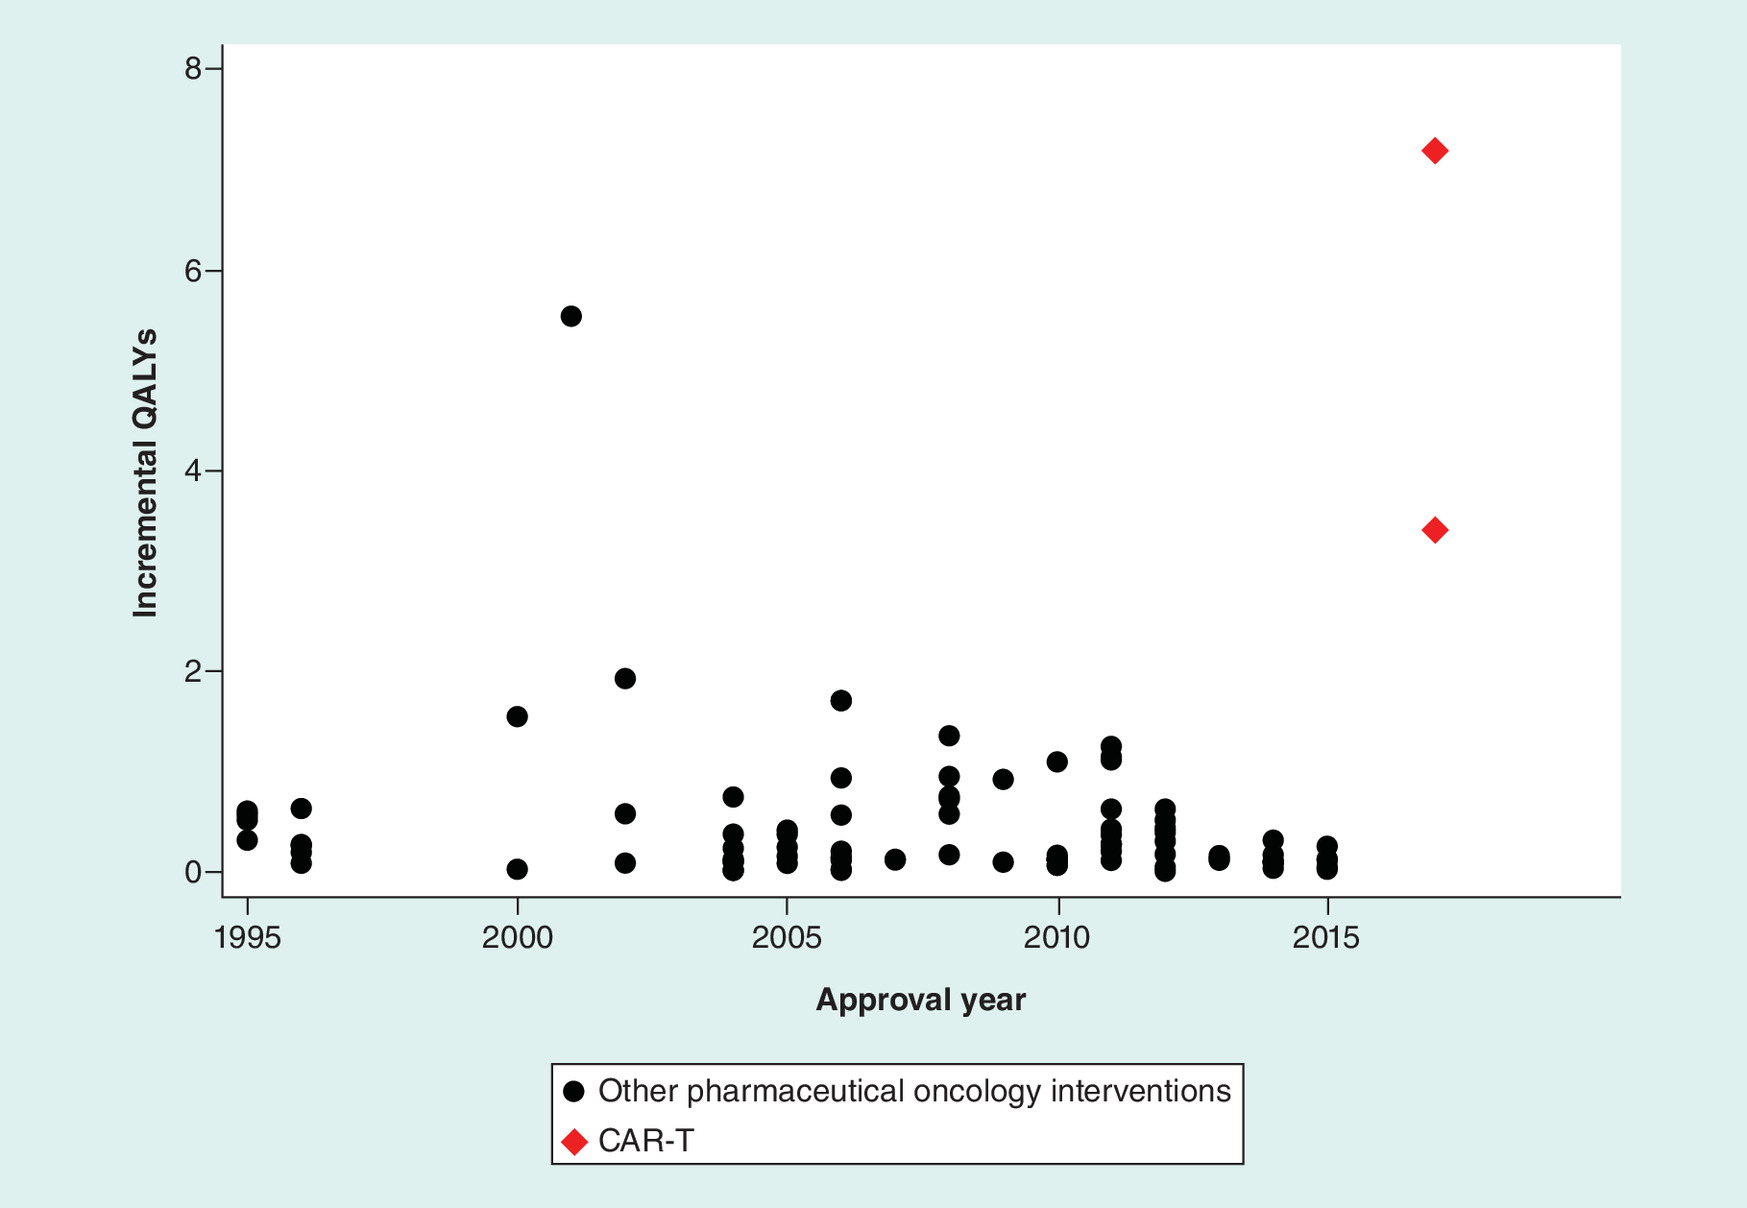
Figure 1. Incremental quality-adjusted life years versus approval year for anticancer pharmaceutical interventions.
CAR-T: Chimeric antigen receptor T-cell therapy; QALY: Quality-adjusted life year.
Figure 2 graphs incremental cost/QALY versus approval year. Note that smaller or more negative numbers are preferred here, in the sense that lower values of incremental cost/QALY indicate better incremental cost–effectiveness. The graph shows a high degree of variability in incremental cost/QALY. On average, CAR-T is in the lower (better) half of the distribution among pharmaceutical innovations.
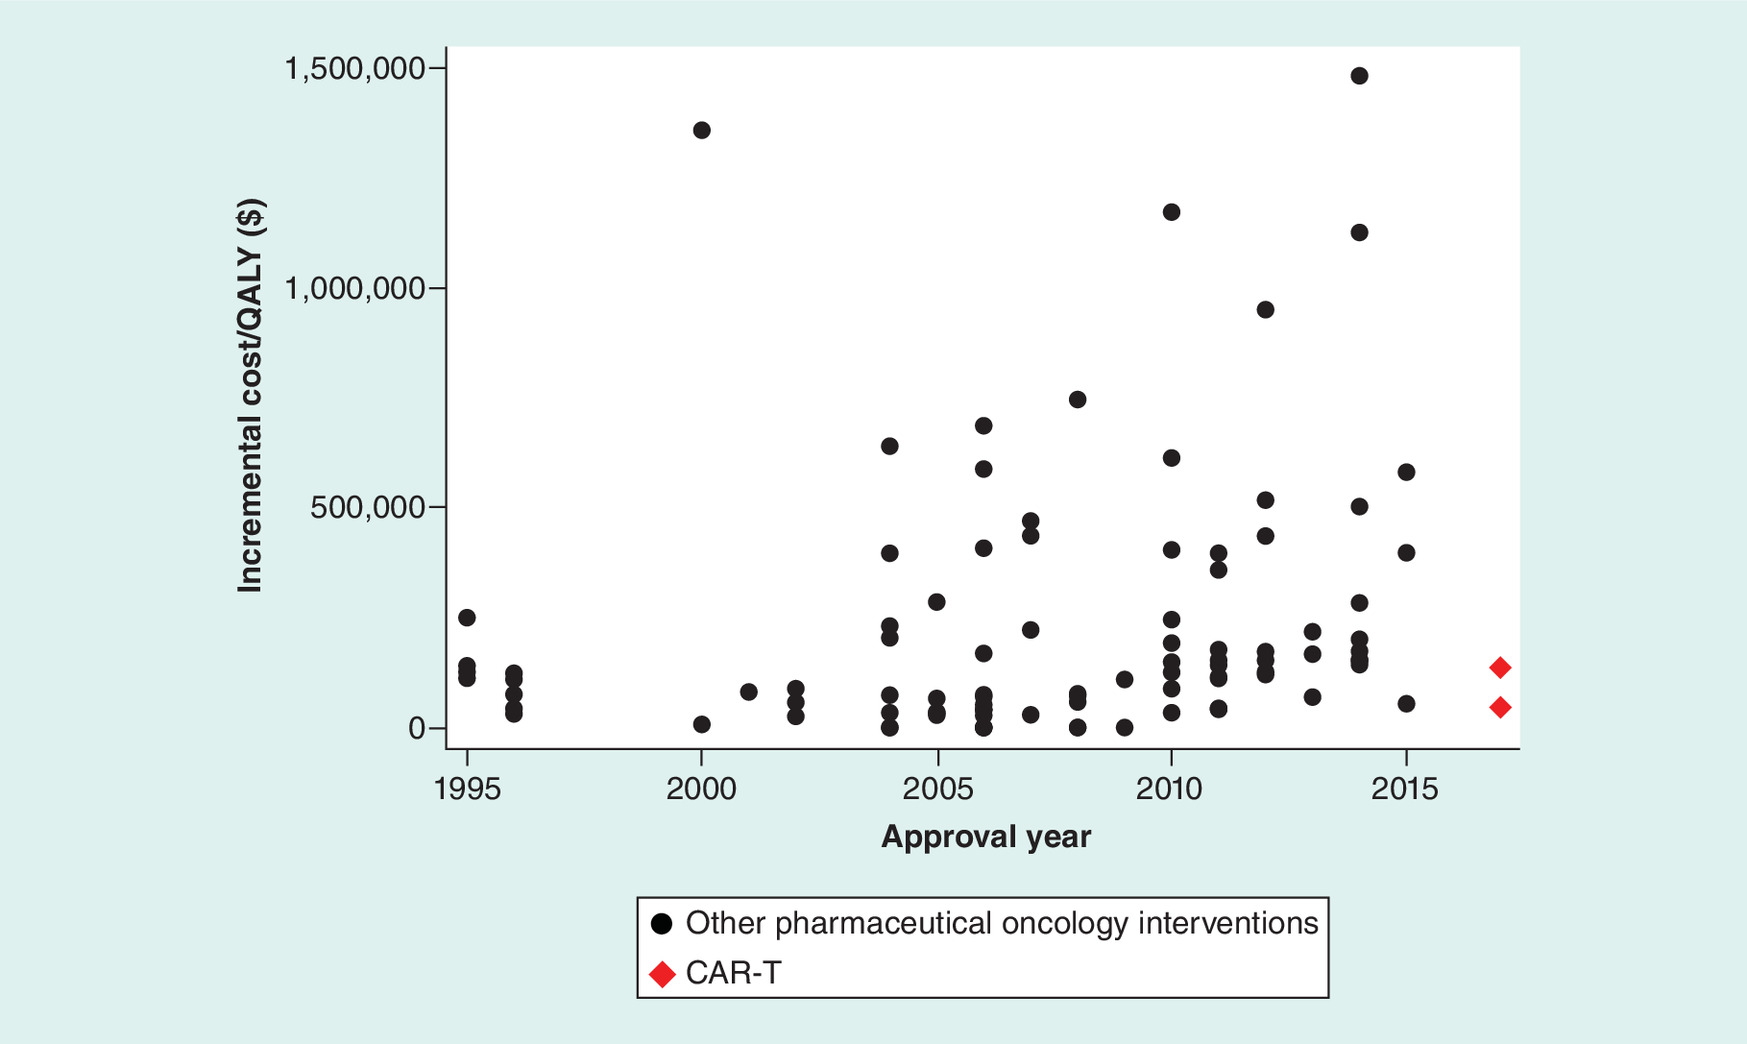
Figure 2. Incremental cost per quality-adjusted life year gained versus approval year for anticancer pharmaceutical interventions.
Graph excludes outliers with incremental cost per QALY gained above US$2,000,000, specifically: 2015, US$8,283,165; 2015, US$3,816,068; 2014, US$2,821,167; 2004, US$2,360,508. All incremental costs per QALY gained are inflated to 2017 US dollars.
CAR-T: Chimeric antigen receptor T-cell therapy; QALY: Quality-adjusted life year.
Table 1 presents the multivariable regression results for pharmaceutical interventions. The dependent variable was incremental QALYs for the first column of estimates. CAR-T was estimated to provide 5.029 more incremental QALYs than other innovations and the estimate was highly statistically significant (p < 0.001). The estimated coefficients on the linear and quadratic approval year trends indicated that incremental QALYs declined with approval year throughout the time period of the analysis, but that decline with approval year was not statistically significant in most years (a table listing the annual slopes of incremental effectiveness and cost–effectiveness with approval year, and associated p-values appears in the Supplementary data). Treatments for rare diseases yielded about half an additional incremental QALY of benefit but that coefficient fell short of statistical significance at the cutoff of p = 0.05 (p-value was 0.0515).
| Pharmaceutical interventions | ||
|---|---|---|
| Variables | Incremental QALYs | Incremental cost/QALY |
| CAR-T | 5.029† (3.879–6.180) | -1,129,000 (-2,592,000 to 333,884) |
| Approval year | -0.0608 (-0.134 to 0.0127) | -53,975 (-150,428 to 42,478) |
| Approval year squared | -0.00063 (-0.00550 to 0.00424) | 6536† (512.6–12,560) |
| Difference between publication year and approval year | -0.0598 (-0.137 to 0.0171) | -49,930 (-147,633 to 47,773) |
| Discount rate: 5% | -0.418 (-1.375 to 0.540) | -291,629 (-1,502,000 to 918,327) |
| Discount rate: could not determine | -0.0191 (-0.735 to 0.697) | 1,436,000† (577,574–2,295,000) |
| Time horizon: greater than or equal to 5 years but not lifetime | -0.100 (-0.494 to 0.293) | 391,513 (-83,633 to 866,660) |
| Time horizon: greater than or equal to 2 years and less than 5 years | -0.562 (-1.172 to 0.0479) | 267,849 (-472,684 to 1,008,000) |
| Time horizon: less than 2 years | -0.090 (-0.594 to 0.414) | 208,819 (-437,870 to 855,508) |
| Time horizon: none | -0.324 (-1.196 to 0.548) | -246,602 (-1,307,000 to 814,086) |
| Rare disease | 0.397 (-0.003 to 0.796) | 145,073 (-379,360 to 669,507) |
| Industry sponsorship | 0.273 (-0.123 to 0.669) | -101,731 (-599,857 to 396,395) |
| Study quality score | -0.063 (-0.330 to 0.205) | 235,596 (-97,090 to 568,282) |
| Constant | 0.318† (0.053–0.584) | 108,754 (-224,415 to 441,923) |
| Observations | 97 | 100 |
| Adjusted R-squared | 0.538 | 0.181 |
95% CI in parentheses.
†
p < 0.05; p-values are for two-sided tests.
Reference group is nonrare, non-CAR-T pharmaceutical interventions, a standard discount rate (3%, or none used in a short horizon model), lifetime time horizon and study not sponsored by a pharmaceutical or device manufacturer. All incremental costs/QALY inflated to 2017 US dollars. We normalized approval year to a value of zero in the year 2000. Approval year, approval year squared, difference between publication year and approval year, and quality of study variables were differenced from their respective means.
CAR-T: Chimeric antigen receptor T-cell therapy; QALY: Quality-adjusted life year.
Column two of Table 1 shows the results with incremental cost/QALY as dependent variable. The CAR-T coefficient was negative (indicating better cost–effectiveness), but the 95% CI was large and included negative and positive values. Based on the linear and quadratic approval year coefficients, there was evidence of a post-2004 decline in cost–effectiveness with approval year (i.e., cost/QALY increased with approval year after 2004), with p < 0.1 beginning in 2010 and p < 0.05 beginning in 2014. Studies for which the discount rate used could not be determined had significantly higher incremental costs/QALY, on average.
All intervention types (pharmaceutical & nonpharmaceutical)
Next, we turn to the analyses that included both pharmaceutical and nonpharmaceutical interventions. Because approval years are not relevant for the nonpharmaceutical innovations, we produced the box and whisker plots shown in Figures 3 & 4 to compare the distributions of incremental QALYs and incremental cost/QALY across the three types of interventions.
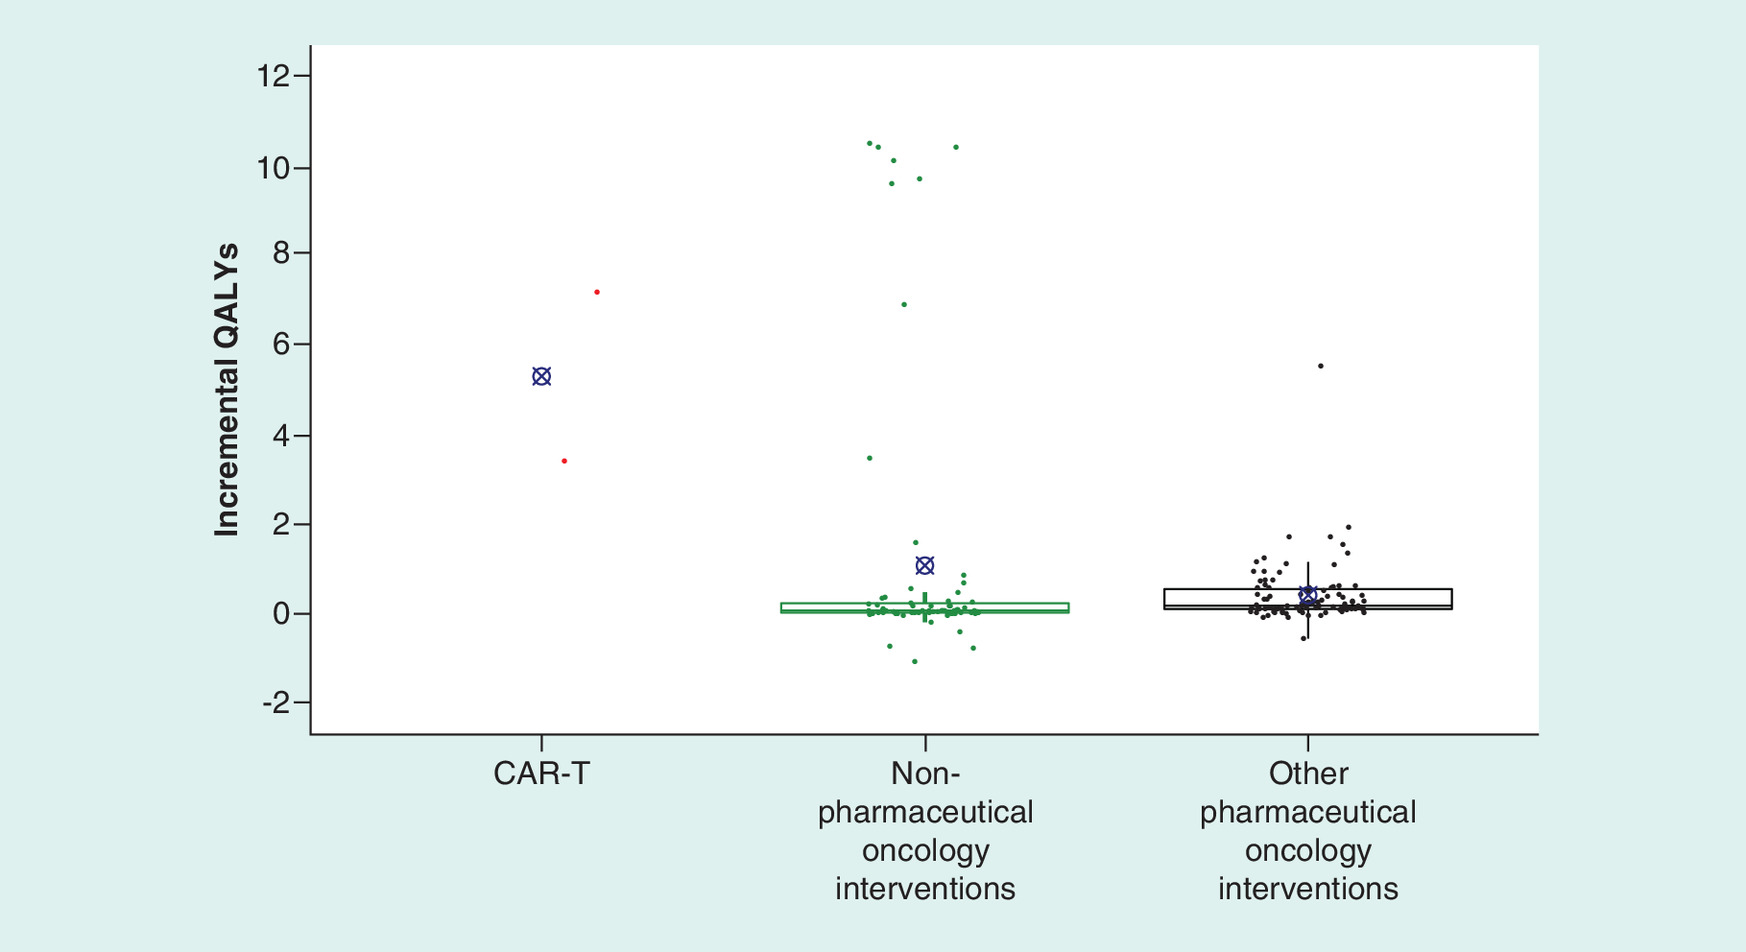
Figure 3. Distribution of incremental quality-adjusted life years by intervention type.
Boxplot displays interquartile range with 25th percentile and 75th percentile captured by the top and bottom edges of the box. Midline in box represents the median value, X denotes the mean. For nonpharmaceutical oncology treatments, the mean is 1.07 and median is 0.06. For other pharmaceutical oncology interventions (does not include CAR-T), the mean is 0.402 and median is 0.165.
CAR-T: Chimeric antigen receptor T-cell therapy; QALY: Quality-adjusted life year.
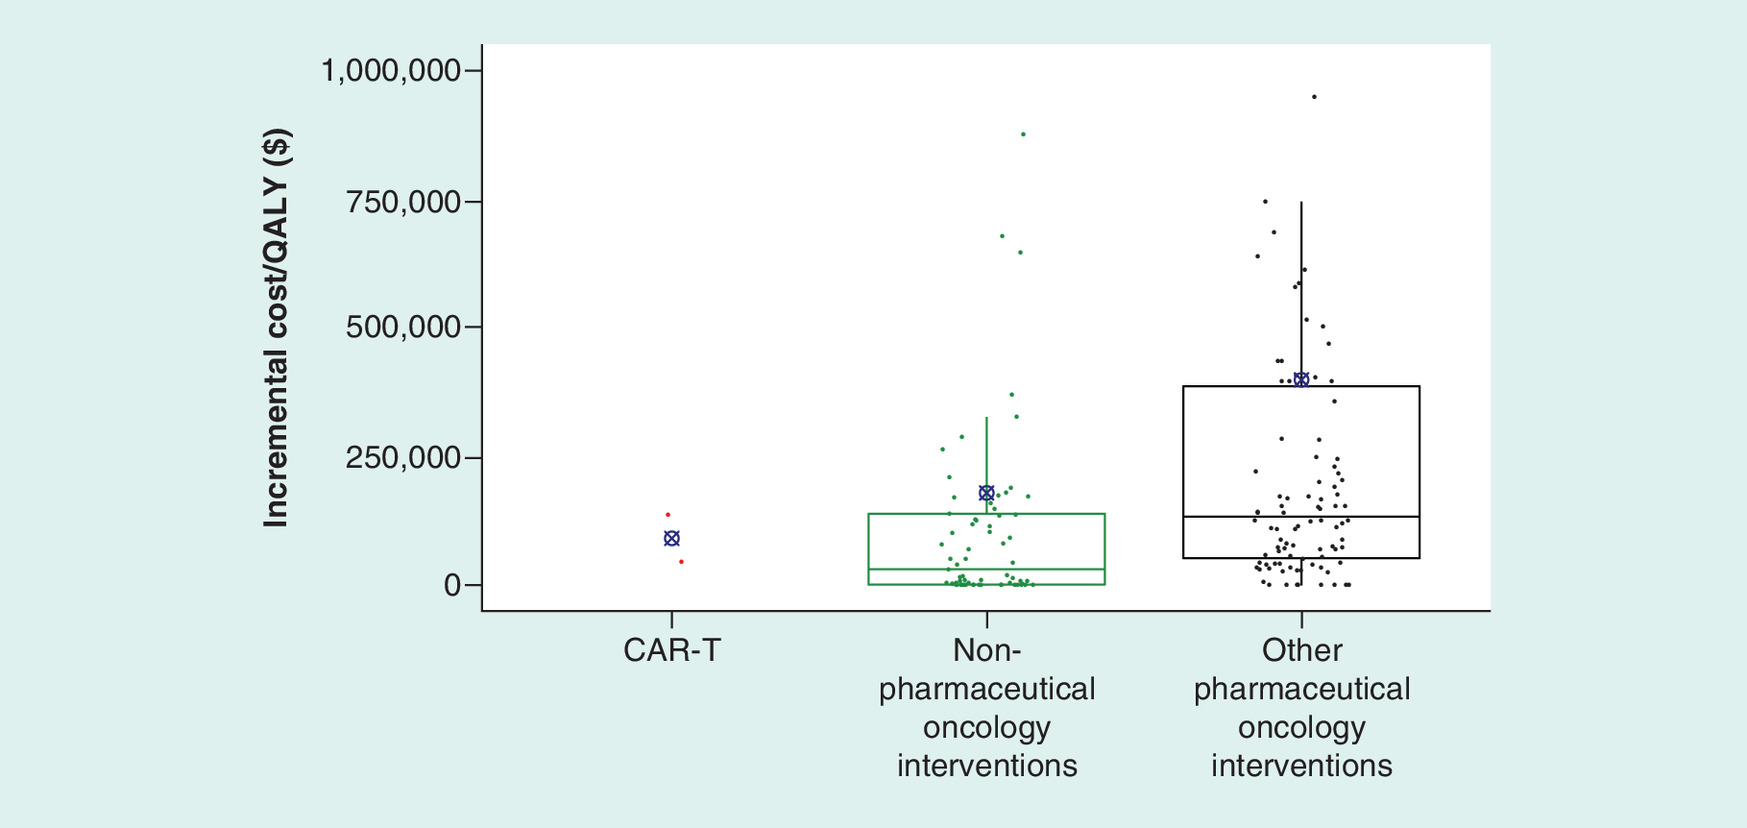
Figure 4. Distribution of incremental cost per quality-adjusted life year gained by intervention type.
Boxplot displays interquartile range with 25th percentile and 75th percentile captured by the top and bottom edges of the box. Midline in box represents the median value, X denotes the mean. All incremental costs per QALY gained inflated to 2017 US dollars. For other pharmaceutical oncology interventions (does not include CAR-T), the mean is US$398,509 and median is US$133,227. For nonpharmaceutical oncology treatments, the mean is US$179,112 and median is US$31,051. Graph excludes outliers with incremental cost per QALY gained above US$2,000,000, specifically a value of US$4,331,032 for nonpharmaceutical oncology interventions and values of US$8,283,165, US$3,816,068, US$2,821,167 and US$2,360,508 for other pharmaceutical oncology interventions.
CAR-T: Chimeric antigen receptor T-cell therapy; QALY: Quality-adjusted life year.
Figure 3 shows the full distribution of incremental QALYs for the three intervention types. CAR-T stood out from the other intervention types with both of its data points well above the interquartile ranges (and means) of the other types. Pharmaceutical interventions (non-CAR-T) performed slightly better than nonpharmaceutical interventions in terms of median QALYs added and the interquartile range, but because of a high degree of skewness in the distribution, the mean for nonpharmaceuticals exceeded the mean for non-CAR-T pharmaceuticals.
Figure 4 shows that distributions of incremental cost/QALY were very diffuse and exhibited a high degree of overlap across the intervention types. Among pharmaceutical treatments the two included CAR-T treatments fall at the 52nd and 28th percentiles for incremental cost/QALY. Relative to nonpharmaceutical treatments, CAR-T treatments fall at the 75th and 57th percentiles for incremental cost/QALY.
Table 2 shows multivariable regression results for the combined dataset using all intervention types. The poorer fit of these regressions – measured by comparing the adjusted R-squared values relative to those in Table 1 – suggests that nonpharmaceutical and pharmaceutical interventions are somewhat heterogeneous in terms of the relationships between the covariates describing technical aspects of the CUA analyses and the outcomes of interest.
| All intervention types | ||
|---|---|---|
| Variables | Incremental QALYs | Incremental cost/QALY |
| CAR-T | 4.965† (2.089–7.841) | -1,337,000† (-2,630,000 to -43,572) |
| Pharmaceutical indicator × approval year | -0.0312 (-0.215 to 0.153) | -34,709 (-119,867 to 50,448) |
| Pharmaceutical indicator × approval year squared | -0.00265 (-0.0146 to 0.00934) | 8715† (3393–14,038) |
| Pharmaceutical indicator × difference between publication year and approval year | 0.0140 (-0.165 to 0.193) | 23,669 (-56,654 to 103,992) |
| Discount rate: 5% | -0.012 (-2.279 to 2.255) | 206,927 (-827,965 to 1,242,000) |
| Discount rate: could not determine | -1.357† (-2.358 to -0.356) | 280,971 (-98,258 to 660,200) |
| Time horizon: greater than or equal to 5 years but not lifetime | -1.162† (-1.834 to -0.491) | 97,186 (-220,351 to 414,724) |
| Time horizon: greater than or equal to 2 years and less than 5 years | -0.572 (-1.784 to 0.641) | 202,507 (-334,176 to 739,191) |
| Time horizon: less than 2 years | -1.337† (-2.421 to -0.254) | 47,877 (-444,952 to 540,706) |
| Time Horizon: none | -2.537† (-4.536 to -0.538) | -226,617 (-1,119,000 to 666,111) |
| Rare disease | -0.178 (-0.898 to 0.542) | -149,758 (-499,352 to 199,837) |
| Nonpharmaceutical intervention | 0.351 (-0.336 to 1.037) | -248,962 (-583,589 to 85,664) |
| Industry sponsorship | 0.007 (-0.830 to 0.843) | 320,820 (-86,432 to 728,071) |
| Study quality score | -1.234† (-1.635 to -0.833) | -74,370 (-249,653 to 100,914) |
| Constant | 1.433† (0.838–2.028) | 258,215 (-9364 to 525,795) |
| Observations | 168 | 169 |
| Adjusted R-squared | 0.280 | 0.090 |
95% CI in parentheses.
†
p < 0.05; p-values are for two-sided tests.
Reference group is nonrare, non-CAR-T pharmaceutical interventions, a standard discount rate (3%, or none used in a short horizon model), lifetime time horizon and study not sponsored by a pharmaceutical or device manufacturer. Additional tests: The coefficient on CAR-T is greater than coefficient on nonpharmaceutical intervention in incremental QALY regression, CAR-T provides 4.61 (95% CI: 1.67, 7.56) more incremental QALYs than nonpharmaceutical interventions, p = 0.002; and The coefficient on CAR-T is statistically equal to coefficient on nonpharmaceutical intervention in incremental cost/QALY regression, p = 0.109. All incremental costs/QALY inflated to 2017 US dollars. We normalized approval year to a value of zero in year 2000. Approval year, approval year squared, difference between publication year and approval year, and quality of study variables were differenced from their respective means.
CAR-T: Chimeric antigen receptor T-cell therapy; QALY: Quality-adjusted life year.
Nonetheless, certain key results continue to be apparent even in this pooled analysis. The results with incremental QALYs as dependent variable (column 1 of Table 2) again show a substantially positive and statistically significant effect of CAR-T with a point estimate of 4.965 more incremental QALYs (p < 0.001) than the reference group of other pharmaceutical innovations. A test of the hypothesis that CAR-T added more QALYs than nonpharmaceutical interventions showed a highly significant (p = 0.002) difference of 4.614 more incremental QALYs from CAR-T. Studies for which the discount rate used could not be determined found significantly fewer incremental QALYs. Studies with shorter time horizons generally found fewer incremental QALYs (the one exception to this pattern was studies with 2- to 5-year horizons, which showed no significant difference from studies that used a lifetime horizon). Studies that received higher quality scores from the Tufts reviewers tended to find fewer incremental QALYs. Other variables were not statistically significant.
The cost–effectiveness results using all intervention types appear in column 2 of Table 2. Again, standard errors and 95% CIs were large, reflecting the high degree of variability seen in incremental cost/QALY values in Figure 4. Although the confidence interval was large, CAR-T had significantly better cost–effectiveness than the reference group of (non-CAR-T) pharmaceutical interventions. A test of the hypothesis that CAR-T differed from nonpharmaceutical interventions on incremental cost/QALY showed no significant difference (p = 0.109), again reflecting large standard errors in the estimates. Based on the linear and quadratic approval year coefficients for pharmaceutical innovations, there was evidence of a post-2002 decline in cost–effectiveness with approval year (i.e., increasing cost/QALY after 2002), with statistical significance (p < 0.05) from 2006 onward (complete table of slopes with approval year, and associated p-values, appears in the Supplementary data).
Sensitivity analysis
We tested the sensitivity of our results to a variety of changes including: the method for aggregating estimates for the same intervention and indication, the use of robust regression, separating the CAR-T effect by indication and the addition of results from the most recent CAR-T studies [35]. Table 3 shows the estimated coefficients and 95% CIs for the CAR-T indicator variable from the multivariable regressions for the set of sensitivity analyses we conducted. The full set of regression results for all of the sensitivity specifications appears in the Supplementary data.
| Pharmaceutical sample | Pharmaceutical and nonpharmaceutical sample | |||
|---|---|---|---|---|
| Dependent variable | Incremental QALYs | Incremental cost/QALY | Incremental QALYs | Incremental cost/QALY |
| Base case | 5.029† (3.879–6.180) | -1,129,000 (-2,592,000 to 333,884) | 4.965† (2.089–7.841) | -1,337,000† (-2,630,000 to -43,572) |
| Each estimate as unique observation | 5.002† (3.890–6.114) | -1,170,000 (-2,602,000–262,354) | 5.035† (2.232–7.837) | -1,437,000† (-2,776,000 to -98,279) |
| Grouping estimates with common fallback therapy | 5.101† (3.826–6.375) | -896,616 (-2,140,000 to 346,549) | 5.269† (2.197–8.341) | -1,021,000 (-2,161,000 to 118,601) |
| Robust regression: least absolute deviations estimates | 3.034† (2.140–3.928) | -265,933 (-678,636 to 146,770) | 6.983† (6.174–7.793) | -249,432 (-534,110 to 35,245) |
| Separating the CAR-T indications – pALL – DLBCL | 6.919† (5.551–8.287) 3.139† (1.771–4.507) | -1,174,000 (-3,106,000 to 757,222) -1,084,000 (-3,016,000 to 847,429) | 6.855† (3.095–10.62) 3.075 (-0.685 to 6.835) | -1,382,000 (-3,094,000 to 330,341) -1,292,000 (-3,004,000 to 420,548) |
| Adding most recent studies (necessarily omits study_quality as regressor) – Base case dataset – Dataset including newest studies | 5.026† (3.882–6.171) 3.673† (2.680–4.665) | -1,128,000 (-2,599,000 to 343,066) -1,071,000† (-2,120,000 to -21,862) | 5.043† (1.849–8.237) 3.724† (1.385–6.062) | -1,341,000† (-2,633,000 to -48,898) -1,355,000† (-2,275,000 to -434,464) |
95% CI in parentheses.
†
p < 0.05; p-values are for two-sided tests.
Reference group is nonrare, non-CAR-T pharmaceutical interventions, a standard discount rate (3%, or none used in a short horizon model), lifetime time horizon and study not sponsored by a pharmaceutical or device manufacturer. All incremental costs/QALY inflated to 2017 US dollars.
CAR-T: Chimeric antigen receptor T-cell therapy; DLBCL: Diffuse large B-cell lymphoma; pALL: Pediatric acute lymphoblastic leukemia; QALY: Quality-adjusted life year.
Alternative methods for grouping multiple estimates
We tested the sensitivity of the results to the alternative approaches to grouping multiple estimates appearing in the Tufts database for the same intervention-indication. Those approaches were discussed in the Methods section. Rows 2 and 3 of Table 3 show the estimated coefficients on the CAR-T indicator variable from multivariable regressions that are the same as those presented for our base case (Tables 1 & 2) except that different approaches were used to group multiple CUA estimates.
Both alternatives yielded results similar to base case results (see Table 3). For the pharmaceutical-only analysis, CAR-T continued to have a large and statistically significant increase of 5.002 and 5.101 incremental QALYs in the sensitivity runs compared with 5.029 in the base case.
For the analysis that combined both nonpharmaceutical and pharmaceutical interventions in a single regression we continued to see a large and statistically significant increase of 5.035 and 5.269 incremental QALYs for CAR-T compared with other pharmaceutical interventions. The only departure from the base case findings for CAR-T was that in the incremental cost/QALY regression, one of the sensitivity analyses yielded a statistically insignificant difference for CAR-T (p = 0.0787) versus other pharmacologic innovations. However, the point estimate continued to imply better cost–effectiveness for CAR-T.
Using robust regression
We also used the Least Absolute Deviations (LAD) regression method as an alternative to ordinary least squares. The LAD approach is considered more robust to outliers than least squares regression, while on the other hand, if outliers are relatively important in terms of the information they convey, then least squares is preferred. As seen in the fourth group of CAR-T estimates in Table 3, the LAD estimates also show a significantly greater number of incremental QALYs for CAR-T for both the pharmaceutical-only sample and the sample that combines both pharmaceutical and nonpharmaceutical interventions. CAR-T is not significantly different from other interventions in terms of cost–effectiveness in either sample and the coefficient estimates have a lower magnitude than their base case counterparts. The confidence intervals overlap with those of the base case for all four base case regressions. In terms of incremental QALYs, the point estimate for CAR-T is lower than its base case counterpart in the pharmaceutical-only regressions but is higher than the base case estimate in the regressions that include both pharmaceutical and nonpharmaceutical interventions.
Separating the CAR-T indications
We also checked on the sensitivity of the CAR-T results by using separate CAR-T indicator variables for the two indications for which CAR-T has been analyzed – pALL and DLBCL. Note that because the ICER report analyzed the use of tisagenlecleucel for pALL and axicabtagene ciloleucel for DLBCL, we cannot separately identify the effects of the two interventions versus the two indications. The fifth row of Table 3 shows that, in the sample confined to pharmaceutical innovations, greater incremental QALYs were gained for pALL (using tisagenlecleucel) than for DLBCL (using axicabtagene ciloleucel). Nonetheless, both effects were significantly positive – indicating that in both cases CAR-T therapy provided greater incremental effectiveness than non-CAR-T pharmaceutical innovations on average. The analysis that included both nonpharmaceutical and pharmaceutical innovations also showed a significant CAR-T effect for pALL, but the effect for DLBCL lost statistical significance. For neither indication did the use of CAR-T show significant differences in incremental cost/QALY from other interventions.
Adding the most recent studies
Though our estimates of incremental QALYs and cost–effectiveness were obtained from the ICER’s analysis of CAR-T therapies, other studies have been published after our data was collected (30 June 2018) and analysis conducted. There have been four additional CUAs of CAR-T therapies in the US setting, excluding journal versions of the ICER analysis that was our data source [36–39]. We tested the sensitivity of our base case results to the inclusion of these newer estimates. The studies cannot be directly added as part of the base case because one of the regressors – the Tufts measure of study quality – is not available for the newest studies. Instead, we conducted a sensitivity analysis by running the multivariable regressions without the study quality variable, both for our base case dataset and a new dataset that includes the most recent studies; further details appear in the Supplementary data. We compared the results from the two sets of regressions in the final row of Table 3.
As shown in the final row of Table 3, the sensitivity analysis and (revised) base case analysis produce overlapping confidence intervals. In terms of incremental QALYs, all four cases find that CAR-T therapies provided significantly more incremental effectiveness than non-CAR-T innovations, and formal hypothesis tests also showed that CAR-T provided significantly more incremental QALYs than nonpharmaceutical interventions. The estimates using the newer studies had lower point estimates for CAR-T in terms of incremental effectiveness, but those estimates continued to be statistically significant. In terms of incremental cost/QALY, CAR-T was significantly more cost-effective (lower cost/QALY) than other pharmaceutical innovations in three of the four specifications.
Discussion
Our study collects the history of what therapies contributed – in terms of incremental health benefit and incremental cost–effectiveness – compared with a relevant standard of care therapy at the time it was studied. Simply because a therapy appears to score well in the analysis does not mean it would be a better choice today than some other therapy in our dataset. Perhaps other therapies were subsequently developed, or the indications may quite simply differ. Hence, the comparator against which a particular therapy is assessed will generally vary over time and indication. What our study does do is to establish a historical perspective on innovation in oncology by measuring the incremental contribution at the time. Our analysis is properly understood as a high-level view of the history of oncology innovation, not a decision analysis of the most appropriate therapy to choose.
The most striking result from our analysis is the substantially greater number of incremental QALYs provided by CAR-T relative to both other pharmaceutical and nonpharmaceutical innovations. These results were highly significant throughout the analysis. In the base case, CAR-T showed between 4.965 and 5.029 more incremental QALYs than other pharmaceutical interventions and 4.614 more incremental QALYs than nonpharmaceutical interventions, on average, after controlling for other covariates.
CAR-T had similar cost–effectiveness compared with other pharmaceutical innovations. In the regression that included only pharmaceutical innovations, there was no statistical difference between CAR-T and other innovations, while CAR-T did show a statistically lower cost/QALY relative to pharmaceutical innovations in the regression that included both pharmaceutical and nonpharmaceutical treatments. In simple comparisons, the two CAR-T cases outperformed 48 and 72% of other pharmaceutical treatments. CAR-T appeared to be comparable to nonpharmaceutical interventions in terms of cost–effectiveness. The multivariable regression analysis showed no significant difference in cost–effectiveness between CAR-T and nonpharmaceutical interventions. Looking at unadjusted comparisons, the two CAR-T cases were more cost-effective than 43 and 25% of nonpharmaceutical treatments. The unadjusted mean incremental cost/QALY among the CAR-T treatments was lower (more cost-effective) than those for both nonpharmaceutical and other pharmaceutical treatments.
Our results suggest that CAR-T represents a break from a trend of stagnant returns in pharmaceutical innovation. The regression analysis showed a decline in incremental QALYs with approval year for non-CAR-T pharmaceutical innovations, although not statistically significant in the majority of years. Simple comparisons show that for approval years before 2010 the average incremental QALY was 0.52 (median: 0.24, interquartile range [IQR]: 0.09–0.63), while for approval years of 2010 or later the average was 0.27 (median: 0.12, IQR: 0.09–0.34). In contrast, the CAR-T cases were at 7.18 and 3.40. We also found a consistent pattern wherein cost–effectiveness began to worsen with approval year after about 2004 with that worsening ultimately becoming statistically significant at p = 0.05. Simple comparisons show that for approval years before 2010 the average incremental cost/QALY was US$170,364 (median: US$73,984, IQR: US$31,037–US$221,492), while for approval years of 2010 or later the average was US$629,107 (median: US$175,045, IQR: US$125,750–$468,123). In terms of the standard cost–effectiveness thresholds of either US$100,000 or US$150,000, there also appeared to be a worsening over time. For approval years prior to 2010, 59% of innovations were below the US$100,000 threshold and 70% were below the US$150,000 threshold. For approval years of 2010 or later, excluding CAR-T, 16% of innovations were below the US$100,000 threshold and 34% were below the US$150,000 threshold. The CAR-T cases were at US$45,871 and US$136,078 (all dollar figures were adjusted to 2017 USD).
Other studies of non-CAR-T innovations using different measures of incremental outcomes also suggest stagnant returns in terms of outcomes and cost–effectiveness. For example, Saluja et al. looked at anticancer treatments approved by the FDA between 2006 and 2015 and found a flat trend in American Society of Clinical Oncology (ASCO) clinical benefit scores and a declining but insignificant trend in European Society of Medical Oncology (ESMO) clinical benefit scores, although prices and incremental costs increased significantly with approval year [40]. The Tufts database used for our analysis included published CUAs through 2016 at the time of our analysis (30 June 2018). A narrow, targeted search of CUA analyses published after 2016 did not suggest any break from these trends for non-CAR-T pharmaceutical interventions – incremental QALYs were below 1 and cost/QALY above US$100,000 for analyses conducted in a US setting [41,42].
CAR-T may represent a paradigm shift in innovation, whereby incremental gains over previous technology can be large relative to the prior trend. In the long run, even within the class of CAR-T therapies, we might expect diminishing returns to set in again. When that new point of diminishing returns will begin is perhaps impossible to say. In the case of CAR-T style therapies, incremental gains may begin to diminish for three reasons: it simply becomes more difficult to make new innovations of equivalent incremental value; the indications where incremental value is the greatest are the earliest ones to be pursued; and over time, older CAR-T products become the relevant comparators for newer products. Indeed, the evolution of any new therapeutic class can be expected to eventually face those same reasons for declining marginal returns.
Existing CUAs of CAR-T have cautioned about factors that contribute to uncertainty in the estimates of effectiveness and cost–effectiveness. CAR-T analyses have been based on single-arm trials and long-term follow-up of treated cohorts was limited. As some recent articles have illustrated, results are sensitive to modeling assumptions regarding longer-term survival [30,36,38,39]. For example, for axicabtagene ciloleucel in DLBCL Whittington et al. (2019) found a range from 1.52 to 4.9 incremental QALYs and incremental costs/QALY from US$100,400 to US$289,000 depending on modeling assumptions regarding long-term survival (commercial payer perspective). Lin et al. (2019) found a range from 2.5 to 3.72 incremental QALYs and incremental costs/QALY from US$129,000 to US$194,000 for that same therapy and indication, again depending on modeling assumptions affecting longer-term survival.
The effectiveness of CAR-T treatments may differ depending on the indication and therapy. Our sensitivity results suggested more incremental QALYs in pALL using tisagenlecleucel than in DLBCL using axicabtagene ciloleucel, reflecting the ICER analysis. More research, however, will be required to clarify the relative effectiveness and value of CAR-T therapies both across different indications and specific CAR-T treatments.
Limitations
Our analysis was limited to interventions and indications that have been studied in published CUAs. To the extent that some intervention-indications have not been studied in a published CUA, our results will not apply to the entire range of interventions that have been developed for treating cancer. For a sense of context, we collected a list of antineoplastic agents approved by the FDA during the 5-year period 2006 to 2010 and found that 58% of those innovations were included in our analysis because of the existence of a published CUA in a US setting.
We limited to CUAs conducted for the US setting. Different results, especially for incremental cost/QALY, may have occurred for other settings to the extent that pricing of therapies and other healthcare system costs differ from the US setting.
Our analysis included results from only those value frameworks that make use of incremental QALYs and incremental cost/QALY as their measures of an intervention’s characteristics. We did this in order to get a large sample of interventions and to use a framework that has become standard for valuing healthcare interventions. Nonetheless, there are other methods for determining value and a number of studies suggest additional sources of value that have generally been omitted from standard analyses [43].
Conclusion
Compared with other recent innovations against cancer that have been formally studied by CUAs, the innovation of CAR-T therapy has provided significantly greater gains in effectiveness, measured by incremental QALYs. At the same time, its cost–benefit ratio is often not significantly different from those of recent innovations (although in a minority of specifications it was significantly more cost-effective). In the context of the recent history of oncology treatments, those findings suggest that CAR-T represents a significant clinical breakthrough at a cost proportional to other innovations.
•
There is mixed evidence on returns to oncology innovations. Some recent literature suggests diminishing returns from oncology innovation, with effectiveness not keeping pace with the increasing costs of newly approved pharmaceuticals. However, others argue that returns to oncology spending have been substantial.
•
This study analyzes the recent history of pharmaceutical and nonpharmaceutical anticancer innovations in terms of trends in outcomes – measured by incremental quality-adjusted life years (QALYs), and in cost–effectiveness – measured by incremental cost per QALY gained. We assess how chimeric antigen receptor T-cell (CAR-T) therapy fits into that history of innovations.
•
Data for this study were primarily obtained from the Cost–Effectiveness Analysis Registry of the Tufts Medical Center – a registry of all published cost-utility analyses (CUAs), and supplemented with data from the Institute for Clinical and Economic Review’s analysis of CAR-T therapies, and data on FDA approval years for pharmacologic innovations.
•
Graphical analysis suggests that incremental QALYs are trending down slightly for pharmacologic anticancer innovations. There were, however, three innovations exhibiting unusually high incremental QALYs that departed from this trend – imatinib (approved in 2001) and the two CAR-T therapies (approved in 2017).
•
The distribution of incremental cost per QALY gained was highly variable across therapies. On average, the CAR-T therapies ranked at the 40th percentile of cost–effectiveness among pharmacologic treatments (lower is better in terms of cost–effectiveness) and 66th percentile among nonpharmacologic treatments.
•
Multivariable regression analysis was conducted to control for technical aspects of the CUA (such as discount rate and time horizon) and for other potentially important factors including FDA approval year, an indicator for rare disease, number of years between FDA approval and publication of the CUA, industry sponsorship and a measure of study quality.
•
The regression analysis found that CAR-T provided 5.03 (95% CI: 3.88–6.18) more incremental QALYs than the average pharmaceutical intervention and 4.61 (95% CI: 1.67–7.56) more than the average nonpharmaceutical intervention, while retaining similar cost–effectiveness to other innovations.
•
The regression estimates indicated that there was a downward trend with approval year in incremental QALYs (but not statistically significant in most years) among the non-CAR-T pharmacologic interventions and that incremental cost–effectiveness worsened over time after the early-to-mid 2000s (becoming statistically significant a few years later).
•
In terms of incremental effectiveness, CAR-T therapy appeared to be a significant positive break from a period of stagnant returns to pharmacologic anticancer innovations at a cost–effectiveness ratio in line with other, older innovations. CAR-T also outperformed recently studied nonpharmacologic oncology treatments in terms of incremental effectiveness while maintaining similar incremental cost–effectiveness.
Supplementary data
To view the supplementary data that accompany this paper please visit the journal website at: Supplementary Material
The nonproprietary data have been provided in the Supplementary Materials on the JCER website. See the website of the Center for the Evaluation of Value and Risk in Health at Tufts Medical Center for information on obtaining access to the Cost–Effectiveness Analysis Registry.
Author contributions
JR Baumgardner, MS Brauer, J Zhang, Y Hao, Z Liu and DN Lakdawalla were responsible for the study concept/design. JR Baumgardner and MS Brauer contributed to the data acquisition. JR Baumgardner and MS Brauer performed the statistical analysis. JR Baumgardner, MS Brauer, J Zhang, Y Hao, Z Liu and DN Lakdawalla contributed to the analysis and interpretation of data. JR Baumgardner, MS Brauer and DN Lakdawalla drafted the manuscript. JR Baumgardner, MS Brauer, J Zhang, Y Hao, Z Liu and DN Lakdawalla contributed to the critical revision of the manuscript for important intellectual content. JR Baumgardner, MS Brauer, J Zhang and DN Lakdawalla contributed to obtain funding. JR Baumgardner and J Zhang were responsible for the supervision.
Acknowledgments
The authors thank Katie Everson of Precision Health Economics for providing analytic support and Rebecca Kee, Kevin Chiu and Lauren Zhao of Precision Health Economics for providing research support. This study used data from the Cost–Effectiveness Analysis Registry. The authors thank the Center for the Evaluation of Value and Risk in Health at Tufts Medical Center for creating and maintaining the Cost–Effectiveness Analysis Registry.
Results of a related analysis were presented at the American Society of Hematology Annual Meeting in December 2018.
Financial & competing interests disclosure
Financial support for this research was provided by Novartis Pharmaceuticals Corporation to Precision Health Economics. JR Baumgardner and MS Brauer are employed by Precision Health Economics, a healthcare consultancy with clients in the life science industry. J Zhang, Y Hao and Z Liu are employed by and own stock in Novartis. DN Lakdawalla is a consultant to Precision Health Economics and holds equity in Precision Medicine Group, parent company of Precision Health Economics. The clinical oncologist who reviewed the appropriateness of comparators used in the included cost–effectiveness analyses reports being a paid consultant for Precision Health Economics and reports receiving compensation for scientific advice provided in the design and execution of this manuscript. In order to avoid conflicts of interest, the oncologist was not aware of the source of financial support for the project nor were the funder and its employees aware of the oncologist’s identity. The authors have no other relevant affiliations or financial involvement with any organization or entity with a financial interest in or financial conflict with the subject matter or materials discussed in the manuscript apart from those disclosed.
No writing assistance was utilized in the production of this manuscript.
Supplementary Material
File (suppl_data.zip)
- Download
- 92.79 KB
References
1.
Harrison CJ. Acute lymphoblastic leukemia. Clin. Lab. Med. 31(4), 631–647 (2011).
2.
Food and Drug Administration. Highlights of prescribing information: Kymriah (2017). www.fda.gov/downloads/BiologicsBloodVaccines/CellularGeneTherapyProducts/ApprovedProducts/UCM573941.pdf
3.
Food and Drug Administration. Highlights of prescribing information: Yescarta (2017). www.fda.gov/downloads/BiologicsBloodVaccines/CellularGeneTherapyProducts/ApprovedProducts/UCM581226.pdf
4.
National Institute for Health and Care Excellence. Tisagenlecleucel for treating relapsed or refractory B-cell acute lymphoblastic leukaemia in people aged up to 25 years (2018). www.nice.org.uk/Guidance/TA554
5.
National Institute for Health and Care Excellence. Axicabtagene ciloleucel for treating diffuse large B-cell lymphoma and primary mediastinal large B-cell lymphoma after 2 or more systemic therapies (2019). www.nice.org.uk/Guidance/TA559
6.
European Medicines Agency. Assessment report: Kymriah. p. 186 (2018). www.ema.europa.eu/en/medicines/human/EPAR/kymriah
7.
European Medicines Agency. Yescarta (axicabtagene ciloleucel) summary of opinion (initial authorisation) (2018). www.ema.europa.eu/en/medicines/human/EPAR/yescarta
8.
Novartis leukaemia drug approved in Switzerland (2018). www.swissinfo.ch/eng/sci-tech/kymriah_novartis-leukaemia-drug-approved-in-switzerland/44490894
9.
TGA approves first CAR-T therapy (2018). https://biotechdispatch.com.au/news/tga-approves-first-car-t-therapy
10.
Pharmaceutical Research and Manufacturers of America. Medicines in development for cancer 2018 report (2018). www.phrma.org/en/Report/Medicines-in-Development-for-Cancer-2018-Report
11.
Kaiser Health News. Cascade of costs could push CAR-T therapy to $1.5M per patient (2017). https://endpts.com/cascade-of-costs-could-push-new-gene-therapy-above-1-million-per-patient/
12.
Grady D, FDA. Approves first gene-altering leukemia treatment, costing $475,000. New York Times (2017). www.nytimes.com/2017/08/30/health/gene-therapy-cancer.html
13.
Loftus P, Roland D. FDA approves pioneering cancer treatment with $475,000 price tag (2017). www.wsj.com/articles/fda-approves-first-gene-therapy-in-u-s-1504108512
14.
Hernandez I, Prasad V, Gellad WF. Total costs of chimeric antigen receptor T-cell immunotherapy. JAMA Oncol. 4(7), 994–996 (2018).
15.
Tice J, Walsh JME, Otuonye I et al. Chimeric Antigen Receptor T-Cell Therapy for B-Cell Cancers: Effectiveness and Value. Institute for Clinical and Economic Review Boston, MA (2017).
16.
American Cancer Society. Cancer facts & figures 2018 (2018). www.cancer.org/research/cancer-facts-statistics/all-cancer-facts-figures/cancer-facts-figures-2018.html
17.
National Cancer Institute. Professional judgment budget proposal (2018). www.cancer.gov/about-nci/budget/plan/budget-proposal-fy-2019
18.
Howard DH, Bach PB, Berndt ER, Conti RM. Pricing in the market for anticancer drugs. J. Econ. Perspect. 29(1), 139–162 (2015).
19.
Mailankody S, Prasad V. Five years of cancer drug approvals: innovation, efficacy, and costs. JAMA Oncol. 1(4), 539–540 (2015).
20.
Soneji S, Yang J. New analysis reexamines the value of cancer care in the United States compared to Western Europe. Health Aff. (Millwood) 34(3), 390–397 (2015).
21.
Davis C, Naci H, Gurpinar E, Poplavska E, Pinto A, Aggarwal A. Availability of evidence of benefits on overall survival and quality of life of cancer drugs approved by European Medicines Agency: retrospective cohort study of drug approvals 2009–13. BMJ 359, j4530 (2017).
22.
Saluja R, Arciero VS, Cheng S et al. Examining trends in cost and clinical benefit of novel anticancer drugs over time. J. Oncol. Pract. 14(5), e280–e294 (2018).
23.
Lu Y, Penrod JR, Sood N, Woodby S, Philipson T. Dynamic cost–effectiveness of oncology drugs. Am. J. Manag. Care 18(Suppl. 11), S249–S256 (2012).
24.
Howard DH, Chernew ME, Abdelgawad T, Smith GL, Sollano J, Grabowski DC. New anticancer drugs associated with large increases in costs and life expectancy. Health Aff. (Millwood) 35(9), 1581–1587 (2016).
25.
Stevens W, Philipson TJ, Khan ZM, MacEwan JP, Linthicum MT, Goldman DP. Cancer mortality reductions were greatest among countries where cancer care spending rose the most, 1995–2007. Health Aff. 34(4), 562–570 (2015).
26.
Center for the Evaluation of Value and Risk in Health. The Cost–Effectiveness Analysis Registry. Tufts Medical Center, MA, USA. https://cevr.tuftsmedicalcenter.org/databases/cea-registry
27.
Greenberg D, Earle C, Fang C-H, Eldar-Lissai A, Neumann PJ. When is cancer care cost-effective? A systematic overview of cost–utility analyses in oncology. J. Natl Cancer Inst. 102(2), 82–88 (2010).
28.
Neumann PJ, Fang C-H, Cohen JT. 30 Years of pharmaceutical cost–utility analyses: growth, diversity and methodological improvement. Pharmacoeconomics 27(10), 861–872 (2009).
29.
Saret CJ, Winn AN, Shah G et al. Value of innovation in hematologic malignancies: a systematic review of published cost–effectiveness analyses. Blood 125(12), 1866–1869 (2015).
30.
Whittington MD, McQueen RB, Ollendorf DA et al. Long-term survival and value of chimeric antigen receptor T-cell therapy for pediatric patients with relapsed or refractory leukemia. JAMA Pediatr. 172(12), 1161–1168 (2018).
31.
Tice J, Walsh JME, Otuonye I et al. Chimeric Antigen Receptor T-Cell Therapy for B-Cell Cancers: Effectiveness and Value. Final Evidence Report. Institute for Clinical and Economic Review, MA, USA (2018).
32.
Center for the Evaluation of Value and Risk in Health. The Cost–Effectiveness Analysis (CEA) Registry, User’s Guide (v3.1, 2011–2012). MA, USA (2012).
33.
National Institutes of Health. Genetic and Rare Disease Information Center (2018). https://rarediseases.info.nih.gov/diseases
34.
Garrison LP Jr, Veenstra DL. The economic value of innovative treatments over the product life cycle: the case of targeted trastuzumab therapy for breast cancer. Value Health 12(8), 1118–1123 (2009).
35.
STATA. qreg – Quantile regression (2019). www.stata.com/manuals13/rqreg.pdf
36.
Lin JK, Muffly LS, Spinner MA et al. Cost effectiveness of chimeric antigen receptor T-cell therapy in multiply relapsed or refractory adult large B-cell lymphoma. J. Clin. Oncol. 37(24), 2105–2119 (2019).
37.
Roth JA, Sullivan SD, Lin VW et al. Cost–effectiveness of axicabtagene ciloleucel for adult patients with relapsed or refractory large B-cell lymphoma in the United States. J. Med. Econ. 21(12), 1238–1245 (2018).
38.
Lin JK, Lerman BJ, Barnes JI et al. Cost–effectiveness of chimeric antigen receptor T-cell therapy in relapsed or refractory pediatric B-cell acute lymphoblastic leukemia. J. Clin. Oncol. 36(32), 3192–3202 (2018).
39.
Whittington MD, McQueen RB, Ollendorf DA et al. Long-term survival and cost–effectiveness associated with axicabtagene ciloleucel vs chemotherapy for treatment of B-cell lymphoma. JAMA Netw. Open 2(2), e190035 (2019).
40.
Saluja R, Arciero VS, Cheng S et al. Examining trends in cost and clinical benefit of novel anticancer drugs over time. J. Oncol. Pract. 14(5), e280–e294 (2018).
41.
Huntington SF, von Keudell G, Davidoff AJ, Gross CP, Prasad SA. Cost–effectiveness analysis of brentuximab vedotin with chemotherapy in newly diagnosed stage III and IV Hodgkin lymphoma. J. Clin. Oncol. 36(33), 3307–3314 (2018).
42.
Graham CN, Christodoulopoulou A, Knox HN et al. A within-trial cost–effectiveness analysis of panitumumab compared with bevacizumab in the first-line treatment of patients with wild-type RAS metastatic colorectal cancer in the US. J. Med. Econ. 21(11), 1075–1083 (2018).
43.
Lakdawalla DN, Doshi JA, Garrison LP, Phelps CE, Basu A, Danzon PM. Defining elements of value in health care – a health economics approach: an ISPOR Special Task Force report. Value Health 21(2), 131–139 (2018).
Information & Authors
Information
Published In
Pages: 327 - 340
PubMed: 32056442
Copyright
© 2020 Future Medicine Ltd.
History
Received: 24 May 2019
Accepted: 7 January 2020
Published online: 14 February 2020
Keywords:
Authors
Metrics & Citations
Metrics
Article Usage
Article usage data only available from February 2023. Historical article usage data, showing the number of article downloads, is available upon request.
Citations
How to Cite
CAR-T therapy and historical trends in effectiveness and cost–effectiveness of oncology treatments. (2020) Journal of Comparative Effectiveness Research. DOI: 10.2217/cer-2019-0065
Export citation
Select the citation format you wish to export for this article or chapter.
Citing Literature
- Andrea P. Chung, Jason T. Shafrin, Sachin Vadgama, Kristen Hurley, Miguel-Angel Perales, Leonard C. Alsfeld, Sanjana Muthukrishnan, Anik R. Patel, Gunjan L. Shah, Richard T. Maziarz, Inequalities in CAR T-cell therapy access for US patients with relapsed/refractory DLBCL: a SEER-Medicare data analysis, Blood Advances, 10.1182/bloodadvances.2024015634, 9, 18, (4727-4735), (2025).
- Qing Xiao, Yi Liu, Tingting Li, Chaoyu Wang, Sanxiu He, Liuyue Zhai, Zailin Yang, Xiaomei Zhang, Yongzhong Wu, Yao Liu, Viral oncogenesis in cancer: from mechanisms to therapeutics, Signal Transduction and Targeted Therapy, 10.1038/s41392-025-02197-9, 10, 1, (2025).
- Elisabete Gonçalves, CAR-T cell therapies: patient access and affordability solutions, Future Science OA, 10.1080/20565623.2025.2483613, 11, 1, (2025).
- Rossana Di Staso, Beatrice Casadei, Marianna Gentilini, Serafina Guadagnuolo, Cinzia Pellegrini, Alessandro Broccoli, Davide Gori, Riccardo Masetti, Vittorio Stefoni, Francesca Bonifazi, Pier Luigi Zinzani, Lisa Argnani, Economic evaluation of anti-CD19 CAR T-cell pathway for large B-cell lymphomas in the real-life setting: the experience of an Italian hub center in the first three years of activity, Annals of Hematology, 10.1007/s00277-024-05766-0, 103, 7, (2499-2509), (2024).
- Mikhail Y. Salnikov, Katelyn M. MacNeil, Joe S. Mymryk, The viral etiology of EBV-associated gastric cancers contributes to their unique pathology, clinical outcomes, treatment responses and immune landscape, Frontiers in Immunology, 10.3389/fimmu.2024.1358511, 15, (2024).
- Bijal D. Shah, Nathaniel J. Smith, Chaoling Feng, Sushanth Jeyakumar, Jean-Gabriel Castaigne, Imi Faghmous, Behzad Kharabi Masouleh, Daniel C. Malone, Michael R. Bishop, Cost-Effectiveness of KTE-X19 for Adults with Relapsed/Refractory B-Cell Acute Lymphoblastic Leukemia in the United States, Advances in Therapy, 10.1007/s12325-022-02201-6, 39, 8, (3678-3695), (2022).
- Steven Simoens, Katrien De Groote, Cornelis Boersma, Critical Reflections on Reimbursement and Access of Advanced Therapies, Frontiers in Pharmacology, 10.3389/fphar.2022.771966, 13, (2022).
- Meirav Kedmi, Roni Shouval, Shalev Fried, David Bomze, Joshua Fein, Zachary Cohen, Ivetta Danilesko, Noga Shem-Tov, Ronit Yerushalmi, Elad Jacoby, Michal Besser, Avichai Shimoni, Arnon Nagler, Abraham Avigdor, Point-of-care anti-CD19 CAR T-cells for treatment of relapsed and refractory aggressive B-cell lymphoma, Transplantation and Cellular Therapy, 10.1016/j.jtct.2022.02.017, 28, 5, (251-257), (2022).
- Hinrich Abken, Building on Synthetic Immunology and T Cell Engineering: A Brief Journey Through the History of Chimeric Antigen Receptors, Human Gene Therapy, 10.1089/hum.2021.165, 32, 19-20, (1011-1028), (2021).
- Shiho Wakase, Takanori Teshima, Jie Zhang, Qiufei Ma, Yoko Watanabe, Hongbo Yang, Cynthia Z. Qi, Xinglei Chai, Yanwen Xie, Eric Q. Wu, Ataru Igarashi, Cost-Effectiveness Analysis of Tisagenlecleucel for the Treatment of Pediatric and Young Adult Patients with Relapsed or Refractory B Cell Acute Lymphoblastic Leukemia in Japan, Transplantation and Cellular Therapy, 10.1016/j.jtct.2020.12.023, 27, 3, (241.e1-241.e11), (2021).