An evidence-based model to consolidate medication adherence cost estimation: the medication adherence cost estimation framework
Publication: Journal of Comparative Effectiveness Research
Abstract
Aim: To develop a standardized framework determining the economic impact of medication nonadherence. Materials & methods: Secondary analysis of existing literature reported cost data, aggregating cost outcome indicators. Weighted-average cost analysis performed, determining the proportional contribution to total cost. Results: Direct costs were reported in 92% of studies and indirect costs in 4% of studies. Three most utilized cost categories were hospital (68%), primary care (18%) and pharmacy costs (72%). Average unadjusted direct costs ranged from $625 to $154,203 contributing to 88% of the total cost; adjusted medical costs ranged from $565 to $56,313 representing 96% of the total cost. Conclusion: The medication adherence cost estimation framework enables the comparison of costing studies, facilitating informed health policy decision-making based on consistent evidence and terminology.
Medication nonadherence is a growing epidemic with the literature and policy makers, identifying it as a major clinical and economic concern [1–4], costing governments and healthcare providers $US100–290 billion annually [5]. The major findings from the WHO report ‘Adherence to Long-term Therapies – evidence for action’ indicates that the consequences of medication nonadherence compromise effective treatment, decrease quality of life and increase healthcare costs; increasing the effectiveness of adherence interventions will have a greater impact on patient health than improving medical treatment and health systems need to evolve to meet the changing needs of patients [6]. These findings have set the stage for significant growth in medication adherence research, including economic evaluations.
Economic evaluations are defined as “the comparative analysis of alternative courses of action in terms of both their costs and their consequences” [7], and are conducted to inform healthcare resource allocation [8]. While all economic evaluations assess costs, the combination of cost outcome indicators (i.e., the types of costs that are included) and the methods used to calculate these costs exhibit substantial heterogeneity [9,10]. Evaluation of the costs associated with medication nonadherence within single disease studies (e.g., osteoporosis, HIV) as well as comparisons across diseases and studies highlights the existing heterogeneity in methodological processes, leading to wide spanning results [11]. In osteoporosis, the annual adjusted cost of medication nonadherence across studies ranges from $949 to $44,190 [11] per person while across multiple disease studies the range spanned $949 to $52,341 [11] per person. Additionally, there is no gold-standard in the method used to estimate adherence, with selection of the calculation of adherence usually being based on study attributes, clinical setting or resource availability, ultimately resulting in a range of differing methods, cutoff points and recommendations [12].
Given the cost burden associated with medication nonadherence, it is valuable to develop interventions that aim to reduce costs [13–21]. The global medication adherence technology and intervention market continues to expand, valued at $1.6 billion in 2016 and forecasted to reach $3.6 billion by 2023 [22], with numerous interventions designed to improve medication nonadherence across clinical conditions. Despite such growth inconsistency in the reporting of medication nonadherence has resulted in only some interventions relating to better adherence and health outcomes [23]. A lack of consistency in costing methodological approaches serves as a major limitation moving forward in adherence research [12]. Standard approaches in terminology and reporting guidelines have been established through development of the ABC taxonomy representing the gold standard for defining medication adherence behavior across three stages and the EMERGE guidelines, which outline the minimum reporting criteria that should be considered in every publication about medication adherence [24–29]. However, limited guidelines have been developed to standardize the way medication nonadherence costs are measured and reported in economic evaluations [30]. Often complete adherence is assumed or it is assumed that adherence in clinical trials is the same as real-world adherence when establishing clinical effectiveness [31]. This often leads to overestimation of adherence and cost–effectiveness [32]. Hilligsmann et al. outline this concept in Osteoporosis where poor (real-world) adherence to oral bisphosphonates resulted in a doubling of the incremental cost–effectiveness ratio (ICER) compared with perfect (assumed) adherence levels (€3909 vs €10,279, respectively) [32,33].
A review of the literature carried out by Hughes et al. in 2001 [34] and updated in 2007 [30], exploring the methodologies that may be appropriate for incorporating nonadherence and nonpersistence in economic evaluations demonstrates that substantial inconsistency remains in the definitions adopted, and methods and inputs used in pharmacoeconomic evaluations. Moving forward this paper aims to streamline and provide structure to the types of costs that should be included when determining the economic impact of medication nonadherence. The key cost outcome indicators that contribute the greatest proportion to total costs have been incorporated into the newly proposed medication adherence cost estimation (MACE) framework. This facilitates the inclusion of key cost outcome indicators associated with medication nonadherence into economic evaluations, enabling greater clarity in the economic comparison of adherence intervention studies to allow the establishment of meaningful conclusions across studies.
The aim of the research is twofold: determine what cost outcome indicators are reported in the literature and the weighting they contribute to overall costs, and develop a new framework to rationalize the estimation of the cost of medication nonadherence utilizing the identified cost outcome indicators.
Methods
Secondary analysis of data reported in a recent systematic review ‘Economic impact of medication nonadherence by disease groups – a systematic review’ was undertaken to identify cost outcome indicators utilized to report the economic impact of medication nonadherence. The review quantified the cost of medication nonadherence across different disease groups. Studies reporting the cost of medication nonadherence were included, with costs defined as any cost outcome indicator associated with medication nonadherence that was quantified with a monetary value in the original study. Studies only reporting the measure of effect of healthcare utilization in relation to adherence were excluded, as they provided no cost value. The protocol for the systematic review is available through the PROSPERO international prospective register of systematic reviews database (CRD42015027338) and the full methodology was outlined in Cutler et al. [11].
Phase 1: extraction & classification of costs
Phase 1 consisted of extraction of the classification of cost outcome indicators, demonstrating the economic impact of medication nonadherence [11] through assignment of a monetary value to an input associated with medication nonadherence. A cost outcome indicator was defined as a category of costs that was associated with medication nonadherence, for example, hospital costs encompass all costs associated with a hospital admission attributable to medication nonadherence. Cost outcomes were classified according to the terminology utilized in the reported study. The following data were extracted: cost outcome indicator, monetary value assigned to each indicator, definition of the cost outcome, cost classification (e.g., direct or indirect) and disease state [11]. Three quantifiable stages of medication adherence were assessed utilizing the ABC taxonomy classification system, categorizing study measures in relation to initiation, implementation and discontinuation [24]. Initiation was defined as the first dose of a prescribed medication; participants were required to be medication naive or reinitiating the medication regimen. Implementation describes the extent to which the prescription was taken as prescribed among the initiated cohort, examined through measures such as medication possession ratio and proportion of days covered. Discontinuation signifies the end of therapy, when a dose is omitted and no subsequent doses are taken thereafter, measured through medication gaps and time to discontinuation [24].
Phase 2: comparison & aggregation of cost outcome indicators
Phase 2 consisted of the development of a matrix to facilitate the comparison of cost outcome indicators. The content of each related outcome, as assessed by analysis of original definitions of indicators, was aggregated into subcategories. Cost outcome indicators that were classified differently but had the same definition were grouped. Costs were classified as adjusted or unadjusted based on original study reporting. All costs were converted to $US2018 monetary values and reported per patient per annum.
Phase 3: weighted-average analysis
Phase 3 consisted of the statistical analysis of the cost outcome indicators to determine what core set of costing outcomes contributed the greatest proportion to total healthcare expenditure. Only studies that reported cost outcome indicators in addition to total costs or total healthcare costs were included for weighted-average analysis. Monetary values reported for each cost outcome per study were extracted. The minimum, maximum and average value for each indicator were determined. A weighted average for each cost outcome indicator was calculated by multiplying the percentage of studies that included that cost component by the average cost of each indicator as a proportion of the studies total cost. A ranking of the cost indicators was then created to determine the relative importance of certain cost outcome indicators based on previously conducted studies.
Results
A descriptive synthesis of the extracted data was performed and cost outcome indicators were identified. Given the heterogeneity in approaches used to classify cost outcome indicators of medication nonadherence, a framework outlining the key cost outcome indicators that contribute the greatest proportion to total healthcare expenditure was derived. This highlighted the core set of cost outcome indicators that have contributed substantially to the total cost of medication nonadherence.
Extraction, classification & aggregation of cost outcome indicators
Across 79 studies, 35 different cost outcome indicators were used to report the economic impact of medication nonadherence. Table 1 demonstrates the terminology used to describe the cost outcome indicators and the frequency with which these terms were identified in the literature. It further highlights the classification of cost outcome indicators into broader categories to facilitate comparison. Analysis of original study definitions facilitated the distinction between direct and indirect costs. Direct costs were reported in 92% of studies (n = 73) and refer to transactions and expenditures for medical or nonmedical products and services. The types of costs may include hospitalizations, prescription medications, physician fees, laboratory tests, radiological procedures as well as expenditures such as transportation, lodging, family care and home aides [35]. This core category is further subcategorized into medical costs consisting of hospital costs, primary care costs, medical test costs and pharmacy costs in addition to direct nonmedical costs. The three most utilized cost categories were hospital, primary care and pharmacy costs, 68% of studies reported hospital costs (n = 54), 18% of studies reported primary care costs (n = 15) and 72% of studies reported pharmacy costs (n = 57). 11 studies (13%) reported conjointly hospital, primary care and pharmacy costs, 56% (n = 45) hospital and pharmacy costs, while only one study reported hospital, primary care, medical test and pharmacy costs. Indirect costs were defined as those that occur because of loss of life or livelihood and may result from morbidity or mortality [35]. Indirect morbidity costs may occur because of being absent from work, due to decreased earning ability when working or long-term disability necessitating a change in work type as well as the costs associated with premature death [35]. These costs were reported in 4% of studies (n = 3) and included societal costs (1%; n = 1) and productivity costs (5%; n = 4). 2% of studies (n = 2) examined both direct and indirect costs to evaluate the economic impact of medication nonadherence (see Supplementary Table 1).
| Direct costs | Indirect costs | |||||
|---|---|---|---|---|---|---|
| Percentage of studies (%) | Percentage of studies (%) | |||||
| Medical | Hospital (68%) | Acute care | 1 | Societal (1%) | Arrest | 1 |
| Inpatient | 47 | Incarceration | 1 | |||
| Outpatient | 52 | Productivity (5%) | Short-term disability | 4 | ||
| Behavioral health inpatient | 1 | Workers compensation | 1 | |||
| Emergency department visit | 29 | Paid time off | 1 | |||
| Hospitalization | 19 | Absenteeism | 3 | |||
| Primary care (18%) | Physician office visit | 10 | Presenteeism | 1 | ||
| Ancillary | 4 | |||||
| Services | 1 | |||||
| Medical services | 1 | |||||
| External services | 1 | |||||
| Psychiatric assessment | 1 | |||||
| Institutional | 1 | |||||
| Targeted case management | 1 | |||||
| Interdisciplinary | 1 | |||||
| Medical tests (3%) | Fracture | 1 | ||||
| Laboratory | 1 | |||||
| Radiology | 3 | |||||
| Pharmacy (72%) | Prescription medication | 72 | ||||
| Other pharmacy | 9 | |||||
| Nonmedical | Direct nonmedical (6%) | |||||
†
Data taken from [11].
Percentage composition of cost outcome indicator examples used to quantify ($) medication nonadherence throughout the literature.
Bold text highlights the identified categories and subcategories within direct and indirect costs.
Analysis of cost outcome indicators
Weighted-average analysis of cost outcome indicators highlighted the categories that contributed the greatest proportion to the overall cost of medication nonadherence. Of the 79 included studies, 56 reported cost outcome indicator monetary values in addition to total cost (see Supplementary Table 2). Both unadjusted (86% of total cost) and adjusted (96% of total cost) cost analysis determined that medical costs associated with hospital costs, primary care costs and pharmacy costs contributed the greatest proportion of total cost. Analysis of the unadjusted cost outcome indicator examples determined that over 88% of costs reported in the literature were direct costs associated with medication nonadherence and arised predominately from hospital costs (53%); mainly outpatient and inpatient costs (25 and 23%, respectively), primary care costs (21%) and pharmacy costs (21%; Figure 1). Similarly, for the adjusted cost outcome indicators (Figure 2) over 90% of the reported costs were attributed to direct costs however, primary care costs contributed the greatest proportion 53% followed by hospital costs (30%) and pharmacy costs (17%). Average unadjusted medical costs exhibited the greatest cost range variability ($585–$152,660) and contributed on average 86% of the total costs. Within this core category, the hospital costs subgroup accounted for 53% of total costs and ranged from $457 to $151,118, while pharmacy costs subgroup represented 21% of total cost and ranged from $154 to $30,943 (Figure 3). Average adjusted medical costs ranged from $565 to $56,313 representing 96% of the total cost while hospital costs (30%) and pharmacy costs (17%) ranged from $2044 to $48,180 and $22 to $21,430, respectively (Figure 4). Hospital costs accounted for the greatest proportion of medical costs within the unadjusted cost analysis (53%). In the adjusted cost analysis, primary care costs contributed the greatest proportion to total cost (53%).
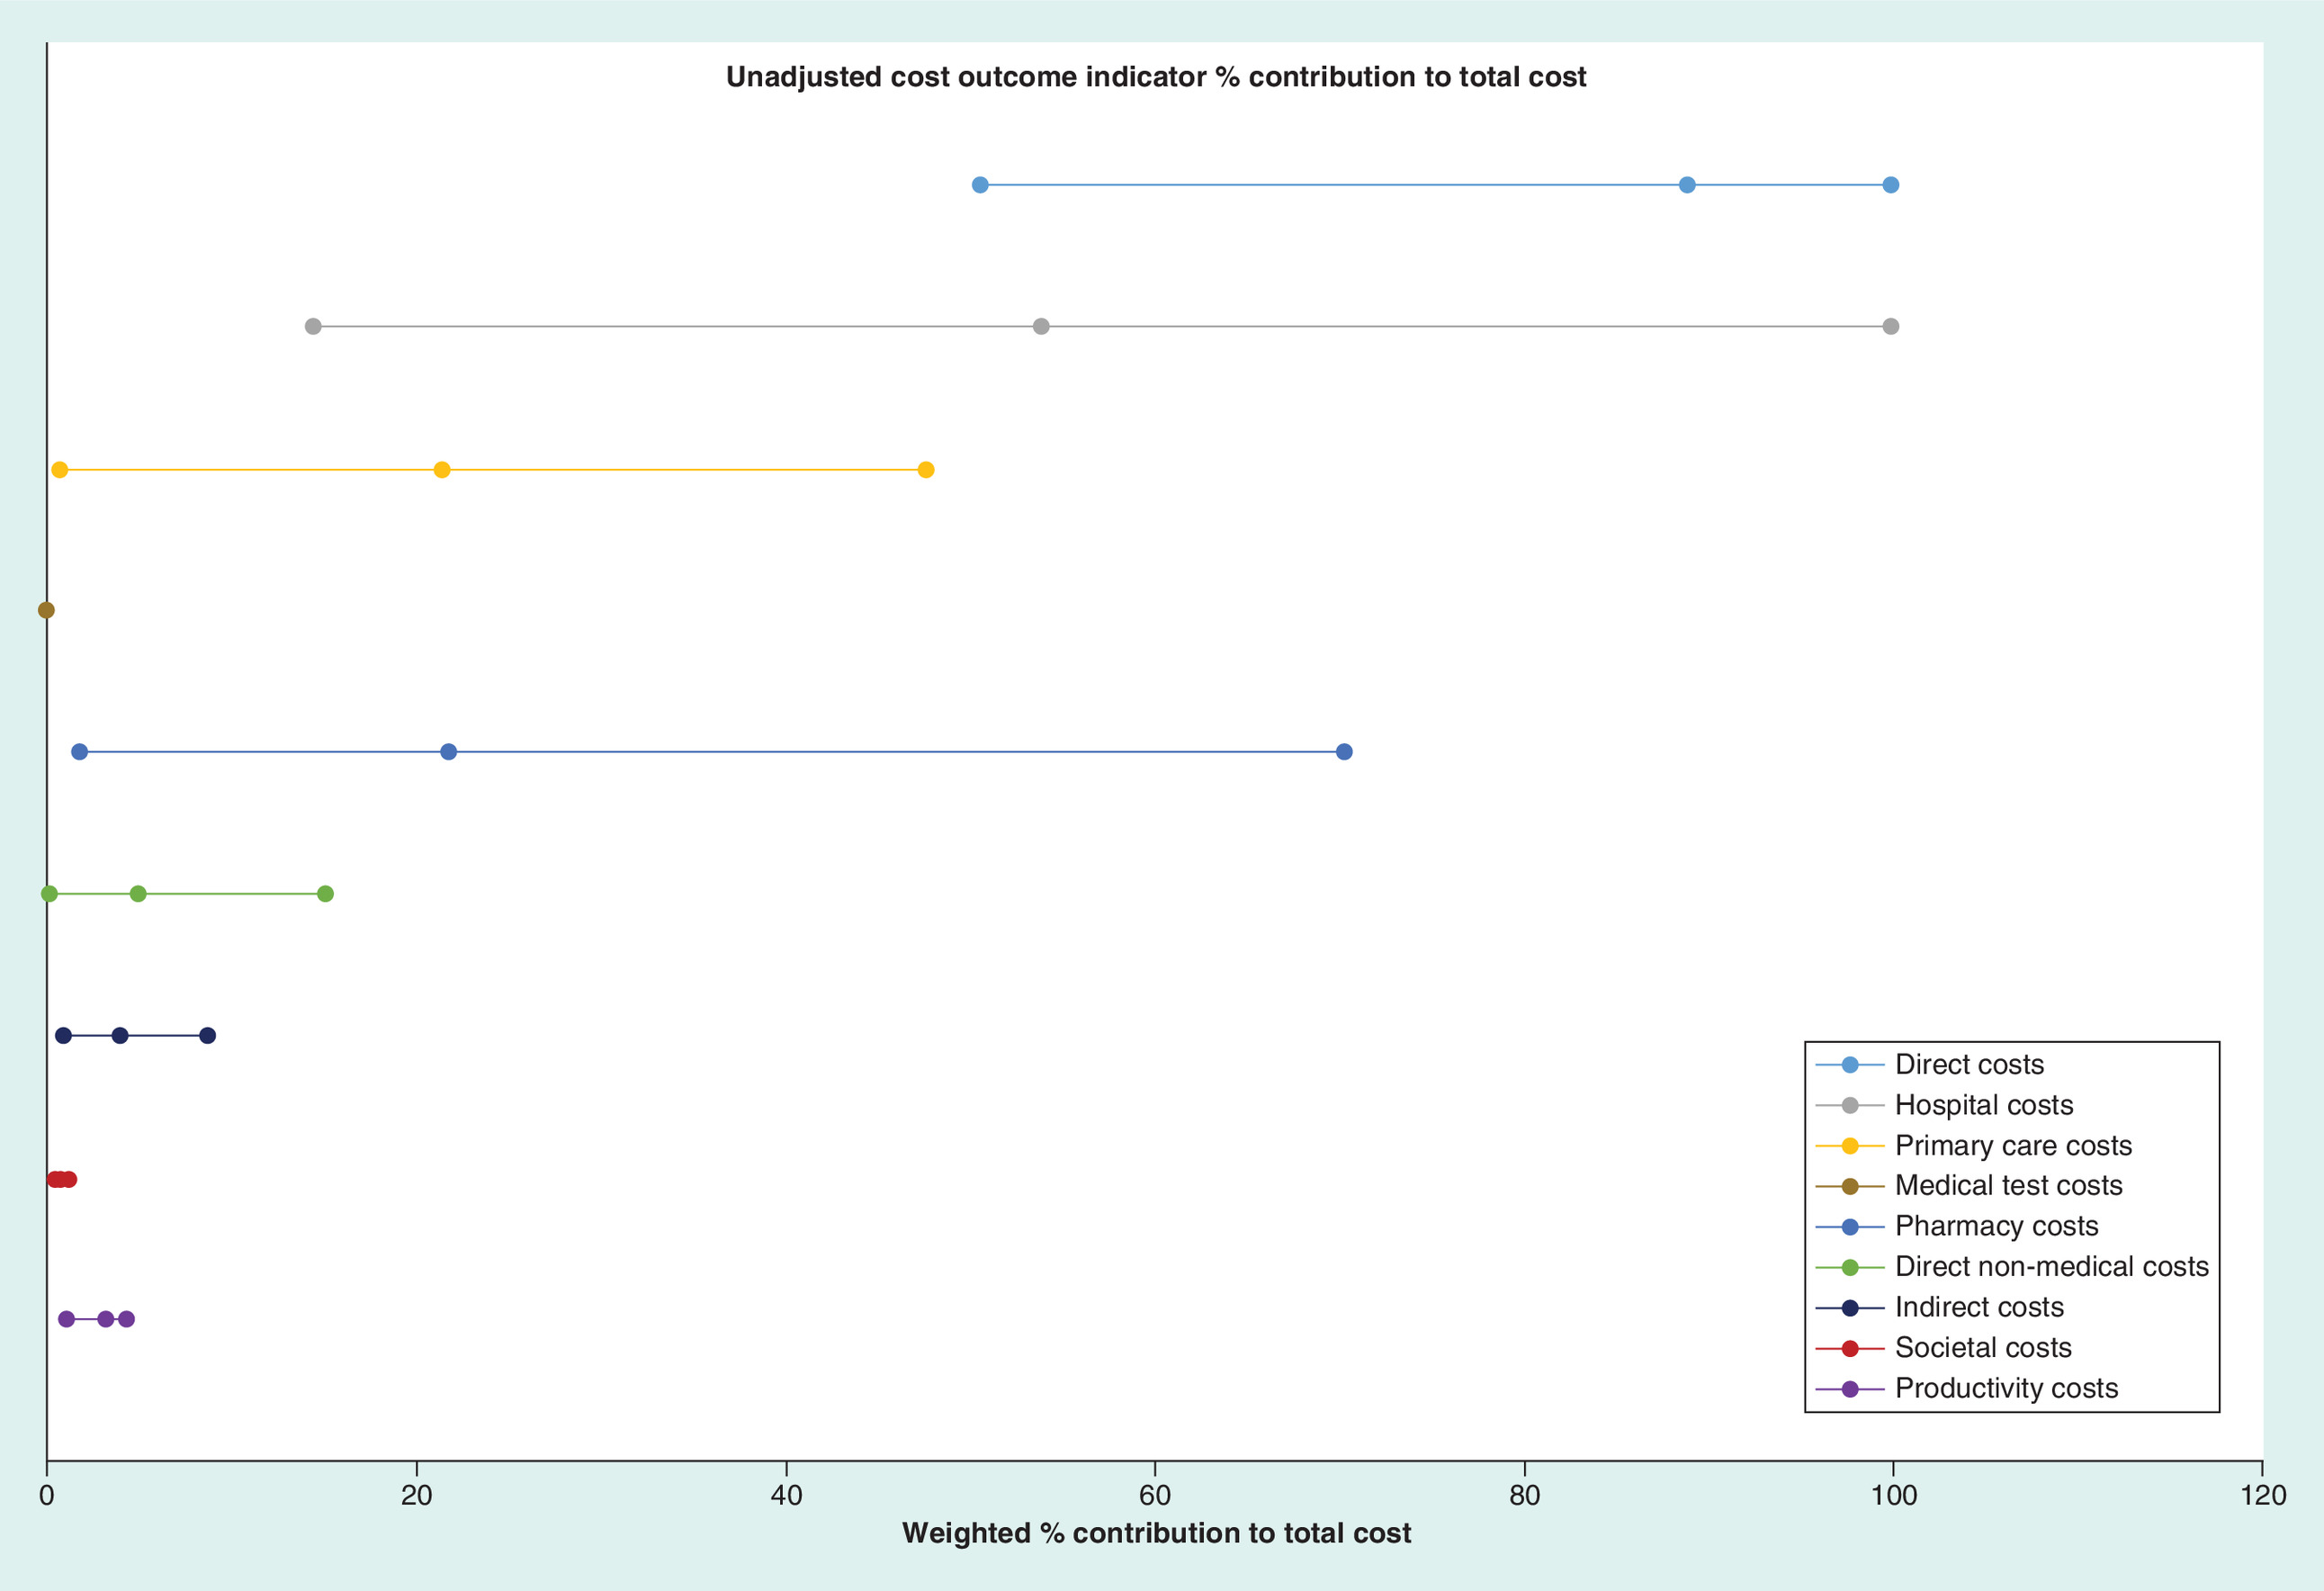
Figure 1. Unadjusted cost outcome indicator contribution to total cost.
Line represents the minimum, maximum and average percentage contribution for each core category and subcategory toward total cost. Single points indicate only one cost value, reported for that category.
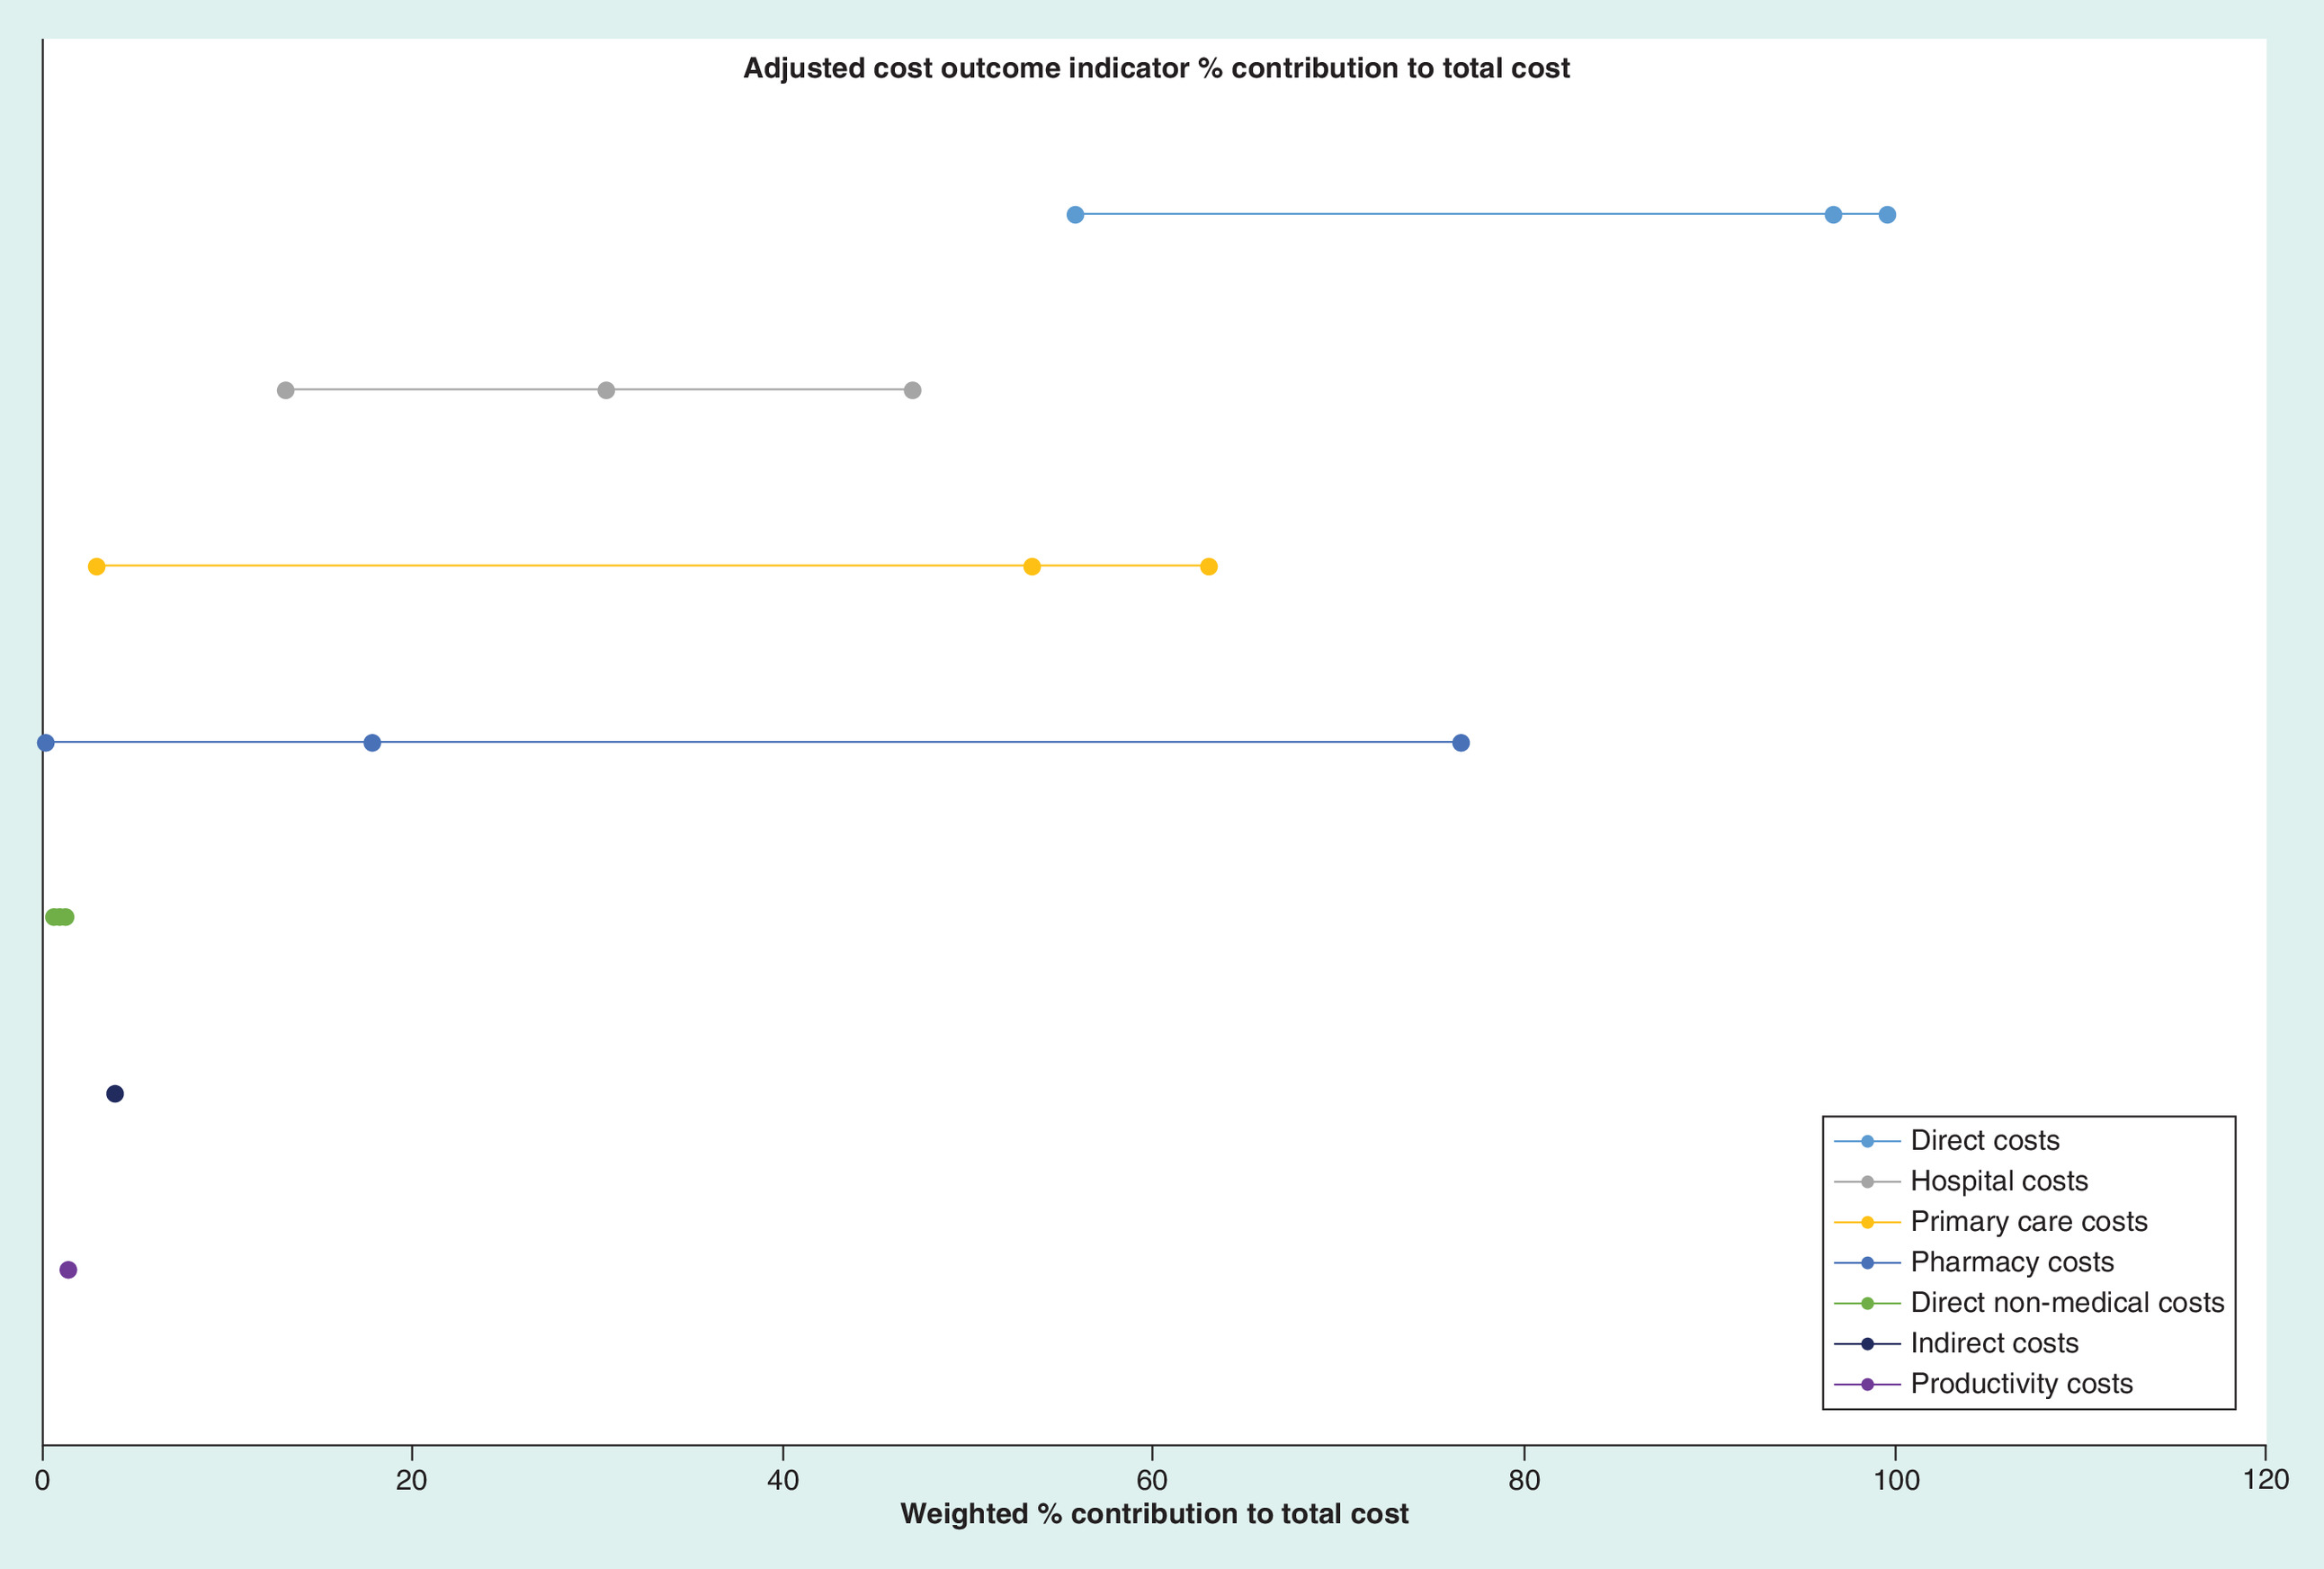
Figure 2. Adjusted cost outcome indicator contribution to total cost.
Line represents the minimum, maximum and average percentage contribution for each core category and subcategory toward total cost. Single points indicate only one cost value, reported for that category.
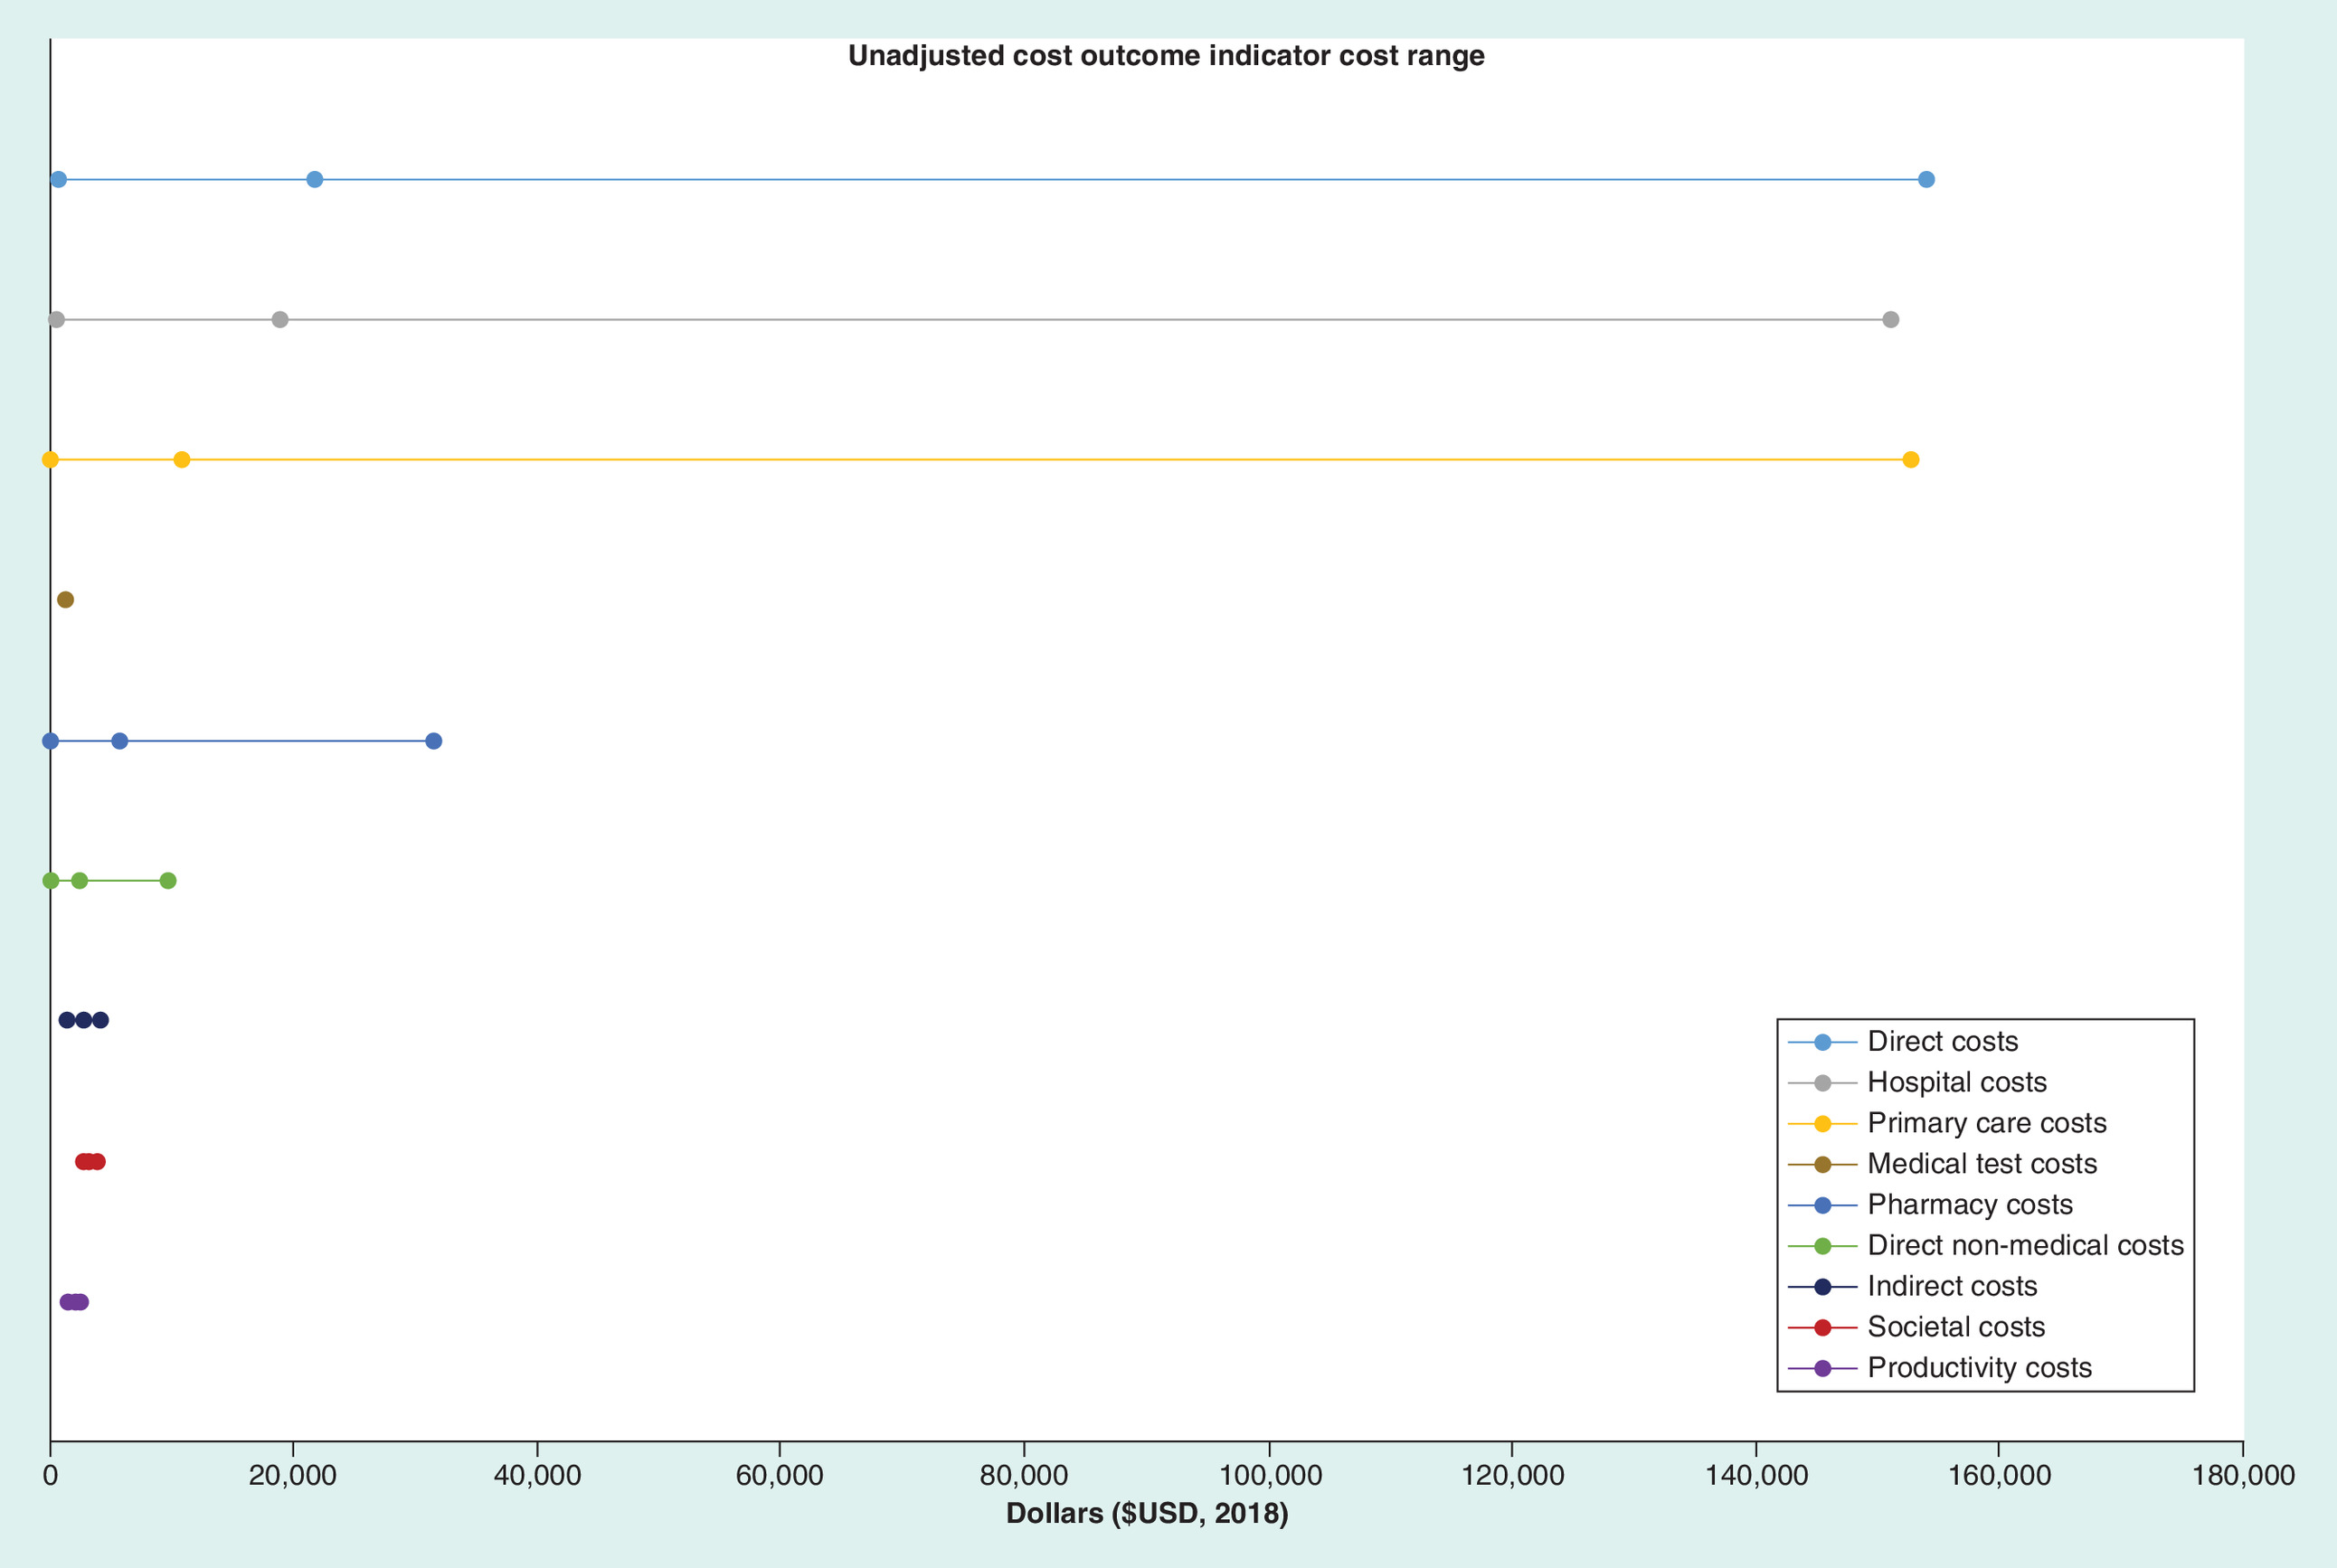
Figure 3. Unadjusted cost range $US2018.
Line represents the minimum, maximum and average cost reported for core categories and subcategories. Single points indicate only one cost value, reported for that category.
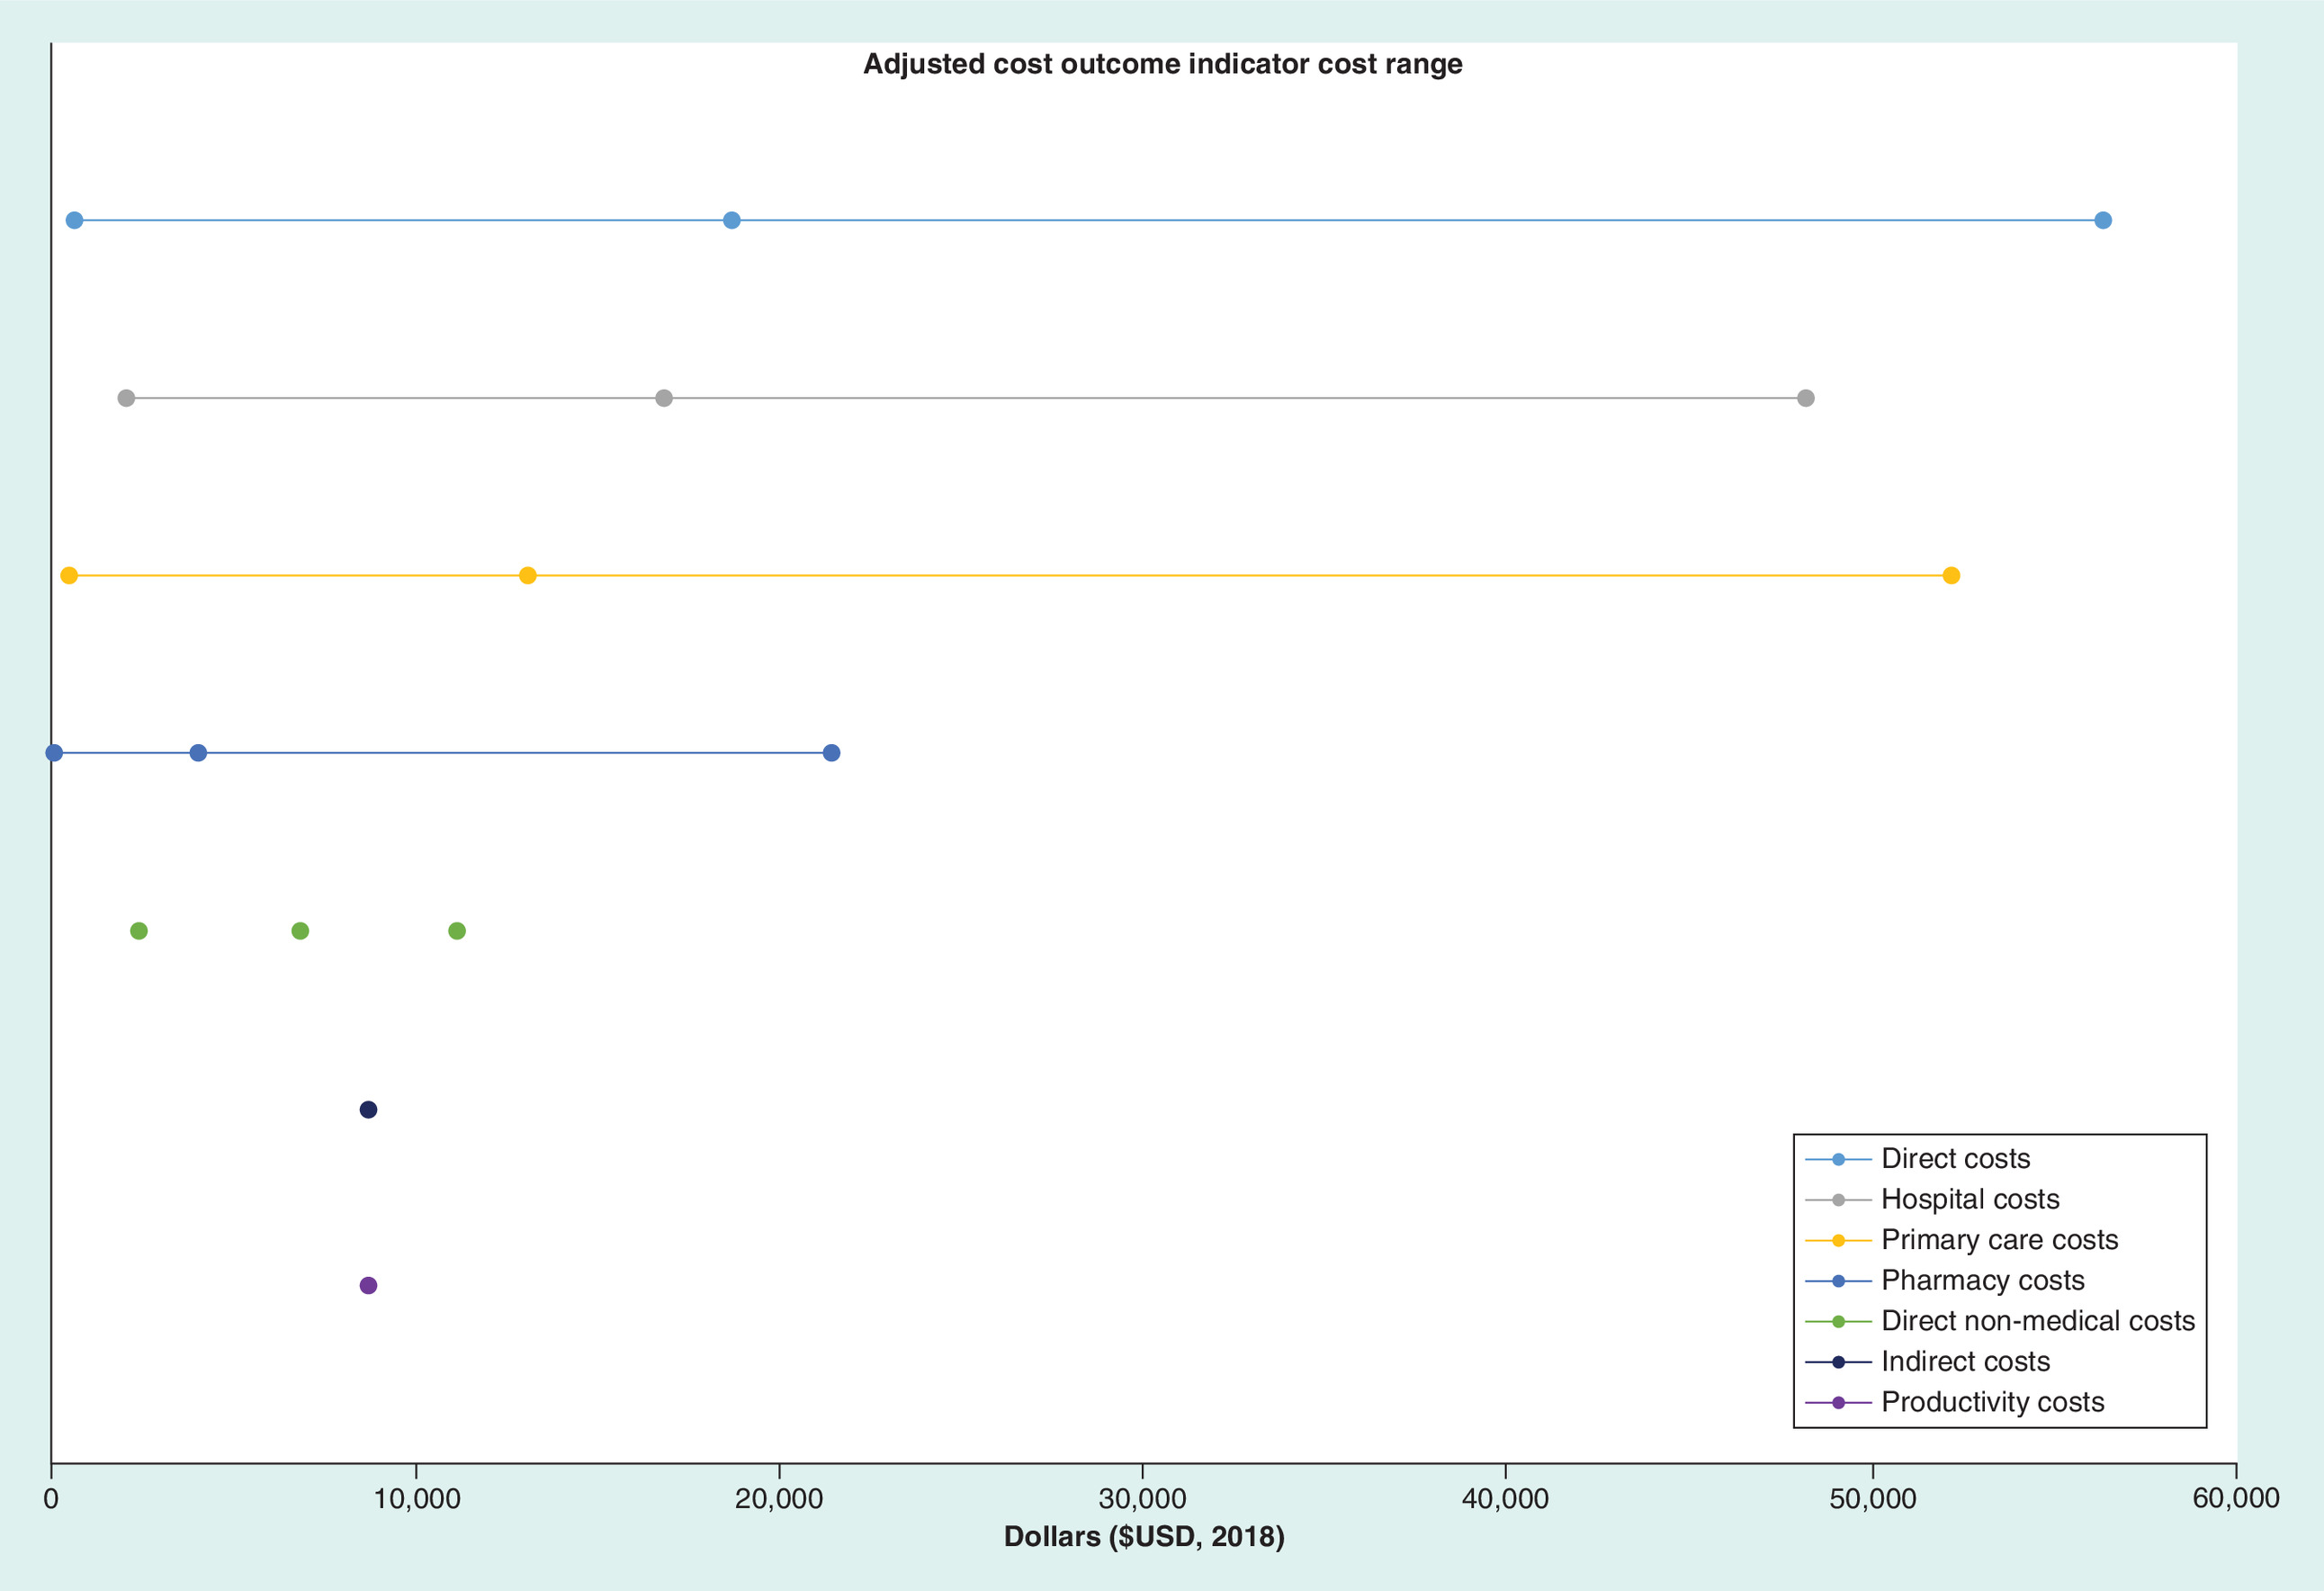
Figure 4. Adjusted cost range $US2018.
Line represents the minimum, maximum and average cost reported for core categories and subcategories. Single points indicate only one cost value, reported for that category.
ABC taxonomy classification
Medication adherence, the process by which patient’s take their medications as prescribed, is classified into three components: initiation, implementation and discontinuation [24] (see Supplementary Table 1). Initiation marks when the patient takes the first dose of a prescribed regimen; 59% of studies reported initiation (n = 47). All 79 studies examined and reported aspects of implementation (correspondence of the patient’s actual dosing regimen to the prescribed regimen), while 33% of studies (n = 26) reported discontinuation. Persistence, a measure of adherence signifying the length of time between initiation and discontinuation was reported in 22 studies.
MACE framework
The MACE framework (Table 2) relies on two core elements, making a clear distinction between direct and indirect costs. Two core cost outcome indicators emerged from the data (direct and indirect costs), with a further seven subcategories (hospital, primary care, medical test, pharmacy, direct nonmedical, societal and productivity costs) and 35 cost outcome indicator examples. The categories were derived from the 35 cost outcome indicators identified across 79 studies, with the indicators not being exhaustive to those outlined in the framework but serving as a guide for potential expenses that fall within each category.
| Core category | Subcategory | Cost examples |
|---|---|---|
| 1. Direct costs | 1.1 Hospital costs 1.2 Primary care costs† 1.3 Medical test costs 1.4 Pharmacy costs‡ 1.5 Nonmedical costs | 1. Acute care costs 2. Inpatient costs 3. Behavioral health inpatient costs 4. Outpatient costs 5. Emergency department costs 1. Physician office visit costs 2. Ancillary costs 3. Services costs 4. Medical services costs 5. External services costs 6. Psychiatric assessment costs 7. Institutional costs 8. Targeted case management costs 9. Interdisciplinary costs 1. Laboratory costs 2. Radiology costs 3. Fracture costs 1. Prescription medication costs 2. Other pharmacy costs 1. Transport |
| 2. Indirect costs | 2.1 Societal costs 2.2 Productivity costs | 1. Arrest costs 2. Incarceration costs 1. Short-term disability costs 2. Workers compensation costs 3. Paid time off costs 4. Absenteeism costs 5. Presenteeism costs |
†
Some costs examples in primary care setting may also occur in hospital costs, however, these cost examples refer to the costs captured in this particular setting/ subcategory independently.
‡
Prescription medication costs may also occur in the hospital setting. When this is the case they are captured in the setting they are dispensed. Pharmacy cost subcategory refers exclusively to costs in the community setting.
Outlines core cost categories, subcategories and cost outcome indicator examples. Cost data adapted from [11].
MACE framework definitions
Direct costs
The first core element is direct costs and refers to any cost incurred due to resource use that are completely attributable to the use of a healthcare intervention of illness. These costs can be split into direct medical costs and direct nonmedical costs. Direct medical costs include the cost of a defined intervention and all follow-up costs for other medication and healthcare interventions in ambulatory, inpatient and nursing care. Additionally, all physician and specialist care, including rehabilitation, emergency care as well as treatment or prevention of an injury, illness or disease, including the costs of testing, procedures, therapies and medications are included in direct costs [35]. It is further categorized into hospital, primary care, medical test and pharmacy costs.
Hospital costs refer to the costs associated with the act or incidence of receiving medical care or aid at a hospital. This includes but is not limited to inpatient admissions, outpatient services, acute care and emergency department visits. Additionally, it incorporates all medical services (e.g., medication, imaging, pathology, specialist care) that are provided within the hospital setting.
Primary care costs refer to healthcare and utilization of healthcare facilities provided in the community, outside the hospital setting for diagnosis, prevention, advice or treatment of an injury, illness or disease. This includes GP visits, ancillary care, psychiatric assessment, interdisciplinary team management, targeted case management, social worker visits, home helps and volunteer workers.
Medical test costs entail the costs of all medical procedures performed to detect, diagnose or monitor diseases, injury, susceptibility and determine a course of treatment, for example, laboratory tests, radiology costs, pathology results.
The pharmacy cost element incorporates utilization rates and corresponding costs associated with obtaining prescription and nonprescription medication in the community setting in addition to the provision of pharmacist services. It takes into account both disease specific and medication costs associated with co-morbidities, where reported. Costs associated with prescribed medications, health aides, nonprescription medication, over the counter medications and any out-of-pocket expenses are measured.
Direct nonmedical costs are expenditures as the result of an illness but are not involved in the direct purchasing of medical services. These include expenditures such as food, transportation, lodging, family care, home aides and clothing as a result of illness.
Indirect costs
Indirect costs are those that occur due to loss of life or livelihood, and may result from morbidity or mortality [36]. Mortality costs are the costs associated with premature death, while morbidity costs are associated with lost earning and productivity by the patient or caregivers [35].
Societal costs refer to the costs other than those associated with direct healthcare. These costs may not have been borne by the payer or provider of the healthcare services and include arrest, incarceration, opportunity costs of resources used and time spent seeking and receiving care [37]. In addition, this subcategory also considers costs incurred by society as a result of the additional use of time and resources. It incorporates the costs imposed on society as a consequence of levies, taxes and charges [38,39].
The second subcategory, productivity costs, represents the additional cost burden placed on workplaces and employers due to a loss of productivity. It considers the impact medication nonadherence has on an individual’s capacity to work; they may work less than they otherwise could, retire early, be absent from work more often, have lower productivity while at work, or die prematurely [40]. Additionally, informal carers may also work less or not work at all in order to care for nonadherent patients. Productivity costs capture the lost earnings and production due to nonadherence in terms of absenteeism (prolonged absence from work), disability pensions (financial help due to medical conditions that prevent one from working), premature death, early retirement, unemployment, reduced working hours and presenteeism (reduced capability in completing tasks in an efficient manner).
Discussion
Increasing scarcity of healthcare resources, diminishing health budgets and increasing healthcare costs are compelling decision-makers to choose between alternative healthcare interventions. Increasingly, the cost–effectiveness of interventions and overall healthcare gain to the population are important to determine the allocation of competing resources [41]. As the main goal of health economic analysis is to aid decisions, it is imperative that these evaluations are comparable in terms of the cost outcome indicators that they include to estimate the cost burden of medication nonadherence. Despite the growing evidence of models and methods examining the integration of medication adherence into pharmacoeconomic evaluations, limited consistency and uniformity exists in the methods and terminology used to estimate the cost outcome indicators. This dissimilarity has resulted in the generation of an array of concepts and terms being utilized in a variety of combinations to determine the economic impact of medication nonadherence. The definitions of the cost outcome indicators used vary and partially overlap, resulting in conceptual confusion, and contributing to methodological weaknesses in the field. Further methodological problems arise from the disparity in identification, measurement and valuation of nonadherence costs [42].
A framework identifying reported cost outcome indicators from 79 reviewed studies was constructed facilitating the analysis of original studies reporting the economic impact of medication nonadherence in addition to total cost [11]. Cost outcome indicators that contributed the greatest proportion to total cost, formed the structure categorization of the framework. The MACE framework was developed to provide a streamlined approach to estimate the cost of medication nonadherence. Lack of such a system has resulted in the heterogeneous reporting of over 35 different cost outcome indicators, making the comparison of studies difficult and deficient. The consolidated framework will allow a more complete evaluation of the economic impact while simultaneously facilitating the comparison across studies and disease states. Use of the MACE framework (Table 2) will enable understanding of terms that appear to be different but incorporate the same cost components. Thus, it aids in the interpretation and comparison of studies that may have used different terminology to classify similar or the same cost outcome indicators. We attempted to minimize complexity by providing clear and concise category descriptions and examples. This resulted in an aggregated system containing two core categories, seven subcategories and an extensive list of examples of cost outcome indicators. The framework provides a guide to cost estimation and can be applied in its entirety or utilizing only those categories that are relevant to the study objectives. Additionally, validation of the framework is required to test and advance its viability. Applying the framework to both retrospective- and intervention-based studies across a range of disease states is required to ratify the proposed framework. Moving forward examining the application of the MACE framework across varying perspectives (e.g., government, healthcare, pharmaceutical industry and patient) may prove valuable in gaining a better understanding of the economic burden of medication nonadherence globally.
Assessment of study methodologies and identification of significant heterogeneity across classification of cost outcome indicators, in addition to a varied mix of reporting styles made the statistical analysis of data challenging [10]. Due to the substantial variation in cost outcome indicators reported, the missing data and lack of reported standard deviations of costs a weighted-average cost analysis was chosen to report the findings. Analysis of cost outcome indicators revealed that three key cost components contributed the greatest percentage to overall total cost. These three cost outcome indicators were grouped into ‘medical costs’ of the proposed framework. While ideally all cost categories should be taken into consideration when determining the cost of medication nonadherence, it stems to reason that the most influential costs that need to be considered are medical costs; particularly inpatient, outpatient, pharmacy costs and medical expenses incurred in the community setting, for example, GP visits. These costs contribute to over 85% of the cost of medication nonadherence. While these costs make up the largest proportion of total cost, further investigation is required to determine the economic impact of indirect costs on medication adherence, as many studies fail to evaluate these costs. However, Drummond et al. stipulate that it is not worth investing time into the evaluation of costs that are so small, as they are unlikely to make a difference in the study results. It may be worthwhile identifying these cost categories, yet the estimation of them need not be pursued [7]. Depending upon the perspective of the economic evaluation, it may be important to measure both direct and indirect costs.
Awareness of the different degrees and types of nonadherence is important when analyzing cost data [43]. The impact of nonadherence on, as well as the relevant levels of nonadherence for healthcare costs can vary across disease states with certain medications exhibiting greater ‘forgiveness’ than others [42,44]. The three dimensions of adherence: initiation, implementation and discontinuation should be taken into consideration when assessing costs associated with medication nonadherence [24]. Additionally, the differences in relevant costs from different perspectives emphasize the importance of specifying the point of view from which the cost calculation is performed [42]. Which costs and consequences count, and how they should be measured and valued, depends on what type of decision-makers in healthcare are intended to be informed by the economic evaluation [7]. The most valid cost data in terms of real resource use are collated via measuring every single-cost item in detail and valuing it according to market price [45]. However, this may not be feasible as many economic evaluations are conducted using summary data, such as costs in the literature from previously conducted studies. In this instance, individual patient data are not available and how the data have been summarized will determine whether resource quantities can be separated from prices to conduct the analyses [7]. The MACE framework facilitates the analysis of both direct and indirect costs, some or all of the categories may be relevant depending on the perspective of the analyses being conducted. Reporting across the two core categories supports transparency in the data, allowing the reader to derive results that are relevant for their own purpose while simultaneously facilitating the establishment of comparisons between studies. Similarly, the condition for which the economic evaluation is being estimated is of significant importance with certain conditions carrying a greater cost burden then others. In cancer, direct costs have been reported to be the smallest portion of total costs per patient [46], while in diabetes one study conservatively estimates direct costs to account for 66% of total costs [47]. Alternatively, in schizophrenia one study estimated nonmedical costs to account for 65% of healthcare expenditure; 15% attributed to direct nonmedical costs and 50% attributed to indirect/productivity costs [48]. These variations need to be taken into consideration when comparing studies, utilizing different cost outcome indicators and when comparing across conditions.
The medication nonadherence cost burden is multidimensional in nature traversing healthcare professional groups, governments and individuals. However, the degree of visibility medication adherence occupies within the health policy context remains less than ideal, often being overshadowed by other health policy issues due to incongruence in demonstrating impact [49]. In order for funding or reimbursement for medication adherence to be introduced, convincing and comparable evidence on the cost and benefits of medication adherence support needs to be stipulated. This framework attempts to homogenize the cost findings, enabling clear communication with policymakers to stimulate concerted action to address the economic impact of medication nonadherence [49]. When used in conjunction with existing validated guidelines and frameworks for health outcomes research (e.g., ABC taxonomy, CHEERS, TIDier, EMERGE), it will provide evidence to evaluate the clinical and cost-effectiveness of interventions to address medication nonadherence, building a strong case for investment [8,24,28,49,50].
Conclusion
Economic evaluation can be used to assess the effectiveness of interventions and inform health policy. In order to guide policy makers on how to best allocate limited healthcare resources in the most efficient and effective manner, it is imperative that a comparable method be developed to accurately estimate the economic impact of medication nonadherence. The MACE framework streamlines the current disarray of cost outcomes that exists in the literature. It provides structure via building on the existing foundations to create a classification system taking into account direct and indirect costs that can be used in its entirety or partially dependent upon the perspective of the intended audience. Moving forward, future research would be recommended to test, validate and advance the MACE framework. The adoption of this framework will help to standardize the cost outcome indicators utilized, hereby facilitating health policy decisions based on consistent evidence, terminology and reporting standards.
Background
•
Medication nonadherence places significant economic and clinical burden on patients, governments and healthcare systems.
•
Heterogeneity exists in the methods and cost outcome indicators used to report and measure the economic impact of medication nonadherence.
•
The medication adherence cost estimation (MACE) framework is a newly proposed model to consolidate the monetary valuation of medication nonadherence through determination of the cost breakdown of related cost outcome indicators described in the literature.
Methods
•
Secondary analysis of existing literature-reported cost data was conducted to aggregate cost outcome indicators and their associated monetary value.
•
A weighted-average cost analysis was performed to determine the proportion each indicator contributed to total cost. Indicators were ranked to determine their relative importance in relation to total cost and the MACE framework was developed through utilization of these rankings.
Results
•
The MACE framework proposes that costs should be classified into two core categories: direct and indirect costs, with further subcategorization into hospital, primary care, medical test, pharmacy, direct nonmedical, societal and productivity costs.
•
The three most utilized categories to report the economic impact of medication nonadherence were hospital costs (68%), primary care costs (18%) and pharmacy costs (72%).
Conclusion
•
The MACE framework streamlines the current disarray of cost outcomes that exists in the literature.
•
The adoption of this framework will help to standardize the cost outcome indicators utilized, hereby facilitating health policy decisions based on consistent evidence, terminology and reporting standards.
Financial & competing interests disclosure
This research received no specific grant from any funding agency in the public, commercial or not-for-profit sectors. RL Cutler’s research is supported by an Australian Government Research Training Program Scholarship. NVD Linden worked at the Centre for Health Economics Research and Evaluation while the work was performed. She currently works at AstraZeneca Netherlands. The authors have no other relevant affiliations or financial involvement with any organization or entity with a financial interest in or financial conflict with the subject matter or materials discussed in the manuscript apart from those disclosed.
No writing assistance was utilized in the production of this manuscript.
Author contributions
RL Cutler drafted the initial form and all revisions of this manuscript. All the other authors (RL Cutler, VG Cardenas, SI Benrimoj, F Fernandez-Llimos, NVD Linden) made significant contributions to the manuscript and read and modified the drafts. All the authors read and approved the final manuscript.
Data sharing statement
All data are available in the paper and supplementary material.
Supplementary data
To view the supplementary data that accompany this paper please visit the journal website at: Supplementary Material
Supplementary Material
References
Papers of special note have been highlighted as: • of interest; •• of considerable interest
1.
van Boven JF, Chavannes NH, van der Molen T, Rutten-van Molken MP, Postma MJ, Vegter S. Clinical and economic impact of non-adherence in COPD: a systematic review. Respir. Med. 108(1), 103–113 (2014).
2.
Ho PM, Rumsfeld JS, Masoudi FA et al. Effect of medication nonadherence on hospitalization and mortality among patients with diabetes mellitus. Arch. Intern. Med. 166(17), 1836–1841 (2006).
3.
Ho PM, Bryson CL, Rumsfeld JS. Medication adherence: its importance in cardiovascular outcomes. Circulation 119(23), 3028–3035 (2009).
4.
Iuga AO, McGuire MJ. Adherence and health care costs. Risk Manag. Healthc. Policy 7, 35–44 (2014).
5.
New England Healthcare Institute. Thinking outside the pillbox: a system-wide approach to improving patient medication adherence for chronic disease. (2009). www.nehi.net/publications/44/thinking_outside_the_pillbox_a_systemwide_approach_to_improving_patient_medication_adherence_for_chronic_disease
6.
World Health Organisation. Adherence to long term therapies; evidence for action. (2003). www.who.int/chp/knowledge/publications/adherence_full_report.pdf?ua=1
• Provides a review on adherence to long-term therapies beyond individual diseases, through examination of the way health systems are structured, financed and operated. Provides analysis, solutions and recommendations on further research requirements in addition to acknowledging current literature developments.
7.
Drummond MF, Sculpher MJ, Claxton K, Stoddart GL, Torrance GW. Methods for the Economic Evaluation of Health Care Programmes. Oxford University Press, NY, USA (2015).
•• Outlines key methodological principles relating to the economic evaluation of healthcare programs.
8.
Husereau D, Drummond M, Petrou S et al. Consolidated Health Economic Evaluation Reporting Standards (CHEERS) – explanation and elaboration: a report of the ISPOR Health Economic Evaluation Publication Guidelines Good Reporting Practices Task Force. Value Health 16(2), 231–250 (2013).
9.
Wang L, Si L, Cocker F, Palmer AJ, Sanderson K. A systematic review of cost-of-illness studies of multimorbidity. App. Health Econ. Health Pol. 16(1), 15–29 (2018).
10.
AJ OC, Hanly P, Skally M et al. Cost comparisons and methodological heterogeneity in cost-of-illness studies: the example of colorectal cancer. Med. Care 51(4), 339–350 (2013).
11.
Cutler RL, Fernandez-Llimos F, Frommer M, Benrimoj C, Garcia-Cardenas V. Economic impact of medication non-adherence by disease groups: a systematic review. BMJ Open 8(1), e016982 (2018).
•• Systematic review, analyzing and reporting the economic impact of medication nonadherence.
12.
Lam WY, Fresco P. Medication adherence measures: an overview. BioMed. Res. Int. 2015, 1–12 (2015).
13.
Sokol MC, McGuigan KA, Verbrugge RR, Epstein RS. Impact of medication adherence on hospitalization risk and healthcare cost. Med. Care 43, 521–530 (2005).
14.
Siris ES, Harris ST, Rosen CJ et al. Adherence to bisphosphonate therapy and fracture rates in osteoporotic women: relationship to vertebral and nonvertebral fractures from 2 US claims databases. Mayo Clin. Proc. 81(8), 1013–1022 (2006).
15.
Roebuck MC, Liberman JN, Gemmill-Toyama M, Brennan TA. Medication adherence leads to lower health care use and costs despite increased drug spending. Health Affairs 30(1), 91–99 (2011).
16.
Jha AK, Aubert RE, Yao J, Teagarden JR, Epstein RS. Greater adherence to diabetes drugs is linked to less hospital use and could save nearly $5 billion annually. Health Affairs (Project Hope) 31, 1836–1846 (2012).
17.
Grabowski DC, Lakdawalla DN, Goldman DP et al. The large social value resulting from use of statins warrants steps to improve adherence and broaden treatment. Health Affairs 31(10), 2276–2285 (2012).
18.
Dall TM, Blanchard TD, Gallo PD, Semilla AP. The economic impact of Medicare Part D on congestive heart failure. Am. J. Manag. Care 19(6 Suppl.), s97–s100 (2013).
19.
Cutler DM, Long G, Berndt ER et al. The value of antihypertensive drugs: a perspective on medical innovation. Health Affairs 26(1), 97–110 (2007).
20.
Burge R, Dawson-Hughes B, Solomon DH, Wong JB, King A, Tosteson A. Incidence and economic burden of osteoporosis-related fractures in the United States, 2005-2025. J. Bone Miner. Res. 22(3), 465–475 (2007).
21.
Behner P, Klink A, Visser S, Bocken J, Etgeton S. Unleashing the Potential of Therapy Adherence. High-Leverage Changes in Patient Behavior for Improved Health and Productivity. Bertelsmann Stiftung, Booz & Company, Germany (2012).
22.
P&S Market Research. Medication Adherence Market by Product (Software Centric, Hardware Centric), by Medication (Cardiovascular, CNS, Diabetes, Oncology, Respiratory, Gastrointestinal, Rheumatology), by Geography (U.S., Canada, Germany, France, U.K., Japan, China) – Global Market Size, Share, Development, Growth and Demand Forecast, 2013–2023. (2017). www.psmarketresearch.com/market-analysis/medical-adherence
23.
Agency for Healthcare Research and Quality. Medication adherence interventions: comparative effectiveness (evidence report). (2014). www.ahrq.gov/redirects/gapmedadtp.html
24.
Vrijens B, De Geest S, Hughes DA et al. A new taxonomy for describing and defining adherence to medications. Brit. J. Clin. Pharmacol. 73(5), 691–705 (2012).
• Outlines and defines a standardized taxonomy to define medication adherence.
25.
Fraser S. Concordance, compliance, preference or adherence. Patient Prefer. Adherence 4, 95–96 (2010).
26.
Haynes RB, Ackloo E, Sahota N, McDonald HP, Yao X. Interventions for enhancing medication adherence. Cochrane Database Syst. Rev. (2), CD000011 (2008).
27.
Centre for NHS Service Delivery and Organisation R & D (NCCSDO). Concordance, adherence and compliance in medicine taking. Report for the National Co-ordinating (2005). www.netscc.ac.uk/hsdr/files/project/SDO_FR_08-1412-076_V01.pdf
28.
Helmy R, Zullig LL, Dunbar-Jacob J et al. ESPACOMP Medication Adherence Reporting Guidelines (EMERGE): a reactive-Delphi study protocol. BMJ Open 7(2), e013496 (2017).
29.
De Geest S, Zullig LL, Dunbar-Jacob J et al. ESPACOMP Medication Adherence Reporting Guideline (EMERGE). Ann. Intern. Med. 169(1), 30–35 (2018).
30.
Hughes D, Cowell W, Koncz T, Cramer J. Methods for integrating medication compliance and persistence in pharmacoeconomic evaluations. Value Health 10(6), 498–509 (2007).
31.
Lakdawalla DN, Doshi JA, Garrison LP Jr, Phelps CE, Basu A, Danzon PM. Defining elements of value in health care – a health economics approach: an ISPOR Special Task Force Report [3]. Value Health 21(2), 131–139 (2018).
32.
Hiligsmann M, Boonen A, Rabenda V, Reginster JY. The importance of integrating medication adherence into pharmacoeconomic analyses: the example of osteoporosis. Expert Rev. Pharmacoecon. Outcomes Res. 12(2), 159–166 (2012).
33.
Hiligsmann M, Rabenda V, Bruyère O, Reginster J-Y. The clinical and economic burden of non-adherence with oral bisphosphonates in osteoporotic patients. Health Policy 96(2), 170–177 (2010).
34.
Hughes DA, Bagust A, Haycox A, Walley T. The impact of non-compliance on the cost-effectiveness of pharmaceuticals: a review of the literature. Health Econ. 10, 601–615 (2001).
35.
Eisenberg JM. Clinical economics. A guide to the economic analysis of clinical practices. JAMA 262(20), 2879–2886 (1989).
36.
Sherman EJ, Pfister DG, Ruchlin HS et al. The Collection of Indirect and Nonmedical Direct Costs (COIN) form: a new tool for collecting the invisible costs of androgen independent prostate carcinoma. Cancer 91(4), 841–853 (2001).
37.
Cantor SB, Levy LB, Cardenas-Turanzas M et al. Collecting direct non-health care and time cost data: application to screening and diagnosis of cervical cancer. Med. Decis. Making 26(3), 265–272 (2006).
38.
King D, Knapp M, Patel A et al. The impact of non-adherence to medication in patients with schizophrenia on health, social care and societal costs. Analysis of the QUATRO study. Epidemiol. Psychiatr. Sci. 23(1), 61–70 (2014).
39.
National Information Center on Health services Research and Health Care Technology (NICHSR). Health Economic Resources: a self-study course. (2018). www.nlm.nih.gov/nichsr/edu/healthecon/glossary.html
40.
Deloitte Access Economics. Asthma Australia and National Asthma Council Australia. The Hidden Cost of Asthma. (2015). www2.deloitte.com/content/dam/Deloitte/au/Documents/Economics/deloitte-au-economics-hidden-cost-asthma-241115.pdf
41.
Tamás K. Clinical and pharmacoeconomic impact of patient medication adherence [Dissertation]. Semmelweis University, Hungary (2010).
42.
Cleemput I, Kesteloot K, DeGeest S. A review of the literature on the economics of noncompliance. Room for methodological improvement. Health Policy 59(1), 65–94 (2002).
43.
Geest SD, Abraham I, Dunbar-Jacob J, Vanhaecke J. Behavioral strategies for long-term survival of transplant recipients. In: Drug Regimen Compliance. John Wiley & Sons Ltd, England, UK, 163–179 (2002).
44.
Urquhart J. Patient non-compliance with drug regimens: measurement, clinical correlates, economic impact. Eur. Heart J. 17(Suppl. A), 8–15 (1996).
45.
Gold MR. Cost-effectiveness in Health and Medicine. Oxford University Press, USA (1996).
46.
Pallis A, Tsiantou V, Simou E, Maniadakis N. Pharmacoeconomic considerations in the treatment of breast cancer. Clinicoecon. Outcomes Res. 2, 47–61 (2010).
47.
Centers for Disease Control and Prevention. National Diabetes Fact Sheet. (2007). www.cdc.gov/diabetes/pubs/pdf/ndfs_2007.pdf
48.
Wu EQ, Birnbaum HG, Shi L et al. The economic burden of schizophrenia in the United States in 2002. J. Clin. Psych. 66(9), 1122–1129 (2005).
49.
Clyne W, McLachlan S. A mixed-methods study of the implementation of medication adherence policy solutions: how do European countries compare? Patient Prefer. Adherence 9, 1505–1515 (2015).
50.
Hoffmann TC, Glasziou PP, Boutron I et al. Better reporting of interventions: template for intervention description and replication (TIDieR) checklist and guide. BMJ 348, g1687 (2014).
Information & Authors
Information
Published In
Pages: 555 - 567
PubMed: 31116029
Copyright
© 2019 Future Medicine Ltd.
History
Received: 28 September 2018
Accepted: 25 February 2019
Published online: 22 May 2019
Keywords:
Topics
Authors
Metrics & Citations
Metrics
Article Usage
Article usage data only available from February 2023. Historical article usage data, showing the number of article downloads, is available upon request.
Citations
How to Cite
An evidence-based model to consolidate medication adherence cost estimation: the medication adherence cost estimation framework. (2019) Journal of Comparative Effectiveness Research. DOI: 10.2217/cer-2018-0099
Export citation
Select the citation format you wish to export for this article or chapter.
Citing Literature
- Henrik Holmberg, Eva-Lotta Glader, Ulf Näslund, Bo Carlberg, Eva Sönnerstam, Margareta Norberg, Anders Själander, Improved adherence to statin treatment and differences in results between men and women after pictorial risk communication—a sub-study of the VIPVIZA RCT, European Journal of Clinical Pharmacology, 10.1007/s00228-024-03694-6, 80, 8, (1209-1218), (2024).
- Johannes Wendl, Andreas Simon, Martin Kistler, Jana Hapfelmeier, Antonius Schneider, Alexander Hapfelmeier, Medication Adherence and Healthcare Costs in Chronically Ill Patients Using German Claims Data, Applied Health Economics and Health Policy, 10.1007/s40258-023-00797-6, 21, 3, (477-487), (2023).