Budget impact of niraparib as maintenance treatment in recurrent ovarian cancer following platinum-based chemotherapy
Abstract
Aim: To estimate financial implications of adopting niraparib as maintenance treatment in recurrent ovarian cancer. Materials & methods: A model was developed to estimate the budget impact of treating patients with niraparib compared with alternative maintenance treatment options (olaparib, rucaparib, bevacizumab or ‘watch and wait’) over 3 years. Results: For a hypothetical plan with 1 million lives representative of US/Medicare-only populations, projected cost savings with niraparib were US$78,721/$293,723, $276,671/$1,009,729 and $353,585/$1,289,712 at years 1, 2 and 3, respectively. Sensitivity analyses showed prices of niraparib, rucaparib and olaparib to have the most significant impact on the budget. Conclusion: Factoring in all treatment-related costs, the use of niraparib could result in significant cost savings compared with other maintenance treatment options.
Ovarian cancer (OC), while rare, is the fifth most common cause of cancer death among women in the USA, resulting in over 14,000 deaths annually [1]. Although the incidence of OC is only a tenth that of breast cancer, the 5-year mortality is twice as high [2,3]. Most cases (79%) are diagnosed at an advanced stage, and almost three-quarters of patients (72%) diagnosed with advanced disease will die within 5 years of diagnosis [1]. The cornerstone of drug treatment in the first-line advanced disease setting is platinum-based chemotherapy plus a taxane; however, 85% of patients will experience disease recurrence after first-line treatment [4,5]. Recurrent OC is considered incurable.
Most patients with treatment recurrence are treated with repeated rounds of platinum-based chemotherapy. However, the effectiveness of this treatment diminishes over time, and the disease tends to recur more and more rapidly after completion of treatment, requiring further chemotherapy [4]. The duration of progression-free survival (PFS) decreases with each subsequent line of chemotherapy, while risk for cumulative toxicities increases [6,7]. Until recently, the standard of care for women who have responded to platinum-based chemotherapy in the USA was ‘watchful waiting’, which is generally associated with high levels of anxiety due to fear of recurrence [8].
Niraparib is an inhibitor of PARP 1 and 2, which aids in the repair of single-strand DNA breaks. PARP inhibition interferes with DNA repair, leading to the accumulation of single-strand breaks. Such single-strand breaks become double-strand breaks, the repair of which requires DNA reparation pathways that are often deficient in ovarian tumors. In these tumor cells, the inhibition of PARP leads to the persistence of double-strand breaks and subsequent programmed cell death [9]. Niraparib is indicated for the maintenance treatment of adult patients with recurrent epithelial ovarian, fallopian tube or primary peritoneal cancer, who are in complete or partial response to platinum-based chemotherapy, regardless of BRCA mutation status.
The ENGOT-OV16/NOVA trial evaluated the efficacy of niraparib versus placebo among patients with recurrent OC following complete or partial response to their most recent platinum-based regimen, including those with and without a germline BRCA mutation (gBRCA cohort and non-gBRCA cohort), as reported previously [10]. Among patients in the gBRCA cohort, median PFS was 21.0 months with niraparib and 5.5 months with placebo (hazard ratio: 0.27; 95% CI: 0.17–0.41) [10]. Among patients in the non-gBRCA cohort, median PFS was 9.3 months with niraparib and 3.9 months with placebo (hazard ratio: 0.45; 95% CI: 0.34–0.61) [10]. Treatment-emergent adverse events (TEAEs) were manageable with dose modifications, and patients who required a dose reduction had similar efficacy to patients who continued treatment at the starting dose [11].
In the USA, the annual expenditure for the treatment of OC was estimated at US$5.1 billion in 2010 [12]. To assist in estimating the financial implications of adoption and diffusion of niraparib in the USA, a budget impact analysis was performed that compared the three currently approved PARP inhibitors – niraparib, olaparib and rucaparib – for the maintenance treatment of adult patients with recurrent OC.
Materials & methods
Overview
A budget impact model (BIM) was developed in Microsoft Excel to estimate the financial consequences of the introduction of niraparib for patients with recurrent OC who are in complete or partial response to platinum-based chemotherapy. The outcomes of these analyses are presented as an incremental budget impact to US payers over 3 years.
The modeling approach and analytic framework of the BIM followed the guidance provided by the International Society for Pharmacoeconomics and Outcomes Research (ISPOR) [13,14].
The model adopted the payer perspective and considered the following:
Prevalence of the disease within the population;
The dose and price of niraparib and alternative treatment options; and
Costs and cost offsets associated with medical services.
Model structure
The BIM was constructed as a cost calculator in which drug costs per quarter were estimated as follows:
The calculation began with estimating the number of patients eligible for treatment with a PARP inhibitor: adult patients with recurrent epithelial ovarian, fallopian tube or primary peritoneal cancer who are in complete or partial response to platinum-based chemotherapy. We estimated the number of patients on treatment in any given quarter as a function of the number of eligible patients, rate of uptake and rate of discontinuation.
To estimate the budget impact of the introduction of niraparib, the model compared two scenarios: scenario 1 corresponded to a situation where all PARP-treated patients receive niraparib, and scenario 2 corresponded to a situation where the PARP inhibitor share is evenly split between the other two approved PARP inhibitors. Market shares for bevacizumab and watch and wait remained the same in both scenarios. The financial consequence for payers was estimated by comparing the two scenarios for total costs, including the costs of drugs, monitoring, TEAEs and subsequent treatment. Incremental spending/saving was projected over 3 years.
Model inputs
Number of eligible patients
We used overall OC (epithelial and nonepithelial) epidemiology estimates as an approximation for the incidence/prevalence of epithelial ovarian, primary peritoneal and fallopian tube cancer, because the number of primary peritoneal and fallopian tube cancers [15,16] (incidence of 2000–4000) is approximately the same as that of nonepithelial OC (≈10% of all OC) [17].
The patient population eligible for niraparib consists of patients with recurrent OC who are in complete or partial response to platinum-based chemotherapy. The budget impact analysis was conducted for both a plan with the age distribution reflecting the overall US population and a plan with a Medicare-only population. The model assumed constant prevalence rates over the modeling period; results are presented per million lives covered.
To estimate the number of eligible patients in a hypothetical plan with 1 million members, we sourced estimates of the number of women with recurrent OC responsive to platinum therapy in the USA and therefore eligible for PARP inhibitor treatment. We used this estimate to calculate the proportion of such women in a population of 1 million covered members, either in the general US population or those over 65 years of age.
Approximately 14,000 patients with recurrent OC are treated with platinum therapy every year in the USA [18]. Of these patients, 50% are estimated to be responsive [17,19–27], yielding an estimated 7000 patients eligible for treatment. Using this to define a proportion of eligible patients in the US population (n = 326 million [28]) yielded an estimate of 21 patients eligible for a PARP inhibitor in a population of 1 million US patients (Figure 1A).
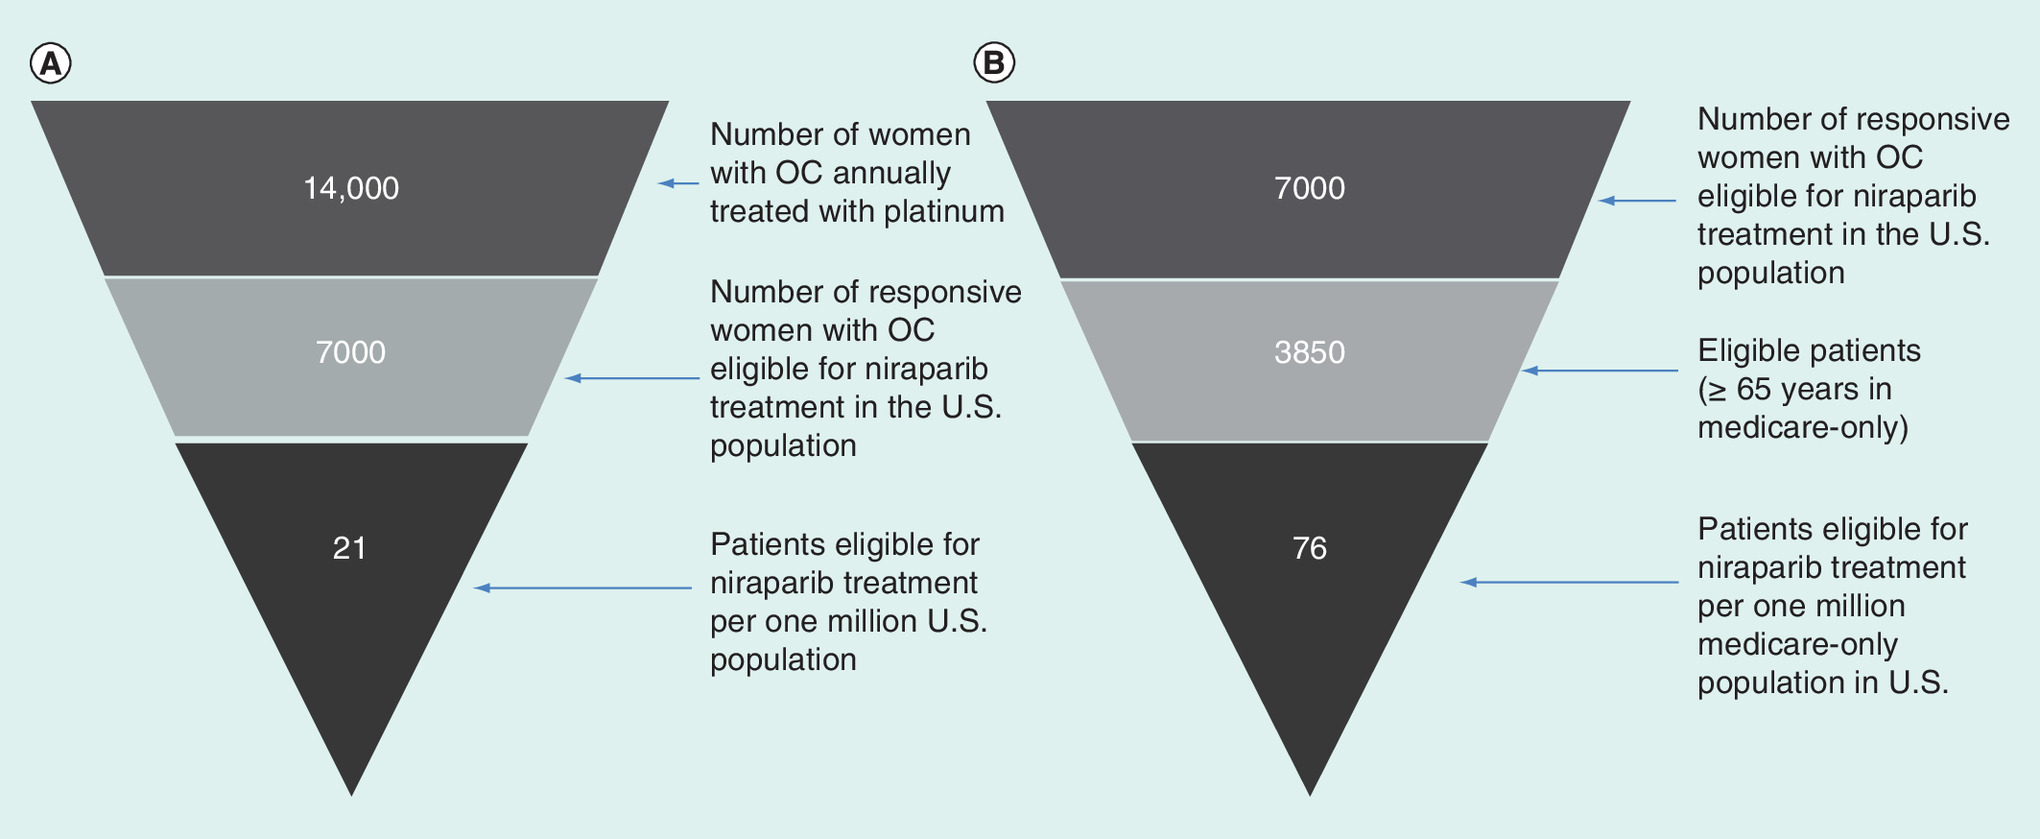
Figure 1. Number of patients eligible for niraparib.
(A) Population representative of the USA; (B) Medicare-only patients.
OC: Ovarian cancer.
Among the 7000 patients with recurrent OC eligible for treatment, an estimated 45% [1] to 59% [29] are over 65 years of age. Using a conservative estimate beyond the midpoint of this range (55%) yielded 3850 eligible cases among the Medicare population. Given the estimated 51 million persons over 65 years of age in the USA [28], and therefore eligible for Medicare, an estimated 76 patients are eligible for PARP inhibitor treatment among every 1 million Medicare members (Figure 1B).
Uptake assumptions
Niraparib, olaparib and rucaparib are approved for all patients regardless of BRCA mutation status and were included in the model along with bevacizumab and watch and wait. In this model, we estimated the cost to payers for treating all patients receiving PARP inhibitors with niraparib versus splitting PARP inhibitor use evenly between olaparib and rucaparib.
The number of patients on each treatment regimen was derived by multiplying the number of eligible patients by the expected market shares for each treatment. Table 1A provides the proportion of patients receiving alternate therapies for the two scenarios (with and without niraparib).
| (A) Market shares of investigated interventions | ||||||
|---|---|---|---|---|---|---|
| Scenario for gBRCAmut | ||||||
| With niraparib on the market | Without niraparib on the market | |||||
| Year 1 | Year 2 | Year 3 | Year 1 | Year 2 | Year 3 | |
| Niraparib | 48% | 74% | 75% | – | – | – |
| Olaparib | 0% | 0% | 0% | 24% | 37% | 37.5% |
| Rucaparib | 0% | 0% | 0% | 24% | 37% | 37.5% |
| Bevacizumab† | 20% | 19% | 18% | 20% | 19% | 18% |
| Watch and wait† | 32% | 7% | 7% | 32% | 7% | 7% |
| Sum | 100% | 100% | 100% | 100% | 100% | 100% |
| Scenario for non-gBRCAmut | ||||||
| With niraparib on the market | Without niraparib on the market | |||||
| Year 1 | Year 2 | Year 3 | Year 1 | Year 2 | Year 3 | |
| Niraparib | 37% | 68% | 72% | – | – | – |
| Olaparib | 0% | 0% | 0% | 18.5% | 34% | 36% |
| Rucaparib | 0% | 0% | 0% | 18.5% | 34% | 36% |
| Bevacizumab† | 23% | 14% | 2% | 23% | 14% | 12% |
| Watch and wait† | 40% | 18% | 16% | 40% | 18% | 16% |
| Sum | 100% | 100% | 100% | 100% | 100% | 100% |
| (B) Frequency of TEAEs (grade ≥3 with >10% frequency) | ||||||
| gBRCAmut subpopulation | ||||||
| Niraparib‡ [10,30] | Olaparib [31,32] | Rucaparib [33] | Bevacizumab [34] | Watch and wait | ||
| Grade 3–4 | Grade 3–4 | Grade 3 | Grade 4 | Grade 3–5 | Grade 3–4 | |
| Anemia | 25.3% | 5.4% | 18% | 1% | 0% | 0% |
| Neutropenia | 19.6% | 4.1% | 5% | 2% | 0% | 1.5% |
| Thrombo-cytopenia | 33.8% | 0% | 3% | 2% | 0% | 1.5% |
| Hypertension | 8.2% | NR | 0% | 0% | 11.3% | 1.5% |
| Non-gBRCAmut subpopulation | ||||||
| Niraparib‡ | Olaparib | Rucaparib | Bevacizumab | Watch and wait | ||
| Grade 3–4 | Grade 3–4 | Grade 3 | Grade 4 | Grade 3–5 | Grade 3–4 | |
| Anemia | 25.3% | 4.8% | 18% | 1% | 0% | 0% |
| Neutropenia | 19.6% | 3.2% | 5% | 2% | 0% | 0% |
| Thrombo-cytopenia | 33.8% | 0% | 3% | 2% | 0% | 0% |
| Hypertension | 8.2% | NR | 0% | 0% | 11.3% | 0% |
| (C) Cost of TEAEs (per event) | ||||||
| Non-medicare | Medicare | |||||
| Unit cost (US$) | Unit cost (US$) | Ref. | ||||
| Anemia¶ | 765§ | 437 | [35] | |||
| Neutropenia¶ | 162§ | 93 | [35] | |||
| Thrombocytopenia¶ | 741§ | 423 | [35] | |||
| Hypertension¶ | 217§ | 124 | [36] | |||
†The market shares are based on market forecasts.
‡Results for niraparib combine both gBRCA and non-gBRCA subpopulations.
§Medicare costs were multiplied by 1.75, representing an average cost proportion of non-Medicare and Medicare services to estimate the cost for the overall population [37].
¶To convert costs from earlier years to the year 2018, an average inflation rate of 3% was applied [38,39].
gBRCAmut: Germline BRCA mutation; NR: Not reported; TEAE: Treatment-emergent adverse event.
Treatment costs
The model included the costs of drugs, routine monitoring, managing TEAEs and subsequent treatment following discontinuation of maintenance treatment.
Drug costs were derived from the wholesale acquisition cost and the average monthly dose. No drug costs were allocated for watch and wait. For all three PARP inhibitors, adverse events can be managed through dose modification (reduction). Since all olaparib and rucaparib tablet strengths are priced the same, the first two dose reductions do not result in a lower cost. For rucaparib, however, a third dose reduction results in a 50% reduction in costs compared with higher doses; yet, it is not clear how many patients required such a dose reduction. In contrast, the cost of niraparib is proportional to the dose administered, and costs are two-thirds and a third that of the starting dose for the first and second dose reduction, respectively. The average dose in the ENGOT-OV16/NOVA trial was 195.6 mg, which is similar to the dose observed in real-world oncology practice (202 mg) [40]. Drug costs per month based on the average dose administered were US$13,168, US$13,886, US$15,922 and US$13,662 for niraparib (200 mg/d), olaparib (600 mg/d), rucaparib (1200 mg/d) and bevacizumab (1200 mg/cycle), respectively [41]. To estimate the total expenditure for payers, the costs per treated patient were multiplied by the number of patients receiving each treatment regimen and summed in both scenarios.
The costs of routine monitoring were based on the annual frequency of resource consumption (e.g., physician visits, monitoring and blood tests) for each patient, which were multiplied by the unit costs of each service based on Current Procedural Terminology codes (i.e., US$74 per physician visit, US$512 per magnetic resonance imaging/computed tomography monitoring and US$10 per blood count) [42–45]. These costs were multiplied by a factor (i.e., 1.75) representing an average cost proportion of non-Medicare and Medicare services to estimate the cost for the overall population [37].
The number of patients receiving niraparib treatment in any given quarter is a function of the number of eligible patients, uptake, attrition and drop off. Data from the ENGOT-OV16/NOVA trial were used to model the attrition and drop off after each quarter for all PARP inhibitors. The attrition and drop-off rate for bevacizumab were derived from a clinical trial [46].
During the first quarter following the discontinuation of initial treatment, patients were assumed to incur the costs associated with chemotherapy. An average monthly cost for postprogression chemotherapy of US$6433 per month [47] was applied to this quarter (converted to the year 2018 cost, based on an average inflation rate of 3%) [38,39].
TEAE rates & TEAE-related costs
Grade 3 and 4 TEAEs with rates greater than 10% reported in published clinical trials were included in the model for each drug regimen. Grade 3 and 4 TEAEs generally occurred in the first quarter after treatment initiation. Therefore, the occurrence rates of TEAEs were multiplied by TEAE-specific costs found in the literature and applied to the first quarter after treatment initiation (Table 1B & C) [33–36,48].
Analysis
Costs were estimated for a plan with an age distribution representative of the overall US population as well as for a Medicare-only plan. Both plans were assumed to cover 1 million lives.
For each scenario, the results were presented as total cost and by type of cost (i.e., drug costs, physician visits and monitoring, TEAEs and subsequent treatment).
A one-way sensitivity analysis was performed by varying each input parameter by ±10%. We also explored range of uptake of niraparib as a proportion of the overall use of PARP inhibitors in the sensitivity analysis.
The potential impact of a third dose reduction in patients treated with rucaparib was tested in a scenario analysis.
Results
Full age distribution
For a hypothetical health plan with an age distribution representative of the US population, the model projected 21 patients per year that are newly eligible for niraparib, olaparib, rucaparib, bevacizumab or watch and wait. Adding newly eligible patients to patients continuing treatment for years 2 and 3 brought the total to 30 and 36 patients, respectively.
Total annual costs (pharmacy and medical) with and without niraparib were calculated. These included costs of monitoring, managing TEAEs, subsequent chemotherapy upon progression and costs associated with bevacizumab treatment.
The difference between the two scenarios, with and without niraparib, was a net cost savings, including both pharmacy and medical costs, of US$78,721, US$276,671 and US$353,585 at years 1, 2 and 3, respectively (Table 2A).
| Year 1 | Year 2 | Year 3 | |||||||
|---|---|---|---|---|---|---|---|---|---|
| Costs (US$) | With niraparib | Without niraparib | Δ | With niraparib | Without niraparib | Δ | With niraparib | Without niraparib | Δ |
| (A) Population representative of the USA | |||||||||
| Drug cost | 859,704 | 941,456 | -81,752 | 2,371,952 | 2,647,756 | -275,804 | 2,956,796 | 3,309,483 | -352,687 |
| Niraparib | 620,039 | 0 | 620,039 | 2,091,800 | 0 | 2,091,800 | 2,674,915 | 0 | 2,674,915 |
| Olaparib | 0 | 326,933 | -326,933 | 0 | 1,102,961 | -1,102,961 | 0 | 1,410,424 | -1,410,424 |
| Rucaparib | 0 | 374,858 | -374,858 | 0 | 1,264,643 | -1,264,643 | 0 | 1,617,178 | -1,617,178 |
| Bevacizumab | 239,666 | 239,666 | 0 | 280,152 | 280,152 | 0 | 281,881 | 281,881 | 0 |
| Monitoring cost | 44,857 | 44,727 | 130 | 93,822 | 93,383 | 439 | 115,827 | 115,266 | 561 |
| TEAE cost | 3909 | 1008 | 2901 | 6628 | 1615 | 5012 | 6909 | 1667 | 5231 |
| Subsequent treatment | 125,934 | 125,934 | 0 | 186,534 | 192,853 | -6,318 | 234,011 | 240,701 | -6,690 |
| Total | 1,034,405 | 1,113,125 | -78,721 | 2,658,936 | 2,935,607 | -276,671 | 3,313,543 | 3,667,128 | -353,585 |
| (B) Medicare-only population | |||||||||
| Drug cost | 3,127,862 | 3,425,300 | -297,439 | 8,629,875 | 9,633,332 | -1,003,457 | 10,757,711 | 12,040,894 | -1,283,183 |
| Niraparib | 2,255,887 | 0 | 2,255,887 | 7,610,598 | 0 | 7,610,598 | 9,732,143 | 0 | 9,732,143 |
| Olaparib | 0 | 1,189,480 | -1,189,480 | 0 | 4,012,903 | -4,012,903 | 0 | 5,131,547 | -5,131,547 |
| Rucaparib | 0 | 1,363,845 | -1,363,845 | 0 | 4,601,152 | -4,601,152 | 0 | 5,883,778 | -5,883,778 |
| Bevacizumab | 871,975 | 871,975 | 0 | 1,019,277 | 1,019,277 | 0 | 1,025,568 | 1,025,568 | 0 |
| Monitoring cost | 93,259 | 92,989 | 270 | 195,058 | 194,146 | 912 | 240,808 | 239,642 | 1166 |
| TEAE cost | 4643 | 1197 | 3445 | 7871 | 1919 | 5952 | 8205 | 1992 | 6212 |
| Subsequent treatment | 261,821 | 261,821 | 0 | 387,810 | 400,946 | -13,136 | 486,516 | 500,424 | -13,909 |
| Total | 3,487,585 | 3,781,307 | -293,723 | 9,220,614 | 10,230,343 | -1,009,729 | 11,493,240 | 12,782,952 | -1,289,712 |
TEAE: Treatment-emergent adverse event.
Medicare plan
For a hypothetical health plan with 1 million Medicare-only (aged ≥65 years) covered lives, the model projected 76 patients eligible per year, growing to 111 patients at year 2 and 130 patients at year 3. The cost savings with niraparib in this population ranged from US$293,723 (year 1) to US$1,289,712 (year 3; Table 2B).
Sensitivity/scenario analysis
One-way sensitivity analysis showed that the prices for niraparib, rucaparib and olaparib and the prevalence of OC in the population were parameters that mainly influenced the outcomes of the budget impact analysis (Figure 2).

Given the lower cost of niraparib at its average dose, switching from either rucaparib or olaparib to niraparib will result in savings to the healthcare budget.
A further sensitivity analysis assessed the degree of projected cost savings as the PARP inhibitor market share varies (Figure 3). The savings were correlated linearly with the market share of niraparib.

In addition, a scenario analysis was performed by taking into account that 15% of all rucaparib-treated patients required a third dose reduction. The ARIEL3 Trial [33] indicated that 54.6% of the population had dose reductions; however, it remains unclear how many of these patients had a third dose modification, as cost reduction is only applicable in those patients. Furthermore, ≥1 serious TEAE was reported in 21% of patients in the rucaparib group. Taking into consideration these findings and other recorded grade 3/4 TEAEs, we assumed that 15% would be a realistic approximation. Upon applying adjusted drug costs (50% lower drug cost) in 15% of rucaparib-treated patients, the total average drug cost per month decreased from US$15,922 to US$14,728 (85% with US$15,922 and 15% with US$7961). With this analysis, the cost savings with niraparib in the population representative of the USA decreased for all 3 years from US$78,721 to US$50,606 at year 1 and from US$353,585 to US$232,297 at year 3. For the Medicare-only population, the net savings decreased from US$293,723 to US$191,434 at year 1 and US$1,289,712 to US$848,429 at year 3.
Discussion
This budget impact analysis was undertaken to understand the financial consequences to health plans for the market entrance of niraparib in the treatment of patients with recurrent OC following complete or partial response to platinum-based chemotherapy. The analysis considered two scenarios, with and without niraparib on the market, and included the costs of drugs, treating drug-specific TEAEs, and subsequent chemotherapy following discontinuation over 3 years.
This model-based analysis of both a population representative of the USA as a whole and a Medicare-only population showed that the greater the use of niraparib relative to other PARP inhibitors (olaparib and rucaparib) the larger the cost savings. The analyses estimated an annual savings of US$78,721 to US$353,585 per million lives covered for a plan with a population representative of the USA and of US$293,723 to US$1,289,712 in the Medicare-only population. When the findings for the Medicare-only population are projected out to all US patients on Medicare, the overall estimated savings to Medicare were US$15, US$51 and US$65 million at years 1, 2 and 3, respectively.
The results of the one-way sensitivity analyses showed that drug price is the main parameter that influences the overall cost. However, the observed cost savings in scenario 1 occur over a wide niraparib price range. The break-even point (i.e., where the total annual costs in scenario 1 and 2 are equal) is at a monthly niraparib cost of US$14,900, which is well above the US$13,168 used in the main analysis.
Continually increasing healthcare expenditures represent a growing burden for societies globally. To allocate resources efficiently, it is increasingly important to analyze the consequences of the launch of new products based on available information. As an option to assess the economic consequences, BIMs have proven to be a valuable analysis tool. Based on the currently available data and plausible assumptions, these models allow an estimation of the expected consequences.
In order to check the certainty of the results obtained, the underlying assumptions were compared with another economic analysis with a comparable patient population [49]. The population size, distribution of gBRCA and non-gBRCA patients and total costs were found to be within a plausible range.
Findings from the underlying analysis show that the adoption of niraparib can lead to cost savings compared with other PARP inhibitors, which are reliable over a wide range of underlying assumptions.
Limitations
The projected uptake of niraparib, as well as the market share of other products, is a key driver of the model results and could vary from plan to plan. Medical management costs are based on Medicare reimbursement rates and were used to calculate the corresponding costs for commercially insured patients by applying a factor that represented an average of various commercial insurers.
Ovarian cancer (OC) is often diagnosed at an advanced stage, associated with a high recurrence rate following first-line treatment and decreasing progression-free survival following each subsequent treatment.
There is a high unmet need for a medication that enables women with recurrent OC to live well for a longer period without disease progression.
PARP inhibitors provide significant clinical benefit to patients with recurrent OC who are in response (partial or complete) to platinum-based chemotherapy.
This budget impact analysis aimed to estimate the financial consequences of the introduction of niraparib, comparing a scenario where all PARP-treated patients receive niraparib versus a scenario where these patients receive one of the other two approved PARP inhibitors.
For a hypothetical health plan of1 million lives, the model projects that using niraparib instead of other PARP inhibitors would result in cost savings of US$78,721, US$276,671 and US$353,585 at years 1, 2 and 3, respectively.
For 1 million lives in a Medicare-only population, the net estimated savings from exclusive niraparib use would be US$293,723, US$1,009,729 and US$1,289,712 at years 1, 2 and 3, respectively.
When the findings for the Medicare-only population are projected out to all US Medicare patients, the overall estimated savings would range from US$15 to US$65 million from year 1 to year 3.
The results of the one-way sensitivity analyses showed that the price of PARP inhibitors is the main parameter with an impact on the overall cost. A scenario analysis that took into account a significant dose and cost reduction in a portion of patients treated with rucaparib has shown that the niraparib-related cost savings are valid over a wide range.
Findings from the underlying analysis show that the adoption of niraparib can lead to cost savings compared with other PARP inhibitors, which are reliable over a wide range of underlying assumptions.
Acknowledgments
Mohan Bala, an employee of TESARO Inc., Waltham, MA, provided conceptual model input and disease-specific information. The authors thank Dianna Bartel and Dena McWain from TESARO Inc., Waltham, MA for the critical review of the manuscript and their valuable input.
Author contributions
Study concept and design of the analysis were contributed by K Neeser, B Harrow, L Stern and WM O'Neil. Data collection, data preparation and data interpretation were conducted by B Harrow, K Travers and K Neeser. Writing of the manuscript was performed by K Neeser and B Harrow. All authors were involved in the revision of the manuscript.
Financial & competing interests disclosure
Funding for this research was contributed by TESARO, Inc. B Harrow and K Travers are employed by TESARO, Inc. K Neeser, W O'Neil, and L Stern are full-time employees of Analytica Laser, a healthcare consulting firm that received funding from TESARO, Inc. to conduct this study. The authors have no other relevant affiliations or financial involvement with any organization or entity with a financial interest in or financial conflict with the subject matter or materials discussed in the manuscript apart from those disclosed.
No writing assistance was utilized in the production of this manuscript.
Ethical conduct of research
All data used to perform this budget impact analysis were derived from published scientific literature, publicly accessible databases or market analysis.
References
Papers of special note have been highlighted as: • of interest; •• of considerable interest
1.
Surveillance Epidemiology and End Results (SEER) Program. SEER stat fact sheets: ovarian cancer (2016). https://seer.cancer.gov/statfacts/html/ovary.html.
• Provides important epidemiological information regarding the incidence of ovarian cancer (OC) in the USA.
2.
Siegel RL, Miller KD, Jemal A. Cancer statistics, 2016. CA Cancer J. Clin. 66(1), 7–30 (2016).
3.
Smith RA, Andrews K, Brooks D et al. Cancer screening in the United States, 2016: a review of current American Cancer Society guidelines and current issues in cancer screening. CA Cancer J. Clin. 66(2), 96–114 (2016).
4.
Ledermann JA, Raja FA, Fotopoulou C, Gonzalez-Martin A, Colombo N, Sessa C. Newly diagnosed and relapsed epithelial ovarian carcinoma: ESMO Clinical Practice Guidelines for diagnosis, treatment and follow-up. Ann. Oncol. 24(Suppl. 6), vi24–vi32 (2013).
5.
National Comprehensive Cancer Network. Ovarian cancer including fallopian tube cancer and primary peritoneal cancer. Version 5 (2017). www.nccn.org/professionals/physician_gls/f_guidelines.asp.
6.
Hanker LC, Loibl S, Burchardi N et al. The impact of second to sixth line therapy on survival of relapsed ovarian cancer after primary taxane/platinum-based therapy. Ann. Oncol. 23(10), 2605–2612 (2012).
7.
McWhinney SR, Goldberg RM, McLeod HL. Platinum neurotoxicity pharmacogenetics. Mol. Cancer Ther. 8(1), 10–16 (2009).
8.
Ozga M, Aghajanian C, Myers-Virtue S et al. A systematic review of ovarian cancer and fear of recurrence. Palliat. Support. Care 13(6), 1771–1780 (2015).
9.
Lord CJ, Ashworth A. The DNA damage response and cancer therapy. Nature 481(7381), 287–294 (2012).
10.
Mirza MR, Monk BJ, Herrstedt J et al. Niraparib maintenance therapy in platinum-sensitive, recurrent ovarian cancer. N. Engl. J. Med. 375(22), 2154–2164 (2016).
•• This article is of particular interest since it describes the clinical benefit and safety of niraparib in patients with platinum-sensitive, recurrent OC regardless of the presence or absence of gBRCA mutations or HRD status.
11.
Wang J, Zhang Z-Y, Mirza MR et al. The exposure–response relationship of niraparib in patients with gBRCAmut and non-gBRCAmut: results from the ENGOT-OV16/NOVA trial. Ann. Oncol. 28(Suppl. 15), abstract 933PD (2017).
12.
National Cancer Institute. Cancer prevalence and cost of care projections. National expenditures for cancer care (2011). www.costprojections.cancer.gov/expenditures.html#.
13.
Mauskopf JA, Sullivan SD, Annemans L et al. Principles of good practice for budget impact analysis: report of the ISPOR Task Force on good research practices–budget impact analysis. Value Health 10(5), 336–347 (2007).
14.
Nuijten MJ, Mittendorf T, Persson U. Practical issues in handling data input and uncertainty in a budget impact analysis. Eur. J. Health Econ. 12(3), 231–241 (2011).
15.
Rosenblatt KA, Weiss NS, Schwartz SM. Incidence of malignant fallopian tube tumors. Gynecol. Oncol. 35(2), 236–239 (1989).
• Provides information to estimate the proportions of patients with primary peritoneal and fallopian tube cancer and nonepithelial OC.
16.
Eltabbakh GH, Piver MS, Natarajan N, Mettlin CJ. Epidemiologic differences between women with extraovarian primary peritoneal carcinoma and women with epithelial ovarian cancer. Obstet. Gynecol. 91(2), 254–259 (1998).
• Provides information to estimate the proportions of patients with primary peritoneal and fallopian tube cancer and nonepithelial OC.
17.
Colombo N, Peiretti M, Castiglione M. Non-epithelial ovarian cancer: ESMO clinical recommendations for diagnosis, treatment and follow-up. Ann. Oncol. 20(Suppl. 4), 24–26 (2009).
• Provides information to estimate the number of patients with nonepithelial OC.
18.
IntrinsiQ Specialty Solutions is an AmerisourceBergen company. IntrinsiQ Medical (2017). www.intrinsiq.com.
• Provides information regarding the total number of patients with recurrent OC who are annually treated with platinum therapy in the USA.
19.
Aghajanian C, Blank SV, Goff BA et al. OCEANS: a randomized, double-blind, placebo-controlled Phase III trial of chemotherapy with or without bevacizumab in patients with platinum-sensitive recurrent epithelial ovarian, primary peritoneal, or fallopian tube cancer. J. Clin. Oncol. 30(17), 2039–2045 (2012).
20.
del Carmen MG, Micha J, Small L, Street DG, Londhe A, McGowan T. A Phase II clinical trial of pegylated liposomal doxorubicin and carboplatin plus bevacizumab in patients with platinum-sensitive recurrent ovarian, fallopian tube, or primary peritoneal cancer. Gynecol. Oncol. 126(3), 369–374 (2012).
21.
DuBois RN. Leukotriene A4 signaling, inflammation, and cancer. J. Natl Cancer Inst. 95(14), 1028–1029 (2003).
22.
McGonigle KF, Muntz HG, Vuky JL et al. Phase II prospective study of weekly topotecan and bevacizumab in platinum refractory ovarian cancer or peritoneal cancer (OC) [abstract]. J. Clin. Oncol. 26(15 Suppl.), 5551 (2008).
23.
Parmar MK, Ledermann JA, Colombo N et al. Paclitaxel plus platinum-based chemotherapy versus conventional platinum-based chemotherapy in women with relapsed ovarian cancer: the ICON4/AGO-OVAR-2.2 trial. Lancet 361(9375), 2099–2106 (2003).
24.
Perren TJ, Swart AM, Pfisterer J et al. A Phase III trial of bevacizumab in ovarian cancer. N. Engl. J. Med. 365(26), 2484–2496 (2011).
25.
Pfisterer J, Plante M, Vergote I et al. Gemcitabine plus carboplatin compared with carboplatin in patients with platinum-sensitive recurrent ovarian cancer: an intergroup trial of the AGO-OVAR, the NCIC CTG, and the EORTC GCG. J. Clin. Oncol. 24(29), 4699–4707 (2006).
26.
Pujade-Lauraine E, Hilpert F, Weber B et al. Bevacizumab combined with chemotherapy for platinum-resistant recurrent ovarian cancer: the AURELIA open-label randomized Phase III trial. J. Clin. Oncol. 32(13), 1302–1308 (2014).
27.
Pujade-Lauraine E, Wagner U, Aavall-Lundqvist E et al. Pegylated liposomal doxorubicin and carboplatin compared with paclitaxel and carboplatin for patients with platinum-sensitive ovarian cancer in late relapse. J. Clin. Oncol. 28(20), 3323–3329 (2010).
28.
Central Intelligence Agency. The world factbook. United States (2017). www.cia.gov/library/publications/the-world-factbook/geos/us.html.
29.
Flatiron. Life sciences - Real world evidence (2018). https://flatiron.com/real-world-evidence/.
30.
ZEJULA (niraparib): US prescribing information. TESARO, Inc., MA, USA (2018).
31.
Institute for Clinical and Economic Review. Poly ADP-ribose polymerase (PARP) inhibitors for ovarian cancer: effectiveness and value (Final Evidence Report) (2017). https://icer-review.org/wp-content/uploads/2017/02/MWCEPAC_OVARIAN_EVIDENCE_REPORT_08302017.pdf.
32.
Pujade-Lauraine E, Ledermann JA, Selle F et al. Olaparib tablets as maintenance therapy in patients with platinum-sensitive, relapsed ovarian cancer and a BRCA1/2 mutation (SOLO2/ENGOT-Ov21): a double-blind, randomised, placebo-controlled, Phase III trial. Lancet Oncol. 18(9), 1274–1284 (2017).
33.
Coleman RL, Oza AM, Lorusso D et al. Rucaparib maintenance treatment for recurrent ovarian carcinoma after response to platinum therapy (ARIEL3): a randomised, double-blind, placebo-controlled, Phase III trial. Lancet 390(10106), 1949–1961 (2017).
34.
Selle F, Emile G, Pautier P et al. Safety of bevacizumab in clinical practice for recurrent ovarian cancer: a retrospective cohort study. Oncol. Lett. 11(3), 1859–1865 (2016).
35.
Rashid N, Koh HA, Baca HC, Lin KJ, Malecha SE, Masaquel A. Economic burden related to chemotherapy-related adverse events in patients with metastatic breast cancer in an integrated health care system. Breast Cancer (Dove Med. Press) 8, 173–181 (2016).
36.
Billir SP, Ma Q, Zhao Z, Wehler E, Munakata J, Barber B. Economic burden of toxicities associated with treating metastatic melanoma in the United States. Am. Health Drug Benefits 9(4), 203–213 (2016).
37.
Medicare Payment Advisory Commission. Reports to the Congress: medicare payment policy (2016). www.medpac.gov/docs/default-source/reports/mar14_entirereport.pdf?sfvrsn=0.
38.
Bureau of Labor Statistics. Medical care in U.S. city average, all urban consumers (2018). https://beta.bls.gov/dataViewer/view/timeseries/CUUR0000SAM;jsessionid=2B621731CE14B5CE3A54B5F3F7F1CB8B.
39.
FORECASTCHART. US Medical Care Cost Inflation. Inflation rate for all urban consumers: medical Care - 5 year history (2018). http://forecast-chart.com/inflation-medical-care-cost.html.
40.
Parpos P, Bala M. Comparison of dose intensity in clinical trial and real-world settings for niraparib. Presented at: ISPOR 2018 Congress. Baltimore, MD, USA, 19–23 May 2018.
41.
Micromedex Solution. RedBook online (2018). www.micromedexsolutions.com/home/dispatch.
42.
CPT code 72197 (Magnetic resonance imaging [MRI]) (2017). www.findacode.com/.
43.
CPT code 85025 (Blood count complete [CBC]) (2018). www.findacode.com/.
44.
CPT code 99307 (Nursing facility care) (2017). www.findacode.com/.
45.
CPT code 99213 (Office or other outpatient visit) (2017). www.findacode.com/.
46.
Burger RA, Sill MW, Monk BJ, Greer BE, Sorosky JI. Phase II trial of bevacizumab in persistent or recurrent epithelial ovarian cancer or primary peritoneal cancer: a Gynecologic Oncology Group Study. J. Clin. Oncol. 25(33), 5165–5171 (2007).
47.
Barnett JC, Alvarez SA, Cohn DE, Leath CA III, Myers ER, Havrilesky LJ. Cost effectiveness of alternative strategies for incorporating bevacizumab into the primary treatment of ovarian cancer. Cancer 119(20), 3653–3661 (2013).
48.
Ledermann JA. ARIEL3: a Phase III, randomized, double-blind study of rucaparib vs placebo following response to platinum-based chemotherapy for recurrent ovarian carcinoma (OC). Presented at: ESMO 2017 Congress. Madrid, Spain, 8–12 September 2017.
49.
Smith HJ, Walters Haygood CL, Arend RC, Leath CA III, Straughn JM Jr. PARP inhibitor maintenance therapy for patients with platinum-sensitive recurrent ovarian cancer: a cost-effectiveness analysis. Gynecol. Oncol. 139(1), 59–62 (2015).
Information & Authors
Information
Published In
Copyright
© 2019 Future Medicine Ltd.
History
Received: 13 July 2018
Accepted: 22 February 2019
Published online: 2 April 2019
Keywords:
Topics
Authors
Metrics & Citations
Metrics
Article Usage
Article usage data only available from February 2023. Historical article usage data, showing the number of article downloads, is available upon request.
Citations
How to Cite
Budget impact of niraparib as maintenance treatment in recurrent ovarian cancer following platinum-based chemotherapy. (2019) Journal of Comparative Effectiveness Research. DOI: 10.2217/cer-2018-0069
Export citation
Select the citation format you wish to export for this article or chapter.
Citing Literature
- Miguel Angel Rodríguez Sagrado, Javier Alvarez Criado, Ainhoa Elisa Arenaza Peña, Vicente Escudero-Vilaplana, Carlos Folguera Olias, Marta Herrero Fernandez, Concepción Martinez Nieto, Ana Rosa Rubio Salvador, Patricia Sanmartin Fenollera, Maria José Vazquez Castillo, Niraparib Maintenance Therapy in Patients with Platinum-Sensitive Recurrent Ovarian Cancer: Real-World Experience at Hospitals in Spain, Targeted Oncology, 10.1007/s11523-024-01121-5, 20, 2, (319-327), (2025).
- Yue Ma, Yuxin Li, Aixia Ma, Hongchao Li, Is the Scope of Costs Considered in Budget Impact Analyses for Anticancer Drugs Rational? A Systematic Review and Comparative Study, Frontiers in Public Health, 10.3389/fpubh.2021.777199, 9, (2021).
- Jinan Liu, Carol Hawkes, Lydia Walder, Chloe Spalding, Karin Travers, Eric M Maiese, Jean Hurteau, Budget impact analysis of niraparib for first-line maintenance therapy in advanced ovarian cancer from a US payer perspective, Journal of Managed Care & Specialty Pharmacy, 10.18553/jmcp.2021.27.10.1377, 27, 10, (1377-1387), (2021).
- Katrine Wallace, Kelly Adamski, Ashwini Pai, Darya Rose, Anita Chawla, The Budget Impact of Including Rucaparib on a US Payer Formulary for the Treatment of Patients with Metastatic Ovarian Cancer, PharmacoEconomics, 10.1007/s40273-020-00970-y, 39, 2, (231-241), (2020).